Multilevel/Mixed Models and Longitudinal Analysis Using Stata
|
|
|
- Chester Gray
- 6 years ago
- Views:
Transcription
1 Multilevel/Mixed Models and Longitudinal Analysis Using Stata Isaac J. Washburn PhD Research Associate Oregon Social Learning Center Summer Workshop Series July 2010 Longitudinal Analysis 1
2 Longitudinal Example A child s growth in weight Variables id: child s id weight: child s weight in Kg age: child s age in years male: 1 male; 0 female 2 Plot of Growth Trajectories by Gender Looking for possible random intercept and slope As well as any functional form *plot observed growth trajectories sort id age graph twoway (line weight age, /// connect(ascending)), by(male) /// xtitle(age in years) ytitle(weight in Kg) 3 2
3 4 Steps for Estimating the Model Unconditional Means Model (Singer and Willett, 2003) Get ICC Random Intercept Model Allow for the intercept to vary across individuals See General Growth Pattern Random Coefficient Model (also called a Random Intercept and Slope Model or Unconditional Growth Model) Allow intercept and slope to vary across individuals 5 3
4 Unconditional Means Model This model will allow us to get an idea of the dependence of our observations * Unconditional Means Model xtmixed weight id:, mle 6 7 4


5 Intra-Class Correlation 8 Random Intercept Model xtmixed weight age age2 id:,cov(un) mle 9 5
 = 78.07, p <.001 The standard deviation for the intercept (_cons) is.92.")
6 10 Results-Random Intercept Model The children are estimated to be 3.43Kg at the start. They grow linearly at 7.82Kg per year, but the quadratic dampens this with an effect of -1.71Kg. This model does much better than a linear regression model, 2 (3) = 78.07, p <.001 The standard deviation for the intercept (_cons) is.92. This is huge, 95% of the intercepts for the children are within 1.84 kg of the intercept of This is quite a range. 11 6
7 Random Coefficient Model xtmixed weight age age2 id:age,cov(un) mle


8 Results Random Coefficient Model The estimates for the growth don t change much, but there is substantial variance for the slope of age). Although the slope for age and the intercept are correlated, r =.275, this correlation is not significantly different from zero. We could remove the unstructured covariance matrix. (I tried this and it didn t seem to matter much). To have a true statistical test of model differences we use the log-likelihood test 14 Quick Comment on Covariance 4 possible covariance structures in Stata Independent Separate Estimate for each random effect and all pairwise covariances are set to zero. Exchangeable Single Estimate for each random effect and a single estimate for all pairwise covariances. Identity Single Estimate for each random effect and all pairwise covariances are set to zero. Unstructured Every random effect and pairwise covariance is estimated separately 15 8
9 Log-Likelihood Test *Log-likelihood Test quietly:xtmixed weight age age2 id:, mle cov(un) estimates store intercept quietly:xtmixed weight age age2 id: age, cov (un) mle estimates store slope lrtest intercept slope Likelihood-ratio test LR chi2(2) = (Assumption: intercept nested in slope) Prob > chi2 = Note: The reported degrees of freedom assumes the null hypothesis is not on the boundary of the parameter space. If this is not true, then the reported test is conservative. 16 Graph of Results 17 9
10 Graph of Results-Continued 18 Graph of Results-Continued 19 10
11 Graphs-Stata Commands Fitted Results only predict pred twoway (line pred age, sort connect(asscending)) Fitted Results and Individual Results predict fitted, fitted twoway (connected fitted age, lwidth(thin) /// lpattern(dash) connect(ascending)) (line pred /// age, sort lcolor(green) lwidth(thick) /// lpattern(solid) connect(ascending)) twoway (connected fitted age in 1/30, /// lpattern(dash) connect(ascending)) (line pred /// age, sort lcolor(green) lwidth(thick) /// lpattern(solid) connect(ascending)) 20 Adding a Time-Invariant Covariate We have several possible models: We could have a random slope model where girls and boys differ only on their intercept. We could have a random coefficient model where the intercept varies not only by child, but also by gender. We could also have an interaction between gender and age and age


12 Results-Time invariant Covariant, No Random Coefficient 22 Results-Time invariant Covariant, Random Coefficient 23 12
 = 1.09 (Assumption:invar nested in invarr) Prob > chi2 = 0.")
13 Log-Likelihood Test xtmixed weight age age2 male id:age,cov(unstr) mle estimates store invar xtmixed weight age age2 male id:age male, cov(unstr) mle estimates store invarr lrtest invar invarr Likelihood-ratio test LR chi2(3) = 1.09 (Assumption:invar nested in invarr) Prob > chi2 = Note: The reported degrees of freedom assumes the null hypothesis is not on the boundary of the parameter space. If this is not true, then the reported test is conservative. 24 Factors in Stata 25 13
 mle estimates store inter lrtest invar inter Likelihood-ratio test LR chi2(2) = 3.39 (Assumption: invar nested in inter) Prob > chi2 = 0.")
14 Results-Time invariant Covariant, Interaction 26 Log-Likelihood Test xtmixed weight age age2 male id: age, cov(unstr) mle estimates store invar xtmixed weight c.age##c.age##c.male id: age, cov (unstr) mle estimates store inter lrtest invar inter Likelihood-ratio test LR chi2(2) = 3.39 (Assumption: invar nested in inter) Prob > chi2 =

15 Adding a Time-Varying Covariate We have several possible models: We could have a random intercept model We could have a interaction between gender and being sick We could have a random coefficient model 28 Results-Time invariant Covariant, No Random Coefficient 29 15
 mle estimates store sick_inter lrtest sick sick_inter Likelihood-ratio test LR chi2(1) = 0.")
16 Results-Time invariant Covariant, Interaction 30 Log-Likelihood Test *Random Slope Model xtmixed weight age age2 male sick id: age, cov(unstr) mle estimates store sick *Interaction between gender and sick xtmixed weight age age2 c.male##c.sick id: age, cov (unstr) mle estimates store sick_inter lrtest sick sick_inter Likelihood-ratio test LR chi2(1) = 0.71 (Assumption: sick nested in sick_inter) Prob > chi2 =
 mle estimates store sick_rand lrtest sick sick_rand Likelihood-ratio test LR chi2(3) = 10.")
17 Results-Time invariant Covariant, Random Coefficient 32 Log-Likelihood Test *Random Slope Model xtmixed weight age age2 male sick id: age, cov(unstr) mle estimates store sick *Check if sick has a random component xtmixed weight age age2 male sick id: age sick, cov (unstr) mle estimates store sick_rand lrtest sick sick_rand Likelihood-ratio test LR chi2(3) = (Assumption: sick nested in sick_rand) Prob > chi2 =
 year: year of interview year2: year squared Level 2 individuals id: identifier for")
18 3-level model. Early Years of Marriage Project Level 1 observations across time happy: variable for marital happiness (y ijk ) year: year of interview year2: year squared Level 2 individuals id: identifier for individuals (j) gender: gender of individual educ: number of years of education age: age of participate at first interview Level 3 Family couple: identifies couples (k) race: with no interracial marriages this is either black or white for the couple kids: dummy for having kids under age 12 m_income: household income income_diff: difference between spouse s incomes educ_diff: difference between spouse s education age_diff: difference between spouse s age 34 Data Structure 35 18

19 A OLS Regression This regression ignores all of the dependences in the data. 36 Multilevel Test of Different models *Model a, full model xtmixed hap year year2 gender race kids age /// age_diff educ educ_diff m_income /// income_diff if use == 0 couple: /// id:year,var mle cov(un) estat ic estimates store a *Model b, remove non-significant covariates xtmixed hap year year2 gender race kids /// age_diff educ m_income if use == 0 /// couple: id:year,var mle cov(un) estat ic estimates store b lrtest a b 37 19


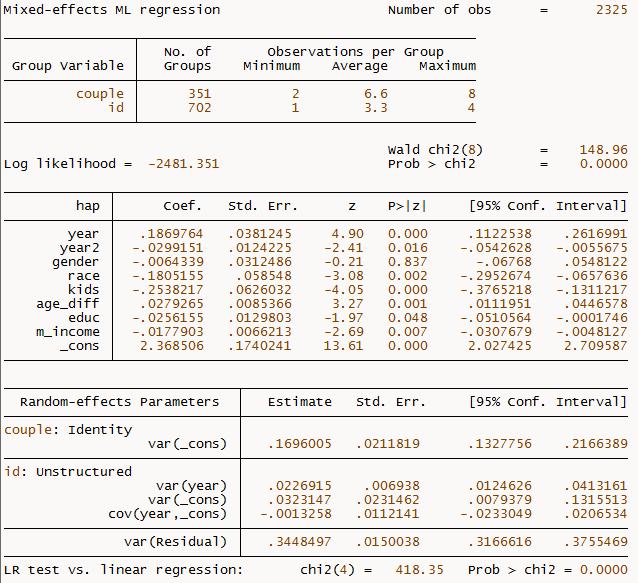
20 Model A 38 Model B 39 20
 estat ic estimates store c lrtest b c *Model d, Remove Gender BY Year^2 Interaction xtmixed hap c.gender##c.")
21 Multilevel Test of Different models *Model c, Add Gender by Year and Gender BY Year^2 Interaction xtmixed hap c.gender##c.year##c.year race /// kids age_diff educ m_income if use == 0 /// couple: id:year,var mle cov(un) estat ic estimates store c lrtest b c *Model d, Remove Gender BY Year^2 Interaction xtmixed hap c.gender##c.year year2 race /// kids age_diff educ m_income if use == 0 /// couple: id:year,var mle cov(un) estat ic estimates store d lrtest b d 40 Model C 41 21

22 Model D Choosing a Model-Information obtained from estst and lrtest Model A Model B Model C Model D Obs Log-likelihood df AIC BIC Adding to or Taking From Model Likelihood-Ratio test df p A vs B Taking B vs C Add B vs D Add
23 Graphical Results of Model D, by Gender 44 Graphical Results of Model D, by Kids 45 23
24 Stata Commands predict path twoway (qfit path year if gender==0) (qfit path year if gender==1), ytitle(predicted Martial Happiness) xtitle(year) legend(order(1 "Female" 2 "Male")) twoway (qfit path year if kids==0) (qfit path year if kids==1), ytitle (Predicted Martial Happiness) xtitle (Year) legend(order(1 "No Young Kids" 2 "Young Kids")) 46 Logistic Multilevel Models Both Cross-Sectional and Longitudinal Same Basic Structure as Regression Multilevel Models Just using Logistic instead of OLS Examples Cross-Sectional: Immunization Longitudinal: Limit Breaking and Parenting Style 47 24


25 Data Structure 48 Simple Logistic 49 25


26 Same Model in Multilevel 50 Odds Ratios 51 26
27 Results Dad s having some education has an odds ratio of The odds a child will be immunized are 55% greater [(OR -1) 100] if the father has some education. This is stronger than the effect for mothers. The effect of proportion indigenous is tricky to interpret. The odds ratio is a bit misleading as this variable is ranges from 0 to 1 and you would be comparing a community with no indigenous people to one that was 100% indigenous. The mean of pcind81 is.467 and the SD is.375. One useful way of seeing the effect of a continuous variable like this is to see what a one standard deviation change (.375) would be as an odds ratio. di exp(.375* ) Thus, a one standard deviation change in the proportion indigenous reduces the odds of a child having immunization by 37% [(1 OR) 100]. Whether you use, 1.0, one SD, or something else is subjective. Doing this it is fair to say that rural has a bigger effect since a rural community has an odds ratio that is.429, reducing the odds by 57%. 52 Limit Breaking-NLSY Predict youth reported limit breaking with mother s parenting style and risk of physical violence in the home. Parenting style is a categorical variable describing the mother s parenting style as uninvolved, permissive, authoritarian, or authoritative. Risk of physical violence in the home is a generic scale that is transformed to run from 0 to 10, with more risk as you get closer to 10 We also control for age of the youth 53 27

28 Graph of Limit Breaking by Style 54 Simple Logistic Regression for wave

*1=31")


29 Longitudinal Structure 2677*3=8031 ( )*2=1722 (17+14)*1= = Multilevel Analysis-Odds Ratios Why the Difference? FIML allows for use of information from dependent variable but not independent 57 29
30 Predicted Probabilities by Style 58 Randomized trial Example Evaluation of school-based intervention Done in high-risk elementary schools in the Hawai`i school district Five Waves of data with a total of 7,347 observations from 2,646 children distributed over 20 schools, with an average of 2.8 waves of data for each student 59 30
31 3 Level Random Intercept Model Condition (0=Control, 1=Treatment) Gender (0=Girl, 1=Boy) Cohort (0 = 2 nd grade in Wave 1, 1=1 st grade in Wave 1) 60 First more on Intra-Class Correlation In the three level model, there is not a single ICC, but rather several possible. We will discuss two: Proportion of Variance between Schools Proportion of Variance between Scores 61 31
32 Unconditional Means Model 62 Two Possible Intraclass Correlations. *Finding the ICC. *Proportion of Variance due to school membership. dis ( )/( ) *Proportion of Variance due to children within same school. dis ( )/( )
 Quadratic effect (year 2 by condition) To get the affect of condition at any one wave you need all three. The comparison is the intercept, year effect, and the quadratic effect) 65 33")
33 Full Model Results 64 The Time BY Condition Interactions The effect of condition is split into three pieces here 1) Main effect (effect on intercept) 2) Linear effect (year by condition) 3) Quadratic effect (year 2 by condition) To get the affect of condition at any one wave you need all three. The comparison is the intercept, year effect, and the quadratic effect) 65 33
34 66 Stata Command for Graph twoway (qfit path y if cond==1 & boy==0) /// (qfit path y if cond==0 & boy==0) /// (qfit path y if cond==1 & boy==1) /// (qfit path y if cond==0 & boy==1), /// ytitle(percent of Maximum Possible) /// xtitle(year) /// title(estimated Change in Positive Behavior) /// subtitle(student Reports) /// legend(order(1 "PA Group Girls" /// 2 "Control Group Girls" 3 "PA Group Boys" /// 4 "Control Group Boys")) ylabel(#5) 67 34
35 Full Commands In 2010_SIRM_july_15,afternoon.do Used the following datasets asian.dta couple1234v4.dta guatemala.dta LimitsV2.dta hawaii.dta 68 35
Categorical and Zero Inflated Growth Models
 Categorical and Zero Inflated Growth Models Alan C. Acock* Summer, 2009 *Alan C. Acock, Department of Human Development and Family Sciences, Oregon State University, Corvallis OR 97331 (alan.acock@oregonstate.edu).
Lecture (chapter 13): Association between variables measured at the interval-ratio level
: Association between variables measured at the interval-ratio level") Lecture (chapter 13): Association between variables measured at the interval-ratio level Ernesto F. L. Amaral April 9 11, 2018 Advanced Methods of Social Research (SOCI 420) Source: Healey, Joseph F. 2015.
Lecture (chapter 13): Association between variables measured at the interval-ratio level Ernesto F. L. Amaral April 9 11, 2018 Advanced Methods of Social Research (SOCI 420) Source: Healey, Joseph F. 2015.
Introducing Generalized Linear Models: Logistic Regression
 Ron Heck, Summer 2012 Seminars 1 Multilevel Regression Models and Their Applications Seminar Introducing Generalized Linear Models: Logistic Regression The generalized linear model (GLM) represents and
Hierarchical Generalized Linear Models. ERSH 8990 REMS Seminar on HLM Last Lecture!
 Hierarchical Generalized Linear Models ERSH 8990 REMS Seminar on HLM Last Lecture! Hierarchical Generalized Linear Models Introduction to generalized models Models for binary outcomes Interpreting parameter
Ron Heck, Fall Week 8: Introducing Generalized Linear Models: Logistic Regression 1 (Replaces prior revision dated October 20, 2011)
") Ron Heck, Fall 2011 1 EDEP 768E: Seminar in Multilevel Modeling rev. January 3, 2012 (see footnote) Week 8: Introducing Generalized Linear Models: Logistic Regression 1 (Replaces prior revision dated October
Ron Heck, Fall 2011 1 EDEP 768E: Seminar in Multilevel Modeling rev. January 3, 2012 (see footnote) Week 8: Introducing Generalized Linear Models: Logistic Regression 1 (Replaces prior revision dated October
Outline. Linear OLS Models vs: Linear Marginal Models Linear Conditional Models. Random Intercepts Random Intercepts & Slopes
 Lecture 2.1 Basic Linear LDA 1 Outline Linear OLS Models vs: Linear Marginal Models Linear Conditional Models Random Intercepts Random Intercepts & Slopes Cond l & Marginal Connections Empirical Bayes
Recent Developments in Multilevel Modeling
 Recent Developments in Multilevel Modeling Roberto G. Gutierrez Director of Statistics StataCorp LP 2007 North American Stata Users Group Meeting, Boston R. Gutierrez (StataCorp) Multilevel Modeling August
Lab 11. Multilevel Models. Description of Data
 Lab 11 Multilevel Models Henian Chen, M.D., Ph.D. Description of Data MULTILEVEL.TXT is clustered data for 386 women distributed across 40 groups. ID: 386 women, id from 1 to 386, individual level (level
Introduction to Within-Person Analysis and RM ANOVA
 Introduction to Within-Person Analysis and RM ANOVA Today s Class: From between-person to within-person ANOVAs for longitudinal data Variance model comparisons using 2 LL CLP 944: Lecture 3 1 The Two Sides
Longitudinal Data Analysis Using Stata Paul D. Allison, Ph.D. Upcoming Seminar: May 18-19, 2017, Chicago, Illinois
 Longitudinal Data Analysis Using Stata Paul D. Allison, Ph.D. Upcoming Seminar: May 18-19, 217, Chicago, Illinois Outline 1. Opportunities and challenges of panel data. a. Data requirements b. Control
Lecture 3.1 Basic Logistic LDA
 y Lecture.1 Basic Logistic LDA 0.2.4.6.8 1 Outline Quick Refresher on Ordinary Logistic Regression and Stata Women s employment example Cross-Over Trial LDA Example -100-50 0 50 100 -- Longitudinal Data
Review of CLDP 944: Multilevel Models for Longitudinal Data
 Review of CLDP 944: Multilevel Models for Longitudinal Data Topics: Review of general MLM concepts and terminology Model comparisons and significance testing Fixed and random effects of time Significance
Lecture 3: Multiple Regression. Prof. Sharyn O Halloran Sustainable Development U9611 Econometrics II
 Lecture 3: Multiple Regression Prof. Sharyn O Halloran Sustainable Development Econometrics II Outline Basics of Multiple Regression Dummy Variables Interactive terms Curvilinear models Review Strategies
Introduction and Background to Multilevel Analysis
 Introduction and Background to Multilevel Analysis Dr. J. Kyle Roberts Southern Methodist University Simmons School of Education and Human Development Department of Teaching and Learning Background and
SAS Code for Data Manipulation: SPSS Code for Data Manipulation: STATA Code for Data Manipulation: Psyc 945 Example 1 page 1
 Psyc 945 Example page Example : Unconditional Models for Change in Number Match 3 Response Time (complete data, syntax, and output available for SAS, SPSS, and STATA electronically) These data come from
Random Intercept Models
 Random Intercept Models Edps/Psych/Soc 589 Carolyn J. Anderson Department of Educational Psychology c Board of Trustees, University of Illinois Spring 2019 Outline A very simple case of a random intercept
Subject-specific observed profiles of log(fev1) vs age First 50 subjects in Six Cities Study
 vs age First 50 subjects in Six Cities Study") Subject-specific observed profiles of log(fev1) vs age First 50 subjects in Six Cities Study 1.4 0.0-6 7 8 9 10 11 12 13 14 15 16 17 18 19 age Model 1: A simple broken stick model with knot at 14 fit with
Subject-specific observed profiles of log(fev1) vs age First 50 subjects in Six Cities Study 1.4 0.0-6 7 8 9 10 11 12 13 14 15 16 17 18 19 age Model 1: A simple broken stick model with knot at 14 fit with
Lecture 7: OLS with qualitative information
 Lecture 7: OLS with qualitative information Dummy variables Dummy variable: an indicator that says whether a particular observation is in a category or not Like a light switch: on or off Most useful values:
Multilevel Modeling Day 2 Intermediate and Advanced Issues: Multilevel Models as Mixed Models. Jian Wang September 18, 2012
 Multilevel Modeling Day 2 Intermediate and Advanced Issues: Multilevel Models as Mixed Models Jian Wang September 18, 2012 What are mixed models The simplest multilevel models are in fact mixed models:
Time Invariant Predictors in Longitudinal Models
 Time Invariant Predictors in Longitudinal Models Longitudinal Data Analysis Workshop Section 9 University of Georgia: Institute for Interdisciplinary Research in Education and Human Development Section
REVIEW 8/2/2017 陈芳华东师大英语系
 REVIEW Hypothesis testing starts with a null hypothesis and a null distribution. We compare what we have to the null distribution, if the result is too extreme to belong to the null distribution (p
08/09/2014. Growth Curve Models. Prf. José Fajardo FGV/EBAPE. Modelling Individual Growth. Cross-Sectional Data
 Growth Curve Models Prf. José Fajardo FGV/EBAPE Modelling Individual Growth Cross-Sectional Data 1 Panel Data Estimation of Growth Curves Example: Cubic POLS Growth Curve Example: Cubic POLS Growth Curve
Ron Heck, Fall Week 3: Notes Building a Two-Level Model
 Ron Heck, Fall 2011 1 EDEP 768E: Seminar on Multilevel Modeling rev. 9/6/2011@11:27pm Week 3: Notes Building a Two-Level Model We will build a model to explain student math achievement using student-level
Designing Multilevel Models Using SPSS 11.5 Mixed Model. John Painter, Ph.D.
 Designing Multilevel Models Using SPSS 11.5 Mixed Model John Painter, Ph.D. Jordan Institute for Families School of Social Work University of North Carolina at Chapel Hill 1 Creating Multilevel Models
Time-Invariant Predictors in Longitudinal Models
 Time-Invariant Predictors in Longitudinal Models Today s Class (or 3): Summary of steps in building unconditional models for time What happens to missing predictors Effects of time-invariant predictors
Lecture 4: Generalized Linear Mixed Models
 Dankmar Böhning Southampton Statistical Sciences Research Institute University of Southampton, UK S 3 RI, 11-12 December 2014 An example with one random effect An example with two nested random effects
Example 7b: Generalized Models for Ordinal Longitudinal Data using SAS GLIMMIX, STATA MEOLOGIT, and MPLUS (last proportional odds model only)
") CLDP945 Example 7b page 1 Example 7b: Generalized Models for Ordinal Longitudinal Data using SAS GLIMMIX, STATA MEOLOGIT, and MPLUS (last proportional odds model only) This example comes from real data
CLDP945 Example 7b page 1 Example 7b: Generalized Models for Ordinal Longitudinal Data using SAS GLIMMIX, STATA MEOLOGIT, and MPLUS (last proportional odds model only) This example comes from real data
Stat 579: Generalized Linear Models and Extensions
 Stat 579: Generalized Linear Models and Extensions Linear Mixed Models for Longitudinal Data Yan Lu April, 2018, week 12 1 / 34 Correlated data multivariate observations clustered data repeated measurement
Additional Notes: Investigating a Random Slope. When we have fixed level-1 predictors at level 2 we show them like this:
 Ron Heck, Summer 01 Seminars 1 Multilevel Regression Models and Their Applications Seminar Additional Notes: Investigating a Random Slope We can begin with Model 3 and add a Random slope parameter. If
Longitudinal Data Analysis of Health Outcomes
 Longitudinal Data Analysis of Health Outcomes Longitudinal Data Analysis Workshop Running Example: Days 2 and 3 University of Georgia: Institute for Interdisciplinary Research in Education and Human Development
Step 2: Select Analyze, Mixed Models, and Linear.
 Example 1a. 20 employees were given a mood questionnaire on Monday, Wednesday and again on Friday. The data will be first be analyzed using a Covariance Pattern model. Step 1: Copy Example1.sav data file
Lab 3: Two levels Poisson models (taken from Multilevel and Longitudinal Modeling Using Stata, p )
") Lab 3: Two levels Poisson models (taken from Multilevel and Longitudinal Modeling Using Stata, p. 376-390) BIO656 2009 Goal: To see if a major health-care reform which took place in 1997 in Germany was
Lab 3: Two levels Poisson models (taken from Multilevel and Longitudinal Modeling Using Stata, p. 376-390) BIO656 2009 Goal: To see if a major health-care reform which took place in 1997 in Germany was
5. Let W follow a normal distribution with mean of μ and the variance of 1. Then, the pdf of W is
 Practice Final Exam Last Name:, First Name:. Please write LEGIBLY. Answer all questions on this exam in the space provided (you may use the back of any page if you need more space). Show all work but do
Time-Invariant Predictors in Longitudinal Models
 Time-Invariant Predictors in Longitudinal Models Topics: Summary of building unconditional models for time Missing predictors in MLM Effects of time-invariant predictors Fixed, systematically varying,
A Journey to Latent Class Analysis (LCA)
") A Journey to Latent Class Analysis (LCA) Jeff Pitblado StataCorp LLC 2017 Nordic and Baltic Stata Users Group Meeting Stockholm, Sweden Outline Motivation by: prefix if clause suest command Factor variables
A Journey to Latent Class Analysis (LCA) Jeff Pitblado StataCorp LLC 2017 Nordic and Baltic Stata Users Group Meeting Stockholm, Sweden Outline Motivation by: prefix if clause suest command Factor variables
Class Notes: Week 8. Probit versus Logit Link Functions and Count Data
 Ronald Heck Class Notes: Week 8 1 Class Notes: Week 8 Probit versus Logit Link Functions and Count Data This week we ll take up a couple of issues. The first is working with a probit link function. While
In Class Review Exercises Vartanian: SW 540
 In Class Review Exercises Vartanian: SW 540 1. Given the following output from an OLS model looking at income, what is the slope and intercept for those who are black and those who are not black? b SE
Description Remarks and examples Reference Also see
 Title stata.com example 38g Random-intercept and random-slope models (multilevel) Description Remarks and examples Reference Also see Description Below we discuss random-intercept and random-slope models
An Introduction to Multilevel Models. PSYC 943 (930): Fundamentals of Multivariate Modeling Lecture 25: December 7, 2012
: Fundamentals of Multivariate Modeling Lecture 25: December 7, 2012") An Introduction to Multilevel Models PSYC 943 (930): Fundamentals of Multivariate Modeling Lecture 25: December 7, 2012 Today s Class Concepts in Longitudinal Modeling Between-Person vs. +Within-Person
An Introduction to Multilevel Models PSYC 943 (930): Fundamentals of Multivariate Modeling Lecture 25: December 7, 2012 Today s Class Concepts in Longitudinal Modeling Between-Person vs. +Within-Person
Longitudinal Data Analysis
 Longitudinal Data Analysis Mike Allerhand This document has been produced for the CCACE short course: Longitudinal Data Analysis. No part of this document may be reproduced, in any form or by any means,
Overview. Overview. Overview. Specific Examples. General Examples. Bivariate Regression & Correlation
 Bivariate Regression & Correlation Overview The Scatter Diagram Two Examples: Education & Prestige Correlation Coefficient Bivariate Linear Regression Line SPSS Output Interpretation Covariance ou already
MULTILEVEL MODELS. Multilevel-analysis in SPSS - step by step
 MULTILEVEL MODELS Multilevel-analysis in SPSS - step by step Dimitri Mortelmans Centre for Longitudinal and Life Course Studies (CLLS) University of Antwerp Overview of a strategy. Data preparation (centering
STAT 5500/6500 Conditional Logistic Regression for Matched Pairs
 STAT 5500/6500 Conditional Logistic Regression for Matched Pairs Motivating Example: The data we will be using comes from a subset of data taken from the Los Angeles Study of the Endometrial Cancer Data
Group Comparisons: Differences in Composition Versus Differences in Models and Effects
 Group Comparisons: Differences in Composition Versus Differences in Models and Effects Richard Williams, University of Notre Dame, https://www3.nd.edu/~rwilliam/ Last revised February 15, 2015 Overview.
UNIVERSITY OF TORONTO. Faculty of Arts and Science APRIL 2010 EXAMINATIONS STA 303 H1S / STA 1002 HS. Duration - 3 hours. Aids Allowed: Calculator
 UNIVERSITY OF TORONTO Faculty of Arts and Science APRIL 2010 EXAMINATIONS STA 303 H1S / STA 1002 HS Duration - 3 hours Aids Allowed: Calculator LAST NAME: FIRST NAME: STUDENT NUMBER: There are 27 pages
7/28/15. Review Homework. Overview. Lecture 6: Logistic Regression Analysis
 Lecture 6: Logistic Regression Analysis Christopher S. Hollenbeak, PhD Jane R. Schubart, PhD The Outcomes Research Toolbox Review Homework 2 Overview Logistic regression model conceptually Logistic regression
Thursday Morning. Growth Modelling in Mplus. Using a set of repeated continuous measures of bodyweight
 Thursday Morning Growth Modelling in Mplus Using a set of repeated continuous measures of bodyweight 1 Growth modelling Continuous Data Mplus model syntax refresher ALSPAC Confirmatory Factor Analysis
Stat 579: Generalized Linear Models and Extensions
 Stat 579: Generalized Linear Models and Extensions Linear Mixed Models for Longitudinal Data Yan Lu April, 2018, week 14 1 / 64 Data structure and Model t1 t2 tn i 1st subject y 11 y 12 y 1n1 2nd subject
Introduction to Event History Analysis. Hsueh-Sheng Wu CFDR Workshop Series June 20, 2016
 Introduction to Event History Analysis Hsueh-Sheng Wu CFDR Workshop Series June 20, 2016 1 What is event history analysis Event history analysis steps Outline Create data for event history analysis Data
Exploiting TIMSS and PIRLS combined data: multivariate multilevel modelling of student achievement
 Exploiting TIMSS and PIRLS combined data: multivariate multilevel modelling of student achievement Second meeting of the FIRB 2012 project Mixture and latent variable models for causal-inference and analysis
Mixed Models for Longitudinal Binary Outcomes. Don Hedeker Department of Public Health Sciences University of Chicago.
 Mixed Models for Longitudinal Binary Outcomes Don Hedeker Department of Public Health Sciences University of Chicago hedeker@uchicago.edu https://hedeker-sites.uchicago.edu/ Hedeker, D. (2005). Generalized
Using the same data as before, here is part of the output we get in Stata when we do a logistic regression of Grade on Gpa, Tuce and Psi.
 Logistic Regression, Part III: Hypothesis Testing, Comparisons to OLS Richard Williams, University of Notre Dame, https://www3.nd.edu/~rwilliam/ Last revised January 14, 2018 This handout steals heavily
Ordinary Least Squares Regression Explained: Vartanian
 Ordinary Least Squares Regression Explained: Vartanian When to Use Ordinary Least Squares Regression Analysis A. Variable types. When you have an interval/ratio scale dependent variable.. When your independent
Lab 10 - Binary Variables
 Lab 10 - Binary Variables Spring 2017 Contents 1 Introduction 1 2 SLR on a Dummy 2 3 MLR with binary independent variables 3 3.1 MLR with a Dummy: different intercepts, same slope................. 4 3.2
Final Exam - Solutions
 Ecn 102 - Analysis of Economic Data University of California - Davis March 19, 2010 Instructor: John Parman Final Exam - Solutions You have until 5:30pm to complete this exam. Please remember to put your
Chapter 11. Regression with a Binary Dependent Variable
 Chapter 11 Regression with a Binary Dependent Variable 2 Regression with a Binary Dependent Variable (SW Chapter 11) So far the dependent variable (Y) has been continuous: district-wide average test score
One-Way ANOVA. Some examples of when ANOVA would be appropriate include:
 One-Way ANOVA 1. Purpose Analysis of variance (ANOVA) is used when one wishes to determine whether two or more groups (e.g., classes A, B, and C) differ on some outcome of interest (e.g., an achievement
A multivariate multilevel model for the analysis of TIMMS & PIRLS data
 A multivariate multilevel model for the analysis of TIMMS & PIRLS data European Congress of Methodology July 23-25, 2014 - Utrecht Leonardo Grilli 1, Fulvia Pennoni 2, Carla Rampichini 1, Isabella Romeo
Longitudinal Data Analysis Using SAS Paul D. Allison, Ph.D. Upcoming Seminar: October 13-14, 2017, Boston, Massachusetts
 Longitudinal Data Analysis Using SAS Paul D. Allison, Ph.D. Upcoming Seminar: October 13-14, 217, Boston, Massachusetts Outline 1. Opportunities and challenges of panel data. a. Data requirements b. Control
Binary Dependent Variables
 Binary Dependent Variables In some cases the outcome of interest rather than one of the right hand side variables - is discrete rather than continuous Binary Dependent Variables In some cases the outcome
Lecture 3 Linear random intercept models
 Lecture 3 Linear random intercept models Example: Weight of Guinea Pigs Body weights of 48 pigs in 9 successive weeks of follow-up (Table 3.1 DLZ) The response is measures at n different times, or under
Modelling heterogeneous variance-covariance components in two-level multilevel models with application to school effects educational research
 Modelling heterogeneous variance-covariance components in two-level multilevel models with application to school effects educational research Research Methods Festival Oxford 9 th July 014 George Leckie
A (Brief) Introduction to Crossed Random Effects Models for Repeated Measures Data
 Introduction to Crossed Random Effects Models for Repeated Measures Data") A (Brief) Introduction to Crossed Random Effects Models for Repeated Measures Data Today s Class: Review of concepts in multivariate data Introduction to random intercepts Crossed random effects models
A (Brief) Introduction to Crossed Random Effects Models for Repeated Measures Data Today s Class: Review of concepts in multivariate data Introduction to random intercepts Crossed random effects models
Estimating a Piecewise Growth Model with Longitudinal Data that Contains Individual Mobility across Clusters
 Estimating a Piecewise Growth Model with Longitudinal Data that Contains Individual Mobility across Clusters Audrey J. Leroux Georgia State University Piecewise Growth Model (PGM) PGMs are beneficial for
Table B1. Full Sample Results OLS/Probit
 Table B1. Full Sample Results OLS/Probit School Propensity Score Fixed Effects Matching (1) (2) (3) (4) I. BMI: Levels School 0.351* 0.196* 0.180* 0.392* Breakfast (0.088) (0.054) (0.060) (0.119) School
Nonlinear Econometric Analysis (ECO 722) : Homework 2 Answers. (1 θ) if y i = 0. which can be written in an analytically more convenient way as
 : Homework 2 Answers. (1 θ) if y i = 0. which can be written in an analytically more convenient way as") Nonlinear Econometric Analysis (ECO 722) : Homework 2 Answers 1. Consider a binary random variable y i that describes a Bernoulli trial in which the probability of observing y i = 1 in any draw is given
Nonlinear Econometric Analysis (ECO 722) : Homework 2 Answers 1. Consider a binary random variable y i that describes a Bernoulli trial in which the probability of observing y i = 1 in any draw is given
EPSY 905: Fundamentals of Multivariate Modeling Online Lecture #7
 Introduction to Generalized Univariate Models: Models for Binary Outcomes EPSY 905: Fundamentals of Multivariate Modeling Online Lecture #7 EPSY 905: Intro to Generalized In This Lecture A short review
Lecture 2: Poisson and logistic regression
 Dankmar Böhning Southampton Statistical Sciences Research Institute University of Southampton, UK S 3 RI, 11-12 December 2014 introduction to Poisson regression application to the BELCAP study introduction
Testing Main Effects and Interactions in Latent Curve Analysis
 Psychological Methods 2004, Vol. 9, No. 2, 220 237 Copyright 2004 by the American Psychological Association 1082-989X/04/$12.00 DOI: 10.1037/1082-989X.9.2.220 Testing Main Effects and Interactions in Latent
Binary Logistic Regression
 The coefficients of the multiple regression model are estimated using sample data with k independent variables Estimated (or predicted) value of Y Estimated intercept Estimated slope coefficients Ŷ = b
ECONOMICS AND ECONOMIC METHODS PRELIM EXAM Statistics and Econometrics August 2013
 ECONOMICS AND ECONOMIC METHODS PRELIM EXAM Statistics and Econometrics August 2013 Instructions: Answer all six (6) questions. Point totals for each question are given in parentheses. The parts within
22s:152 Applied Linear Regression. Example: Study on lead levels in children. Ch. 14 (sec. 1) and Ch. 15 (sec. 1 & 4): Logistic Regression
 and Ch. 15 (sec. 1 & 4): Logistic Regression") 22s:52 Applied Linear Regression Ch. 4 (sec. and Ch. 5 (sec. & 4: Logistic Regression Logistic Regression When the response variable is a binary variable, such as 0 or live or die fail or succeed then
22s:52 Applied Linear Regression Ch. 4 (sec. and Ch. 5 (sec. & 4: Logistic Regression Logistic Regression When the response variable is a binary variable, such as 0 or live or die fail or succeed then
ADVANCED STATISTICAL ANALYSIS OF EPIDEMIOLOGICAL STUDIES. Cox s regression analysis Time dependent explanatory variables
 ADVANCED STATISTICAL ANALYSIS OF EPIDEMIOLOGICAL STUDIES Cox s regression analysis Time dependent explanatory variables Henrik Ravn Bandim Health Project, Statens Serum Institut 4 November 2011 1 / 53
Fall Homework Chapter 4
 Fall 18 1 Homework Chapter 4 1) Starting values do not need to be theoretically driven (unless you do not have data) 2) The final results should not depend on starting values 3) Starting values can be
Lecture 12: Effect modification, and confounding in logistic regression
 Lecture 12: Effect modification, and confounding in logistic regression Ani Manichaikul amanicha@jhsph.edu 4 May 2007 Today Categorical predictor create dummy variables just like for linear regression
ECON Interactions and Dummies
 ECON 351 - Interactions and Dummies Maggie Jones 1 / 25 Readings Chapter 6: Section on Models with Interaction Terms Chapter 7: Full Chapter 2 / 25 Interaction Terms with Continuous Variables In some regressions
Homework Solutions Applied Logistic Regression
 Homework Solutions Applied Logistic Regression WEEK 6 Exercise 1 From the ICU data, use as the outcome variable vital status (STA) and CPR prior to ICU admission (CPR) as a covariate. (a) Demonstrate that
Applied Statistics and Econometrics
 Applied Statistics and Econometrics Lecture 13 Nonlinearities Saul Lach October 2018 Saul Lach () Applied Statistics and Econometrics October 2018 1 / 91 Outline of Lecture 13 1 Nonlinear regression functions
Question 1 carries a weight of 25%; Question 2 carries 20%; Question 3 carries 20%; Question 4 carries 35%.
 UNIVERSITY OF EAST ANGLIA School of Economics Main Series PGT Examination 017-18 ECONOMETRIC METHODS ECO-7000A Time allowed: hours Answer ALL FOUR Questions. Question 1 carries a weight of 5%; Question
Study Guide #3: OneWay ANALYSIS OF VARIANCE (ANOVA)
") Study Guide #3: OneWay ANALYSIS OF VARIANCE (ANOVA) About the ANOVA Test In educational research, we are most often involved finding out whether there are differences between groups. For example, is there
Study Guide #3: OneWay ANALYSIS OF VARIANCE (ANOVA) About the ANOVA Test In educational research, we are most often involved finding out whether there are differences between groups. For example, is there
NELS 88. Latent Response Variable Formulation Versus Probability Curve Formulation
 NELS 88 Table 2.3 Adjusted odds ratios of eighth-grade students in 988 performing below basic levels of reading and mathematics in 988 and dropping out of school, 988 to 990, by basic demographics Variable
STA441: Spring Multiple Regression. This slide show is a free open source document. See the last slide for copyright information.
 STA441: Spring 2018 Multiple Regression This slide show is a free open source document. See the last slide for copyright information. 1 Least Squares Plane 2 Statistical MODEL There are p-1 explanatory
36-309/749 Experimental Design for Behavioral and Social Sciences. Dec 1, 2015 Lecture 11: Mixed Models (HLMs)
") 36-309/749 Experimental Design for Behavioral and Social Sciences Dec 1, 2015 Lecture 11: Mixed Models (HLMs) Independent Errors Assumption An error is the deviation of an individual observed outcome (DV)
36-309/749 Experimental Design for Behavioral and Social Sciences Dec 1, 2015 Lecture 11: Mixed Models (HLMs) Independent Errors Assumption An error is the deviation of an individual observed outcome (DV)
Statistical and psychometric methods for measurement: G Theory, DIF, & Linking
 Statistical and psychometric methods for measurement: G Theory, DIF, & Linking Andrew Ho, Harvard Graduate School of Education The World Bank, Psychometrics Mini Course 2 Washington, DC. June 27, 2018
Review of Multiple Regression
 Ronald H. Heck 1 Let s begin with a little review of multiple regression this week. Linear models [e.g., correlation, t-tests, analysis of variance (ANOVA), multiple regression, path analysis, multivariate
Simple Linear Regression: One Qualitative IV
 Simple Linear Regression: One Qualitative IV 1. Purpose As noted before regression is used both to explain and predict variation in DVs, and adding to the equation categorical variables extends regression
Sociology 362 Data Exercise 6 Logistic Regression 2
 Sociology 362 Data Exercise 6 Logistic Regression 2 The questions below refer to the data and output beginning on the next page. Although the raw data are given there, you do not have to do any Stata runs
Interaction effects between continuous variables (Optional)
") Interaction effects between continuous variables (Optional) Richard Williams, University of Notre Dame, https://www.nd.edu/~rwilliam/ Last revised February 0, 05 This is a very brief overview of this somewhat
Interaction effects between continuous variables (Optional) Richard Williams, University of Notre Dame, https://www.nd.edu/~rwilliam/ Last revised February 0, 05 This is a very brief overview of this somewhat
Lecture 4 Multiple linear regression
 Lecture 4 Multiple linear regression BIOST 515 January 15, 2004 Outline 1 Motivation for the multiple regression model Multiple regression in matrix notation Least squares estimation of model parameters
LDA Midterm Due: 02/21/2005
 LDA.665 Midterm Due: //5 Question : The randomized intervention trial is designed to answer the scientific questions: whether social network method is effective in retaining drug users in treatment programs,
Equation Number 1 Dependent Variable.. Y W's Childbearing expectations
 Sociology 592 - Homework #10 - Advanced Multiple Regression 1. In their classic 1982 paper, Beyond Wives' Family Sociology: A Method for Analyzing Couple Data, Thomson and Williams examined the relationship
Lecture 5: Poisson and logistic regression
 Dankmar Böhning Southampton Statistical Sciences Research Institute University of Southampton, UK S 3 RI, 3-5 March 2014 introduction to Poisson regression application to the BELCAP study introduction
Ordinary Least Squares Regression Explained: Vartanian
 Ordinary Least Squares Regression Eplained: Vartanian When to Use Ordinary Least Squares Regression Analysis A. Variable types. When you have an interval/ratio scale dependent variable.. When your independent
multilevel modeling: concepts, applications and interpretations
 multilevel modeling: concepts, applications and interpretations lynne c. messer 27 october 2010 warning social and reproductive / perinatal epidemiologist concepts why context matters multilevel models
Draft Proof - Do not copy, post, or distribute. Chapter Learning Objectives REGRESSION AND CORRELATION THE SCATTER DIAGRAM
 1 REGRESSION AND CORRELATION As we learned in Chapter 9 ( Bivariate Tables ), the differential access to the Internet is real and persistent. Celeste Campos-Castillo s (015) research confirmed the impact
Describing Nonlinear Change Over Time
 Describing Nonlinear Change Over Time Longitudinal Data Analysis Workshop Section 8 University of Georgia: Institute for Interdisciplinary Research in Education and Human Development Section 8: Describing
STAT 7030: Categorical Data Analysis
 STAT 7030: Categorical Data Analysis 5. Logistic Regression Peng Zeng Department of Mathematics and Statistics Auburn University Fall 2012 Peng Zeng (Auburn University) STAT 7030 Lecture Notes Fall 2012
CHAPTER 4 & 5 Linear Regression with One Regressor. Kazu Matsuda IBEC PHBU 430 Econometrics
 CHAPTER 4 & 5 Linear Regression with One Regressor Kazu Matsuda IBEC PHBU 430 Econometrics Introduction Simple linear regression model = Linear model with one independent variable. y = dependent variable
MIXED MODELS FOR REPEATED (LONGITUDINAL) DATA PART 2 DAVID C. HOWELL 4/1/2010
 DATA PART 2 DAVID C. HOWELL 4/1/2010") MIXED MODELS FOR REPEATED (LONGITUDINAL) DATA PART 2 DAVID C. HOWELL 4/1/2010 Part 1 of this document can be found at http://www.uvm.edu/~dhowell/methods/supplements/mixed Models for Repeated Measures1.pdf
MIXED MODELS FOR REPEATED (LONGITUDINAL) DATA PART 2 DAVID C. HOWELL 4/1/2010 Part 1 of this document can be found at http://www.uvm.edu/~dhowell/methods/supplements/mixed Models for Repeated Measures1.pdf
Latent Growth Models 1
 1 We will use the dataset bp3, which has diastolic blood pressure measurements at four time points for 256 patients undergoing three types of blood pressure medication. These are our observed variables: