CFD Simulation of Heat Enhancement in Internally Helical Grooved Tubes
|
|
|
- Avice Bradley
- 6 years ago
- Views:
Transcription

1 UNLV Theses, Dissertations, Professional Papers, and Capstones CFD Simulation of Heat Enhancement in Internally Helical Grooved Tubes Sogol Pirbastami University of Nevada, Las Vegas, Follow this and additional works at: Part of the Mechanical Engineering Commons Repository Citation Pirbastami, Sogol, "CFD Simulation of Heat Enhancement in Internally Helical Grooved Tubes" (2015). UNLV Theses, Dissertations, Professional Papers, and Capstones This Thesis is brought to you for free and open access by Digital It has been accepted for inclusion in UNLV Theses, Dissertations, Professional Papers, and Capstones by an authorized administrator of Digital For more information, please contact
2 CFD SIMULATION OF HEAT ENHANCEMENT IN INTERNALLY HELICAL GROOVED TUBES By Sogol Pirbastami Bachelor of Science in Biomedical Engineering University of Science and Research, Tehran, Iran 2011 A thesis submitted in partial fulfillment of the requirements for the Master of Science Mechanical Engineering Department of Mechanical Engineering Howard R. Hughes College of Engineering The Graduate College University of Nevada, Las Vegas August 2015
3 Copyright by Sogol Pirbastami, 2015 All Rights Reserved
4 Thesis Approval The Graduate College The University of Nevada, Las Vegas July 2, 2015 This thesis prepared by Sogol Pirbastami entitled CFD Simulation of Heat Enhancement in Internally Helical Grooved Tubes is approved in partial fulfillment of the requirements for the degree of Master of Science in Engineering Mechanical Engineering Department of Mechanical Engineering Samir Moujaes, Ph.D. Examination Committee Chair Kathryn Hausbeck Korgan, Ph.D. Graduate College Interim Dean Darrell Pepper, Ph.D. Examination Committee Member Brendan O Toole, Ph.D. Examination Committee Member Samaan Ladkany, Ph.D. Graduate College Faculty Representative ii
5 ABSTRACT CFD SIMULATION OF HEAT ENHANCEMENT IN INTERNALLY HELICAL GROOVED TUBES By Sogol Pirbastami Samir F. Moujaes, Ph.D.,P.E., Examination Committee Chair Professor, Department of Mechanical Engineering University of Nevada, Las Vegas Heat exchanger devices are widely used in industries, air conditioning systems, refrigeration, etc. These devices have a major role in energy conservation; therefore, increasing the performance of heat exchangers helps save energy, costs and materials. The technique to increase the heat transfer performance is called heat augmentation, which can be applied to pipe surfaces and other surfaces which are used in heat exchangers to improve thermal performance. These techniques are categorized into 3 groups: passive, active and compound technique. In this study a helically machined rectangular groove on the inside of a 2.0 m tube with a diameter of 7.1mm was studied for the heat augmentation effect. A Computational Fluid Dynamics (CFD) investigation has been carried out to study the heat transfer enhancement in a smooth tube and in four grooved tubes with different pitch sizes (7.1, 12.7, 50 and 130 (mm)). The simulations were performed in the Reynolds number range of The current CFD predicted values were compared with previously collected experimental data [2]. First, the CFD simulation was run for different groove pitches (203, 254 and 305) to compare them with the published experimental work [2]. The results of these simulations for Nu numbers and friction factors showed good agreement with the experimental values. The primary focus of this study iii
6 involves evaluating the effect of groove pitch on heat transfer and friction factors. A thermal enhancement factor is defined to evaluate the performance of the internally grooved tubes. By decreasing the pitch size from 130 to 7.1 (mm) at the same Reynolds number, both Nusselt number and friction factor increase. Also, by increasing the Reynolds number, the Nusselt number, as expected, becomes greater. The highest Nusselt number is obtained for smaller pitch size of 7.1 and 12.7 (mm) but at the penalty of a greater pressure drop compared to smooth tubes. It is observed that there is an optimum value of the enhancement factor (η) at about Re = 15,000 for all investigated grooves and enhancement up to 20% is obtained for grooved tubes with 7.1 mm pitch size. The heat transfer properties of grooved tubes revealed that the CFD simulations can be used to improve future design considerations, which leads to improvement of performance in heat exchanger devices. iv
7 ACKNOWLEDGMENTS This journey would not have been possible without the support of my family, professors and friends. Infinite appreciation goes to my family, who have always been proud of me and encouraged me to pursue my interests. Gratitude is extended to my advisor, Dr. Samir Moujaes for invaluable guidance throughout this process and, also, to my thesis committee Dr. Darrell Pepper, Dr. Brendan O Toole for their tremendous support. And, my sincere appreciation goes to Jann Wright and Joan Conway for helping me through the tough times. Last but not least, a thank you to my friends for their support and encouragement. v
8 TABLE OF CONTENT ABSTRACT... iii ACKNOWLEDGMENTS... v TABLE OF CONTENT... vi LIST OF TABLES... viii LIST OF FIGURES... ix CHAPTER 1 INTRODUCTION Heat Exchangers Heat Enhancement (Augmentation) Techniques Passive Techniques Active Techniques Compound Techniques... 6 CHAPTER 2 LITERATURE REVIEW... 7 CHAPTER 3 CFD MODELING Theoretical Methods Governing Equations Conservation of Mass Conservation of Momentum (Navier-Stokes Equations) Conservation of Energy Experimental Methods Numerical Methods - Computational Fluid Dynamics (CFD) STAR-CCM Finite Volume Turbulence Modeling Reynolds-Average Navier-Stokes (RANS) STAR-CCM+ Turbulence Modeling: K-Epsilon Two Equation Model Wall Function Work Chart of the CFD Simulation CHAPTER 4 CFD MODEL DESCRIPTION Description of Geometry Model Meshing Scheme Mesh Model Surface Mesh Volume Mesh vi
9 4.3 Physics of Simulation Boundary Condition CHAPTER 5 RESULTS AND DISCUSSION Grid Independence Study Wall Y+ for the Grid Model Parameters of the Present Research CFD Validation Smooth Tubes Validation Grooved Tubes Validation Extended CFD Simulation of Internally Grooved Tubes Nusselt Number Friction Factor (f) Thermal performance Center plane plots of temperature for tube pitch Streamlines for Re number of Swirl Effect Turbulent Kinetic Energy Heat Transfer Coefficient Circumferentially Averaged Value for the Heat Transfer Coefficient Axial Pressure Drop along the Tube CHAPTER 6 CONCLUSION Future Work REFERENCES CURRICULUM VITAE vii
10 LIST OF TABLES Table 3.1. Constant Variables of the k- ε Model Table 4.1. Details of the Test Section Table 4.2 Material Properties of the Fluid Table 4.3 Inlet Boundary Condition of Grooved Tubes with different Pitch Size (7.1, 12.7, 50, 130) and with constant inlet temperature of 24 C Table 5.1 Mesh Properties in Grid Independence Study Table 5.2 Details of Heat Transfer Characteristics for Grooved Tube with 203 mm Pitch Size Table 5.3 Details of Heat Transfer Characteristics for Grooved Tube with 254 mm Pitch Size Table 5.4 Details of Heat Transfer Characteristics for Grooved Tube with 305 mm Pitch Size Table 5.5 Average Outlet Temperatures in all cases Table 5.6 Calculated Local Heat Transfer for Reynolds of in Grooved Tube with Different Pitch Size (7.1, 12.7, 50 and 130 (mm)) Table 5.7 Calculated Local Heat Transfer for Grooved Tube with 12.7 (mm) Pitch Table 5.8 Axial Pressure drop viii
11 LIST OF FIGURES Figure 1.1 Passive Technique Devices [13]... 5 Figure 2.1 Sketch of the Grooved Tube [2]... 7 Figure 2.2 Geometric Shapes of the Grooved Tube [4]... 8 Figure 2.3 Twisted Tape Insert in Internally Grooved Tube [3]... 9 Figure 2.4 Grid for the Plain Tube with Alternate Axis Twisted Tape Insert [20] Figure 2.5 Rectangular Channel with Ribs and Grooves [27] Figure 2.6 The Configurations of Square Duct with Cylindrical Groove [15] Figure 2.7 Geometry of a) Spiral Groove and b) Herring Bone Groove [14] Figure 4.1 2D Sketch of a Grooved Tube Figure 4.2 Schematic Diagram of the Grooved Tube Figure 4.3 Surface Mesh a) Initial Surface b) Remeshed Surface Figure 4.4. Volume Mesh of the Grooved Tube Figure 5.1 Schematic Diagram of a Radial Probe Line of A-A on the Cross Section Plane Used for Axial Velocity and Temperature Figure 5.2 Different Volume Mesh Used in Grid Independence Study Figure 5.3 Comparison of Axial Velocity for Four Different Mesh Figure 5.4 Comparison of Axial Temperature for Four Different Mesh Figure 5.5 Wall Y+ Distribution for chosen Mesh with cells...41 Figure 5.6 Comparison of CFD Nusselt Number of a Smooth Tube with Experimental Data Figure 5.7 Comparison of CFD Friction Factor of a Smooth Tube with Experimental Data Figure 5.8 Comparison of CFD and Experimental Nusselt Number for Tube with 203 (mm) Pitch Size Figure 5.9 Comparison of CFD and Experimental Friction Factor for Tube with 203 (mm) Pitch Size Figure 5.10 Comparison of CFD and Experimental Nusselt Number for Tube with 254 (mm) Pitch Size Figure 5.11 Comparison of CFD and Experimental Friction Factor for Tube with 254 (mm) Pitch Size Figure 5.12 Comparison of CFD and Experimental Nusselt Number for Tube with 305 (mm) Pitch Size ix
12 Figure 5.13 Comparison of CFD and Experimental Friction Factor for Tube with 305 (mm) Pitch Size Figure 5.14 Nusselt Numbers as a Function of Reynolds Number for Four Different Grooved Tubes ( Pitch Size 7.1, 12.7, 50 and 130 (mm)) and a Smooth Tube Figure 5.15 Friction Factor as a Function of Reynolds Number for Four Different Grooved Tubes ( Pitch Size 7.1, 12.7, 50 and 130 (mm)) and a Smooth Tube Figure 5.16 Thermal Enhancement Factor for Grooved Tube with 203 (mm) Pitch Size Figure 5.17 Thermal Enhancement Factor for Grooved Tube with 254 (mm) Pitch Size Figure 5.18 Thermal Enhancement Factor for Grooved Tube with 254 (mm) Pitch Size Figure 5.19 Thermal Enhancement Factor as a Function of Reynolds Number for Four Grooved Tubes Figure 5.20 Center-plane Temperature Profile of Tube with12.7 (mm) Pitch at 4000 Re Number Figure 5.21 Temperature Profile near the Groove Figure 5.22 Center-plane Temperature Profile of Tube with12.7 (mm) Pitch at 6000 Re Number Figure 5.23 Center-plane Temperature Profile of Tube with12.7 (mm) Pitch at 8000 Re Number Figure 5.24 Center-plane Temperature Profile of Tube with12.7 (mm) Pitch at Re Number Figure 5.25 Streamlines within the Fluid Region in Tube without Groove Figure 5.26 Streamlines within the Fluid Region in Tube with 7.1 mm Pitch Size Figure 5.27 Streamlines within the Fluid Region in Tube with 12.7 mm Pitch Size Figure 5.28 Streamlines within the Fluid Region in Tube with 50 mm Pitch Size Figure 5.29 Streamlines within the Fluid Region in Tube with 130 mm Pitch Size Figure 5.30 Vector Velocity of [i]+[j] at Re of for Tube with 7.1 mm Pitch Size 66 Figure 5.31 Vector Velocity of [i]+[j] at Re of for Tube with 12.7 mm Pitch Size Figure 5.32 Contour Plot of TKE for Tube with 12.7 Groove at Re number of Figure 5.33 Contour Plot of TKE for Tube with 12.7 Groove at Re Number of Figure 5.34 Contour Plot of TKE for Tube with 12.7 Groove at Re Number of Figure 5.35 Contour Plot of TKE for Tube with 12.7 Groove at Re Number of Figure 5.36 Contour Plot of TKE for Tube with 12.7 Groove at Re Number of x
13 Figure 5.37 Contour Plot of TKE for Tube with 12.7 Groove at Re Number of Figure 5.38 Local Heat Transfer Coefficient on Surface of the Tube with 12.7 mm Pitch Size at Re Number of 4, Figure 5.39 Local Heat Transfer Coefficient on Surface of the Tube with 12.7 mm Pitch Size at Re Number of 6, Figure 5.40 Local Heat Transfer Coefficient on Surface of the Tube with 12.7 mm Pitch Size at Re Number of 8, Figure 5.41 Local Heat Transfer Coefficient on Surface of the Tube with 12.7 mm Pitch Size at Re Number of 10, Figure 5.42 Local Heat Transfer Coefficient on Surface of the Tube with 12.7 mm Pitch Size at Re Number of 15, Figure 5.43 Local Heat Transfer Coefficient on Surface of the Tube with 12.7 mm Pitch Size at Re Number of 20, Figure 5.44 Schematic Diagram of cross sections at Different Axial Position Along Different Grooved Tubes Figure 5.45 Circumferentially Averaged Heat Transfer for Reynolds of in Grooved Tube with Different Pitch Size (7.1, 12.7, 50 and 130 (mm) Figure 5.46 Pressure Drop along the Smooth Tube for Reynolds Number ranged between Figure 5.47 Pressure Drop along the Grooved Tube with Pitch Size of 12.7 (mm) for Reynolds Number ranged between Figure 5.48 Pressure Drop along the Grooved Tube with Pitch Size of 12.7 (mm) for Reynolds Number ranged between Figure 5.49 Pressure Drop along the Grooved Tube with Pitch Size of 50 (mm) for Reynolds Number ranged between Figure 5.50 Pressure Drop along the Grooved Tube with Pitch Size of 130 (mm) for Reynolds Number ranged between Figure 5.51 Comparison of Pressure Drop along the Grooved Tube at Re of 4000 for All Cases xi
14 CHAPTER 1 INTRODUCTION Improving the heat transfer performance in heat exchanger devices, which is called heat augmentation or intensification, can play a major role in saving energy and material consumption. This also leads to reducing the manufacturing cost of heat exchanging equipment which has been used in various industrial, commercial and domestic applications. Since the energy resources of the earth are decreasing and their costs are increasing, design of energy efficient heat exchangers has significant impact on energy conservation. The demand for improving heat performance leads to developing heat enhancement techniques which help in equipment size reduction, saving operating costs, and reducing pumping power in heat exchangers. Therefore, based on the purpose of the equipment, designers can focus on one of these heat enhancement criteria and provide these benefits [2] [17]. In recent years, the study of different techniques of heat transfer enhancement in heat exchanger devices has gained valuable attention and much research has been done in both heat transfer and thermodynamic consideration [2] [17]. Learning about heat exchanger devices and different heat transfer techniques is the purpose of this chapter. 1.1 Heat Exchangers Heat exchangers are extensively used in HVAC systems (heating, ventilating and air conditioning), chemical and power plants, refrigeration systems, petroleum plants, etc. These devices provide efficient heat transfer between two or more fluids or solid surfaces and between fluids or solid particles with fluids at different temperatures. Heat exchangers 1
15 are thermal devices, which have a major role in energy conservation and impact on climate change. They are categorized based on their transfer process, heat transfer mechanism, number of fluids, surface compactness, construction characteristics and flow arrangement. The categories of heat exchangers where the fluids are in direct contact for exchanging heat are called direct transfer types, or simply recuperators. In contrast, in other heat exchangers, there is a separating wall between hot and cold fluids which are referred to as indirect transfer types, or simply regenerators [17]. Most of the heat exchangers have the potential to be considered for heat enhancement, however, each potential application should be tested to see if the enhancement is practical. Nearly all heat enhancement techniques are used for heat exchangers in the refrigeration and automotive industries [26]. 1.2 Heat Enhancement (Augmentation) Techniques Augmentation techniques help increase heat convection in heat exchanger devices and decrease the thermal resistance. In many applications such as for chemical reactors, air conditioning and refrigeration systems, there are many techniques being investigated for increasing the heat transfer rate and reducing the size and cost of the devices. Studies have proved that applying enhancement techniques, improve the thermal performance significantly [16]. However, increasing the rate of enhancement is at the penalty of pressure drop. Therefore, in any heat augmentation design, the heat transfer coefficient and pressure drop needs to be analyzed. These techniques are categorized into 3 groups: passive, active and compound technique [26] [16]. 2
16 1.2.1 Passive Techniques In these techniques external power is not required; rather geometry or surface of the flow channel will be modified to increase heat transfer coefficients. The inserts and rough surfaces will be employed to promote the swirl in the flow, which leads to increase in heat transfer enhancement. In case of extended surfaces, effective heat transfer area on the side of the extended surface will be increased. Passive techniques are a good method due to the lower cost of set up and compact size of the heat exchangers [16]. Heat transfer enhancement by passive technique can be achieved by using: Coated or Treated Surfaces involve using different surface finishes and coating methods with metallic and nonmetallic material. These modifications are used for boiling and condensing applications. For example, in boiling systems, a coating layer of hydrophobic material such as PTFE (polytetraflouroethylene) is used to promote dropwise condensation and a porous coating is used in enhancing nucleate boiling and a higher heat transfer coefficient. Sintered, multilayered and coated surfaces are among some examples of treated surfaces [26]. Rough surfaces are provided in two different methods: Integral method, where the roughness is integrated on the surfaces and made by machining or restructuring. The other is a non-integral method, which is done by placing roughness close to the surface to increase heat transfer. Both methods are generally surface modifications that increase turbulence flow, but do not increase heat transfer surface area in the field and are primarily used in a single phase flow. Also, any structure with a regular pattern that repeats and disturbs the boundary layer like a coil insert is an example of non-integral roughness [26]. 3
17 Extended surfaces expand the heat transfer area which increases the heat transfer coefficient. The plain fin may just increase the area, but special structured extended surfaces can increase the heat transfer coefficient, too. In applications for gases, mostly extended surfaces are used to provide both higher heat transfer coefficient (h) and area (A). Since the heat transfer coefficient of liquids is higher than gases, shorter fin height is used for fluid application. Segmented fins on the surface cause a separation in the boundary layer. Therefore, after each separation a new boundary will be formed and will improve the heat transfer rate. These techniques are used in automotive, refrigeration systems and air conditioning applications [13]. Displaced enhancement devices are placed into a flow channel and move the fluid through the tube and displace it from the core to the surfaces with lower or higher temperatures. The objective of this technique is to increase the fluid mixing, which leads to improve energy transport. Inserts like conical ring devices, metallic mesh, disks and wire inserts are among displaced enhancement devices [26]. Swirl flow devices include different geometrical configurations which provide secondary flow and recirculation in fluids such as: helical twisted tape, inlet vortex generator, static mixer. These are creating swirls in both clockwise and counterclockwise directions. Swirl generator devices can be used in both single and multiple phase flows [26] [13]. Additives for liquids and gasses involve the addition of solid particles, soluble trace additives, gas bubbles and liquid droplets. These particles are added to the liquids or gasses to reduce the fluid resistance in the case of single phase flows. In the case of boiling systems, trace additives are added to reduce the surface tension of the liquids [26]. 4
![a b d c e Figure 1.1 Passive Technique Devices. a) Segmented Fin Sink, b) Helical Tape Inserts, c) Coiled Tubes, d) Internally Finned Tube, e) Grooved Tube [13] 1.2.](/docs-images/78/77490284/images/18-0.jpg "2 Active Techniques These techniques need external power to promote the heat transfer rate.")
18 a b d c e Figure 1.1 Passive Technique Devices. a) Segmented Fin Sink, b) Helical Tape Inserts, c) Coiled Tubes, d) Internally Finned Tube, e) Grooved Tube [13] Active Techniques These techniques need external power to promote the heat transfer rate. Active techniques are complicated due to design and higher cost of the devices in comparison with passive methods. Therefore, their application is limited. Some active methods are as follows [13]: Mechanical Aids involve devices that are rotating or stirring by mechanical methods. For example, rotator heat exchanger ducts are commercially used and surface scrapers are used for stirring the fluids in chemical processes for viscous fluid. Surface Vibration is applied to improve heat transfer with low or high frequency, such as piezoelectric devices. Fluid Vibration is where pulsation is created in the fluid itself instead of on surfaces. It is useful for single phase flows. 5
19 Electrostatic Fields are electric and magnetic fields or a combination of the two forms of DC or AC current. Electrostatic fields are applied to heat exchanger systems, which induces greater bulk mixing, force convection or electromagnetic pumping to enhance heat transfer. This technique is applicable in heat transfer processes involving dielectric fluids. Injection is supplying gas or liquid through a porous heat transfer surface into the fluid flow. This technique is used for single phase heat transfer processes. Suction is used to remove vapor or fluid from porous surfaces. Jet Impingement is used for both two phase and single phase heat transfer processes. In this method, single phase fluid is forced normally or in a perpendicular or diagonal direction towards the heat transfer surface [26] [16] [13] Compound Techniques A compound augmentation technique is a combination of more than one enhancement method (either from active or passive) to improve the thermal performance of heat exchanger devices [13]. Besides heat enhancement techniques, mode of transfer and geometry classification are important. In this study the single phase flow with forced convection mode for the flow inside internally grooved tubes is used. In this current study the effect of groove geometry on heat transfer and pressure drop is investigated. Groove geometry acts as roughness and promotes the flow mixing and interrupts boundary layers. 6
20 CHAPTER 2 LITERATURE REVIEW Aroonrat et al. (2013) experimentally investigated the effect of pitch size in internally helical grooved tubes (Figure 2.1) on heat transfer and flow characteristics in stainless steel tubes. The effect of the grooves has shown that the Nusselt number and friction factor obtained from the helical grooved tubes were higher than those of the smooth tubes. Moreover, the Nusselt number and friction factor increased with the decrease of the pitch size. Overall, Thermal performance has improved for the internally grooved tubes [2]. Figure 2.1 Sketch of the Grooved Tube [2] Bilen et al. (2009) [4] experimentally investigated the effect of groove geometry on heat transfer and friction characteristics of fully developed turbulent flow in grooved tubes (circular, trapezoidal and rectangular). Maximum heat transfer enhancement is obtained up to 63% for circular groove, 58% for trapezoidal groove and 47% for rectangular groove, compared to smooth tubes. Also, the correlation equation is developed experimentally for Nusselt number and friction factor for each tube. In the range of 7
21 Reynolds between to thermal performance (ƞ) for all grooved pipes is in the range of for circular groove, for trapezoidal groove and for rectangular groove at constant pumping power. Figure 2.2 Geometric Shapes of the Grooved Tube, Dimension in mm (a) Circular, (b) Rectangular and (c) Trapezoidal Grooves [6] Bharadwaj, Khondge and Date (2009) [3] experimentally investigated the compound method of heat enhancement with a constant wall heat flux for water flow in the internal spiral grooved tube with twisted tape. Different twist ratio ((Y = 10.15, 7.95 and 3.4) is considered for this study (Figure 2.3), then pressure drop and heat transfer characteristics are defined. Heat transfer enhancement yields 400% in laminar flow and 140% in turbulent flow for spirally grooved tubes without twisted tape compared with smooth tubes. Adding a twisted tape to a spirally grooved tube, increases the enhancement to 600% for laminar and 140% for turbulent flow. However, in both cases, the reduction in heat enhancement observed is 2000<Re< Among all twisted ratios, the twisted 8
22 ratio of Y = 7.95 has the highest heat transfer performance in both laminar and turbulent flows [3]. Figure 2.3 Twisted Tape Insert in Internally Grooved Tube [3] In the study by Graham, Chato and Newell (1999) [8] the performance of an axial micro fin grooved tube with helical angle of 0 for refrigerant R023a was conducted and the results compared with a similar tube with a helical angle of (18 ) in different ranges of mass fluxes. The 18 helix angle tube performs better than the axially and grooved tube. Heat enhancement factors have shown 62% and 20% improvement in enhancement for helical and axially grooved tubes compared to smooth tubes at lower mass fluxes [11]. Salman et al. (2014) used Computational Fluid Dynamics (CFD) to investigate heat transfer characteristics and friction factors in a circular tube fitted with twisted tape inserts in a laminar flow region at constant heat flux. Fluent software is used to simulate plain tube and a tube with twisted tape inserts with different twist ratios (y = 2.93, 3.91, 4.89) and alternative angles (β = 30, 60, 90 ) (Fig 2.4). The results are validated with theoretical and experimental work in literature. Therefore, CFD Simulation is a reliable method for investigating the heat augmentation. Tubes with different twist ratios and angles of helix have shown higher value for The Nusselt number and friction factor 9
23 compared to plain tubes and tubes equipped with plain twisted tapes. In this study, the highest heat transfer enhancement belongs to the alternate axis β= 90 and twisted tape ratio of (y = 2.93) [20]. Figure 2.4 Grid for the Plain Tube with Alternate Axis Twisted Tape Insert [9] Xinyi and Zhou (2012) [27] investigated an overall heat transfer performance and friction factor of water flow in an enhanced surface rectangular channel both experimentally and numerically. Discontinuous crossed ribs and rib-grooves provided in tubes and the flows were examined in a turbulent region. CFD Nusselt number and friction factor are 10% -13.6% higher for ribbed-grooved channel in comparison to experimental data. Furthermore, the effect of rib angels on the heat transfer characteristics was studied by Fluent software. The simulation results showed a rib angle of 45 has the best overall thermal performance, about 18%-36% higher than a rib angle of 0 (figure 2.5). 10
 [19] carried out a CFD analysis of flow of refrigerant (R22) through internal grooved copper tubes with Fluent software")
24 Figure 2.5 Rectangular Channel with Ribs and Grooves [27] Rahman, Zhen and Kadir (2013) [19] carried out a CFD analysis of flow of refrigerant (R22) through internal grooved copper tubes with Fluent software and investigated heat transfer enhancement in the tubes. Experimental study is too costly and takes a longer time in gathering necessary information. Therefore, numerical simulation is conducted instead of experimental research. The geometry model of an inner grooved tube was designed with SolidWorks software and the grid was generated with GAMBIT software. Then the model was imported to Fluent software to set up the boundary condition and solve the simulation model. The results were obtained and compared with published experimental results. Refrigerant (R22) was used as fluid through a copper tube for two different purposes: condensation and evaporation. The heat transfer coefficient improved for enhanced tube in comparison with smooth tube. The CFD results and experimental data showed strong agreement in this study [19]. In Salman et al. (2013) a study of quadrantcut twisted tape (QCT) inserts were used as a swirl generator inside the tube, then heat transfer and friction factor characteristics were investigated [21]. They used Sieder and 11
25 Tate correlation to validate their data for smooth tube. The results for uncertainty for the Nusselt and Friction factor were determined to be around 8% and 10%, respectively. Results were in the range of Reynolds of The Nusselt number increased with an increasing Reynolds number. The (QCT) inserts by generating vortices and disrupting the boundary layer, improved the fluid mixing and respectively the heat enhancement [21]. Liu, Xie and Simon (2015) [15] studied the heat transfer performance of turbulent flow (Re: 10,000-25,000) in square duct with cylindrical groove. The purpose of this study is to find out the desirable design for better enhancement rate and minimum pressure drop penalties. In this study, 4 different cylindrical shaped grooves in a square rib groove tube were considered (Figure 2.6) and the results were computed with CFD modeling. The pressure drop is less for cylindrical shaped groove tubes in comparison to the square rib tube. The rounder the edges of the cylindrical groove, the better total heat enhancement. Figure 2.6 The Configurations of Square Duct with Cylindrical Groove [15] Kaji, Yoshioka and Fujino (2012) [14] experimentally investigated the heat transfer performance of smooth and internally grooved tubes in an air-cooled heat exchanger using CO2 as a refrigerant and Poly alkyl glycol (PAG) oil flow as a lubricant in both cooling and evaporating heat exchanger systems. Two internal grooved configurations 12
 b) Figure 2.")
26 (Herringbone and spiral) (Figure 2.7) are examined for this study. The heat transfer coefficients which are obtained experimentally are 1.8 and 2.1 higher than smooth tube for the spiral and herringbone tubes respectively. a) b) Figure 2.7 Geometry of a) Spiral Groove and b) Herring Bone Groove [14] Heat transfer performance can be improved by using inner grooved tubes with suitable patterns. Also, the oil's effect was investigated by using an instrument to visualize flow inside the tube. It was observed that herring bone groove has better performance in comparison to spiral and smooth tube in the presence of oil. Therefore, inside geometry can affect oil s behavior [14]. Heat augmentation of internally enhanced surfaces particularly roughness became quite important since the method is economically beneficial for commercial applications. In refrigeration industries mostly rough surfaces are used on the water side of evaporators and condensers in large equipment. Also studies showed that roughness is used in gas turbine blade and gas-cooled nuclear reactors [26]. There are many different geometries that are used for heat enhancement which was explained in this chapter. Some important key factors which should be considered in design and investigation of different roughness including grooves are as follows: roughness height (e), spacing or pitch size (p), roughness width (w) and geometry shape of the roughness. Also two other factors in groove are 13
27 applied such as helix angle and number of starts. The integral helical groove may be made as single or multi-start elements. Studies showed that the greatest material saving is for helical internal groove which is about 12% greater than axial grooves. Furthermore, most studies have been conducted on multiple start groove tube, and even Turbo chill tube has commercially made theses tubes for different applications [26]. Based on experimental study that was chosen to compare with the CFD results [2], the heat transfer enhancement in internally grooved tubes was conducted for Reynold in the transient region while fully turbulent. Recently, CFD simulations are used to validate experimental studies. The CFD modeling technique has been recognized as a powerful and effective tool to gain better understanding of the complex heat transfer and fluid problems. Furthermore, due to good agreement between CFD simulation results and experimental studies, scientist could save a great amount of time and money by using simulation techniques to predict the heat transfer characteristics of a flow in heat augmentation methods. Based on this review, many experimental works can be simulated and analyzed by CFD software. In the current study the CFD software STARCCM+ is used to study the heat transfer performance of internally grooved tubes with different pitch sizes in turbulent flow. 14
28 CHAPTER 3 CFD MODELING Most flows on earth and around us are in a turbulent region, similarly, so are the turbulent flows inside a cylindrical tube of a combustion engine. These flows have different mechanisms which are categorized by a dimensionless factor called Reynolds number [28]. To describe and predict the characteristics of flow is difficult particularly for turbulent flows. There are three approaches to obtain the solution of fluid flow and heat transfer problems: Theoretical approach Experimental approach Numerical approach, Computational Fluid Dynamics (CFD) [28] 3.1 Theoretical Methods This method has the advantage of providing an exact result by solving the governing equations of flow. However, this method is limited to a few classes of problems since the analytical solution for 3D and 2D flows are highly complex to solve [28] Governing Equations There are three fundamental laws describing fluid flow, heat transfer and mass transfer. The governing equations of flow are simply a version of conservation laws of physics and may described by both integral and partial differential equations [28] [12]. 15
29 The governing equations can be presented in Cartesian, cylindrical and spherical coordinates. In this study, the conservation laws are expressed in Cartesian coordinates as follows: Conservation of Mass Mass flow that is entering the control volume (dxdydz) should be equal to the mass flow that is leaving the control volume. Dρ Dt + ρ. V = 0 Conservation of Mass (1) Conservation of Momentum (Navier-Stokes Equations) Conservation of momentum or Navier-Stokes equations consists of 3 equations in each direction. These equations are generated based on Newton s second law of motion which stated the momentum of an object is proportional to the net force that is acting on it in the same direction. The net force includes: body forces such as gravity and surface forces that acts on the surface of the element [28] [12]. The three equations in cylindrical coordinates by assuming Newtonian fluid with constant density, viscosity are as follows: ρ ( u u u + u + v t x y ρ ( v v v + u + v t x y + w u z ) = ρg x p x + μ [ 2 u x u + w v z ) = ρg y p y + μ [ 2 v x v + 2 u y 2 z + 2 v y 2 z 2 ] (x direction) (2) 2 ] (y direction) (3) ρ ( w w w + u + v t x y w + w ) = ρg z z p + μ [ z 2 w + 2 w + 2 w x 2 y 2 z 2 ] (z direction) (4) where: ρ: Fluid density g x, g y, g z : Body forces 16
30 μ: Fluid viscosity p: Static Pressure t: time Conservation of Energy The first law of thermodynamics states that energy cannot be created or destroyed, but energy can be transformed from one form to another. In fluid it is better to define it as a rate of internal energy and kinetic energy that is equal to energy transported by convection and conduction, and the net rate of work has been done by elements. [12] DT ρc p =. k T + μφ (5) Dt φ = 2 [( u x )2 + ( v y )2 + ( w z )2 ] + ( u y + v x )2 + ( v z + w y )2 + ( w x + u z )2 (6) Where: c p : Specific heat k: Thermal conductivity φ: Dissipation function 3.2. Experimental Methods Experimental methods provide acceptable solutions for flow problems, but setting up an experiment in the lab is costly and time consuming. For instance, Wind Tunnel experiments help in designing of airplanes, ships and other objects, but it might take several years to resolve all technical problems of the experimental set up and it is expensive. [28] 17
31 3.3. Numerical Methods - Computational Fluid Dynamics (CFD) Numerical methods for solving partial differential equations to describe fluid flow and heat transfer process were started in early twentieth century. Computational Fluid Dynamic (CFD) started with the development of the computer which sped up the numerical simulation in the early 1970 s [17] [5]. Computational methods are not free of difficulties, but have advantages over other methods such as: universality, flexibility, accuracy, and cost [28]. CFD is a subdivision of fluid mechanics integrated with physics, mathematical solution and computer technology for simulating and solving fluid flow and heat transfer problems [5]. The ability of CFD methods to solve complex flow problems is highly dependent on the development of computer technology. The simulation of inviscid flows (Euler equations) and computation of the viscous flow (Navier-Stokes equation) was started in 1980s. Various turbulent modelling with different complexities gradually developed and lead to significant models such as Direct Numerical Simulation (DNS) and Large Eddy Simulation (LES) [5]. Today, many different numerical techniques are used in CFD software which is employed into a variety of fields for flow and heat transfer simulation of aircraft, car, ship design, heat exchangers, etc [5]. Therefore, CFD became an acceptable design and research tool in engineering and science which complements both experimental and numerical solutions by speeding the process and lowering the cost of solving fluid dynamics problems [5] [28]. In the current study, STAR-CCM+ is chosen, which is a software among the limited CFD softwares. STAR-CCM+ has the capability to approximate partial differential equations of different types of flow problems by using the numerical discretization method. There are different discretization methods used in 18
32 commercial CFD such as, finite volume method, finite element method and finite difference method; STAR-CCM+ is based on the finite volume method STAR-CCM+ STAR-CCM+ is an integrated and powerful physics simulation package with ability of processing flow, heat transfer and stress problems in both fluids and solids. This software was created by CD-Adapco in 2004 and is updated constantly. The STAR-CCM+ unique client-server architecture, lets users solve most parts of their simulation on a remote machine. Therefore, it can handle meshing and solving of large models for a variety of engineering and design problems. STAR-CCM+ consists of pre-processing, solving and post processing features such as; CAD modelling, surface preparation tools, automatic mesh generation, physics modelling, turbulence modelling, and visualization and analysis.(star view) [25] Finite Volume The Finite Volume Method is based on the integral form of the governing equations (Navier-Stokes/Euler equation) and discretize the physical space to large numbers of the arbitrary polyhedral control volumes. Mostly cell-centered and cell vortex schemes are used for defining the shape and position of the control volume. This method is very flexible and widely used in CFD because of its attractive properties. It can be used in both structured and unstructured grids [5]. 19
33 Turbulence Modeling Reynolds discovered two modes of flows, Laminar and Turbulent, based on a dimensionless number which is called Reynolds number in [5]. The transition phase between laminar and turbulent starts when the Reynolds number passes the critical value. (Re =2300) [12] The simulation of turbulent flow despite laminar and inviscid flow has significant problems. Turbulence models cannot provide the exact solution for every flow simulation. Therefore, there are different major approaches in CFD software used to try to predict the mean (average) flow fields. Reynolds-Average Navier-Stokes (RANS equation) Large Eddy Simulation (LES) Detached Eddy Simulation (DES) Most simulations rely on the first approach in STARCCM+ and then the second two approaches should be chosen very carefully. [25] In this study, the first approach is explained Reynolds-Average Navier-Stokes (RANS) RANS model was presented by Reynolds in 1895 by dividing the Navier-Stokes equation into mean and fluctuating parts. The average processing can be time or ensemble averaging for steady-state situations and transient situations [5] [25]. This approach is popular in engineering applications due to its simplicity, low computational cost and also, broad selection of models to choose from. The RANS equation is the same as Navier- Stokes equation for mean variables, but with Additional terms of Reynolds Stress Tensor. 20
34 ρ v i + t ρv j v j = p + x i x i x (τ ij ρv ) i v j Reynold Averaged Navier-Stokes equations i τ ij = ρv i v j Reynolds- Stress tensor (8) [25] In STAR-CCM+ two approaches are used to model Reynold Stress tensor in the form of mean flow quantities to provide an approximation of the governing equations. [25] Eddy viscosity model: in this model, the concept of turbulent viscosity term μ t is used to model the Reynolds stress tensor as a function of mean flow quantities. Boussinesq approximation is the most common model. Reynolds stress transport model: in this model, the transport equation is solved for each component of Reynolds Stress Tensors. (7) STAR-CCM+ Turbulence Modeling: Four major Reynolds average turbulence models are used in STARCCM+ software. First, Spalart-Allmaras model, which mostly is used in aerospace and good for flow since the boundary layer is attached and separation is rare. Second, K-Epsilon model which provides a good agreement between accuracy, computational cost and robustness and also is widely used in industrial applications. Third, Standard K-Omega model which is similar to K-epsilon and is applied in aerospace and tubomachinary industries. The last one, is the Reynolds Transport model which has the most computational cost and is used for complex flow such as swirling flow in a cyclone. 21
35 3.4. K-Epsilon Two Equation Model In this project, k-ε model is chosen for simulation [25]. In the k-ε two equation model, the velocity and length scale of turbulence are defined with two additional partial differential equations: turbulent kinetic energy k and dissipation rate ε [16] [18]. Various k-ε models are widely used in industrial applications during the recent decades. There have been countless attempts to improve it. The most significant of these improvements have been incorporated into STAR-CCM+ [25]. The final form of k equation is as below: ρ k + ρ u t j k = 2μ x t s ij u i ρε + (μ + μ t ) k (9) j x j x j σ k x j Left hand side 1 st term: Rate of change of k in a fluid particle transported by the mean flow. Right hand side; 1 st term: Rate of energy production; 2 nd term: effect of viscous dissipation, 3 rd term: Molecular diffusion of k and 4 th term: Diffusion by turbulent motion [16] The equation for dissipation ε is derived from the Navier-Stokes equations and simplified to ρ ε t + ρ u j ε x j = C ε1 P k ε k C ε2ρ ε2 k + x j (μ + μ t σ ε ) ε x j (10) k-ε consists of two partial differential equations and algebraic demonstrations for eddy viscosity. [16] μ t = C μ ρ k2 ε (11) The k and ε equations should be solved along with the Navier-Stokes equations for the average flow as part of Partial Differential Equation (PDE) systems. 22
36 Table 3.1 Constant Variables of the k- ε model. C μ 0.09 C ε C ε σ k 1.3 σ ε 1 STAR-CCM+ has a choice of eight different k- ε turbulence models. The most successful recent development is the realizable K-Epsilon model that has been chosen for current CFD work. This model contains a new transport equation for the turbulent dissipation rate ε. Also a critical coefficient C μ, of the turbulent model, is expressed as a function of mean flow and turbulence properties, rather than assumed to be constant as in the standard model [25] Wall Function One of the challenges in CFD solvers is how to deal with the near wall layer. RANS model is not able to model the turbulent stresses near the wall; therefore, the wall function approach is used. Wall function is a group of mathematical relations used to solve boundary conditions near the wall region. Therefore, turbulence model is only applied to the rest of the fluid region. The advantage of using wall function is to increase the accuracy of the 23
37 solution and also reduce the computational cost by using lower density in core meshes. [20][25] The turbulent flow region is divided into three layers near the wall as follows: Viscous Sublayer 0<y + <5 Buffer Layer 5 <y + < 30 Inertial Sublayer (logarithmic) layer 30< y + <150 In STAR-CCM+ there are three near wall modeling assumptions for each turbulent model. Also, applying wall function in some turbulent cases needs fine mesh close to the walls to capture the flow characteristics near the wall. The High y +, in this assumption the cells in the vicinity of the wall are placed in the logarithmic region of the boundary layer. This leads to significant reduction in the number of cells in boundary layer and reduces the computational cost. The Low y +, this treatment is proper for a low Reynolds number turbulence model and needs excessive grid generation near the wall. The All y +, is a hybrid or adaptive treatment for both coarse and fine meshes. It provides a reasonable solution for cells lying in buffer regions as well. [25] 3.6. Work Chart of the CFD Simulation The first step of any CFD simulation is preprocessing which starts with generating a geometry model of the problem to be solved and analyzed. There are many 3D CAD softwares which can be used to design and create solid models such as SolidWorks, CATIA V5, Pro/ENGINEER. Also, the solid model can be created with the 3D CAD package 24
38 inside the STAR-CCM+. Then the model can be imported into STAR-CCM+. After importing the geometry model, it is time to prepare the surface for mesh generation. STARCCM+ has a powerful tool for surface preparation, which provides diagnostic on any surface errors and tools to fix them manually or automatically. In Starccm+, there are several mesh strategies that can be used to discretize different geometries, such as surface mesher which includes surface wrapper, surface remesher tools and volume mesher which includes polyhedral mesher, trimmed mesher, etc. After preprocessing, the physics model and solver should be set up for the problems to be analyzed. The physics model and the solution are dependent on the defined problem and can be different for different cases. The physics set up for internal flow is different from flow on the surface. Some post processing features can be set up before running the model such as monitor plots and reports. Then, the model is ready to run, and visualization tools allow the user to view the results along the iteration or after convergence.. 25
39 CHAPTER 4 CFD MODEL DESCRIPTION 4.1 Description of Geometry Model Geometry model of the CFD simulation can be designed either by the Computational aid design (CAD) tools which are built in the STAR-CCM+ CFD package or imported from another CAD design software into the CFD software for further analysis. In this project, all models were generated in SolidWorks which is a CAD software for designing solid models. Geometry starts with a 2D sketch which is defined by numeric and geometric parameters. Then, the tube is extruded from the 2D model and becomes a 3D part. The groove is cut swiped from the inside of the tube in a helical pattern. With this software, parts and assemblies can be created for both simple and complex geometry purposes. Figure 4.1 and 4.2 depict the 2D and 3D sketches of the grooved tube. Test tubes include four horizontal cylindrical tubes with internal helical grooves and, also, another three helical grooved tubes for comparison with the experimental study. The detail of the each test section is provided in table 4.1. Tubes are made of stainless steel with inner diameter 7.1 mm, outer diameter 9.5 mm and length of 2000mm. 26

40 Figure 4.1 2D Sketch of a Groove Tube Table 4.1. The Details of the Test Sections Tube Groove Width (w) Groove Depth (e) d i (mm) Pitch Length (mm) Length (mm) GT GT GT GT GT GT GT Meshing Scheme Grid generation is an important aspect of any CFD modeling; therefore, in order to have an accurate simulation of flow and heat transfer, the geometry models should have good quality meshes. In the finite volume method, the geometry model is discretized to a number of small elements which are called cells by partial differential equation and 27
![algebraic methods. Then, the integral form of the conservation equations is applied to the cells to get the discrete equations for them [5].](/docs-images/78/77490284/images/41-0.jpg "Precise meshes are needed to capture the complexity of the flow characteristics and geometry from near the wall to the bulk of the fluid.")
![STAR-CCM+ provides several meshing strategies that are suitable for different applications [25]. Before starting the simulation, the best mesh should be picked for the model.](/docs-images/78/77490284/images/41-1.jpg "For this purpose, the mesh generation for a geometry model is started with coarse meshes and then the mesh sizes will be refined.")
41 algebraic methods. Then, the integral form of the conservation equations is applied to the cells to get the discrete equations for them [5]. Precise meshes are needed to capture the complexity of the flow characteristics and geometry from near the wall to the bulk of the fluid. STAR-CCM+ provides several meshing strategies that are suitable for different applications [25]. Before starting the simulation, the best mesh should be picked for the model. For this purpose, the mesh generation for a geometry model is started with coarse meshes and then the mesh sizes will be refined. The results will be analyzed until slight changes are observed in them. This is called mesh- independent study in CFD modeling. The CFD results are highly dependent on the mesh such as cell size, shape and grid density and including stretching ratios between cells and skewness angles, etc. Figure 4.2 Schematic Diagram of the Grooved Tube 28
42 4.2.1 Mesh Model The imported geometry surfaces were checked for any errors. In most cases, the surface errors were minor and solved automatically by STAR-CCM+. There are two different strategies for meshing: part based meshing and region based meshing. Region based meshing is chosen to mesh all different tubes in this study, since the geometric parts are assigned as a fluid region Surface Mesh The imported surface mesh in all cases was tessellated and needed refinement. The surface repair tool was used to close the manifolds, fix the errors and assign fluid flows through the tubes. This tool is only used for simple geometry and minor surface errors, however, fixing the surface in cases with many errors, surface wrapper should be used instead [25]. For the grooved tube models, Surface Remsher was chosen to create triangulated faces on surface geometry to improve surface quality for volume meshing. Most bad volume mesh is caused by poor surface mesh; therefore, surface remesher plays an important role in the final results [25]. Figure 4.3 shows the initial surface and remeshed surface. The finer meshes require more computational time and memory, but they are important for capturing the properties of the model in the process of solving the simulation, especially inside the grooved channels. 29

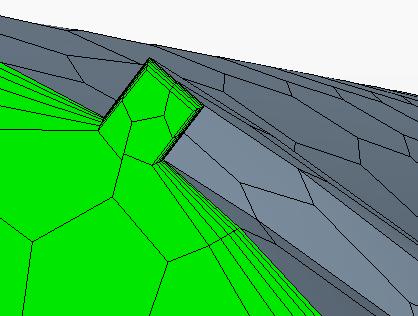
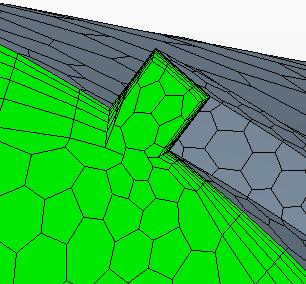
43 Figure 4.3 Surface Mesh a) Initial Surface b) Remeshed Surface Volume Mesh STAR-CCM+ has different types of volume meshing models, such as tetrahedral, polyhedral, trimmed and thin mesher. Different mesh types can be used for different regions based on the desired model. The polyhedral mesh model is selected for generating the core mesh of the grooved tubes. This model provides stable solution for complex mesh generation problems with less number of cells. Therefore, this type of mesh required lowest computational cost, which makes it easier and more efficient to be used as core mesh in comparing with other models. In addition to polyhedral mesher, prism layer model is used to mesh near the wall and boundaries as shown in Figure 4.4. This type of mesh generates orthogonal cells next to the boundaries to allow the solvers to improve the accuracy of the flow solution near the wall. [25] Prism layers help to determine the forces and heat transfer on walls and some effective features on drag and pressure drop such as separation, which greatly enhances the results. Prism layer thickness, number of layers and distribution of the mesh are defined based on the turbulence modeling approach and wall function. In 30
![order to generate prismatic layers in the gaps and corners of small grooves, the expert properties of prism layer are changed from the default mode in STAR-CCM+ [25]. Figure 4.](/docs-images/78/77490284/images/44-0.jpg "4. Volume Mesh of the Grooved Tube 4.3 Physics of Simulation In this CFD study, since the focus of the study is on flow characteristics of water, the solid part of the tube is neglected in all cases.")

44 order to generate prismatic layers in the gaps and corners of small grooves, the expert properties of prism layer are changed from the default mode in STAR-CCM+ [25]. Figure 4.4. Volume Mesh of the Grooved Tube 4.3 Physics of Simulation In this CFD study, since the focus of the study is on flow characteristics of water, the solid part of the tube is neglected in all cases. This assumption has been made by deleting the stainless steel tube part, but by considering the percentage of heat loss. The heat loss is obtained from the experimental study with which the CFD results are validated.the purpose of neglecting the solid part of the tube, is to reduce the computational cost and make the simulation simpler by having one region as a fluid. Water entered the grooved tubes at a constant temperature of 24 C with different mass flow rates. The Reynolds number varies from 4000 to Heat transfer loss occurring between the applied power on the surface and the actual heat picked up by the water flow was 31
45 estimated to be in the neighborhood of 10% heat loss [2]. Therefore, the heat gained by the water inside the tube is calculated by the following energy conservation equation: Q = m f C p (T o T i ) (12) Where: m f : Mass flow rate of water at inlet C p : Specific Heat of water T o : Outlet temperature T i : Inlet temperature Both temperatures are acquired by mass flow average temperature in STAR-CCM+ which typically is calculated over the cross section of the inlet and outlet by consideration of mass flow rate and radial temperature profile at the relevant section. This method provides more accurate average temperature for flow which is called mean bulk temperature [12]. The physics model of liquid water is assumed to be incompressible, turbulent, three dimensional, steady in state and constant in density. Based on the turbulent model, some other related models should be activated too. When these physical models are assigned, they provide relevance to the transport energy and dissipation equations and semi empirical coefficients for the solvers. In this study, a segregated fluid energy model is chosen. In this method, flow equations are solved for velocity and pressure component, respectively, and need less memory space for solving the problem compared to coupled solvers which solve the transport equation simultaneously. This method is appropriate and provides accurate results for incompressible flow or mildly compressible flow [12]. Realizable K-epsilon is one of the eight different k-epsilon models that is provided in STAR-CCM+. Realizable k-epsilon which was developed by Shih et al.[23] contains a new 32
46 formulation of a transport equation for the dissipation rate and works with a two layer approach in STAR-CCM+. This model works considerably better than standard k-epsilon for many applications. Also, one of the advantages of this method is the ability of using an all y+ wall treatment, which is able to correctly resemble near-wall turbulence for a variety of mesh densities. After choosing a physical model, boundary condition and initial value should be set up. Initial value consists of pressure, static temperature and velocity plus turbulent characteristics of the flow. Table 4.2 Material Properties of the Fluid Material Properties ( water at 24 C) Density (kg/m 3 ) Thermal conductivity (W/m-K) 0.58 Specific heat (j-kg/k) Boundary Condition In the STAR-CCM+ boundaries are initially assigned to the surfaces of a region. In this research work there are 3 surface boundaries considered: inlet, outlet and interface. The boundaries and initial condition are set up to capture the physical characteristics of flow accurately. These boundary conditions are: Inlet: The entrance of the grooved tube is considered as a mass flow inlet type. The uniform velocity is entering a channel and this boundary should be chosen when the mass flow rate is known in the problem. The table 4.1 shows the mass flow rate of different Re number. The inlet temperature is considered as constant 24 C. 33
47 Interface: The wall boundary condition is chosen for the tube s internal surface. The slip condition and constant heat flux 3150 w/m 2 are assumed for interface in all cases. Outlet: The boundary is considered as a flow split outlet, but the split ratio is set as 1 and all flow exit through this boundary and pressure is assumed to be at atmospheric pressure. Table 4.3 Inlet Boundary Condition of Grooved Tubes with different Pitch Size (7.1, 12.7, 50, 130) with Constant Inlet Temperature of 24 C Groove tube inlet Mass Flow rate (kg/s) Groove tube inlet Velocity (m/s) Reynolds number
48 CHAPTER 5 RESULTS AND DISCUSSION 5.1 Grid Independence Study Before starting to generate the CFD production runs, a mesh independence study was carried out for the tube with 12.7 (mm) pitch size and 2.0 m length. In a grid independence study, the goal was to find the best mesh properties for accurate solution [24]. The process is to vary the mesh density to eventually provide a desired numerical accuracy for engineering purposes at the same time achieving an optimum computational time. Four different mesh densities were generated for a 12.7 mm (pitch) grooved tube in STAR-CCM+ and models were solved by the software. The final results of some heat transfer variables such as axial velocity and axial temperature were compared with each other in all cases and the results showed small differences by changing the mesh density. Therefore, based on the results, the solution was concluded to be independent of the number of cells. The grid generation started with coarse mesh; then the mesh was refined by dividing the base size by two. The mesh density on inlet cross section for different mesh densities is shown in figure 5.2. By increasing the mesh densities, i.e. number of cells near the groove area, the flow area of the groove is suspected to have potentially a large effect on velocity and temperature profile distributions in the flow. The simulation is solved for a fluid region with the mass flow rate of kg/s (Re=4000) and with constant heat flux of 3150 w/m 2 which was applied on the outer surface of the tube. The coarse mesh has cells, then the number of cells were refined to three other meshes, , , respectively (Table 5.1). Axial velocity and temperature were observed for four cases at radial line probe, which is shown in figure 5.1. The line probe was placed 35
49 on a cross section plane at the distance of 1 meter from the inlet. Axial velocity and temperature values were taken as criterion for grid independence for all cases plotted in figure 5.3 and 5.4. A A Figure 5.1 Schematic Diagram of a Radial Probe Line of A-A on the Cross Section Plane Used for Axial Velocity and Temperature 36


50 Mesh1 Polyhedral mesh Prism Layer Mesh2 Mesh3 Mesh4 Figure 5.2 Different Volume Mesh Used in Grid Independence Study 37
51 Position (mm) Table 5.1 Mesh Properties in Grid Independence Study Mesh Base Size (mm) Number of Prism Layer Mesh1 6 5 Mesh2 4 5 Mesh3 2 5 Mesh4 1 5 Number of Cells CPU Time per Iteration (S) Axial Velocity Profile for Four Different Mesh Axial Velocity (m/s) Figure 5.3 Comparison of Axial Velocity for Four Different Mesh. 38
52 Position (mm) 4 Axial Temperature for Four Different Mesh Axial Temperature (C) Figure 5.4 Comparison of Axial Temperature for Four Different Mesh The axial velocity and temperature at A-A line probe were plotted (Figures 5.3 and 5.4) and the change was observed to be less than 1% by increasing the mesh density between the Mesh 4 and Mesh 3 model. Therefore, any one of these meshes can be chosen, but to save the computational time, the mesh with cells was selected. A special effort has been made, including personal contacts with a CD-Adapco support group for their advice, to include enough mesh detail around the helical groove to ensure flow field and temperature accuracy. 39
53 5.1.1 Wall Y+ for the Grid Model The fluid region in all grooved tubes is modeled as turbulent flow based on Reynolds number ranges between 4000 to Although the Re number range between 4,000-8,000 would theoretically be more in the transitional regime [18] the STAR-CCM+ manual suggests choosing turbulent model for Reynolds greater than 4000 [25]. Recognizing that with this grooved channel geometry the traditional turbulent flow developing length would probably be severely curtailed; and because of the expected tripping of the boundary layer thickness, the flow is expected to be close to the turbulent regime. In STAR-CCM+ manual, it was recommended to use The All y + Wall Treatment for all turbulence models whenever it was available, because it offers the most meshing flexibility. The All y + wall treatment was the default wall treatment method for the chosen model, and realizable k-epsilon turbulent model, and was explained in chapter 3 in detail. The validity of each model can be estimated by analyzing the values of the Wall y + function at every wall boundary [25]. The chosen wall treatment is a hybrid approach that can be used for very fine or very coarse meshes [10]. The wall y+ value for this case study is around 1 as shown in Figure
54 Figure 5.5 Wall Y+ Distribution for chosen Mesh with Cells 5.2 Parameters of the Present Research In the past decades, several studies had been focused on heat transfer augmentation in tubes [16], [11], [22], [26]. The purpose of this research is to provide a predictive method for this type of heat augmentation geometry where a rectangular helical groove is machined on the inside surface of a typical tube. The range of Re numbers considered are from 4000 to and the pitch size is from 7.1 mm to 130 mm. Pitch is defined as the straight distance between each helical turn of the groove inside the tube as shown in Figure 4.2 in chapter 4. The reasons for using a turbulent model have already been discussed in the previous section. A previously experimental study [2] has been found in the literature for comparison and validation purposes. In that study heating is provided by an electric resistor and heat flux can be calculated by measuring current (I) and voltage drop (V) to calculate the electric power provided. Also in that study an estimate of a 10% loss of heat applied to the outside of the test section was made. This knowledge was applied in our study to reduce the actual 41
55 heat flux by 10% as our model did not consider actively modeling the heat flow from the outside of the tube. Thermocouples were used to measure surface temperature at several uniformly distributed locations along the length of the pipe with a typical distance of 250 mm as being the distance between adjacent thermocouples. The mean bulk temperature of the fluid was not strictly calculated as defined in the literature; rather a single temperature measurement at the center of the tube cross-section was used to calculate that temperature. No attempts were made in the experimental study to measure the velocity or temperature transverse distribution. In that study also by knowing the surface temperature and total actual heat flow the average heat transfer coefficient (h) (over the entire surface of the pipe) was calculated by Equation (13) for the experimental study and the current study [2]. With the CFD approach a better estimate is made for the mean bulk temperature and the temperature distribution. h ave = Q A(T ave,w T ave,f ) (13) Following the calculation of h in equation (15) one can calculate the Nusselt number as shown in equation (14). Following the calculation of the Nu number a calculation of the pressure drop follows in the form of a non-dimensional friction factor obtained as shown in equation (15) and comparisons with smooth pipe results can be made. The pressure drop plays an important role in the efficiency of a heat augmentation technique and its relative performance, since it can affect the pumping power and total operating costs [6]. Both equations 14 and 15 were used in the experimental study to calculate Nusselt number and friction factor [2]. 42
56 Nu = h aved i k f = p ( d i L )ρu2 (14) (15) Where: ρ: Water density u : flow velocity of water at the inlet di is the inner diameter of the test tube, μ: is the dynamic viscosity of water. Q: Energy supplied on the surface A = Surface area of the tube L: Tube length T ave,w : Average temperature of the tube surface (inside) T ave,f : Average temperature of inlet and outlet. 5.3 CFD Validation A validation of the numerical code results with experimental data is desirable to ensure that the code is predicting the desired values i.e. Nu and f are predicted with quantitative accuracy. The published experimental results [2] were used for comparison with our CFD data Smooth Tubes Validation The geometric model of a tube with 2 meter length was created in SolidWorks and imported to STAR-CCM+. The grid was generated with 5 prism layers near the wall and 43
57 polyhedral meshes as a core mesh of the plain tube which was explained in chapter 4.2. Boundary conditions and physics of the problem were applied in agreement with the experimental work [2] on stainless steel tubes. A uniform velocity is assumed to enter the tube for different Reynolds numbers ranging from 4000 to In the current work, the CFD Nu number and f were calculated by equation 16 and 17, then, compared to the experimental results [2]. In the paper [2], the average surface temperature over the length of the tube was found by averaging the temperature of eight thermocouples on the tube surface; also the inlet and outlet temperatures were measured at the pipe axial center of these surfaces. Figures 5.6 and 5.7 show the comparison of the CFD results for Nu number and f for the current study and the experimental data [2] for a Re number range from 4000 to The obtained results for Re of 4000 is not well predicted by K-epsilon model since it is transitioning from laminar flow to turbulent flow. For other ranges of Reynolds, the plotted results show good agreement within the error estimates of the experimental data. The error bounds given for the Nu is ±18% and for the f value is ±1%. 44
58 Friction Factor Nusselt Number Nusselt Number as a Function of Re Number for Smooth Tube Nu (CFD) Nu (Experimental) Error=±18% Re 5.6 Comparison of CFD Nusselt Number of a Smooth Tube with Experimental Data Friction Factor as a Function of Re Number for Smooth Tube f (CFD) f (Experimental) Error=±1% Re Figure 5.7 Comparison of CFD Friction Factor of a Smooth Tube with Experimental Data 45
59 5.3.2 Grooved Tubes Validation The tubes with an internal helical groove and pitch distance of 203, 254 and 305mm of the experimental work [2] were considered for validation with the current simulation work. A comparison between the two methods was made by using similar boundary conditions for the CFD work as was provided in the experimental work. In most cases of the current CFD study, results are within the uncertainty of the experimental study which has been shown in Figure 5.8 through Figure 5.12 (±18% for Nu and ±1%). The agreement between experimental results and CFD is considered quantitative and the CFD model can be used for expanding the study for different pitch sizes and Re number ranges. For further investigation of effect of pitch sizes on heat enhancement, four different pitches to diameter ratios were considered. These new ratios are smaller in comparison with the experimental ones to fill in the gaps between the parameters of interest. In general, a better heat enhancement (i.e. higher Nu) is expected with decreasing pitch to diameter as this increases the occurrence of tripping of the boundary layer to try to maintain a smaller thickness of that layer. In the experimental study, the effect of larger pitch size (pitch to diameter ratio P/d =28, 35, 42) was investigated and showed the Nusselt number is increasing with increasing Re number in all cases. The details of heat transfer characteristics are shown for the grooved tube with the pitch size of 203, 254 and 305 (mm) in 5.2, 5.3 and 5.4 tables. Heat transfer coefficient and Nu number show a decreasing trend with increase in the pitch size (i.e. higher P/d values) for the same Re number. The friction factor shows the slight changes. 46
60 Table 5.2 Details of Heat Transfer Characteristics for Grooved Tube with 203 mm Pitch Size Reynolds Number Heat Transfer Nusselt Number Friction Factor for Tube 203 Coefficient Table 5.3 Details of Heat Transfer Characteristics for Grooved Tube with 254 mm Pitch Size Reynolds Number h Nu f for Tube Table 5.4 Details of Heat Transfer Characteristics for Grooved Tube with 305 mm Pitch Size Reynolds Number h Nu f for Tube
61 f Nu 140 Nusselt Number as a Function of Re Number for Grooved Tube with 203 (mm) Pitch Size T 203 (CFD) T 203 (Experiment) Re Figure 5.8 Comparison of CFD and Experimental Nusselt Number for Tube with 203 (mm) Pitch Size 0.06 Friction Factor as a Function of Re Number for Grooved Tube with 203(mm) Pitch Size T 203 (CFD) T 203 (Experiment) Re Figure 5.9 Comparison of CFD and Experimental Friction Factor for Tube with 203 (mm) Pitch Size 48
62 f Nu 160 Nusselt Number as a Function of Re Number for Grooved Tube with 254 (mm) Pitch Size T 254 (CFD) T 254 (experiment) Re Figure 5.10 Comparison of CFD and Experimental Nusselt Number for Tube with 254 (mm) Pitch Size 0.06 Friction Factor as a Function of Re Number for Grooved Tube with 254 (mm) Pitch Size T 254 (CFD) T 254 (Experiment) Re Figure 5.11 Comparison of CFD and Experimental Friction Factor for Tube with 254 (mm) Pitch Size 49
63 f Nu 140 Nusselt Number as a Function of Re Number for Grooved Tube with 305 (mm) Pitch Size T 305 (CFD) T 305 (Experiment) Re Figure 5.12 Comparison of CFD and Experimental Nusselt Number for Tube with 305 (mm) Pitch Size 0.06 Friction Factor as a Function of Re Number for Grooved Tube with 305 (mm) Pitch Size T 305 (CFD) T 305 (Experiment) Re Figure 5.13 Comparison of CFD and Experimental Friction Factor for Tube with 305 (mm) Pitch Size 50
64 5.4 Extended CFD Simulation of Internally Grooved Tubes After the validation of the numerical model was done in the previous sections, the CFD simulation was expanded for tubes with 7.1, 12.7, 50 and 130 (mm) pitch size which amounts to a P/d range between 1 to18 being considered. In the current study, the groove width (e) and height (h) were kept constant, to clarify the effect of pitch size on heat transfer augmentation. As before Nu number and f were presented for those additional runs Nusselt Number (Nu) In the CFD study, the effect of pitch size on Nu number as a function of Re number results for four helical grooved tubes are shown in Figure 5.14 The same constant heat flux of 3150 kw/m2 applied on the tube surface and Re number for each grooved tube is varied from 4000 to 20,000. The heat transfer coefficient h and Nu number were calculated using Equation 16. Figure 5.14 shows that the Nu number increases with Re numbers from 4000 to 20000, and as the pitch distance decreases, indicating as expected, an increase in the frequency of tripping and hence the thinning of the hydrodynamic and thermal boundary layers is also shown. 51
65 Nu 200 Nu Number as a Function of Re Number T T Re T 50 T 130 Smooth Tube Figure 5.14 Nusselt Numbers as a Function of Reynolds Number for Four Different Grooved Tubes (Pitch Size: 7.1, 12.7, 50 and 130 (mm)) and a Smooth Tube Friction Factor (f) f is a non-dimensional parameter calculated to show the variation of the pressure drop as a function of Re ranging between 4000 to using equation 17. Figure 5.15 shows the f values for helical grooved tubes decrease monotonically with increasing Re. The grooves inside these tubes in general will increase flow swirl and potentially recirculation around these grooves leading to a higher f. Also an increase of the f is shown to exist for smaller pitch size values for the same Re due to similar reasons as before [9]. Figure 5.15 is in good agreement with the trends of the Moody diagram which shows that 52
66 f f decreases with increasing Re number. Also as the relative roughness ε/d increases, in the Moody diagram, the value of f increases for the same Re value Friction Factor as a Function of Re Number T T 12.7 T 50 T 130 Smooth Tube Re Figure 5.15 Friction Factor as a Function of Reynolds Number for Four Different Grooved Tubes (Pitch Size: 7.1, 12.7, 50 and 130 (mm)) and a Smooth Tube.. If the ratio of the groove depth to diameter (e/d=0.028) or pipe, assumed pipe roughness is (m) [7] is greater than the thickness of the viscous sub layer, the turbulence effect near the wall, will lead to an increase in pressure drop. Therefore, by decreasing the viscous sublayer thickness and with more disturbance in the flow, the effect of roughness is increasing, so, the friction factors play an important role in heat 53
67 enhancement efficiency [6] [9]. Working with higher Reynolds is not always efficient due to more pumping power and cost Thermal performance Enhanced surface geometry leads to an increase in heat transfer by promoting turbulence in the flow, but in general there is a penalty of increased pressure drop and increased pumping power that comes with it. Therefore to better quantify the heat enhancement efficiency, the thermal factor should be considered [6]. The performances of grooved tubes were investigated in terms of thermal enhancement factor, η, which is the ratio of the Nu number of grooved tubes to a smooth tube over the friction factor ratio of an internally grooved tube to a smooth tube. Figure 5.19 shows the η of the studied cases as a function of Re number. Thermal enhancement factor has different definitions with different authors. Some used heat enhancement coefficient ratio (h/h s ) or Stanton number ratio (St/St s ) instead of Nu number [6].In this study equation 16 is used to evaluate the effect of pitch size on heat enhancement. η = Nu Nus f fs (16) Where: h s : heat transfer coefficient of a smooth tube St s : Stanton number of a smooth tube Nu S : Nusselt of a smooth tube f s : Friction factor of a smooth tube 54
68 First, the heat enhancement factor results of CFD work for tubes with the pitch sizes of 203, 254 and 305 were compared to experimental works [2]. Since, the Nu number and friction factor uncertainty in the study were mentioned to be 18% and 1 % respectively, the Nu number uncertainty can affect the enhancement factor, but the effect of the friction factor uncertainty should not be neglected due to its small magnitude. Therefore, the range of errors reported for the Nusselt number from the experimental study were plotted in Figures 5.16 through 5.18 and compared to CFD enhancement factors. By using an error range of ±18% in the Nu number and considering that this error is random, the range of errors which can be expected to exist in the heat enhancement factor calculation for the experimental data was evaluated. This range is expected to be 32% from calculation of uncertainty of Nusselt number for the reported experiment and is what is shown in the error bars (Figure ). Although, the thermal enhancement factor for the CFD results is lower than 1 in some cases, it still is in the range of uncertainty of the experimental work. After comparing the CFD results with those of the experimental work, the enhancement factors in the current study with different pitch sizes (7.1, 12.7, 50 pitch and 130 additional CFD runs with no experimental data for comparison) were also calculated and are shown in Figure η increases by increasing Reynolds number in the range of 4000 to If the η >=1, it means the increase in heat transfer is more or about the same as the increase in friction factor which indicate that the tube design is efficient to be used for enhancement purposes [22]. Since the highest enhancement factor for all grooved tubes achieved in Re number equal to 15000, the Re of the is a critical point for enhancement factor in the current work. By increasing Re to 20,000 the enhancement 55
69 Thermal Enhancement Factor decreases which indicates the augmentation of heat transfer is not efficient for higher Re due to higher pressure drop [6]. The enhancement observed in all cases, for tubes with smaller pitch size such as 7.1, 12.7 (mm) the factor was higher. Figure 5.19 shows the grooved tube design is efficient for being utilized in heat exchanger devices for heat augmentation. Thermal Enhancement Factor as a Function of Re Number T 203 Experimental T 203 CFD Re Figure Thermal Enhancement Factor for Grooved Tube with 203 (mm) Pitch Size 56
70 Thermal Enhancement Factor Thermal Enhancement Factor Thermal Enhancement Factor as a Function of Re Number T 254 Experimental T 254 CFD Re Figure 5.17 Thermal Enhancement Factor for Grooved Tube with 254 (mm) Pitch Size Thermal Enhancement Factor as a Function of Re Number T 305 CFD T 305 Experimental Re Figure 5.18 Thermal Enhancement Factor for Grooved Tube with 305 (mm) Pitch Size 57
71 Thermal Enhancement Factor 1.4 Thermal Enhancement Factor as a Function of Re Number T 7.1 T 12.7 T 50 T Re Figure 5.19 Thermal Enhancement Factor as a Function of Reynolds Number for Four Grooved Tubes 5.5 Center plane plots of temperature for tube pitch 12.7 In the current study, mean bulk temperature was one of the important parameters to obtain. The thermal contours of the center plane of the tube with a 12.7 mm pitch for various Re numbers are shown in Figures 5.20 through 5.24 along with one plot of the temperature field around the grooved area of the tube in Figure The center plane is along the whole length of the tube and includes the tube axis from inlet to outlet. The inlet temperature is considered a constant at 24 C similar to that of the experimental study. Constant heat flux is assumed to occur along the length of the tube. By increasing the Reynolds number, the mean bulk temperature at the outlet is decreasing (Table 5.5) 58
72 Table 5.5 Average Outlet Temperatures in all cases Reynolds number T o ave 7.1 T o ave 12.7 T o ave 50 T o ave The higher outlet temperatures are expected for lower flow rate to satisfy energy balance. For the given Re numbers and the applied heat flux the average temperature difference was expected to be approximately in the neighborhood of 2.0 C. Figure 5.20 shows the detail of the temperature field near the groove, close to the outlet of the tube, where as expected the higher temperatures are in the transverse direction. Also disruption in thermal boundary layer is shown. Figure 5.20 Center-plane Temperature Profile of Tube with12.7 (mm) Pitch at 4000 Re Number 59
 Pitch Size and Re: 4000 Figure 5.22 Center-plane Temperature Profile of Tube with12.")
73 Figure 5.21 Temperature Profile Near the Groove for Tube with 12.7 (mm) Pitch Size and Re: 4000 Figure 5.22 Center-plane Temperature Profile of Tube with12.7 (mm) Pitch at 6000 Re Number 60
74 Figure 5.23 Center-plane Temperature Profile of Tube with12.7 (mm) Pitch at 8000 Re Number Figure 5.24 Center-plane Temperature Profile of Tube with12.7 (mm) Pitch at Re Number 61
75 5.6 Streamlines for Re number of To visualize the effect of pitch size on the flow pattern, streamlines were plotted for smooth tube and grooved tube with a Re number of Streamlines were plotted along the entire length of the heat exchanger. Figures 5.25 and 5.26 depict the generation of a swirl in the flow inside the tubes. The starting point of this plot is at the inlet of the tube and locations are chosen randomly on the cross-sectional area at the inlet. Streamlines which were observed at the mid center of the tubes are smoother (less wavy) because they were not as affected by the grooves. Since the Re number is the same in all cases, by decreasing the pitch size an increase in the swirl in path lines is noticed and also the velocity magnitude is increased somewhat indicating that there is an increase in the transverse component of the flow, as the average axial velocity should be the same for these cases since the Re number is assumed the same. In cases with larger pitch size such as tubes with 50 and 130 mm, the streamlines were almost parallel such as in a smooth tube and swirl in the flow was not as noticeable. 62
76 Figure 5.25 Streamlines within the Fluid Region in Tube without Groove. Figure Streamlines within the Fluid Region in Tube with 7.1 mm Pitch Size 63
77 Figure 5.27 Streamlines within the Fluid Region in Tube with 12.7 mm Pitch Size Figure 5.28 Streamlines within the Fluid Region in Tube with 50 mm Pitch Size 64
78 Figure 5.29 Streamlines within the Fluid Region in Tube with 130 mm Pitch Size 5.7 Swirl Effect Adding a helical groove generates swirl effect on the flow close to the wall [2]. The vector velocities of [i]+[j] were plotted to show the swirl motion for tube pitches of 7.1 and 12.7 at a cross section plane, which is placed by 1(m) distance from the inlet. The vectors show the rate of change in the position of each volume of cells. Also, the color bar illustrates the magnitude of the speed at each position and the arrow of the vectors point the direction of their movement [25]. Figures 5.30 and 5.31 show the swirl effect which in the experimental study is too complicated to display. For tubes with higher pitch size, the swirl effect is insignificant. 65
79 5.30 Vector Velocity of [i]+[j] at Re of for Tube with 7.1 mm Pitch Size 5.31 Vector Velocity [i]+[j] Direction at Re of for Tube with 12.7 mm Pitch Size 66
80 5.8 Turbulent Kinetic Energy Turbulent Kinetic Energy (TKE) values in the flow field can be considered an indicator of increased turbulence and hence increased heat transfer [8]. An increasingly monotonic value of the average TKE value is observed as a function of increasing Re number. This can be discerned from the maximum TKE values presented in the legend of colors underneath each plot. It has already been revealed that an increased Re is shown to increase the Nu and hence the heat transfer between the tube surface and the bulk of the fluid. In Figures 5.32 through 5.37 the TKE pattern of flow in a tube with 12.7 mm pitch size has been shown for various Re numbers. The turbulence intensity is predicted by the k ε model and in subsequent figures indicates that the peak values are in the downstream region of grooves and the minimum turbulence intensity is observed in the upstream of grooves. The lowest TKE zone is found to be in the core region of the tube flow as would be expected as it is furthest from the wall region. The basic structure of the contours of turbulent kinetic energy remains the same but the scale changes with the change in Reynolds number. It can be seen that the maximum turbulent kinetic energy increases from to 0.20 (j/kg) with an increase in Re number from 4000 to


81 5.32 Contour Plot of TKE for Tube with 12.7 Groove at Re Number of 4000 Figure 5.33 Contour Plot of TKE for Tube with 12.7 Groove at Re Number of

82 Figure 5.34 Contour Plot of TKE for Tube with 12.7 Groove at Re Number of 8000 Figure 5.35 Contour Plot of TKE for Tube with 12.7 Groove at Re Number of
83 Figure 5.36 Contour Plot of TKE for Tube with 12.7 Groove at Re Number of Figure 5.37 Contour Plot of TKE for Tube with 12.7 Groove at Re Number of
84 5.9 Heat Transfer Coefficient Local heat transfer coefficient as calculated by STAR-CCM+ The (local) heat transfer coefficient, which is calculated by the software, is based on the local wall surface temperature of the cell in question and a reference fluid temperature (Tref) used of 24 C, which is the inlet fluid temperature for all runs, as seen in equation 18 : h = q (T wall T ref ) [18] where q is the heat flux and Twall is the temperature of the surface cell directly attached to the wall and Tfluid the reference fluid temperature. The variation of these coefficients is shown in Figures 5.38 to The heat transfer coefficient seems to increase just upstream of the groove location as seen by the red color of the plots This could be partially explained by the anticipated disturbance of the boundary layer in that region leading to more fluid transverse mixing. It is evident from this visual presentation that there is a sudden increase in that value very close to the groove by about a factor of 2 from the heat transfer coefficient values shown between the grooves (green color). This indicates physically the rapid interruption of the local thermal boundary layer in that region and the periodic effect of that pattern over the whole tube. Also it is noticed that with an increase in the Re number, the local heat transfer coefficient increases as indicated by the maximum legend color values of red in these figures. The range of values of this heat transfer coefficient is noted to increase also by increasing Re number in the same grooved tube as shown in the subsequent figures. 71
85 5.38 Local Heat Transfer Coefficient on Surface of the Tube with 12.7 mm Pitch Size at Re Number of 4, Local Heat Transfer Coefficient on Surface of the Tube with 12.7 mm Pitch Size at Re Number of 6,000 72
86 5.40 Local Heat Transfer Coefficient on Surface of the Tube with 12.7 mm Pitch Size at Re Number of 8, Local Heat Transfer Coefficient on Surface of the Tube with 12.7 mm Pitch Size at Re Number of 10,000 73

87 5.42 Local Heat Transfer Coefficient on Surface of the Tube with 12.7 mm Pitch Size at Re Number of 15, Local Heat Transfer Coefficient on Surface of the Tube with 12.7 mm Pitch Size at Re Number of 20,000 74
88 5.9.2 Circumferentially Averaged Value for the Heat Transfer Coefficient In addition to the heat transfer coefficient which was obtained by software, seven axial cross sections (Figure 5.44) were considered along the tube to take another look at the variation of what might be called the circumferential averaged calculated heat transfer coefficient. The same equation 18 was considered again, but instead of Twall, the average temperature of the circumference of each section was inserted in the formula and the mean bulk temperature of each section was calculated by STAR-CCM+ and was substituted as Tfluid. The results are summarized in table 5.6 and 5.7 which indicate that this heat transfer coefficient decreases by increasing the pitch size at the same Re number. Also, the heat transfer coefficient in the grooved tube with same pitch size is increased by increasing the Re. And, it is fairly uniform regardless of their axial position along the pipe for the same Re and pitch as summarized and shown in Table 5.6. and 5.7 and Figure 5. 45, respectively. This could be partially explained by the fact that the helical grooves reduce the developing length distance in these flow situations, since the groove starts from the beginning of the tube length. 75


89 5.44 Schematic Diagram of Cross Sections at Different Axial Position along Different Grooved Tubes. Table 5.6 Calculated Local Heat Transfer for Reynolds of in Grooved Tube with Different Pitch Size (7.1, 12.7, 50 and 130 (mm)) Position (Re Tube 7.1 Tube 12.7 Tube 50 Tube ) z= z= Z= Z= Z= z= z= z=
CFD Analysis of Forced Convection Flow and Heat Transfer in Semi-Circular Cross-Sectioned Micro-Channel
 CFD Analysis of Forced Convection Flow and Heat Transfer in Semi-Circular Cross-Sectioned Micro-Channel *1 Hüseyin Kaya, 2 Kamil Arslan 1 Bartın University, Mechanical Engineering Department, Bartın, Turkey
Department of Mechanical Engineering, VTU, Basveshwar Engineering college, Bagalkot, Karnataka, India
 International Journal of Current Engineering and Technology E-ISSN 2277 4106, P-ISSN 2347 5161 2016 INPRESSCO, All Rights Reserved Available at http://inpressco.com/category/ijcet Research Article Optimization
COMPUTATIONAL FLUID DYNAMICS ANALYSIS OF A V-RIB WITH GAP ROUGHENED SOLAR AIR HEATER
 THERMAL SCIENCE: Year 2018, Vol. 22, No. 2, pp. 963-972 963 COMPUTATIONAL FLUID DYNAMICS ANALYSIS OF A V-RIB WITH GAP ROUGHENED SOLAR AIR HEATER by Jitesh RANA, Anshuman SILORI, Rajesh MAITHANI *, and
Manhar Dhanak Florida Atlantic University Graduate Student: Zaqie Reza
 REPRESENTING PRESENCE OF SUBSURFACE CURRENT TURBINES IN OCEAN MODELS Manhar Dhanak Florida Atlantic University Graduate Student: Zaqie Reza 1 Momentum Equations 2 Effect of inclusion of Coriolis force
Turbulent Boundary Layers & Turbulence Models. Lecture 09
 Turbulent Boundary Layers & Turbulence Models Lecture 09 The turbulent boundary layer In turbulent flow, the boundary layer is defined as the thin region on the surface of a body in which viscous effects
Analysis of the Cooling Design in Electrical Transformer
 Analysis of the Cooling Design in Electrical Transformer Joel de Almeida Mendes E-mail: joeldealmeidamendes@hotmail.com Abstract This work presents the application of a CFD code Fluent to simulate the
A concept for the integrated 3D flow, heat transfer and structural calculation of compact heat exchangers
 Advanced Computational Methods and Experiments in Heat Transfer XIII 133 A concept for the integrated 3D flow, heat transfer and structural calculation of compact heat exchangers F. Yang, K. Mohrlok, U.
CFD Analysis for Thermal Behavior of Turbulent Channel Flow of Different Geometry of Bottom Plate
 International Journal Of Engineering Research And Development e-issn: 2278-067X, p-issn: 2278-800X, www.ijerd.com Volume 13, Issue 9 (September 2017), PP.12-19 CFD Analysis for Thermal Behavior of Turbulent
Laminar flow heat transfer studies in a twisted square duct for constant wall heat flux boundary condition
 Sādhanā Vol. 40, Part 2, April 2015, pp. 467 485. c Indian Academy of Sciences Laminar flow heat transfer studies in a twisted square duct for constant wall heat flux boundary condition RAMBIR BHADOURIYA,
Principles of Convection
 Principles of Convection Point Conduction & convection are similar both require the presence of a material medium. But convection requires the presence of fluid motion. Heat transfer through the: Solid
Chapter 3 NATURAL CONVECTION
 Fundamentals of Thermal-Fluid Sciences, 3rd Edition Yunus A. Cengel, Robert H. Turner, John M. Cimbala McGraw-Hill, 2008 Chapter 3 NATURAL CONVECTION Mehmet Kanoglu Copyright The McGraw-Hill Companies,
EXPERIMENTAL AND NUMERICAL STUDIES OF A SPIRAL PLATE HEAT EXCHANGER
 THERMAL SCIENCE: Year 2014, Vol. 18, No. 4, pp. 1355-1360 1355 EXPERIMENTAL AND NUMERICAL STUDIES OF A SPIRAL PLATE HEAT EXCHANGER by Rangasamy RAJAVEL Department of Mechanical Engineering, AMET University,
ENERGY PERFORMANCE IMPROVEMENT, FLOW BEHAVIOR AND HEAT TRANSFER INVESTIGATION IN A CIRCULAR TUBE WITH V-DOWNSTREAM DISCRETE BAFFLES
 Journal of Mathematics and Statistics 9 (4): 339-348, 2013 ISSN: 1549-3644 2013 doi:10.3844/jmssp.2013.339.348 Published Online 9 (4) 2013 (http://www.thescipub.com/jmss.toc) ENERGY PERFORMANCE IMPROVEMENT,
CFD study for cross flow heat exchanger with integral finned tube
 International Journal of Scientific and Research Publications, Volume 6, Issue 6, June 2016 668 CFD study for cross flow heat exchanger with integral finned tube Zena K. Kadhim *, Muna S. Kassim **, Adel
COMPUTATIONAL FLUID DYNAMICS ANALYSIS ON HEAT TRANSFER AND FRICTION FACTOR CHARACTERISTICS OF A TURBULENT FLOW FOR INTERNALLY GROOVED TUBES
 THERMAL SCIENCE: Year 2013, Vol. 17, No. 4, pp. 1125-1137 1125 COMPUTATIONAL FLUID DYNAMICS ANALYSIS ON HEAT TRANSFER AND FRICTION FACTOR CHARACTERISTICS OF A TURBULENT FLOW FOR INTERNALLY GROOVED TUBES
COMPUTATIONAL FLUID DYNAMICS ON DIFFERENT PASSAGES OVER A PLATE COIL EVAPORATOR FOR 40 LITER STORAGE TYPE WATER COOLER
 Int. J. Mech. Eng. & Rob. Res. 2014 Mukund Y Pande and Atul Patil, 2014 Research Paper ISSN 2278 0149 www.ijmerr.com Vol. 3, No. 4, October 2014 2014 IJMERR. All Rights Reserved COMPUTATIONAL FLUID DYNAMICS
CFD in COMSOL Multiphysics
 CFD in COMSOL Multiphysics Mats Nigam Copyright 2016 COMSOL. Any of the images, text, and equations here may be copied and modified for your own internal use. All trademarks are the property of their respective
TABLE OF CONTENTS CHAPTER TITLE PAGE
 v TABLE OF CONTENTS CHAPTER TITLE PAGE TABLE OF CONTENTS LIST OF TABLES LIST OF FIGURES LIST OF SYMBOLS LIST OF APPENDICES v viii ix xii xiv CHAPTER 1 INTRODUCTION 1.1 Introduction 1 1.2 Literature Review
Comparative Analysis of Heat Transfer and Friction Characteristics in a Corrugated Tube
 International Journal of Current Engineering and Technology E-ISSN 2277 416, P-ISSN 2347 5161 216 INPRESSCO, All Rights Reserved Available at http://inpressco.com/category/ijcet Research Article Comparative
Numerical Methods in Aerodynamics. Turbulence Modeling. Lecture 5: Turbulence modeling
 Turbulence Modeling Niels N. Sørensen Professor MSO, Ph.D. Department of Civil Engineering, Alborg University & Wind Energy Department, Risø National Laboratory Technical University of Denmark 1 Outline
Numerical analysis of fluid flow and heat transfer in 2D sinusoidal wavy channel
 Numerical analysis of fluid flow and heat transfer in 2D sinusoidal wavy channel Arunanshu Chakravarty 1* 1 CTU in Prague, Faculty of Mechanical Engineering, Department of Process Engineering,Technická
C ONTENTS CHAPTER TWO HEAT CONDUCTION EQUATION 61 CHAPTER ONE BASICS OF HEAT TRANSFER 1 CHAPTER THREE STEADY HEAT CONDUCTION 127
 C ONTENTS Preface xviii Nomenclature xxvi CHAPTER ONE BASICS OF HEAT TRANSFER 1 1-1 Thermodynamics and Heat Transfer 2 Application Areas of Heat Transfer 3 Historical Background 3 1-2 Engineering Heat
Fluid Flow and Heat Transfer Characteristics in Helical Tubes Cooperating with Spiral Corrugation
 Available online at www.sciencedirect.com Energy Procedia 17 (2012 ) 791 800 2012 International Conference on Future Electrical Power and Energy Systems Fluid Flow and Heat Transfer Characteristics in
Numerical simulation of fluid flow in a monolithic exchanger related to high temperature and high pressure operating conditions
 Advanced Computational Methods in Heat Transfer X 25 Numerical simulation of fluid flow in a monolithic exchanger related to high temperature and high pressure operating conditions F. Selimovic & B. Sundén
Design of Test Section for Coriolis Rig and Numerical Simulation of Cooling Flow Through Test Section
 University Turbine Systems Research (UTSR) Industrial Fellowship Program 2012 Design of Test Section for Coriolis Rig and Numerical Simulation of Cooling Flow Through Test Section Prepared For: Solar Turbines,
HEAT TRANSFER ENHANCEMENT IN HEAT EXCHANGER USING TANGENTIAL INJECTOR TYPE SWIRL GENERATOR
 HEAT TRANSFER ENHANCEMENT IN HEAT EXCHANGER USING TANGENTIAL INJECTOR TYPE SWIRL GENERATOR Hanumant Jagdale Department of Mechanical Engineering, MIT, Aurangabad, India Subhash Lahane Department of Mechanical
A Simplified Numerical Analysis for the Performance Evaluation of Intercooler
 , pp.34-38 http://dx.doi.org/10.14257/astl.2013.41.09 A Simplified Numerical Analysis for the Performance Evaluation of Intercooler Vashahi Foad, Myungjae Lee, Jintaek Kim, Byung Joon Baek* School of Mechanical
INTERNATIONAL JOURNAL OF SCIENTIFIC & TECHNOLOGY RESEARCH VOLUME 5, ISSUE 09, SEPTEMBER 2016 ISSN
 Numerical Analysis Of Heat Transfer And Fluid Flow Characteristics In Different V-Shaped Roughness Elements On The Absorber Plate Of Solar Air Heater Duct Jitesh Rana, Anshuman Silori, Rohan Ramola Abstract:
Keywords: Spiral plate heat exchanger, Heat transfer, Nusselt number
 EXPERIMENTAL AND NUMERICAL STUDIES OF A SPIRAL PLATE HEAT EXCHANGER Dr.RAJAVEL RANGASAMY Professor and Head, Department of Mechanical Engineering Velammal Engineering College,Chennai -66,India Email:rajavelmech@gmail.com
CFD in Heat Transfer Equipment Professor Bengt Sunden Division of Heat Transfer Department of Energy Sciences Lund University
 CFD in Heat Transfer Equipment Professor Bengt Sunden Division of Heat Transfer Department of Energy Sciences Lund University email: bengt.sunden@energy.lth.se CFD? CFD = Computational Fluid Dynamics;
Numerical Analysis of Helical Coil Heat Exchanger in the Light of Waste Heat Recovery Applications
 Numerical Analysis of Helical Coil Heat Exchanger in the Light of Waste Heat Recovery Applications Mukesh Sharma 1, Jagdeesh Saini 2 1 M-Tech Student, 2 Assistant Professor B M College of Technology, Indore,
Analysis of Heat Transfer in Pipe with Twisted Tape Inserts
 Proceedings of the 2 nd International Conference on Fluid Flow, Heat and Mass Transfer Ottawa, Ontario, Canada, April 30 May 1, 2015 Paper No. 143 Analysis of Heat Transfer in Pipe with Twisted Tape Inserts
Heat Transfer Enhancement Using a Rotating Twisted Tape Insert
 Journal of Modern Science and Technology Vol. 3. No. 1. March 2015 Issue. Pp. 263 271 Heat Transfer Enhancement Using a Rotating Twisted Tape Insert Al Amin 1, Zunayed Mahmud 2, Nafis Bin Islam 2, Lutfor
Flow and Heat Transfer Profiles in a Square Channel with 45 V-Downstream Orifices
 Journal of Mathematics and Statistics Original Research Paper Flow and Heat Transfer Profiles in a Square Channel with 45 V-Downstream Orifices 1 Withada Jedsadaratanachai and 2 Amnart Boonloi 1 Department
ENHANCEMENT OF HEAT TRANSFER FOR AIR FLOW THROUGH A DUCT WITH VARIOUS RIBS
 International Journal of Mechanical and Production Engineering Research and Development (IJMPERD) ISSN(P): 2249-6890; ISSN(E): 2249-8001 Vol. 5, Issue 5, Oct 2015, 71-80 TJPRC Pvt. Ltd. ENHANCEMENT OF
NUMERICAL HEAT TRANSFER ENHANCEMENT IN SQUARE DUCT WITH INTERNAL RIB
 NUMERICAL HEAT TRANSFER ENHANCEMENT IN SQUARE DUCT WITH INTERNAL RIB University of Technology Department Mechanical engineering Baghdad, Iraq ABSTRACT - This paper presents numerical investigation of heat
An Overview of Impellers, Velocity Profile and Reactor Design
 An Overview of s, Velocity Profile and Reactor Design Praveen Patel 1, Pranay Vaidya 1, Gurmeet Singh 2 1 Indian Institute of Technology Bombay, India 1 Indian Oil Corporation Limited, R&D Centre Faridabad
International Journal of Scientific & Engineering Research, Volume 6, Issue 5, May ISSN
 International Journal of Scientific & Engineering Research, Volume 6, Issue 5, May-2015 28 CFD BASED HEAT TRANSFER ANALYSIS OF SOLAR AIR HEATER DUCT PROVIDED WITH ARTIFICIAL ROUGHNESS Vivek Rao, Dr. Ajay
Convective Heat Transfer and Thermal Performance in a Circular Tube Heat Exchanger Inserted with U-Shaped Baffle
 Journal of Mathematics and Statistics Original Research Paper Convective Heat Transfer and Thermal Performance in a Circular Tube Heat Exchanger Inserted with U-Shaped Baffle 1 Amnart Boonloi and 2 Withada
Optimization of Shell & Tube Heat Exchanger by Baffle Inclination & Baffle Cut
 Optimization of Shell & Tube Heat Exchanger by Baffle Inclination & Baffle Cut Joemer.C.S 1, Sijo Thomas 2, Rakesh.D 3, Nidheesh.P 4 B.Tech Student, Dept. of Mechanical Engineering, Toc H Institute of
Table of Contents. Preface... xiii
 Preface... xiii PART I. ELEMENTS IN FLUID MECHANICS... 1 Chapter 1. Local Equations of Fluid Mechanics... 3 1.1. Forces, stress tensor, and pressure... 4 1.2. Navier Stokes equations in Cartesian coordinates...
IJSRD - International Journal for Scientific Research & Development Vol. 4, Issue 05, 2016 ISSN (online):
:") IJSRD - International Journal for Scientific Research & Development Vol. 4, Issue 05, 2016 ISSN (online): 2321-0613 Performance of Rectangular Baffle Plate Shell and Tube Heat Exchanger using Computational
IJSRD - International Journal for Scientific Research & Development Vol. 4, Issue 05, 2016 ISSN (online): 2321-0613 Performance of Rectangular Baffle Plate Shell and Tube Heat Exchanger using Computational
COMPUTATIONAL SIMULATION OF THE FLOW PAST AN AIRFOIL FOR AN UNMANNED AERIAL VEHICLE
 COMPUTATIONAL SIMULATION OF THE FLOW PAST AN AIRFOIL FOR AN UNMANNED AERIAL VEHICLE L. Velázquez-Araque 1 and J. Nožička 2 1 Division of Thermal fluids, Department of Mechanical Engineering, National University
The effect of geometric parameters on the head loss factor in headers
 Fluid Structure Interaction V 355 The effect of geometric parameters on the head loss factor in headers A. Mansourpour & S. Shayamehr Mechanical Engineering Department, Azad University of Karaj, Iran Abstract
Heat Transfer Enhancement with Different Square Jagged Twisted Tapes and CuO Nano fluid
 Heat Transfer Enhancement with Different Square Jagged Twisted Tapes and CuO Nano fluid 1 Krishna S. Borate, 2 A.V. Gawandare, 3 P.M. Khanwalkar 1,2,3 Department of Mechanical Engineering, Sinhgad College
Australian Journal of Basic and Applied Sciences. Heat transfer enhancement of laminar flow in a circular tube using Swirl / vortex generator
 AENSI Journals Australian Journal of Basic and Applied Sciences ISSN:1991-8178 Journal home page: www.ajbasweb.com Heat transfer enhancement of laminar flow in a circular tube using Swirl / vortex generator
COMPUTATIONAL FLOW ANALYSIS THROUGH A DOUBLE-SUCTION IMPELLER OF A CENTRIFUGAL PUMP
 Proceedings of the Fortieth National Conference on Fluid Mechanics and Fluid Power December 12-14, 2013, NIT Hamirpur, Himachal Pradesh, India FMFP2013_141 COMPUTATIONAL FLOW ANALYSIS THROUGH A DOUBLE-SUCTION
Journal of Engineering Research and Studies E-ISSN
 Research Article EXPERIMENTAL AND COMPUTATIONAL ANALYSIS AND OPTIMIZATION FOR HEAT TRANSFER THROUGH FINS WITH DIFFERENT TYPES OF NOTCH S.H. Barhatte 1, M. R. Chopade 2, V. N. Kapatkar 3 Address for Correspondence
fluid mechanics as a prominent discipline of application for numerical
 1. fluid mechanics as a prominent discipline of application for numerical simulations: experimental fluid mechanics: wind tunnel studies, laser Doppler anemometry, hot wire techniques,... theoretical fluid
CHAPTER 4 OPTIMIZATION OF COEFFICIENT OF LIFT, DRAG AND POWER - AN ITERATIVE APPROACH
 82 CHAPTER 4 OPTIMIZATION OF COEFFICIENT OF LIFT, DRAG AND POWER - AN ITERATIVE APPROACH The coefficient of lift, drag and power for wind turbine rotor is optimized using an iterative approach. The coefficient
Detailed Outline, M E 320 Fluid Flow, Spring Semester 2015
 Detailed Outline, M E 320 Fluid Flow, Spring Semester 2015 I. Introduction (Chapters 1 and 2) A. What is Fluid Mechanics? 1. What is a fluid? 2. What is mechanics? B. Classification of Fluid Flows 1. Viscous
Heat and Mass Transfer Prof. S.P. Sukhatme Department of Mechanical Engineering Indian Institute of Technology, Bombay
 Heat and Mass Transfer Prof. S.P. Sukhatme Department of Mechanical Engineering Indian Institute of Technology, Bombay Lecture No. 18 Forced Convection-1 Welcome. We now begin our study of forced convection
Numerical and Experimental Investigation of Heat Transfer Using Discrete Ribs
 Numerical and Experimental Investigation of Heat Transfer Using Discrete Ribs #1 Sandip T.Jadhav, #2 R. D. Shelke, #3 H. N. Deshpande #1 Research scholar, Department of Mechanical Engineering, PES s MCOE,SavitribaiPhule
Calculations on a heated cylinder case
 Calculations on a heated cylinder case J. C. Uribe and D. Laurence 1 Introduction In order to evaluate the wall functions in version 1.3 of Code Saturne, a heated cylinder case has been chosen. The case
Numerical investigation on turbulent forced convection and heat transfer characteristic in spirally semicircle-grooved tube
 Promthaisong et al. International Journal of Mechanical and Materials Engineering (2016) 11:9 DOI 10.1186/s40712-016-0062-2 ORIGINAL ARTICLE Numerical investigation on turbulent forced convection and heat
A CFD Analysis Of A Solar Air Heater Having Triangular Rib Roughness On The Absorber Plate
 International Journal of ChemTech Research CODEN( USA): IJCRGG ISSN : 0974-4290 Vol.5, No.2, pp 964-971, April-June 2013 ICGSEE-2013[14th 16th March 2013] International Conference on Global Scenario in
UNIT II CONVECTION HEAT TRANSFER
 UNIT II CONVECTION HEAT TRANSFER Convection is the mode of heat transfer between a surface and a fluid moving over it. The energy transfer in convection is predominately due to the bulk motion of the fluid
EVALUATION OF FOUR TURBULENCE MODELS IN THE INTERACTION OF MULTI BURNERS SWIRLING FLOWS
 EVALUATION OF FOUR TURBULENCE MODELS IN THE INTERACTION OF MULTI BURNERS SWIRLING FLOWS A Aroussi, S Kucukgokoglan, S.J.Pickering, M.Menacer School of Mechanical, Materials, Manufacturing Engineering and
Convective Mass Transfer
 Convective Mass Transfer Definition of convective mass transfer: The transport of material between a boundary surface and a moving fluid or between two immiscible moving fluids separated by a mobile interface
FLUID FLOW AND HEAT TRANSFER INVESTIGATION OF PERFORATED HEAT SINK UNDER MIXED CONVECTION 1 Mr. Shardul R Kulkarni, 2 Prof.S.Y.
 FLUID FLOW AND HEAT TRANSFER INVESTIGATION OF PERFORATED HEAT SINK UNDER MIXED CONVECTION 1 Mr. Shardul R Kulkarni, 2 Prof.S.Y.Bhosale 1 Research scholar, 2 Head of department & Asst professor Department
Computational Fluid Dynamics of Parallel Flow Heat Exchanger
 International Journal of Sciences: Basic and Applied Research (IJSBAR) ISSN 2307-4531 (Print & Online) http://gssrr.org/index.php?journal=journalofbasicandapplied ---------------------------------------------------------------------------------------------------------------------------
Numerical Investigation of Convective Heat Transfer in Pin Fin Type Heat Sink used for Led Application by using CFD
 GRD Journals- Global Research and Development Journal for Engineering Volume 1 Issue 8 July 2016 ISSN: 2455-5703 Numerical Investigation of Convective Heat Transfer in Pin Fin Type Heat Sink used for Led
OPTIMAL DESIGN OF CLUTCH PLATE BASED ON HEAT AND STRUCTURAL PARAMETERS USING CFD AND FEA
 International Journal of Mechanical Engineering and Technology (IJMET) Volume 9, Issue 5, May 2018, pp. 717 724, Article ID: IJMET_09_05_079 Available online at http://www.iaeme.com/ijmet/issues.asp?jtype=ijmet&vtype=9&itype=5
Coupling Physics. Tomasz Stelmach Senior Application Engineer
 Coupling Physics Tomasz Stelmach Senior Application Engineer Agenda Brief look @ Multiphysics solution What is new in R18 Fluent Maxwell coupling wireless power transfer Brief look @ ANSYS Multiphysics
A REVIEW OF HEAT TRANSFER AND LAMINAR FLOW IN A MICROCHANNEL
 A REVIEW OF HEAT TRANSFER AND LAMINAR FLOW IN A MICROCHANNEL Mohit Kumar 1, Rajesh kumar 2 1 Department of Mechanical Engineering, NIT Kurukshetra, India 2 Assistant Professor, Department of Mechanical
Estimation of Heat Transfer in Internally Micro Finned Tube
 Page9 Estimation of Heat Transfer in Internally Micro Finned Tube B. Usha Rani* and P.S. Kishore** * M.E Thermal, Department of Mechanical Engineering, College of Engineering (A), Andhra University **Professor,
WALL ROUGHNESS EFFECTS ON SHOCK BOUNDARY LAYER INTERACTION FLOWS
 ISSN (Online) : 2319-8753 ISSN (Print) : 2347-6710 International Journal of Innovative Research in Science, Engineering and Technology An ISO 3297: 2007 Certified Organization, Volume 2, Special Issue
EVALUATION OF THERMAL PERFORMANCE OF CONE SHAPED HELICAL COIL HEAT EXCHANGER BY USING CFD ANALYSIS
 EVALUATION OF THERMAL PERFORMANCE OF CONE SHAPED HELICAL COIL HEAT EXCHANGER BY USING CFD ANALYSIS DR. B. JAYACHANDRAIAH Prof of M.E & Vice-Principal Sri Kalahasteeswara Institute of Technology (S.K.I.T),
FLOW MALDISTRIBUTION IN A SIMPLIFIED PLATE HEAT EXCHANGER MODEL - A Numerical Study
 FLOW MALDISTRIBUTION IN A SIMPLIFIED PLATE HEAT EXCHANGER MODEL - A Numerical Study Nityanand Pawar Mechanical Engineering, Sardar Patel College of Engineering, Mumbai, Maharashtra, India nitya.pawar@gmail.com
CHAPTER 7 NUMERICAL MODELLING OF A SPIRAL HEAT EXCHANGER USING CFD TECHNIQUE
 CHAPTER 7 NUMERICAL MODELLING OF A SPIRAL HEAT EXCHANGER USING CFD TECHNIQUE In this chapter, the governing equations for the proposed numerical model with discretisation methods are presented. Spiral
Heat Augmentation Using Non-metallic Flow Divider Type Inserts in Forced Convection
 IOSR Journal of Mechanical and Civil Engineering (IOSR-JMCE) e-issn: 2278-1684,p-ISSN: 2320-334X PP. 62-67 www.iosrjournals.org Heat Augmentation Using Non-metallic Flow Divider Type Inserts in Forced
Chapter 10: Boiling and Condensation 1. Based on lecture by Yoav Peles, Mech. Aero. Nuc. Eng., RPI.
 Chapter 10: Boiling and Condensation 1 1 Based on lecture by Yoav Peles, Mech. Aero. Nuc. Eng., RPI. Objectives When you finish studying this chapter, you should be able to: Differentiate between evaporation
Heat and Mass Transfer Unit-1 Conduction
 1. State Fourier s Law of conduction. Heat and Mass Transfer Unit-1 Conduction Part-A The rate of heat conduction is proportional to the area measured normal to the direction of heat flow and to the temperature
Experimental studies on hydrodynamic behaviour of flow through a tube with TRIANGULAR WAVY TAPES. Bachelor of Technology in Chemical Engineering
 Experimental studies on hydrodynamic behaviour of flow through a tube with TRIANGULAR WAVY TAPES A thesis submitted in partial fulfilment of the requirement for the degree of Bachelor of Technology in
Effect of roughness shape on heat transfer and flow friction characteristics of solar air heater with roughened absorber plate
 Advanced Computational Methods in Heat Transfer IX 43 Effect of roughness shape on heat transfer and flow friction characteristics of solar air heater with roughened absorber plate A. Chaube 1, P. K. Sahoo
INTERNATIONAL JOURNAL OF APPLIED ENGINEERING RESEARCH, DINDIGUL Volume 2, No 1, 2011
 Experimental and Numerical comparison between the performance of Helical cone coils and ordinary helical coils used as dehumidifier for humidification dehumidification in desalination units Abo Elazm M.M.
SIMULATION OF FIN GEOMETRIES FOR HEAT SINK IN FORCED CONVECTION FLOW
 SIMULATION OF FIN GEOMETRIES FOR HEAT SINK IN FORCED CONVECTION FLOW Vinod Kumar 1, Veerbhadrappa.T 2 1 Department of Mechanical engineering, Alpha College of engineering- 562149. Karnataka, India 2 Department
Table of Contents. Foreword... xiii. Preface... xv
 Table of Contents Foreword.... xiii Preface... xv Chapter 1. Fundamental Equations, Dimensionless Numbers... 1 1.1. Fundamental equations... 1 1.1.1. Local equations... 1 1.1.2. Integral conservation equations...
Computational Fluid Dynamics Based Analysis of Angled Rib Roughened Solar Air Heater Duct
 Research Article International Journal of Thermal Technologies ISSN 2277-4114 2013 INPRESSCO. All Rights Reserved. Available at http://inpressco.com/category/ijtt Computational Fluid Dynamics Based Analysis
Heat Transfer Analysis of a Helical Coil Heat Exchanger by using CFD Analysis
 International Journal of Computational Science, Mathematics and Engineering Volume. 3, Issue. 5, 2016 ISSN-2349-8439 Heat Transfer Analysis of a Helical Coil Heat Exchanger by using CFD Analysis Dr. B.Jayachandraiah
Keywords - Gas Turbine, Exhaust Diffuser, Annular Diffuser, CFD, Numerical Simulations.
 Numerical Investigations of PGT10 Gas Turbine Exhaust Diffuser Using Hexahedral Dominant Grid Vaddin Chetan, D V Satish, Dr. Prakash S Kulkarni Department of Mechanical Engineering, VVCE, Mysore, Department
Introduction to ANSYS FLUENT
 Lecture 6 Turbulence 14. 0 Release Introduction to ANSYS FLUENT 1 2011 ANSYS, Inc. January 19, 2012 Lecture Theme: Introduction The majority of engineering flows are turbulent. Successfully simulating
Numerical Analysis of a Helical Coiled Heat Exchanger using CFD
 International Journal of Thermal Technologies ISSN 2277-4114 213 INPRESSCO. All Rights Reserved. Available at http://inpressco.com/category/ijtt Research Article Numerical Analysis of a Helical Coiled
Conjugate Heat Transfer Simulation of Internally Cooled Gas Turbine Vane
 Conjugate Heat Transfer Simulation of Internally Cooled Gas Turbine Vane V. Esfahanian 1, A. Shahbazi 1 and G. Ahmadi 2 1 Department of Mechanical Engineering, University of Tehran, Tehran, Iran 2 Department
International Journal of Advanced Engineering Technology E-ISSN
 Research Article EFFECT OF ROUGHNESS ELEMENT PITCH ON HEAT TRANSFER AND FRICTION CHARACTERISTICS OF ARTIFICIALLY ROUGHENED SOLAR AIR HEATER DUCT Aman Soi*, Ranjit Singh, Brij Bhushan Address for Correspondence
LAMINAR FORCED CONVECTION HEAT TRANSFER IN HELICAL COILED TUBE HEAT EXCHANGERS
 LAMINAR FORCED CONVECTION HEAT TRANSFER IN HELICAL COILED TUBE HEAT EXCHANGERS Hesam Mirgolbabaei ia, Hessam Taherian b a Khajenasir University of Technology, Department of Mechanical Engineering, Tehran,
CFD Analysis of High Temperature and High Velocity System: Plasma Torch
 CFD Analysis of High Temperature and High Velocity System: Plasma Torch Abhishek Pratap Singh Bhadauria 1 1 Department of Mechanical Engineering, K. J. Somaiya College of Engineering, Mumbai, Maharashtra,
DEVELOPMENT OF CFD MODEL FOR A SWIRL STABILIZED SPRAY COMBUSTOR
 DRAFT Proceedings of ASME IMECE: International Mechanical Engineering Conference & Exposition Chicago, Illinois Nov. 5-10, 2006 IMECE2006-14867 DEVELOPMENT OF CFD MODEL FOR A SWIRL STABILIZED SPRAY COMBUSTOR
STAR-CCM+ and SPEED for electric machine cooling analysis
 STAR-CCM+ and SPEED for electric machine cooling analysis Dr. Markus Anders, Dr. Stefan Holst, CD-adapco Abstract: This paper shows how two well established software programs can be used to determine the
LAMINAR FLOW FORCED CONVECTION HEAT TRANSFER BEHAVIOR OF PHASE CHANGE MATERIAL FLUID IN STRAIGHT AND STAGGERED PIN MICROCHANNELS.
 LAMINAR FLOW FORCED CONVECTION HEAT TRANSFER BEHAVIOR OF PHASE CHANGE MATERIAL FLUID IN STRAIGHT AND STAGGERED PIN MICROCHANNELS A Thesis by SATYANARAYANA KONDLE Submitted to the Office of Graduate Studies
ABSTRACT I. INTRODUCTION
 2016 IJSRSET Volume 2 Issue 4 Print ISSN : 2395-1990 Online ISSN : 2394-4099 Themed Section: Engineering and Technology Analysis of Compressible Effect in the Flow Metering By Orifice Plate Using Prasanna
IMPROVING THE HEAT TRANSFER CHARACTERISTICS OF THE SPIKY CENTRAL RECEIVER AIR PRE-HEATER (SCRAP) USING HELICALLY SWIRLED FINS
 USING HELICALLY SWIRLED FINS") IMPROVING THE HEAT TRANSFER CHARACTERISTICS OF THE SPIKY CENTRAL RECEIVER AIR PRE-HEATER (SCRAP) USING HELICALLY SWIRLED FINS Dewald Grobbelaar 1, Matti Lubkoll 2, Theodor W von Backström 3 1 Solar Thermal
IMPROVING THE HEAT TRANSFER CHARACTERISTICS OF THE SPIKY CENTRAL RECEIVER AIR PRE-HEATER (SCRAP) USING HELICALLY SWIRLED FINS Dewald Grobbelaar 1, Matti Lubkoll 2, Theodor W von Backström 3 1 Solar Thermal
Numerical Study of the Three-dimensional Flow in a Flat Plate Solar Collector with Baffles
 Numerical Study of the Three-dimensional Flow in a Flat Plate Solar Collector with Baffles M.A. AMRAOUI a, K. ALIANE b a. Department of Mechanical Engineering, Faculty of Technology, University of Tlemcen,
Numerical Investigation on Turbulent Forced Convection in Heating Channel Inserted with Discrete V-Shaped Baffles
 Journal of Mathematics and Statistics Original Research Paper Numerical Investigation on Turbulent Forced Convection in Heating Channel Inserted with Discrete V-Shaped Baffles 1 Amnart Boonloi and 2 Withada
Lecture 30 Review of Fluid Flow and Heat Transfer
 Objectives In this lecture you will learn the following We shall summarise the principles used in fluid mechanics and heat transfer. It is assumed that the student has already been exposed to courses in
Increase Productivity Using CFD Analysis
 Increase Productivity Using CFD Analysis CFD of Process Engineering Plants for Performance Estimation and Redesign Vinod Taneja Vidhitech Solutions Abhishek Jain abhishek@zeusnumerix.com +91 9819009836
CENG 501 Examination Problem: Estimation of Viscosity with a Falling - Cylinder Viscometer
 CENG 501 Examination Problem: Estimation of Viscosity with a Falling - Cylinder Viscometer You are assigned to design a fallingcylinder viscometer to measure the viscosity of Newtonian liquids. A schematic
The Effect of Solid and Perforated Pin Fin on the Heat Transfer Performance of Finned Tube Heat Exchanger
 International Journal of Energy Engineering 2018, 8(1): 1-11 DOI: 10.5923/j.ijee.20180801.01 The Effect of Solid and Perforated Pin Fin on the Heat Transfer Performance of Finned Tube Heat Exchanger Nabil
Studies on flow through and around a porous permeable sphere: II. Heat Transfer
 Studies on flow through and around a porous permeable sphere: II. Heat Transfer A. K. Jain and S. Basu 1 Department of Chemical Engineering Indian Institute of Technology Delhi New Delhi 110016, India
Cooling of a multi-chip power module
 Cooling of a multi-chip power module G. CAMMARAA, G. PERONE Department of Industrial Engineering University of Catania Viale A. Doria 6, 953 Catania IALY gcamma@dii.unict.it, gpetrone@dii.unict.it Abstract: