1 Instructions for Writing Reports (Examples in Appendix A)
|
|
|
- Prosper Dickerson
- 6 years ago
- Views:
Transcription
1 1 Instructions for Writing Reports (Examples in Appendix A) 1.1 Introduction Engineers must be able to document and communicate their ideas. It is not uncommon for engineers to spend between % of their time writing and preparing presentations. Given the quantity and importance of this activity, we require both formal courses in writing (English 316, "Technical Writing") as well as writing experiences across the curriculum. It is assumed that students enter the engineering curriculum with an understanding of fundamental writing skills such as proper sentence structure, grammar and spelling. These skills are learned in high school and reinforced in the Freshman English course. General technical writing skills are taught in English 316. This course provides students with rules and conventions unique to technical writing which are extremely important, but it does not offer enough writing opportunities for most students to feel comfortable and become proficient. Within the mechanical engineering curriculum, our goal is to continue learning by regular practice with appropriate feedback. In reality, good writing is a lifelong pursuit. You will be provided with several opportunities to write, usually in the form of lab reports or team project reports. Reports are often written in groups but individual reports will also be required. It is important that students not avoid writing opportunities by letting others do all the writing. Take advantage of each writing assignment and expect feedback on your writing ability. Over a period of time and through several assignments, you will gain an appreciation for what constitutes good writing. On the job, engineers will face a variety of writing challenges. These may range from promotional advertising-type literature to formal reports detailing years of engineering research or development. All reports, however, tend to be composed of the elements listed in the table below. A brief explanation of each element follows in the section on "Elements of Technical Reports." The department has selected three report formats to be used in mechanical engineering courses to maintain consistency from class to class and to prepare students for report writing in industry. These formats also fit nicely into the learning goals of the courses where they will be used. They are made up of subsets of the entire list of elements shown the table. The three report formats are, 1) The Formal Report, 2) The Summary Report, and 3) The Memo Report. These report formats are not completely standardized in industry; in fact, it is likely that the company you work for will employ a format consisting of portions and combinations of each of these formats, but the basic elements will be the same. The objective of this section of the undergraduate guide is to briefly describe and give examples of these formats. Following a general description of each of the elements listed in the table, a description of each of the report formats will be given. Each format is illustrated by example in Appendix A.
2 Table 1. Elements of a technical report and those elements expected in BYU Formal, Summary, and Memo reports. Report Element Formal Report Summary Report Memo Report Title Page X X Abstract X X X Table of Contents 0 0 List of Figures 0 0 List of Tables 0 0 List of Symbols 0 0 Introduction X X Objectives X 0 Theory and Background X 0 Method X X Results X X Discussion of Results X X Conclusions X X Recommendations X 0 Acknowledgements 0 0 List of References X X X Include 0 Do not include 1.2 Elements of Technical Reports Title Page: The title page should include the title, authors, and date. It may also include a statement of who the report is written for or give other identifying information. Abstract: The abstract gives a short summary of the report. It should be the most carefully written section as it is often the only section many readers will look at. The abstract needs to convey as much of the information from the report as possible in one or two paragraphs. Abstracts are usually words in length. An abstract contains one or two sentences describing the method and procedure and then three or four sentences each for the results and conclusions. The abstract should summarize results which are discussed in the report but should not introduce any new information. Table of Contents: A table of contents is used in formal reports when the length reaches a limit of approximately 10 pages. The table of contents does not list the title page, the abstract, or the table of contents page(s). Page numbering begins with lower case Roman numerals (i, ii, iii,...) on the first page following the abstract and begins again on the first page of the introduction with Arabic numerals (1, 2, 3...). The headings in the table of contents should match the headings of chapters and sections, word-for-word. List of Figures and Tables: Reports which are long enough to require a Table of Contents usually also require a list of Figures and Tables. The Figure and Table Captions are given in the
3 "List of Figures" and "List of Tables" pages, word-for-word as they appear in the text along with their page numbers. List of Symbols or Nomenclature: When the use of symbols is extensive in the text, a list of symbols is often provided. This list should be in alphabetical order with Arabic symbols followed by Greek symbols in one column and a brief description of the meaning in a second column. Units are also often provided as a way of providing additional explanation for the meaning of the symbol. Introduction: The introduction serves the purpose of capturing the reader's interest by describing the importance of the work to be reported. The introduction should start with broad general information that is familiar to everyone and narrow to the specific topic of the report. The reader should be able to relate the information in the report, which may possibly be a new topic, to a problem that is easily understood and recognized. The introduction often leads naturally into the objective. Objective(s): The objectives represent the goals to be accomplished by the authors. If there is one central objective, a single concise and carefully worded sentence at the end of the introduction is sufficient. This is often called the objective statement. When the overall objective can be broken down into several smaller objectives, a separate section of the report on objectives is appropriate. When multiple objectives are needed, a list of objectives is often used. Each objective should be as precise as possible in describing the work. A good objective not only defines what will be done but also clarifies what will not be done. Consider for example the two objectives given below. 1. The engine will be tested. 2. The efficiency of an internal combustion engine will be measured at constant speed and five throttle positions using a dynamometer and fuel flow measurement. The first objective is too vague. The engine could be tested for emissions, durability or efficiency. The reader has no idea of the intentions of the writer. The second sentence clearly identifies the goal as finding the efficiency of the engine. The second sentence also tells how the measurement will be obtained (with a dynamometer and fuel flow measurement) and how extensive the measurements will be (five data points). Theory (and Background): This is the section of a report where the writer and the reader establish a set of common ideas and facts that will be needed in order to appreciate or understand the results. This section often begins with a review of relevant literature and experiments which have been done on closely related topics. References to previous work establish credibility for the facts that the writer wants the reader to believe and understand before the results are presented. A complete background section is usually only found in the most formal types of reports such as theses and dissertations, while abbreviated background information is usually given in journal articles, business reports, and proposals. There are some journals which publish reports that consist solely of reviews. The length of the background section is usually only long enough to establish the facts relevant to the objectives of the work.
4 For formal lab reports, the background will usually consist of the information learned in class which will be used in the lab to analyze and interpret the data. The section then moves to a discussion or how these ideas and facts which are already known relate to the objectives or facts which will be reported. The theory might suggest results which are anticipated from an experiment or help define what new information must be gained from an experiment in order to improve the theory. Method: This section tells how the objectives will be accomplished. Another name often used for this section is "Experimental Procedure" or "Experimental Setup." Method is a more general term which encompasses the other two. Usage of part or combinations of these three terms is common. If an experiment is being performed, this section should include the experimental setup. Diagrams and tables are often very useful in this section. The writer needs to convey enough information to the reader so that the experiment can be repeated. This may include a step-by-step list of instructions, a list of equipment, and a list of test conditions or a test matrix. It is often difficult to determine the depth of detail needed in this section. A rule of thumb would be to write this section so that the average student could repeat your experiment and obtain your results. You may assume the reader is competent to perform basic procedures, but if a procedure must be done a certain way to repeat the results then this must be included. If, for example, a temperature measurement were taken in a experiment, it should be explained whether a thermometer, thermocouple, or thermistor was used, but the color and manufacturer of the thermometer need not be given unless there is a reason to believe that the reader will benefit in some way from the additional information. This section should also contain descriptive sentences and explanations in a paragraph form in addition to lists and figures. The writer should anticipate and attempt to address as many of the reader's questions as possible, particularly with regard to the accuracy and care of the experiment. Results and Discussion of Results: This is the section where results are presented. These may be measurements, surveys, comments or observations. Results are most easily understood in graphical form, so try to put all information into graphical form whenever possible. If a graph is not relevant then use a table. As a last resort use sentences and words alone. Once the graphs and tables have been made, the results should also always be described in words. It is unacceptable to have a graph without any description of the graph in the text. The writer should point out features in the data which are important. Maximums, minimums, linearity, scatter and other features of the data should be discussed. A statement such as, "The temperature reached a maximum of 95 o C after heating for 5 min." is appropriate. This may be obvious to those who have performed the experiment and studied the data but the reader may not recognize important features of graphs and table if they are not pointed out. In most reports, a discussion of the data will be mixed in with the results. The discussion may add an interpretation to the data and relate the present data to the theory or previous data. A sentence such as, "The 95 C maximum temperature observed is consistent with the boiling temperature at a barometric pressure of 12.3 psig," is an interpretive comment on the data. Sometimes the discussion is long enough and involved enough that a separate section for
5 Discussion of Results is needed. The need for a separate section is a subjective decision based on whether the information flows best when mixed together or separated. Conclusions and Recommendations: These are two distinctly different elements of a report which are almost always grouped together in the same section. Conclusions are statements which can be made based on the information given in the report. The theory section often introduces questions which will be answered by the experiment. The conclusions are the answers to those questions. It is absolutely essential that the conclusions be supported by data and discussion in the text. Conclusions should not be pulled out of thin air, gut feeling, or previous experience. Sometimes the discussion or analysis of the data leads to conclusions which may be somewhat disputable. These conclusions may be given but should be qualified with appropriate wording. Students often have problems writing conclusions because they are reluctant to restate information that has been discussed in previous sections. However, conclusions should be a restatement of prior information which is isolated at the end for emphasis. The conclusions should also be repeated in the abstract section. Thus an important conclusion should be found in three different locations in the report. The recommendation section provides the opportunity to point out improvements which could be made in the experiment or additional work that could be done to improve understanding of related topics. It is very rare that an experiment is completed without introducing new questions or without some recognition that the experiment could have been improved.\ The results of an experiment or study may also suggest a certain course of action. For example, if data shows that black paint absorbs more radiant energy than white paint, it might be recommended that coats be made of black material while summer clothing be made of white material. Recommendations can be very important as they provide relevance or make obvious the importance and usefulness of the information in the report. Acknowledgments: It is important to acknowledge the support and assistance of people and organizations who have provided either technical or financial assistance for the work explained in the report or for the report itself. These people may be technicians who have helped or companies who have donated money or resources. Co-authors should not be mentioned in the acknowledgment as they are assumed to be contributors by virtue of their authorship. List of References: The list of references contains exactly what the name implies--a list of references cited in the report. The reference list should contain all of the references cited and should not contain references which are not cited. There are numerous styles used for referencing. Use the style preferred by the recipient of the report. The American Society of Mechanical Engineers (ASME) journals use a "Name (Date)" citing scheme, such as "Peterson (1996)." The reference would then be listed alphabetically in the references section as, Peterson, A. R., 1996, "A Fast Algorithm for Robot Path Planning," Paper , Proceedings, 27th ASME Design Automation Conference, Sacramento, CA, Sept Another example would be, Cengel Y. A. and M. Boles, 1989, Thermodynamics: An Engineering Approach, McGraw-
6 Hill, pg Enough information should be given so the reader could obtain the reference. One way to write out references is to find an article which contains a preferred format for references and copy it consistently throughout the report. Do not change formats within a report. A list of references is only required when a reference is cited. Students writing lab reports may not need to add this section as they typically will not need to reference a lot of information, but regardless of any stated or written suggestion for report formats, if a reference is used it must be cited and a list of references added. Appendices: Appendices are placed at the end of reports to include information which is necessary to reproduce the results, but which is not central to the report and could distract the reader if allowed to remain in the main body. Hand calculations, raw data, and computer program printouts are examples of content typically found in appendices. Figures or data that are central to the conclusions should always be in the main body of the report and not in the appendix. The appendices should be neat and orderly. Random hand calculations distributed all over the page are not acceptable. Information that is only useful to the writer does not need to be placed in an appendix. The appendices should be grouped into topics and labeled with a title, for example, "Appendix A - Raw Temperature Data" and "Appendix B - Spreadsheet Calculations of Heat Transfer." 1.3 Formal and Summary Reports The purpose of a formal report is to clearly and concisely document a complete project or experiment. It can be assumed that ME faculty requesting a formal report expect the content to include all of the elements designated in the table unless otherwise stated. Formal reports will not be requested as often as summary reports because of the effort and time they require. An example formal report has been given in Appendix A and can be studied as a guide. The example report has the report elements on one page with explanations on the facing page. Summary lab reports follow the same format as the formal lab report except they eliminate the elements of Introduction, Theory, Background, Set-up and Procedure. This shortens the length of the writing assignment considerably and avoids having students rewrite information they have often been given initially by the instructor. This shortened version of a report is not as useful when students are asked to design their own experiments or report on projects with which the instructor is not already familiar. A similar situation may be experienced by engineers working for a large company. Within the company, immediate supervisors are more interested in summary reports because they are already familiar with the project while outside companies, governments sponsors, customers or suppliers are interested in full reports or memo reports which provide some background and method. 1.4 Memo Reports A memo report (sometimes called an "Executive Summary") is essentially an extended abstract. It contains all of the elements of a full report in a very condensed form, usually a maximum of two pages. It may contain a one or two sentence introduction and background but really assumes the importance of the topic is already understood by the reader. The method may be referred to briefly but not described in any detail. Thus, an experiment being described in a memo report
7 could not necessarily be repeated, but a reader familiar with the method would understand basically what equipment was used and what process was followed. The main focus of the memo report is on results and conclusions. A figure or table may be used which best condenses and organizes the information obtained. The data is not discussed thoroughly but the conclusions are given. The reader must assume more trust in the writer of the memo report because it is sometimes unclear how conclusions were made. An example of a memo report is also in Appendix A.
8 Appendix A-Examples of Reports
9
10 Example of a Formal Lab Report Mechanical Engineering Department Brigham Young University August 22, 1990 (Revised 1997, 2000) MECHANICAL ENGINEERING DEPARTMENT BRIGHAM YOUNG UNIVERSITY PROVO, UTAH
11 The first example report illustrates the format for formal reports to be submitted in the Mechanical Engineering Department. Although this example is experimental in nature, this format will work equally well for almost any formal technical report. You should use this report as a template for future reports. In general you should be thinking toward short, concise reports. In other departments a number of pages or words might be specified because they are checking your ability to use words, sentences and paragraphs. In ME we are checking your ability to explain clearly with as few words as possible. Choose a title which as briefly as possible describes the work being reported. The title page also should include the authors' names, the date submitted and the sponsor or liaison person for the sponsor. Some organizations make a big deal about the format of the title page or the rest of the report. If this is so, be sure to follow the suggested format. Little changes, like whether the title is in all caps or not, don't really affect things. Be flexible enough to conform to the desires of your supervisor. The separate title page is not really needed; many organizations use the Abstract page as the report title page. Temperature and Absorptivity of Various Colors on Painted Metal Plates Exposed to the Sun July 9, 1990 by Student W. Smarts
12 For SHERWOOD-FORREST PAINTS, INC.
13 An ABSTRACT summarizes the substance of your report. It provides a condensed discussion of the important points. The Abstract page is frequently the only information about a document that a casual reader will receive. Be very careful as you choose words for the Abstract. This should be the best section of the report. This is what you want your reader to remember about your work. Many times this is the only section your reader (which may be your boss or another individual worth impressing) will read. The Abstract should represent your best thinking. If you intend for the abstract to be part of your report, you need not include the title or author of the report in the Abstract. If the Abstract will replace the full report for some readers, the title and the author should be included at the beginning. Abstracts for full reports normally contain 100 to 200 words, or less than a single page of double-spaced text. In writing the Abstract, you can use the body of your report to help generate your first draft. The Abstract should have a sentence stating the primary objective, a sentence stating any major methods used, a sentence stating the main results of the reported work, and a sentence stating any major conclusions. Recommendations in the Abstract are optional. These sentences can be used to craft a first draft of the Abstract. This first draft will require some editing to ensure that it reads well as a stand-alone element of the report. The Abstract is usually written after all of the other sections of the report are finished. Notice how results are summarized using precise numbers in the Abstract. These results are also presented in detail the Experimental Results section and summarized in the Conclusions section of the report.
14 Temperatures Attained in Painted Metal Plates Exposed to the Sun Student W. Smarts July 9, 1990 ABSTRACT Four different Sherwood-Forrest paints were tested to determine the amount of solar radiation they absorbed. Four aluminum plates were painted with white, light-blue, red, and dark-blue paint, while a fifth was coated with soot to serve as a control. The plates were insulated on the back and their surfaces exposed to the noon sun. The painted plates attained temperatures ranging from 30 to 115 F in excess of the ambient temperature. The sooted plate reached 138 F above the ambient temperature. The plate temperatures were measured from the time a shade was removed until steady state was reached. Solar radiation was measured with an Eppley radiometer. This allowed the absorptivities to be calculated two ways: from the initial temperature change using the plate as a slug calorimeter and from the steady state temperature excess. The measured solar absorptivities were 0.2 for the white, 0.4 for the light blue, 0.6 for the red, 0.8 for the dark blue, and 1.0 for the soot.
15 Unless the report is longer than 10 pages, the TABLE OF CONTENTS is usually omitted. When the report is longer than 10 pages, the Table of Contents should include both the primary headings and the secondary headings. Sometimes graphs and figures can be handled in the Table of Contents. When the report is long, or when there are many figures, there should be a separate LIST OF FIGURES containing the titles of each. When there are a large number of symbols used in equations or otherwise, clarity might be served well with a list of symbols and their definitions. If only a few symbols are used, they might be defined close to the point of first usage. This report has a Table of Contents, List of Figures and List of Tables included to demonstrate a suitable format even though they will not be required in the standard ME formal report. Typically you don't include your Abstract and Table of Contents in the Table of Contents. If you're reading the Table of Contents, you know where it is; the Abstract is right behind the title page so it's easy to find. Some people like to include the Abstract; if your supervisor likes it, then by all means comply.
16 TABLE OF CONTENTS Introduction... 2 Objective... 2 Theory... 4 Experimental Procedure... 8 Results and Discussion of Results Conclusions and Recommendations Appendix 1: Experimental Results Figures Figure 1. Schematic View of Plate with Heat Balance... 4 Figure 2. Overall Sketch of Experimental Setup Figure 3. Temperature vs. time for first five minutes Figure 4. Temperature vs. time for 90 minutes Tables Table 1. Temperatures attained and Absorptivities... 16
17 The INTRODUCTION gives the reader some background as to why the project and report was undertaken, how it fits with similar work, motivation for specific parts of the work, and how the results are to be used in solving the sponsor's problems. The Introduction might also delimit some related subjects which are not going to be discussed in the report. The primary objective of the Introduction is to give the reader the "big picture" of the work. The closing paragraph in the Introduction should be a succinct, but complete, statement of the specific objective of this work. Sometimes this is called the "Work Statement" or "Objective Statement." This can be set off with a secondary heading so it is easily found as in this example or left as the last sentence of the introduction. To make your objective statement clear to the professor, set it apart for now as shown in the example. If there is only one objective, one sentence will usually be sufficient to state the objective. When there are additional tasks they may be added as additional sentences. Extended objectives are often handled by using a numbered list.
18 INTRODUCTION The exposed surfaces of equipment stored in open sunlight experience large temperature fluctuations due to solar radiation. Experience indicates that dark colored objects exposed to the sun reach higher steady-state temperatures than lighter colored objects. For items that are stored outside, surface paints should be chosen to minimize exposure-related damage. Information on the solar absorptivity of different paints would be beneficial for the selection of painted surface finishes for outdoor equipment. Although paint color is an important factor in determining solar heating, it is not the only factor. Other significant factors could include the glossiness of the paint or the roughness of the painted surface. The chemical composition of different paints of the same color could affect the thermal response of painted surfaces to solar energy. Painted surfaces that are the same color could have significantly different infrared absorbing and reflecting properties. Environmental conditions, such as wind speed, humidity, and cloudiness, will significantly affect solar energy absorption by painted surfaces. Properties of the painted material, such as mass density and specific heat, will also play a role in the surface temperatures experienced. Other variables could influence the thermal response of objects exposed to sunlight as well. OBJECTIVE The objective of this experiment was to compare the temperature rise of aluminum plates painted with four different colors of paint with that of a soot-coated plate as they are exposed to the same solar irradiation. A secondary objective was to calculate the absorptivity of each sample and determine its dependence on color.
19 A discussion of the THEORY, including details, should be presented when it is needed to understand the analysis or calculations presented in the report. The theory can include the derivations of equations, explanations of physical behavior, or both. A detailed description of the theory is included in the body of the report if it can be done so without detracting from the overall presentation. An alternative is to place detailed derivations or descriptions in an appendix. The Theory section will often include developments based on fundamental analysis tools such as free-body diagrams or energy balances. In this section, it is appropriate to present governing equations, schematic diagrams, or brief derivations that will aid in understanding why various experiments were performed. New theories or techniques developed should be described in this section. An error analysis may be appropriate in the Theory section. It might also be appropriate in the Method, Results, or Discussion of Results sections. For certain, some form of uncertainty analysis is always needed. There is no such thing as an exact measurement and it is unclear what is meant when data are described simply as being "accurate." Before any data can be interpreted or a conclusion drawn, the relative accuracy of the data must be understood. If symbols used in equations are not universal (which they seldom are), be sure to explain them at the point of first use. Set equations separately from text, unless they are simple equations used only in a single paragraph. Number equations for further reference. Equation numbers are usually placed in parentheses and aligned with the right margin. Equations can be either set at a fixed tab stop or centered on the page; they are usually indented from the body of the text. Be sure to be consistent in numbering and format throughout your report.

20 THEORY In determining the solar radiation absorbed by the painted aluminum plates, it is essential to understand the manner in which energy is transferred to and from the plates and stored within the plates. Figure 1 depicts the different ways heat is transferred to and from the experimental plates. Figure 1. Schematic view of experimental plate with heat balance. From Figure 1, an energy balance for the painted plates can be performed: αq sun Q sky Q conv Q back = Q stored. (1) These five terms represent the forms of energy considered to be important in this problem. The first term, αq sun, represents the radiant energy absorbed from the sun, with α being the absorptivity. The next three terms represent the different mechanisms by which energy leaves the plate: long wavelength radiation to the sky, convection to the nearby air, and conduction through the insulation. The right-hand side of the equation represents the energy stored in the plate. Knowledge of the heat transfer mechanisms involved allows us to rewrite Equation (1) as where ε is infrared emissivity of the surface, σ is the Stefan-Boltzman constant, h is the convective heat transfer coefficient, k ins is the thermal conductivity of the insulation, and x is the thickness of the insulation. The plate mass, specific heat, and temperature are given by M, C p, and T respectively. Since there is radiation, all of the temperatures are in absolute units. The major unknowns in the energy balance are the surface temperature and the absorptivity of the painted metal surfaces. For the experiments performed, the Biot number was estimated to be sufficiently low (about ) to allow the plate to be modeled as a slug calorimeter.
21 From a procedural point of view, the theory drives the development of the experimental method and the selection of the experimental apparatus. The experiments you perform and the apparatus needed to perform the experiments are determined largely by the relationship between your objective and the underlying theory. Every experiment is designed to test some hypothesis. The theory should allow you to develop the hypothesis. Without the supporting theory it is impossible to perform a relevant experiment. A further use for the theory is in the preliminary evaluation of experimental data. Many experimental errors are large enough to be caught just by making a preliminary comparison between the data and the results predicted by the theory. If you fail to catch large experimental errors until after your experimental setup is dismantled, you face a lot of unnecessary work to retake the data. By comparing your raw data to the theory at the time of the experiment, you may save yourself from a lot of frustration. As an aid to report writing in general, the use of personal pronouns should be mentioned. In the past, no personal pronouns (I, me, we, or us) were allowed in technical writing. Now, the use of we or us (collective pronouns) is acceptable, but never the individual pronouns I and me. If you did the work yourself, you should still use the "royal we" to indicate the things you did. It is probably appropriate to minimize use of the personal pronouns; use them where the third person form ("the authors") or passive tense ("the experiments were performed") is awkward.
22 Absorptivity can be calculated based on transient conditions present initially or steady-state conditions. In this work, both methods are used. When the plate is first placed in the sun, the air temperature and plate temperature are the same (T - T air = 0) and Equation (2) can be solved for α: Values for the absorptivity can be calculated based on the initial temperature transient. In calculating a value for α, the change in surface temperature dt/dt and the solar irradiance Q sun are measured directly. Values for ε and T sky are estimated based on engineering judgement. Once the plate has reached its steady-state temperature, the amount of heat leaving the plate is the same as the amount of heat entering the plate and dt/dt = 0. Equation (2) can be solved to yield In this case, α is calculated by estimating values for ε, T sky, h, and k ins and measuring the steady-state plate temperature and the solar irradiance. From tabulated data, the absorptivity of the sooted sample is known to be very near one. This known value allows the validity of the two methods of absorptivity calculation to be checked. As its name implies, the METHOD section of a lab report describes the experimental method or procedure carried out in performing the lab. This section of a report may also be titled "Experimental Procedure" or "Technical Approach." The description of the process is either an explanation or history of the procedure. Use the present tense to describe how to perform the procedure. Use the past tense to describe the procedure that was done. Since you are usually reporting on what you did in a lab, your Method section would be written in past tense. The Method section includes descriptions of the sequence of activities performed and the apparatus used. The
23 description of the apparatus can be as simple as a list, but paragraph form allows for greater detail and clarification of how the apparatus was used. Photographs and figures can provide a convenient and efficient way to communicate what was done during an experiment. Rather than trying to describe a piece of equipment and how it functions in words alone, it is often more informative and easier to use a picture or schematic diagram of the apparatus. If figures are used, they should be properly labeled with a figure number and title. Figures should be neat and professional in appearance. Photographs should provide a clear image of the object of interest and be free from distracting clutter. In technical writing, it is important to keep in mind who the reader of your report will be. The style and content of your writing are strongly affected by your audience. Clearly, your approach in describing an experimental procedure would be different for our department chair than it would be for an incoming freshman. For your lab reports, your audience is the TA for your section and the instructor. Your Method section should be a concise description of the procedures that you completed for the lab. When written as part of a full formal report, the Method section supports what is presented in other parts of the report. For example, when reading the Results section of a report, it should be apparent (from previous reading of the Method section) how the results were obtained.
24 EXPERIMENTAL METHOD Five aluminum squares, three inches on a side and one-quarter inch thick, were fabricated and polished on one side. Four of the squares were painted with two coats each of Sherwood-Forrest paint. The colors were white, light blue, red, and dark blue. The fifth plate was heavily coated with soot from a fuel-rich propane flame resulting in a black matte finish. A copper-constantan thermocouple was placed in the back of each plate as shown in Figure 1. Each plate was then mounted in a six-inch-square piece of two-inch-thick Styrofoam insulation (see Fig. 1). A sixth thermocouple was placed in the shade to measure local air temperature. All six thermocouples were attached to a pyrometer through a switching box so they could be read in any order desired. The insulated plates were mounted on a four-foot by one-foot board that could be carried conveniently to the test area. Tests were conducted on the roof of the Clyde Building in full view of the sun. An Eppley radiometer, Model 6-J8, was used to make accurate measurements of the incoming solar energy. This radiometer was designed and calibrated to measure the total incoming solar energy in the wavelength range of 0.1 to 4 microns. Figure 2 shows a schematic of the entire experimental apparatus. On three calm, clear days between June 15 and June 30, 1989, the plates were tested between 11:00 a.m. and 2:00 p.m. Temperatures from all six thermocouples were taken every minute for the first five minutes and then every three minutes until the steady state temperature was reached. In each case, steady state was reached in about 90 minutes. Times were measured to the nearest second using a digital stopwatch. To insure that free-convection conditions existed during testing, a table tennis ball anemometer was developed to measure the ambient wind speed. For a table tennis ball dropped from a height of eight feet, a horizontal displacement of two inches or less indicates that the wind speed is less than one foot per second. Each test day, both before and after testing, a table tennis ball was dropped from a height of eight feet. If the measured wind speed was greater than one foot per second, the data were discarded.
25 It has been said that a picture is worth a thousand words. Include drawings of your apparatus or schematics where appropriate. One thing you need to be careful about is the use of computer figures. Although computer drawing capabilities are continually being upgraded, sometimes the geometries available in your draw or paint program are too simple. For example, representing a parabola as half an ellipse is usually inappropriate. For complex geometry, a careful hand drawing may be better than a computer drawing.
26
27 The RESULTS and DISCUSSION OF RESULTS sections are the heart of the formal report. In these sections the main results of an engineering effort are presented and their significance is discussed. Special emphasis must be placed on presenting and discussing results in a strong, effective manner. Students frequently have difficulty distinguishing between results and discussion of results. The critical distinction is that the results are objective data, while the discussion is your interpretation of the data. To draw an analogy with the newspaper, the results are the facts and the discussion is the editorial comment. One reason it is important to distinguish between the results and the discussion is that the reader may disagree with your interpretation, but he or she has a hard time disputing your results (that is, it can't be said you didn't measure those temperatures). A clear distinction between results and discussion also helps you to recognize the sources of potential error. For long reports, it may be appropriate to separate the results from the discussion; for short reports a combined section may suffice.
28 RESULTS AND DISCUSSION OF RESULTS Temperature data were taken on three different days. Data from the second day will be presented here. Data from the first and third days were similar; complete results are presented in Appendix 1. Figure 3 shows temperature data plotted versus time for the first five minutes of the test. Figure 4 shows temperature results for the entire 90 minutes of the test. Absorptivity values for each paint color were calculated using both steady-state temperatures and initial transients. Absorptivity values based upon steady-state temperature data were calculated using Equation 4. The final temperature values shown in Figure 4 were used as steady-state temperatures in the calculation. The temperature of the sky, T sky, was assumed to be 10 F lower than the ambient air temperature, T air. The infrared emissivity of the surface, ε, was assumed to be 0.92, while the thermal conductivity of the insulation, k ins, was assumed to be Btu/hr/ft/F. The convective heat transfer coefficient, h, was determined from the formula Absorptivities were also calculated using Equation 3 and temperature data from the initial transients shown in Figure 3. Since the calculation of Equation 3 requires the derivative of temperature, dt/dt values were approximated by calculating the slope of the curves of Figure 3 at the times of one and two minutes. Absorptivity was calculated for each color at the times of one and two minutes.
29 Graphics (tables, graphs, and charts) are the main method used in reports to present data to the reader. When properly done, graphics are visually attractive and express results in a manner that is easily comprehensible. For many readers, tables, graphs, and charts are the primary source of information. These readers read the written text only when they do not understand the graphics. For this reason, clear graphics which communicate your message are important. There should always be some discussion to go along with any graphic included in a report. Graphics should be numbered sequentially in a report beginning with the number 1 (e.g., Figure1, Figure 2, and so on). All graphics in a report should be labeled as figures, except for tables, which should be labeled as tables. All figures and tables should have a caption that briefly describes the contents of the graphic. For tables, the title (or caption) should appear above the table. For figures, the title is usually placed below the figure. Results are often shown by graphs. Make the scales match the accuracy of the data, make them readable, and make them with numbers that are easily dividable. Take enough data to observe the critical areas to be evaluated. Graphs are used to demonstrate the relationship between variables in a way that allows the reader to assimilate and remember information faster and better than can be done with words or tables. Most graphs should be self- explanatory so that they can be lifted from the report and still have meaning. Figures 3 and 4 in the example report give examples of how graphs can be used. Notice that each figure is numbered and has a caption or title. In both graphs, the abscissa (independent variable, time) axis is clearly labeled with units, as is the ordinate (dependent variable, temperature) axis. The axes are scaled so that the graphs are easy to visualize and interpret. When more than one curve is presented on a graph, the different curves can be identified by different symbols or different line patterns. Symbols are also used to identify experimental data, while line patterns are used to plot theoretical curves. Note that Figure 3 labels the curves directly on the plot, while Figure 4 uses a legend. The choice of whether to label curves directly or to use a legend should be based on the clarity of the resulting graph. Where space permits, label the curves directly as in Figure 4. Resist the temptation to put too much information on a graph. If you have too many curves, the reader will not be able to assimilate it easily. Search for a better way to present the data or present only a subset of the data. If you must expand a scale, show clearly a break in the scale but show that zero exists and was not merely ignored.
30 Figure 4. Temperature versus time for 90 minutes. During the time of the test, the solar energy measured by the Eppley Radiometer varied smoothly from 278 to 283 and then back down to 277 Btu/ft 2 /hr. The time-averaged value of 280 Btu/ft 2 /hr was used in all of the calculations. Another common method of presenting results is through the use of tables. Numerical values used to produce
31 graphs will not usually appear in tables. Such detailed data might be included in an appendix if this information might be of future benefit. The choice of whether to use a graph or table is usually based on your objective in presenting the data. Where there are trends you care to illustrate, the graph is usually superior. If the results are functions of discrete variables (e.g. paint color), a table is usually preferred. The DISCUSSION OF RESULTS section is where you point out all the items you want the interested reader to understand about your work. After reading this section, the significance of the results presented should be clear to the reader. Items of interest include anomalies in the data, how well the data match the theory, important trends in the data, effect of various errors on conclusions, alternative experiments or interpretations, applications of the results, etc. In this section of the report, you will want to compare the results with your theory developed in the planning of the experiment. Statements about extrapolating the results might be of value. This is especially true when critical regions have been found or suspected. To assist others who may wish to use your results, it is wise to include some measure of your confidence in the results. Sometimes this will be in the form of an error analysis. Other times it will be in the form of observation or experience with the instrumentation. Whatever the case may be, state your confidence level explicitly, especially in cases where a great deal of uncertainty exists in your measurements. One common uncertainty in writing reports is the question of when to use present tense and when to use past tense. The general rule of thumb is to use the past tense to indicate work that was done (i.e. apparatus was assembled, data were taken, calculations were completed) and the present tense to indicate facts that are still true (the absorptivity matches, the scatter is small, the data support conclusions).

32 Table 1 shows the steady-state temperature rise, and the calculated absorptivities for all five specimens. As can be seen, in many cases the steady-state absorptivity matches the transient absorptivity to within about 5%. The absorptivity of soot is known to be very close to one. As expected, the values for soot calculated from the measured data were also very close to one. This gave us confidence that the experimental method used is fundamentally sound. Although a number of assumptions were made to calculate the absorptivities, the calculations match the known value for soot to within five percent. Table 1: Absorptivity Results The experimental scatter in the absorptivities is relatively small for all but the white paint. The transient and steady-state absorptivities differ by almost fifty percent in that case. The temperatures used for the transient calculation were so close to the air temperature that the accuracy of the thermocouples used for measuring the temperatures became an issue. The temperatures were displayed with a resolution of 0.1 F, but differences between the individual thermocouples limited the accuracy of the temperature measurements to ±0.3 F. This uncertainty significantly affected the accuracy of absorptivity calculations when the temperature differences involved were small, such as with the white paint. This uncertainty is a primary cause of the difference between the steady-state and transient absorptivities calculated for the white paint. The steady-state absorptivity is the more accurate of the two. The steady-state temperatures measured satisfy the intuition that the objects seeming darker to the eye absorb more solar energy and reach a higher temperature. The magnitude of the range in temperature excess was surprising, varying from 30 to 140 F.
33 The CONCLUSIONS should include only those that can logically be drawn from the work presented. No new ideas should be presented here. They should have all been presented in the discussion of results section. The conclusions should address each of the original objectives; further conclusions are often appropriate as well. RECOMMENDATIONS should be suggestions for follow-up work. Perhaps questions were raised by this experiment that need further study to answer. Perhaps you learned something from this work that will be helpful for further studies of this type. Recommendations frequently deal with how you would do the experiment differently, knowing what you now know. Be careful not to recommend something that could have been done in less time than it takes to make the recommendation, i.e., don't recommend that a different data analysis be performed. Also, don't recommend that the experimenter avoid making stupid mistakes! If you've made really bad mistakes, just bite the bullet and redo the work.
34 CONCLUSIONS AND RECOMMENDATIONS A method for determining the effects of solar radiation on painted surfaces has been demonstrated. Both solar absorptivity and maximum temperature have been determined for objects painted with four different paint colors. The maximum temperature is a strong function of the experimental setup, and objects different than those used in this experiment would reach different temperatures. Both absorptivity and maximum temperature have been shown to vary with the color of the paint, with darker colors having higher absorptivities and higher maximum temperatures. Absorptivities calculated from the initial thermal transient were better for darker colored surfaces because the temperatures are higher, which gives more accurate calculations. For the lighter surfaces, the temperature differences were near the measurement uncertainty. The steady state method for calculating absorptivities worked well for all surfaces. The assumptions used in this calculation were appropriate. For light surfaces this method was superior because the temperatures were high enough to be measured accurately. Future uses of absorptivities from this report should use the steady-state method, as it is less sensitive at low absorptivities.
35 The Appendices include such things as well-organized and well-presented original data, special mathematical techniques used, or statistical and error analyses. These are things you might later want to refer to, but nothing that is essential for the reader to know. If the reader has to know it, put it in the main body of the report. There are different levels of interest of readers. The material that the least interested reader needs is in the Abstract; the material that most interested readers will need is in the body of the report; and the material that only the very interested readers will care about is relegated to the Appendices.

36
37

38
39
40 EXAMPLE SUMMARY REPORT
41 This example Summary report has been made by eliminating the Introduction, Theory and Background and Method sections from the formal report while leaving the remaining information. This type of a report is particularly useful for laboratory reports because it maintains the completeness of the results and discussion sections without requiring the student to rewrite the lab procedure and experimental set-up that has been given to them by the instructor. This shortens the burden of report writing. Explanations of the content of these sections have not been included in this example but can be read by looking at the comments explaining the formal lab report.
42 Temperature and Absorptivity of Various Colors on Painted Metal Plates Exposed to the Sun July 9, 1990 By Student W. Smarts For SHERWOOD-FORREST PAINTS, INC.
43 Temperatures Attained in Painted Metal Plates Exposed to the Sun Student W. Smarts July 9, 1990 ABSTRACT Four different Sherwood-Forrest paints were tested to determine the amount of solar radiation they absorbed. Four aluminum plates were painted with white, light blue, red, and dark blue; a fifth was coated with soot to serve as a control. The plates were insulated on the back and their surfaces exposed to the noon sun. The painted plates attained temperatures ranging from 30 to 115 F in excess of the air; the sooted plate reached 138 F above the air. The plate temperatures were measured from the time a shade was removed until steady state was reached. Solar radiation was measured with an Eppley radiometer. This allowed the absorptivities to be calculated two ways, from the initial temperature change using the plate as a slug calorimeter and from the steady state temperature excess. The measured solar absorptivities were 0.2 for the white, 0.4 for the light blue, 0.6 for the red, 0.8 for the dark blue, and 1 for the soot. These absorptivities allow accurate calculations of temperatures reached by painted objects in many outdoor storage conditions.
44 OBJECTIVE The objective of this experiment was to compare the temperature rise of aluminum plates painted with four different colors of paint with that of a soot-coated plate as they are exposed to the same solar irradiation. A secondary objective was to calculate the absorptivity of each sample and relate it to color. RESULTS AND DISCUSSION OF RESULTS Although data were taken on three different days, only data taken the second day will be shown here. Data from other days were similar; complete results are presented in Appendix 1. Figure 3 shows the Temperature vs. Time graphs for the first 5 minutes, and Figure 4 shows these results for the entire 90 minutes. Absorptivity values for each paint were calculated using both steady-state temperatures and initial transients. The final temperature values are assumed to be steady state, and the absorptivities were calculated using equation (1). T sky was assumed to be 10 F lower than the air temperature; e was assumed to be 0.92, k ins was assumed to be Btu/hr/ft/ F, h was determined from the formula The absorptivities were also calculated using equation (3), with the same values of e and T sky as used previously. dt/dt was calculated for times of both one minute and two minutes. During the time of the test, the solar energy measured by the Eppley Radiometer varied smoothly from 278 to 283 and then back down to 277 Btu/ft 2 /hr. The time-averaged value of 280 Btu/ft 2 /hr was used in all of the calculations.
45 Figure 4: Temperature versus time for 90 minutes. Table 1 shows the steady-state temperature rise, and the calculated absorptivities for all five specimens. As can be seen, in many cases the steady-state absorptivity matches the transient absorptivity to within about 5%.

46 Table 1: Table of Results for Absorptivities Soot has an absorptivity that is very close to one, so the measured data gave us confidence that the experimental method is fundamentally sound. Although a number of assumptions were made to calculate the absorptivities, the calculation matches the known value for soot to within 5%. The experimental scatter in the absorptivities is relatively small for all but the white paint. The transient and steady-state absorptivities differ by almost 50% in that case. The temperatures used for the transient calculation were so close to the air temperature that the accuracy of these measurements is questionable. The steady-state absorptivity is probably correct. The temperatures were indicated to 0.1 of, but differences between the individual thermocouples limited the accuracy of the temperature measurement to about ±0.3 of. This uncertainty is especially significant for transient measurements at low absorptivities. The steady state temperatures measured do indeed satisfy the intuition that the objects seeming darker to the eye absorb more solar energy and reach a higher temperature. The magnitude of the range in temperature excesses was surprising, varying from 30 to 140 degrees F.
47 CONCLUSIONS AND RECOMMENDATIONS A method for determining the effects of solar radiation on painted surfaces has been demonstrated. Both solar absorptivity and maximum temperature have been determined for objects painted with four different paint colors. The maximum temperature is a strong function of the experimental setup, and objects different than those used in this experiment would reach different temperatures. Both absorptivity and maximum temperature have been shown to vary with the color of the paint, with darker colors having higher absorptivities and higher maximum temperatures. Absorptivities calculated from the initial thermal transient were better for darker colored surfaces because the temperatures are higher, which gives more accurate calculations. For the lighter surfaces, the temperature differences were near the measurement uncertainty. The steady state method for calculating absorptivities worked well for all surfaces. The assumptions used in this calculation were appropriate. For light surfaces this method was superior because the temperatures were high enough to be measured accurately. Future uses of absorptivities from this report should use the steady-state method, as it is less sensitive at low absorptivities.

48
49 For brevity we have not included the full Appendices. Other data would follow just as in the Full Lab Report.
50 EXAMPLE MEMO REPORT
51 This is an example Memo report. This report contains a summary which is between an abstract and a full report in terms of the amount of detail presented. Sometimes these type of reports are referred to as "extended abstracts" or "executive summaries." They assume the reader has a familiarity with the topic and experiment being performed. An introduction, objective, results, discussion and conclusions are all appropriate but in a condensed form. The most extensive section should be the results.
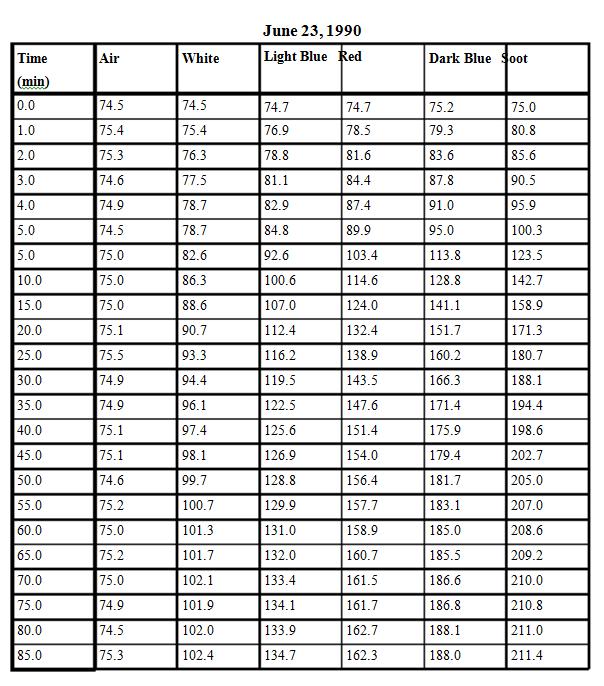
52 M E M O R A N D U M TO: Andrew Warren FROM: Student W. Smarts DATE: 9 July 1990 RE: Temperature and Absorptivity of Various Colors on Painted Metal Plates Exposed to the Sun CC: Amy Shurian, V.P., Research Ben White, Research Engineer Temperatures of painted metal surfaces can be increased well above the surrounding air temperature through the incidence and absorption of solar radiation. This increase in temperature can intensify the degradation of paints, decreasing the effective lifetime of paints as a protective coating. This experiment provides data on the temperature increase and absorptivity (α) found for four paints ranging from light to dark colors. Solar absorptivities were calculated by measuring the temperature rise of painted aluminum plates exposed to the sun. Five aluminum plates (3 in. wide by 3 in. tall by.25 in. thick) were painted using white, light blue, red, dark blue paint and one was heavily sooted to represent a black surface. The plates were flush mounted in two-inch-thick Styrofoam insulation and all five were mounted to a board for convenient handling. The data were taken on three clear, calm days late in June The colors represent a broad range from light to dark. Soot was used on a fifth plate to check the technique as it has an expected absorptivity of 1.0. Two methods were used to measure the α values. With the first method, the plate was used as a slug calorimeter for measuring heat flux from the initial temperature-time slope. Using second method, an energy balance was done on the plate surface at steady state conditions. The α's were calculated by measuring the solar irradiation and the convection loss from the top of the plate, the conduction through the insulation, and the long wave length radiation to the sky were all calculated using standard textbook relations. These two equations are The results of the measurements on June 23 are given in Table 1 below. The first column shows that the darker colored plates reached a higher steady-state temperature in excess of the ambient air temperature. This translates into a higher absorptivity as shown in the next three columns. The steady state results (α, SS) are considered the most accurate because a larger temperature difference is used to calculate the absorptivity, thereby reducing the error. With the exception of the white paint where dt for the dt/dt term was calculated

53 with very small temperature differences, the two techniques agree fairly well. The estimated error was about 5% for all but the white paint. The steady-state absorptivity value should be used for the white paint, as it is the most accurate. Table 1. Results for Absorptivities and Temperatures A simple method has been demonstrated for the determination of the absorptivity of paint colors. The results demonstrate that light colors will produce lower temperatures due to their lower absorptivities. The difference between colors can be substantial. For these aluminum plates, the white painted plate was over 80 F cooler than the dark blue. It is recommended that paint color and resulting temperature be considered in determining the durability of paints and in determining the applications most suitable for various colors of paint.
CE 321 Sample Laboratory Report Packet
 CE 321 Sample Laboratory Report Packet This packet contains the following materials to help you prepare your lab reports in CE 321: An advice table with Dr. Wallace s hints regarding common strengths and
GENERAL INSTRUCTIONS
 Read these before doing any work in laboratory Safety: GENERAL INSTRUCTIONS 1) Eye protection must be worn at all times in the laboratory. Minimum eye protection is eye glasses with side shields. Safety
Calculus at Rutgers. Course descriptions
 Calculus at Rutgers This edition of Jon Rogawski s text, Calculus Early Transcendentals, is intended for students to use in the three-semester calculus sequence Math 151/152/251 beginning with Math 151
MECHANICAL ENGINEERING TECHNOLOGY ESSENTIALS FOR LABORATORY REPORTS
 MECHANICAL ENGINEERING TECHNOLOGY ESSENTIALS FOR LABORATORY REPORTS The laboratory report should be clear and concise. A well written laboratory report should have an acceptable form, and free of any grammatical
Institute for Global Environmental Strategies: Discover Earth Program Materials
 Lesson Summary Students will use either a computer interface or a thermometer and graph paper to learn about the different absorption properties of different albedos. Prior Knowledge & Skills Graphing
How not to give a poster: Some suggestions based on years of experience. D. Lund (credit to J. Granger)
") How not to give a poster: Some suggestions based on years of experience D. Lund (credit to J. Granger) Purpose of a Poster Summarize research concisely and attractively Help publicize it and generate discussion
How not to give a poster: Some suggestions based on years of experience D. Lund (credit to J. Granger) Purpose of a Poster Summarize research concisely and attractively Help publicize it and generate discussion
Introduction to Uncertainty and Treatment of Data
 Introduction to Uncertainty and Treatment of Data Introduction The purpose of this experiment is to familiarize the student with some of the instruments used in making measurements in the physics laboratory,
Uncertainty, Error, and Precision in Quantitative Measurements an Introduction 4.4 cm Experimental error
 Uncertainty, Error, and Precision in Quantitative Measurements an Introduction Much of the work in any chemistry laboratory involves the measurement of numerical quantities. A quantitative measurement
Guidance for Writing Lab Reports for PHYS 233:
 Guidance for Writing Lab Reports for PHYS 233: The following pages have a sample lab report that is a model of what we expect for each of your lab reports in PHYS 233. It is written for a lab experiment
A (Mostly) Correctly Formatted Sample Lab Report. Brett A. McGuire Lab Partner: Microsoft Windows Section AB2
 Correctly Formatted Sample Lab Report. Brett A. McGuire Lab Partner: Microsoft Windows Section AB2") A (Mostly) Correctly Formatted Sample Lab Report Brett A. McGuire Lab Partner: Microsoft Windows Section AB2 August 26, 2008 Abstract Your abstract should not be indented and be single-spaced. Abstracts
A (Mostly) Correctly Formatted Sample Lab Report Brett A. McGuire Lab Partner: Microsoft Windows Section AB2 August 26, 2008 Abstract Your abstract should not be indented and be single-spaced. Abstracts
Relationships Between Quantities
 Algebra 1 Relationships Between Quantities Relationships Between Quantities Everyone loves math until there are letters (known as variables) in problems!! Do students complain about reading when they come
Format and Style Guide for Technical Reports
 Format and Style Guide for Technical Reports prepared by R.E. Link, Asst. Professor W.W. Taylor, LT Colonel, USAF Mechanical Engineering Department U.S. Naval Academy August 1998 Table of Contents I.
Using Microsoft Excel
 Using Microsoft Excel Objective: Students will gain familiarity with using Excel to record data, display data properly, use built-in formulae to do calculations, and plot and fit data with linear functions.
PHYS 228 Template Example
 PHYS 228 Template Example Author 1, Author 2, and Research Advisor Name Street Address (optional), Dept, Institution, City, State, Zip Code (Dated: August 31, 2017) The abstract should summarize the paper
LABORATORY II DESCRIPTION OF MOTION IN TWO DIMENSIONS
 LABORATORY II DESCRIPTION OF MOTION IN TWO DIMENSIONS This laboratory allows you to continue the study of accelerated motion in more realistic situations. The cars you used in Laboratory I moved in only
2 One-dimensional motion with constant acceleration
 2 One-dimensional motion with constant acceleration Experiment objectives: 1. Achieve a better understanding of how to solve position, velocity and acceleration problems in one-dimensional motion with
Chemistry 883 Computational Quantum Chemistry
 Chemistry 883 Computational Quantum Chemistry Instructor Contact Information Professor Benjamin G. Levine levine@chemistry.msu.edu 215 Chemistry Building 517-353-1113 Office Hours Tuesday 9:00-11:00 am
2 Electric Field Mapping Rev1/05
 2 Electric Field Mapping Rev1/05 Theory: An electric field is a vector field that is produced by an electric charge. The source of the field may be a single charge or many charges. To visualize an electric
EAS 535 Laboratory Exercise Weather Station Setup and Verification
 EAS 535 Laboratory Exercise Weather Station Setup and Verification Lab Objectives: In this lab exercise, you are going to examine and describe the error characteristics of several instruments, all purportedly
Appendix A. Linear Relationships in the Real World Unit
 Appendix A The Earth is like a giant greenhouse. The sun s energy passes through the atmosphere and heats up the land. Some of the heat escapes back into space while some of it is reflected back towards
PHY 123 Lab 1 - Error and Uncertainty and the Simple Pendulum
 To print higher-resolution math symbols, click the Hi-Res Fonts for Printing button on the jsmath control panel. PHY 13 Lab 1 - Error and Uncertainty and the Simple Pendulum Important: You need to print
Treatment of Error in Experimental Measurements
 in Experimental Measurements All measurements contain error. An experiment is truly incomplete without an evaluation of the amount of error in the results. In this course, you will learn to use some common
Elementary Linear Algebra, Second Edition, by Spence, Insel, and Friedberg. ISBN Pearson Education, Inc., Upper Saddle River, NJ.
 2008 Pearson Education, Inc., Upper Saddle River, NJ. All rights reserved. APPENDIX: Mathematical Proof There are many mathematical statements whose truth is not obvious. For example, the French mathematician
LECSS Physics 11 Introduction to Physics and Math Methods 1 Revised 8 September 2013 Don Bloomfield
 LECSS Physics 11 Introduction to Physics and Math Methods 1 Physics 11 Introduction to Physics and Math Methods In this introduction, you will get a more in-depth overview of what Physics is, as well as
Relations and Functions
 Algebra 1, Quarter 2, Unit 2.1 Relations and Functions Overview Number of instructional days: 10 (2 assessments) (1 day = 45 60 minutes) Content to be learned Demonstrate conceptual understanding of linear
PHYS 281 General Physics Laboratory
 King Abdul-Aziz University Faculty of Science Physics Department PHYS 281 General Physics Laboratory Student Name: ID Number: Introduction Advancement in science and engineering has emphasized the microscopic
How to Write a Laboratory Report
 How to Write a Laboratory Report For each experiment you will submit a laboratory report. Laboratory reports are to be turned in at the beginning of the lab period, one week following the completion of
Lab 5: Calculating an equilibrium constant
 Chemistry 162 The following write-up is inaccurate for the particular chemicals we are using. Please have all sections up through and including the data tables ready before class on Wednesday, February
Scientific Literacy & the Scientific Method
 Scientific Literacy & the Scientific Method What does it mean to be? You ve probably hear that term before, and you might be thinking that literate means the ability to and. But what does it mean to be
Editing & Proofreading. Bowker, COMM 390
 Editing & Proofreading Bowker, COMM 390 Before You Start Consider Your Audience: } Will they need persuading? } Is it for a technical audience? } Is budget a deciding factor? } Are there poli;cal implica;ons?
Linear Motion with Constant Acceleration
 Linear Motion 1 Linear Motion with Constant Acceleration Overview: First you will attempt to walk backward with a constant acceleration, monitoring your motion with the ultrasonic motion detector. Then
VI. OBSERVATIONS / DATA COLLECTION:
 Lab Write-Up Format THIS OUTLINE WILL HELP YOU TO WRITE OUT YOUR LABS. There may be changes or modifications but all elements must be included in your lab write-up. Each section on your lab paper must
BASIC TECHNOLOGY Pre K starts and shuts down computer, monitor, and printer E E D D P P P P P P P P P P
 BASIC TECHNOLOGY Pre K 1 2 3 4 5 6 7 8 9 10 11 12 starts and shuts down computer, monitor, and printer P P P P P P practices responsible use and care of technology devices P P P P P P opens and quits an
Experiment 0 ~ Introduction to Statistics and Excel Tutorial. Introduction to Statistics, Error and Measurement
 Experiment 0 ~ Introduction to Statistics and Excel Tutorial Many of you already went through the introduction to laboratory practice and excel tutorial in Physics 1011. For that reason, we aren t going
Name Date Period ID# Identification of Substances by Physical and Chemical Properties Lab Activity
 Name Date Period ID# Identification of Substances by Physical and Chemical Properties Lab Activity Standards: PS1(9-11) INQ1, PS1(1a), ESS1 (9-11) SAE+POC-3, ESS1 (3d) Essential Questions: -How should
Error Analysis, Statistics and Graphing Workshop
 Error Analysis, Statistics and Graphing Workshop Percent error: The error of a measurement is defined as the difference between the experimental and the true value. This is often expressed as percent (%)
LAB 2 - ONE DIMENSIONAL MOTION
 Name Date Partners L02-1 LAB 2 - ONE DIMENSIONAL MOTION OBJECTIVES Slow and steady wins the race. Aesop s fable: The Hare and the Tortoise To learn how to use a motion detector and gain more familiarity
Solar Matters II Teacher Page
 Solar Matters II Teacher Page Sun and Shade Student Objective The student: will be able to explain the effect of solar thermal energy will be able to predict the effect of solar energy on temperature in
PHYSICS 212 LABORATORY MANUAL CALVIN COLLEGE
 PHYSICS 212 LABORATORY MANUAL CALVIN COLLEGE 2003 Physics 212 Calvin College Variables and Fair Tests (adapted from Physics 113 lab manual) Suppose I wanted to determine whether being in darkness would
Determination of Density 1
 Introduction Determination of Density 1 Authors: B. D. Lamp, D. L. McCurdy, V. M. Pultz and J. M. McCormick* Last Update: February 1, 2013 Not so long ago a statistical data analysis of any data set larger
Traditionally, an Algebra 1 course focuses on
 Traditionally, an Algebra 1 course focuses on rules or specific strategies for solving standard types of symbolic manipulation problems usually to simplify or combine expressions or solve equations. For
Properties of Matter
 Grade 7 Science, Quarter 1, Unit 1.1 Properties of Matter Overview Number of instructional days: 15 (1 day = 50 minutes) Content to be learned Identify different substances using data about characteristic
Lab 11 Simple Harmonic Motion A study of the kind of motion that results from the force applied to an object by a spring
 Lab 11 Simple Harmonic Motion A study of the kind of motion that results from the force applied to an object by a spring Print Your Name Print Your Partners' Names Instructions April 20, 2016 Before lab,
Measurement and Measurement Errors
 1 Measurement and Measurement Errors Introduction Physics makes very general yet quite detailed statements about how the universe works. These statements are organized or grouped together in such a way
1. Original Form Redesigned Form...5 III. Designs Created Using Supplied Text & Information. 1. Business Card STC Flyer...
 Table of Contents I. Introduction A. Foreword..........2 B. Conceptual Model.............3 II. Designs Based on an Existing Work A. Images 1. Scanning & Editing...4 2. Embellishments...4 B. F o r m M a
LABORATORY V ENERGY. Use the conservation of energy to predict the outcome of interactions between objects.
 LABORATORY V ENERGY In this lab, you will begin to use the principle of conservation of energy to determine the motion resulting from interactions that are difficult to analyze using force concepts alone.
Solar Energy Cooking with the Sun
 Student Handout: Experiment - Where is the sun? Name: Date: Measuring the current Solar Azimuth and Solar Angle 1. Use the level to find a section of concrete that is relatively level. Your instructor
The Chemistry of Respiration and Photosynthesis
 The Chemistry of Respiration and Photosynthesis Objective- You should be able to write balanced equations for respiration and photosynthesis and explain how the two equations are related. Directions :
Fundamentals of Mathematics I
 Fundamentals of Mathematics I Kent State Department of Mathematical Sciences Fall 2008 Available at: http://www.math.kent.edu/ebooks/10031/book.pdf August 4, 2008 Contents 1 Arithmetic 2 1.1 Real Numbers......................................................
SCIENTIFIC WRITING. Based mainly on the AIP Style guide and The Technical Writer s Handbook by Matt Young.
 SCIENTIFIC WRITING Based mainly on the AIP Style guide and The Technical Writer s Handbook by Matt Young. OVERVIEW The structure of scientific reports Writing with clarity Scientific style conventions
CHAPTER 1: Functions
 CHAPTER 1: Functions 1.1: Functions 1.2: Graphs of Functions 1.3: Basic Graphs and Symmetry 1.4: Transformations 1.5: Piecewise-Defined Functions; Limits and Continuity in Calculus 1.6: Combining Functions
The First Derivative Test
 The First Derivative Test We have already looked at this test in the last section even though we did not put a name to the process we were using. We use a y number line to test the sign of the first derivative
The role of multiple representations in the understanding of ideal gas problems Madden S. P., Jones L. L. and Rahm J.
 www.rsc.org/ xxxxxx XXXXXXXX The role of multiple representations in the understanding of ideal gas problems Madden S. P., Jones L. L. and Rahm J. Published in Chemistry Education Research and Practice,
Scientific Notation and Scaled Models
 Scientific Notation and Scaled Models Topic Scientific notation is a practical way to compare the sizes of bodies in the solar system. Introduction Scientific notation was developed to aid scientists in
Geotechnical Engineering Laboratory (CE 4348) Laboratory Report #1. Soil Classification. Group #1. Group member #1 Group member #2 Group member #3
 Laboratory Report #1. Soil Classification. Group #1. Group member #1 Group member #2 Group member #3") Geotechnical Engineering Laboratory (CE 4348) Laboratory Report #1 Soil Classification Group #1 Group member #1 Group member #2 Group member #3 February 4, 2013 I have neither given nor received unauthorized
Geotechnical Engineering Laboratory (CE 4348) Laboratory Report #1 Soil Classification Group #1 Group member #1 Group member #2 Group member #3 February 4, 2013 I have neither given nor received unauthorized
Volume vs. Diameter. Teacher Lab Discussion. Overview. Picture, Data Table, and Graph
 5 6 7 Middle olume Length/olume vs. Diameter, Investigation page 1 of olume vs. Diameter Teacher Lab Discussion Overview Figure 1 In this experiment we investigate the relationship between the diameter
Measurement: The Basics
 I. Introduction Measurement: The Basics Physics is first and foremost an experimental science, meaning that its accumulated body of knowledge is due to the meticulous experiments performed by teams of
Scientific Method. Section 1. Observation includes making measurements and collecting data. Main Idea
 Scientific Method Section 1 2B, 2C, 2D Key Terms scientific method system hypothesis model theory s Observation includes making measurements and collecting data. Sometimes progress in science comes about
Q25: Record the wavelength of each colored line according to the scale given.
 C. Measurement Errors and Uncertainties The term "error" signifies a deviation of the result from some "true" value. Often in science, we cannot know what the true value is, and we can only determine estimates
Newton s Second Law of Motion
 Newton s Second Law of Motion Topic Newton s second law of motion describes how acceleration is related to force and mass. Introduction Newton s second law of motion states that the acceleration of an
LABORATORY II DESCRIPTION OF MOTION IN TWO DIMENSIONS
 LABORATORY II DESCRIPTION OF MOTION IN TWO DIMENSIONS In this laboratory you continue the study of accelerated motion in more situations. The carts you used in Laboratory I moved in only one dimension.
5th Grade Science Syllabus and Classroom Expectations
 5th Grade Science Syllabus and Classroom Expectations Class Description: The organization of this class will include topics from the physical sciences, Biology, and earth Science. This year you will be
Appendix A: Laboratory Report Format
 Appendix A: Laboratory Report Format This appendix contains details on the format for formal written laboratory reports in the form of author's instructions. Author's Instructions for ME354 Formal Lababoratory
LABORATORY V CONSERVATION OF MOMENTUM
 LABORATORY V CONSERVATION OF MOMENTUM In this lab you will use conservation of momentum to predict the motion of objects resulting from interactions that are difficult to analyze with force concepts or
IB Physics STUDENT GUIDE 13 and Processing (DCP)
") IB Physics STUDENT GUIDE 13 Chapter Data collection and PROCESSING (DCP) Aspect 1 Aspect Aspect 3 Levels/marks Recording raw data Processing raw data Presenting processed data Complete/ Partial/1 Not at
IB Physics STUDENT GUIDE 13 Chapter Data collection and PROCESSING (DCP) Aspect 1 Aspect Aspect 3 Levels/marks Recording raw data Processing raw data Presenting processed data Complete/ Partial/1 Not at
Please bring the task to your first physics lesson and hand it to the teacher.
 Pre-enrolment task for 2014 entry Physics Why do I need to complete a pre-enrolment task? This bridging pack serves a number of purposes. It gives you practice in some of the important skills you will
Experimental Uncertainty (Error) and Data Analysis
 and Data Analysis") Experimental Uncertainty (Error) and Data Analysis Advance Study Assignment Please contact Dr. Reuven at yreuven@mhrd.org if you have any questions Read the Theory part of the experiment (pages 2-14) and
Experimental Uncertainty (Error) and Data Analysis Advance Study Assignment Please contact Dr. Reuven at yreuven@mhrd.org if you have any questions Read the Theory part of the experiment (pages 2-14) and
CSCE 155N Fall Homework Assignment 2: Stress-Strain Curve. Assigned: September 11, 2012 Due: October 02, 2012
 CSCE 155N Fall 2012 Homework Assignment 2: Stress-Strain Curve Assigned: September 11, 2012 Due: October 02, 2012 Note: This assignment is to be completed individually - collaboration is strictly prohibited.
Reference Guide. Science Reference 9/25/ Copyright 1996 Gary Lewis Revisions 2007 by John Pratte
 Reference Guide Contents...1 1. General Scientific Terminology...2 2. Types of Errors...3 3. Scientific Notation...4 4. Significant Figures...6 5. Graphs...7 6. Making Measurements...8 7. Units...9 8.
SCIENTIFIC INQUIRY AND CONNECTIONS. Recognize questions and hypotheses that can be investigated according to the criteria and methods of science
 SUBAREA I. COMPETENCY 1.0 SCIENTIFIC INQUIRY AND CONNECTIONS UNDERSTAND THE PRINCIPLES AND PROCESSES OF SCIENTIFIC INQUIRY AND CONDUCTING SCIENTIFIC INVESTIGATIONS SKILL 1.1 Recognize questions and hypotheses
Physics 2020 Laboratory Manual
 Physics 00 Laboratory Manual Department of Physics University of Colorado at Boulder Spring, 000 This manual is available for FREE online at: http://www.colorado.edu/physics/phys00/ This manual supercedes
Experiment 12: SPECTROSCOPY: EMISSION & ABSORPTION
 Sample Experiment 12: SPECTROSCOPY: EMISSION & ABSORPTION Purpose: Emission and absorption spectroscopy is to be explored from different perspectives in a multipart experiment. Part I: Certain elements
Radiological Control Technician Training Fundamental Academic Training Study Guide Phase I
 Module 1.01 Basic Mathematics and Algebra Part 4 of 9 Radiological Control Technician Training Fundamental Academic Training Phase I Coordinated and Conducted for the Office of Health, Safety and Security
Introduction to Computer Tools and Uncertainties
 Experiment 1 Introduction to Computer Tools and Uncertainties 1.1 Objectives To become familiar with the computer programs and utilities that will be used throughout the semester. To become familiar with
Fundamentals of Measurement and Error Analysis
 Lab 1 Fundamentals of Measurement and Error Analysis 1.1 Overview This first laboratory exercise introduces key concepts and statistical and plotting tools that are used throughout the entire sequence
WeatherHawk Weather Station Protocol
 WeatherHawk Weather Station Protocol Purpose To log atmosphere data using a WeatherHawk TM weather station Overview A weather station is setup to measure and record atmospheric measurements at 15 minute
After successfully completing this laboratory assignment, including the assigned reading, the lab
 University of California at Santa Cruz Jack Baskin School of Engineering Electrical Engineering Department EE-145L: Properties of Materials Laboratory Lab 6: Temperature Dependence of Semiconductor Conductivity
Chemical Engineering Department University of Florida UNIT OPERATIONS LABORATORY. ECH 4224 L and ECH 4404 L GUIDELINES FOR WRITING LABORATORY REPORTS
 Chemical Engineering Department University of Florida UNIT OPERATIONS LABORATORY ECH 4224 L and ECH 4404 L GUIDELINES FOR WRITING LABORATORY REPORTS by Prof. Oscar D. Crisalle 1994-2006 Revision 8 PREFACE
Unit 6 Quadratic Relations of the Form y = ax 2 + bx + c
 Unit 6 Quadratic Relations of the Form y = ax 2 + bx + c Lesson Outline BIG PICTURE Students will: manipulate algebraic expressions, as needed to understand quadratic relations; identify characteristics
Lab 2. Projectile Motion
 Lab 2. Projectile Motion Goals To determine the launch speed of a projectile and its uncertainty by measuring how far it travels horizontally before landing on the floor (called the range) when launched
Lab 4. Friction. Goals. Introduction
 Lab 4. Friction Goals To determine whether the simple model for the frictional force presented in the text, where friction is proportional to the product of a constant coefficient of friction, µ K, and
Part 2 Practise Your Skills
 Part 2 Practise Your Skills In this section of Learn Smart, you will have the opportunity to use a wide variety of reading strategies read and understand different texts and visual information ask questions,
Measurements and Data Analysis
 Measurements and Data Analysis 1 Introduction The central point in experimental physical science is the measurement of physical quantities. Experience has shown that all measurements, no matter how carefully
Introduction to the General Physics Laboratories
 Introduction to the General Physics Laboratories September 5, 2007 Course Goals The goal of the IIT General Physics laboratories is for you to learn to be experimental scientists. For this reason, you
Unit 22: Sampling Distributions
 Unit 22: Sampling Distributions Summary of Video If we know an entire population, then we can compute population parameters such as the population mean or standard deviation. However, we generally don
LABORATORY VI MOMENTUM
 LABORATORY VI MOMENTUM In this lab you will use conservation of momentum to predict the motion of objects motions resulting from collisions. It is often difficult or impossible to obtain enough information
Fog Chamber Testing the Label: Photo of Fog. Joshua Gutwill 10/29/1999
 Fog Chamber Testing the Label: Photo of Fog Joshua Gutwill 10/29/1999 Keywords: < > formative heat&temp exhibit interview 1 Goals/Context Fog Chamber Interview Results Testing Label: Photo of fog on Golden
Effective January 2008 All indicators in Standard / 11
 Scientific Inquiry 8-1 The student will demonstrate an understanding of technological design and scientific inquiry, including process skills, mathematical thinking, controlled investigative design and
STUDY GUIDE Math 20. To accompany Intermediate Algebra for College Students By Robert Blitzer, Third Edition
 STUDY GUIDE Math 0 To the students: To accompany Intermediate Algebra for College Students By Robert Blitzer, Third Edition When you study Algebra, the material is presented to you in a logical sequence.
LABORATORY 4: ROTATIONAL MOTION PLAYGROUND DYNAMICS: THE MERRY-GO-ROUND Written May-June 1993 by Melissa Wafer '95
 LABORATORY 4: ROTATIONAL MOTION PLAYGROUND DYNAMICS: THE MERRY-GO-ROUND Written May-June 1993 by Melissa Wafer '95 In this laboratory period, you will use something that should be familiar to you to explain
Title of Activity: Let there be Light! Introduction to Ohm's Law and basic series circuits.
 Title of Activity: Let there be Light! Introduction to Ohm's Law and basic series circuits. Concepts Covered: Circuitry is in all of our electronics. This circuits must be asembled in specific ways to
Physics 6A Lab Experiment 6
 Biceps Muscle Model Physics 6A Lab Experiment 6 Introduction This lab will begin with some warm-up exercises to familiarize yourself with the theory, as well as the experimental setup. Then you ll move
Experimental Uncertainty (Error) and Data Analysis
 and Data Analysis") E X P E R I M E N T 1 Experimental Uncertainty (Error) and Data Analysis INTRODUCTION AND OBJECTIVES Laboratory investigations involve taking measurements of physical quantities, and the process of taking
E X P E R I M E N T 1 Experimental Uncertainty (Error) and Data Analysis INTRODUCTION AND OBJECTIVES Laboratory investigations involve taking measurements of physical quantities, and the process of taking
Understanding 1D Motion
 Understanding 1D Motion OBJECTIVE Analyze the motion of a student walking across the room. Predict, sketch, and test position vs. time kinematics graphs. Predict, sketch, and test velocity vs. time kinematics
Know Your Uncertainty
 April 2000 METROLOGY Know Your Uncertainty Understanding and documenting measurement uncertainty is key to gage calibration. By Henrik S. Nielsen, Ph.D. The process of developing uncertainty budgets requires
Conventional versus electron flow
 Conventional versus electron flow "The nice thing about standards is that there are so many of them to choose from." Andrew S. Tanenbaum, computer science professor When Benjamin Franklin made his conjecture
LAB: MOTION ON HILLS
 LAB: MOTION ON HILLS Introduction In this three-part activity, you will first study an object whose speed is changing while it moves downhill In this lab, the two variables you are focusing on are time
Let s start by defining what it means for two statements to be logically equivalent.
 Boolean Algebra Boolean Algebra ( ) So far we have been presented with statements such as p, q, p, p q, p q, etc. It would be nice if we had a means of manipulating these statements in an algebraic manner.
Manual of Logical Style
 Manual of Logical Style Dr. Holmes January 9, 2015 Contents 1 Introduction 2 2 Conjunction 3 2.1 Proving a conjunction...................... 3 2.2 Using a conjunction........................ 3 3 Implication