Supplementary Materials for
|
|
|
- Willa Atkins
- 6 years ago
- Views:
Transcription
1 Supplementary Materials for Neuroprosthetic-enabled control of graded arm muscle contraction in a paralyzed human David A. Friedenberg PhD 1,*, Michael A. Schwemmer PhD 1, Andrew J. Landgraf PhD 1, Nicholas V. Annetta MS 2, Marcia A. Bockbrader MD PhD 3,4, Chad E. Bouton MS 2, Mingming Zhang PhD 2, Ali R. Rezai MD 3,5, W. Jerry Mysiw MD 3,4, Herbert S. Bresler PhD 2, Gaurav Sharma PhD 2 correspondence to: friedenbergd@battelle.org This file includes: Supplementary Methods Supplementary References Figs. S1 to S4 Tables S1 to S2 Captions for Movies S1 to S3 Other Supplementary Materials for this manuscript includes the following: Movies S1 to S3
2 Supplementary Methods Stimulation Parameters and Calibration The stimulation intensity and spatial pattern were determined by using a trial-and-error method. After the operator determined the pattern needed in order to evoke the wrist flexion with the elastic band pulling on the hand, the stimulation intensity was captured at three levels producing: (1) wrist flection that just started to move the wrist from the rest position (low); (2) wrist flexion that pointed the hand straight ahead (medium); and (3) flexing of the wrist to full deflection (high). The three levels of deflection were all visually determined by the operator. The decoder output score (after the stabilizing filter), r filt, was then used to set the stimulation level, Ip(r filt ), for each low-side electrode during real-time decoding. A piecewise linear function was used to in order to interpolate between the three calibrated stimulation intensities as follows: Ip(r filt ) = 0, c [r filt (m l) + 0.5l 0.2m]/0.3, c [r filt (1 m) m 0.5]/0.21, c, r filt < r filt < r filt < 0.71 r filt 0.71 where c is the pulse current calibrated at maximum deflection in milliamps and where l and m are multipliers to that, calibrated to low and medium deflection, respectively, in the range of 0 to 1. The stimulation current level Ip(r filt ) is in terms of pulse amplitude in milliamps. The thresholds of 0.2, 0.5, and 0.71 were derived empirically and were used to compensate for the nonlinear response of the muscles to surface stimulation. During the Graded Control of Muscle Contraction Using BCI-FES System task, the stimulation patterns used the electrodes shown in Fig. S1. The low side electrodes were initially calibrated to pulse amplitudes of ma. These were later recalibrated to ma between Test Blocks 3 and 4. The low and medium multipliers were set to 0.30 and 0.42, respectively, for both calibrations. Smoothing Decoder Output To facilitate smooth movement, the output of the decoder was filtered. The filter allowed the system to respond quickly to strong, fast changes in the decoder output, but maintain a steady output when the decoder output was not changing significantly. During every 100ms processing loop, after the decoder output, r, is calculated, the filter windows are updated, and finally the filtered output, r filt, is calculated using the windows as follows: If r < b lo, set b lo = r and b hi = r + W. Else if r > b hi, set b hi = r and b lo = r W. r filt = b hi + b lo 2
3 where b hi and b lo are the upper and lower bounds of the filter window and W is the size of the filter window (W = 0.2 for these experiments). Estimating wrist position for the Imagined Graded Control of Muscle Contraction Experiment During the Imagined Graded Control of Muscle Contraction task, the virtual needle was modeled after the wrist to give the subject similar position feedback to the Graded Control of Muscle Contraction Using BCI-FES System task. A simple model was created to estimate wrist position. The net torque on the wrist, τ, was empirically derived to be τ contract µωθ 2 i Aθ 3 i, ω 0 τ = { τ contract µωθ i 2 Aθ 3 2 i, ω > 0 whereτ contract is the torque on the wrist due to the stimulation induced muscle contraction, calculated based on scaling the decoder output score; µ is the empirically derived damping/friction coefficient; ω is the angular velocity of the wrist; θ i is the initial angle of deflection of the wrist; and A is an empirically derived constant. From torque, the final angular position of the wrist, θ f, can be calculated by τ α = ml 2 ω f = ω i + α t θ f = θ i + ω i t α( t)2 = θ i + ω o + ω f t 2 where α is the angular acceleration of the wrist; l is the distance between the wrist and the point of contact of the rubber band and the hand; m is the empirically derived mass of the hand; ω f is the final angular velocity of the wrist; ω i is the initial angular velocity of the wrist; and t is the change in time. Permutation Test Permutation tests were run for each channel to test whether the peak MWP was different between the cued angles. For each channel and cued angle, a LOESS (1) smooth curve was fit to the MWP as a function of time since the start of the cue, as shown in Fig. 3. The peaks of the LOESS curves for each of the cued angles was recorded. In order to avoid finding peaks that are the result of high MWP from the previous cue, we only looked for the peak between 0.5 s and 2.5 s. Random permutations were generated in order to create a null distribution where the peaks are expected to be the same. For each permutation, the cued angles were randomly swapped, the LOESS curves were fit again for each cued angle, and the peaks of the LOESS curves for each angle were recorded; 5,000 random permutations were generated and their associated peaks were recorded. Finally, the difference between the peaks at different cued angles of the LOESS curves from the actual data was compared to the differences in the permuted data. For example, for the null hypothesis that angle A is less than or equal to angle B, if the actual difference in the peak MWP from angle A and angle B is larger than 950 of the permuted
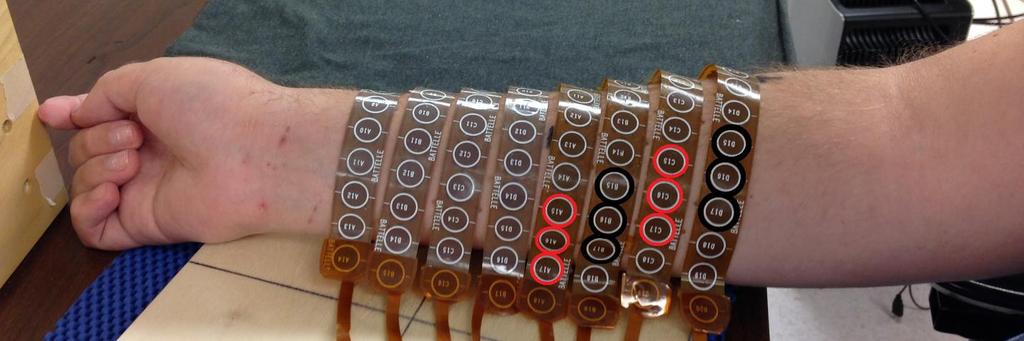
4 differences, then the p-value is Comparison of Beta Regression and SVR To compare beta regression and SVR, we trained both algorithms on the first five blocks of the imagined graded control of muscle contraction experiment and predicted the response on the final two blocks. The response was lagged by 0.8 s to allow for reaction time similar to Bouton et al. (2). The Wilcoxon rank sum test was used to test the null hypothesis that the median of the predicted absolute errors is larger for SVR than for beta regression. The null hypothesis was rejected with a p-value less than 0.001, giving strong evidence that SVR has a lower median absolute error than beta regression. Video Evaluation Metrics A digital camera was positioned directly over the participant s hand and recorded HD video at 30 frames per second during the experiment. The video was aligned in time with the cues using an audio cue prior to the beginning of the experiment. The two colored cots placed on the plastic cylinder were used to locate the cylinder in space. A line was drawn from the center pixels of two colors, and the angle at which that line intersected the protractor was recorded as the observed angle. When the two points cannot be located due to motion blur, the last valid observed angle is used as a substitute. We created a 15 target window on either side of the target angle and measured the longest continuous block of time that the observed angle was sustained within the target window. This metric is calculated for the duration of the 5 s duration cue plus an additional 1.5 s buffer for non-rest cues to account for reaction time and the variable time it takes for the participant to physically move from rest to the target angle. We categorize a cued movement as successful if the participant sustained position in the target window for at least 2 s. Additionally, the exerted force was read off of the load cell using an object character recognition algorithm. A median filter with a window size of three was applied to the load cell values to correct the occasionally misidentified character. Supplementary References 1. W. S. Cleveland, E. Grosse, W. M. Shyu, Local regression models. Statistical models in S 2, 309 (1992). 2. C. E. Bouton, A. Shaikhouni, N. V. Annetta, M. A. Bockbrader, D. A. Friedenberg, D. M. Nielson, G. Sharma, P. B. Sederberg, B. C. Glenn, W. J. Mysiw, A. G. Morgan, M. Deogaonkar, A. R. Rezai, Restoring cortical control of functional movement in a human with quadriplegia. Nature 533, 247 (May 12, 2016). Fig. S1. Electrode cuff wrapped around forearm of the participant. Electrodes marked in red show anode and electrodes marked in black show cathode for stimulation.
5
6 Fig. S2. Cued angle is a good proxy for exerted force. Force exerted is plotted as a function of cued angle for both the training and test post-recalibration trials. The solid dots represent successes while the crosses represent times when the patient failed to match the cued angle. The two lines are the best-fit linear models for the successful training and test postrecalibration data points. The R 2 value for both lines is 0.98, indicating that when the participant is successful, force is strongly linearly related to the cued angle.
7 Fig. S3. Stimulation recalibration counteracts decrease in performance. Boxplots show the calibration difference distribution (CCD) for each block. The spread greatly increases starting with Test Block 1, which we believe is due to muscle fatigue, causing the same amount of stimulation to generate less muscle contraction. The stimulation parameters were recalibrated between Test Blocks 3 and 4 and led to a sizable decrease in the spread of CCD and a corresponding improvement in performance.
8 Fig. S4. For each cue, the 2 s where the average achieved angle was closest to the cued angles was extracted and the average achieved angle over that period is plotted against the cued angle. The colors show dataset groupings with linear regression lines and corresponding confidence bands. The middle dotted black line indicates the line of perfect performance where the achieved angle is exactly the cued angle; the upper and lower dotted black lines show the 15 tolerance bands of the target window.
9
10 Tables Table S1. Summary of FES-enabled force experiment. Stimulation parameters were recalibrated prior to Test Block 4. Block Number Block Name Angles Decoder Training Data 1 Setup 1 [ ] No Decoder 2 Setup 2 [ ] Setup 1 3 Train 1 [ ] Setup Train 2 [ ] Setup 1-2 Train 1 5 Train 3 [ ] Setup 2 Train Test 1 [ ] Train Test 2 [ ] Train Test 3 [ ] Train Test 4 [ ] Train Generalization Test 1 [ ] Train Generalization Test 2 [ ] Train 1-3 Table S2. Summary of beta regression model parameters. Channel # Estimate Std Err z-stat p-value Channel # Estimate Std Err z-stat p-value Intercept
11
12 Movie S1 Video of the subject attempting the graded control muscle contraction experiment with the FES system disabled. Movie S2 Video of Training Block 1 for the graded control muscle contraction experiment. On the left panel is the video from the overhead camera. The center panel shows cued angle (including the grace period) with the 15 target window on either side. The black line shows the angle the participant is pointing toward. When the pointed angle is within 15 of the cue, the slice will fill with color until either 2 s have elapsed or the participant moves outside the target region. The right panel shows the video processing that leads to the estimated pointing angle. Movie S3 Video of Generalization Block 1 for the graded control muscle contraction experiment. The panels are the same as in Movie S2. This block demonstrates the participant is able to grade his muscle contraction to point at the three interior angles that he had not attempted previously.
Exercises. Chapter 1. of τ approx that produces the most accurate estimate for this firing pattern.
 1 Exercises Chapter 1 1. Generate spike sequences with a constant firing rate r 0 using a Poisson spike generator. Then, add a refractory period to the model by allowing the firing rate r(t) to depend
Temporal context calibrates interval timing
 Temporal context calibrates interval timing, Mehrdad Jazayeri & Michael N. Shadlen Helen Hay Whitney Foundation HHMI, NPRC, Department of Physiology and Biophysics, University of Washington, Seattle, Washington
EXPERIMENT 7: ANGULAR KINEMATICS AND TORQUE (V_3)
") TA name Lab section Date TA Initials (on completion) Name UW Student ID # Lab Partner(s) EXPERIMENT 7: ANGULAR KINEMATICS AND TORQUE (V_3) 121 Textbook Reference: Knight, Chapter 13.1-3, 6. SYNOPSIS In
TA name Lab section Date TA Initials (on completion) Name UW Student ID # Lab Partner(s) EXPERIMENT 7: ANGULAR KINEMATICS AND TORQUE (V_3) 121 Textbook Reference: Knight, Chapter 13.1-3, 6. SYNOPSIS In
Single-Trial Neural Correlates. of Arm Movement Preparation. Neuron, Volume 71. Supplemental Information
 Neuron, Volume 71 Supplemental Information Single-Trial Neural Correlates of Arm Movement Preparation Afsheen Afshar, Gopal Santhanam, Byron M. Yu, Stephen I. Ryu, Maneesh Sahani, and K rishna V. Shenoy
Business Analytics and Data Mining Modeling Using R Prof. Gaurav Dixit Department of Management Studies Indian Institute of Technology, Roorkee
 Business Analytics and Data Mining Modeling Using R Prof. Gaurav Dixit Department of Management Studies Indian Institute of Technology, Roorkee Lecture - 04 Basic Statistics Part-1 (Refer Slide Time: 00:33)
Basic Statistics. 1. Gross error analyst makes a gross mistake (misread balance or entered wrong value into calculation).
.") Basic Statistics There are three types of error: 1. Gross error analyst makes a gross mistake (misread balance or entered wrong value into calculation). 2. Systematic error - always too high or too low
Basic Statistics There are three types of error: 1. Gross error analyst makes a gross mistake (misread balance or entered wrong value into calculation). 2. Systematic error - always too high or too low
Investigating the Relationship Between Cavendish Temperature Fluctuation and Torsional Oscillation
 Investigating the Relationship Between Cavendish Temperature Fluctuation and Torsional Oscillation John Grasel 4 March 2010 Abstract The Cavendish apparatus measures the gravitational attraction between
Surface Electromyographic [EMG] Control of a Humanoid Robot Arm. by Edward E. Brown, Jr.
![Surface Electromyographic [EMG] Control of a Humanoid Robot Arm. by Edward E. Brown, Jr.](/thumbs/79/79102606.jpg "Surface Electromyographic [EMG] Control of a Humanoid Robot Arm. by Edward E. Brown, Jr.") Surface Electromyographic [EMG] Control of a Humanoid Robot Arm by Edward E. Brown, Jr. Goal is to extract position and velocity information from semg signals obtained from the biceps and triceps antagonistic
Surface Electromyographic [EMG] Control of a Humanoid Robot Arm by Edward E. Brown, Jr. Goal is to extract position and velocity information from semg signals obtained from the biceps and triceps antagonistic
Human Arm. 1 Purpose. 2 Theory. 2.1 Equation of Motion for a Rotating Rigid Body
 Human Arm Equipment: Capstone, Human Arm Model, 45 cm rod, sensor mounting clamp, sensor mounting studs, 2 cord locks, non elastic cord, elastic cord, two blue pasport force sensors, large table clamps,
MEAM 520. More Velocity Kinematics
 MEAM 520 More Velocity Kinematics Katherine J. Kuchenbecker, Ph.D. General Robotics, Automation, Sensing, and Perception Lab (GRASP) MEAM Department, SEAS, University of Pennsylvania Lecture 12: October
Functions and Data Fitting
 Functions and Data Fitting September 1, 2018 1 Computations as Functions Many computational tasks can be described by functions, that is, mappings from an input to an output Examples: A SPAM filter for
Simple Harmonic Motion ===============================================
 PHYS 1105 Last edit: May 25, 2017 SMU Physics Dept. Simple Harmonic Motion =============================================== Goal To determine the spring constant k and effective mass m eff of a real spring.
Determination of a Predictive Stiffness Model for a 1 DOF Human Inspired Robotic Joint
 Marquette University e-publications@marquette Master's Theses (2009 -) Dissertations, Theses, and Professional Projects Determination of a Predictive Stiffness Model for a 1 DOF Human Inspired Robotic
Game Physics. Game and Media Technology Master Program - Utrecht University. Dr. Nicolas Pronost
 Game and Media Technology Master Program - Utrecht University Dr. Nicolas Pronost Essential physics for game developers Introduction The primary issues Let s move virtual objects Kinematics: description
the rate of change of velocity with time a graphical representation of the distribution of ages within a population
 Glossary acceleration accuracy age-structure diagram alternative hypothesis angular acceleration angular momentum best-fit line buoyant force capacitor carrying capacity the rate of change of velocity
Application Note #3413
 Application Note #3413 Manual Tuning Methods Tuning the controller seems to be a difficult task to some users; however, after getting familiar with the theories and tricks behind it, one might find the
Lab Partner(s) TA Initials (on completion) EXPERIMENT 7: ANGULAR KINEMATICS AND TORQUE
 TA Initials (on completion) EXPERIMENT 7: ANGULAR KINEMATICS AND TORQUE") TA name Lab section Date TA Initials (on completion) Name UW Student ID # Lab Partner(s) EXPERIMENT 7: ANGULAR KINEMATICS AND TORQUE 117 Textbook Reference: Walker, Chapter 10-1,2, Chapter 11-1,3 SYNOPSIS
TA name Lab section Date TA Initials (on completion) Name UW Student ID # Lab Partner(s) EXPERIMENT 7: ANGULAR KINEMATICS AND TORQUE 117 Textbook Reference: Walker, Chapter 10-1,2, Chapter 11-1,3 SYNOPSIS
Course Review. Kin 304W Week 14: April 9, 2013
 Course Review Kin 304W Week 14: April 9, 2013 1 Today s Outline Format of Kin 304W Final Exam Course Review Hand back marked Project Part II 2 Kin 304W Final Exam Saturday, Thursday, April 18, 3:30-6:30
Experiment P28: Conservation of Linear and Angular Momentum (Smart Pulley)
") PASCO scientific Physics Lab Manual: P28-1 Experiment P28: Conservation of Linear and Angular Momentum (Smart Pulley) Concept Time SW Interface Macintosh File Windows File rotational motion 45 m 500 or
PASCO scientific Physics Lab Manual: P28-1 Experiment P28: Conservation of Linear and Angular Momentum (Smart Pulley) Concept Time SW Interface Macintosh File Windows File rotational motion 45 m 500 or
Estimation of Relationship between Stimulation Current and Force Exerted during Isometric Contraction
 Estimation of Relationship between Stimulation Current and Force Exerted during Isometric Contraction arxiv:1811.02795v1 [cs.hc] 7 Nov 2018 Tomoya Kitamura Email: t.kitamura.360@ms.saitama-u.ac.jp Sho
Simple Harmonic Motion
 1. Object Simple Harmonic Motion To determine the period of motion of objects that are executing simple harmonic motion and to check the theoretical prediction of such periods. 2. Apparatus Assorted weights
Spatial Analysis I. Spatial data analysis Spatial analysis and inference
 Spatial Analysis I Spatial data analysis Spatial analysis and inference Roadmap Outline: What is spatial analysis? Spatial Joins Step 1: Analysis of attributes Step 2: Preparing for analyses: working with
Supplemental Information. Noise and Correlations. in Parallel Perceptual Decision Making. Thomas U. Otto and Pascal Mamassian
 Current Biology, Volume 22 Supplemental Information Noise and Correlations in Parallel Perceptual Decision Making Thomas U. Otto and Pascal Mamassian Supplemental Inventory Figure S1 (related to Figure
Biost 518 Applied Biostatistics II. Purpose of Statistics. First Stage of Scientific Investigation. Further Stages of Scientific Investigation
 Biost 58 Applied Biostatistics II Scott S. Emerson, M.D., Ph.D. Professor of Biostatistics University of Washington Lecture 5: Review Purpose of Statistics Statistics is about science (Science in the broadest
An analysis of how coupling parameters influence nonlinear oscillator synchronization
 An analysis of how coupling parameters influence nonlinear oscillator synchronization Morris Huang, 1 Ben McInroe, 2 Mark Kingsbury, 2 and Will Wagstaff 3 1) School of Mechanical Engineering, Georgia Institute
Application of Newton/GMRES Method to Nonlinear Model Predictive Control of Functional Electrical Stimulation
 Proceedings of the 3 rd International Conference on Control, Dynamic Systems, and Robotics (CDSR 16) Ottawa, Canada May 9 10, 2016 Paper No. 121 DOI: 10.11159/cdsr16.121 Application of Newton/GMRES Method
The idiosyncratic nature of confidence
 SUPPLEMENTARY INFORMATION Articles DOI: 10.1038/s41562-017-0215-1 In the format provided by the authors and unedited. The idiosyncratic nature of confidence 1,2 Joaquin Navajas *, Chandni Hindocha 1,3,
Automatic Star-tracker Optimization Framework. Andrew Tennenbaum The State University of New York at Buffalo
 SSC17-VIII-6 Automatic Star-tracker Optimization Framework Andrew Tennenbaum The State University of New York at Buffalo aztennen@buffalo.edu Faculty Advisor: John Crassidis The State University of New
Multi Rotor Scalability
 Multi Rotor Scalability With the rapid growth in popularity of quad copters and drones in general, there has been a small group of enthusiasts who propose full scale quad copter designs (usable payload
Those data on the time required for the pitch to traverse various distances were measured in
 APPENDIX A: Ball Timing Measurements Those data on the time required for the pitch to traverse various distances were measured in the following way. To measure the time at which the ball was released from
AIM HIGH SCHOOL. Curriculum Map W. 12 Mile Road Farmington Hills, MI (248)
") AIM HIGH SCHOOL Curriculum Map 2923 W. 12 Mile Road Farmington Hills, MI 48334 (248) 702-6922 www.aimhighschool.com COURSE TITLE: Statistics DESCRIPTION OF COURSE: PREREQUISITES: Algebra 2 Students will
AIM HIGH SCHOOL Curriculum Map 2923 W. 12 Mile Road Farmington Hills, MI 48334 (248) 702-6922 www.aimhighschool.com COURSE TITLE: Statistics DESCRIPTION OF COURSE: PREREQUISITES: Algebra 2 Students will
Modeling nonlinear systems using multiple piecewise linear equations
 Nonlinear Analysis: Modelling and Control, 2010, Vol. 15, No. 4, 451 458 Modeling nonlinear systems using multiple piecewise linear equations G.K. Lowe, M.A. Zohdy Department of Electrical and Computer
Big Data Analysis with Apache Spark UC#BERKELEY
 Big Data Analysis with Apache Spark UC#BERKELEY This Lecture: Relation between Variables An association A trend» Positive association or Negative association A pattern» Could be any discernible shape»
Angular Motion Maximum Hand, Foot, or Equipment Linear Speed
 Motion Maximum Hand, Foot, or Equipment Linear Speed Biomechanical Model: Mo3on Maximum Hand, Foot, or Equipment Linear Speed Hand, Foot, or Equipment Linear Speed Sum of Joint Linear Speeds Principle
Introduction to Regression Analysis. Dr. Devlina Chatterjee 11 th August, 2017
 Introduction to Regression Analysis Dr. Devlina Chatterjee 11 th August, 2017 What is regression analysis? Regression analysis is a statistical technique for studying linear relationships. One dependent
Equilibrium in Two Dimensions
 C h a p t e r 6 Equilibrium in Two Dimensions In this chapter, you will learn the following to World Class standards: 1. The Ladder Against the Wall 2. The Street Light 3. The Floor Beam 6-1 The Ladder
Supplementary information
 This journal is The Royal Society of Chemistry 0 Supplementary information Pattern type Area (cm ) Hybrid 0 0 0.00 Hybrid 0 0 0.00 Hybrid 0 0 0.00 Line 00 µm 0.00 Line 0 µm 0.00 Line 0 µm 0.00 Line 0 µm
Nonparametric Location Tests: k-sample
 Nonparametric Location Tests: k-sample Nathaniel E. Helwig Assistant Professor of Psychology and Statistics University of Minnesota (Twin Cities) Updated 04-Jan-2017 Nathaniel E. Helwig (U of Minnesota)
CSC 411: Lecture 03: Linear Classification
 CSC 411: Lecture 03: Linear Classification Richard Zemel, Raquel Urtasun and Sanja Fidler University of Toronto Zemel, Urtasun, Fidler (UofT) CSC 411: 03-Classification 1 / 24 Examples of Problems What
UNIVERSITY OF TORONTO Faculty of Arts and Science
 UNIVERSITY OF TORONTO Faculty of Arts and Science December 2013 Final Examination STA442H1F/2101HF Methods of Applied Statistics Jerry Brunner Duration - 3 hours Aids: Calculator Model(s): Any calculator
EE 380 EXAM II 3 November 2011 Last Name (Print): First Name (Print): ID number (Last 4 digits): Section: DO NOT TURN THIS PAGE UNTIL YOU ARE TOLD TO
: First Name (Print): ID number (Last 4 digits): Section: DO NOT TURN THIS PAGE UNTIL YOU ARE TOLD TO") EE 380 EXAM II 3 November 2011 Last Name (Print): First Name (Print): ID number (Last 4 digits): Section: DO NOT TURN THIS PAGE UNTIL YOU ARE TOLD TO DO SO Problem Weight Score 1 25 2 25 3 25 4 25 Total
EE 380 EXAM II 3 November 2011 Last Name (Print): First Name (Print): ID number (Last 4 digits): Section: DO NOT TURN THIS PAGE UNTIL YOU ARE TOLD TO DO SO Problem Weight Score 1 25 2 25 3 25 4 25 Total
DOUBLE ARM JUGGLING SYSTEM Progress Presentation ECSE-4962 Control Systems Design
 DOUBLE ARM JUGGLING SYSTEM Progress Presentation ECSE-4962 Control Systems Design Group Members: John Kua Trinell Ball Linda Rivera Introduction Where are we? Bulk of Design and Build Complete Testing
University of Bristol - Explore Bristol Research
 Alderisio, F., Fiore, G., Salesse, R., Bardy, B., & Di Bernardo, M. (27). Interaction patterns and individual dynamics shape the way we move in synchrony. Scientific Reports, 7, [6846]. https://doi.org/.38/s4598-7-
MEASURE, MODELING AND COMPENSATION OF FATIGUE-INDUCED DELAY DURING NEUROMUSCULAR ELECTRICAL STIMULATION
 MEASURE, MODELING AND COMPENSATION OF FATIGUE-INDUCED DELAY DURING NEUROMUSCULAR ELECTRICAL STIMULATION By FANNY BOUILLON A THESIS PRESENTED TO THE GRADUATE SCHOOL OF THE UNIVERSITY OF FLORIDA IN PARTIAL
Sound Recognition in Mixtures
 Sound Recognition in Mixtures Juhan Nam, Gautham J. Mysore 2, and Paris Smaragdis 2,3 Center for Computer Research in Music and Acoustics, Stanford University, 2 Advanced Technology Labs, Adobe Systems
Why Is It There? Attribute Data Describe with statistics Analyze with hypothesis testing Spatial Data Describe with maps Analyze with spatial analysis
 6 Why Is It There? Why Is It There? Getting Started with Geographic Information Systems Chapter 6 6.1 Describing Attributes 6.2 Statistical Analysis 6.3 Spatial Description 6.4 Spatial Analysis 6.5 Searching
Incipient sediment motion across the river to debris-flow transition
 Movie DR1 Movie DR2 Movie DR3 Movie DR4 GSA DATA REPOSITORY 2014067 SUPPLEMENTARY MATERIALS FOR Incipient sediment motion across the river to debris-flow transition Jeff P. Prancevic, Michael P. Lamb,
Applications of Inertial Measurement Units in Monitoring Rehabilitation Progress of Arm in Stroke Survivors
 Applications of Inertial Measurement Units in Monitoring Rehabilitation Progress of Arm in Stroke Survivors Committee: Dr. Anura P. Jayasumana Dr. Matthew P. Malcolm Dr. Sudeep Pasricha Dr. Yashwant K.
Exam Empirical Methods VU University Amsterdam, Faculty of Exact Sciences h, February 12, 2015
 Exam Empirical Methods VU University Amsterdam, Faculty of Exact Sciences 18.30 21.15h, February 12, 2015 Question 1 is on this page. Always motivate your answers. Write your answers in English. Only the
4/22/2010. Test 3 Review ANOVA
 Test 3 Review ANOVA 1 School recruiter wants to examine if there are difference between students at different class ranks in their reported intensity of school spirit. What is the factor? How many levels
Inventory of Supplemental Information
 Neuron, Volume 71 Supplemental Information Hippocampal Time Cells Bridge the Gap in Memory for Discontiguous Events Christopher J. MacDonald, Kyle Q. Lepage, Uri T. Eden, and Howard Eichenbaum Inventory
Dynamics. Dynamics of mechanical particle and particle systems (many body systems)
") Dynamics Dynamics of mechanical particle and particle systems (many body systems) Newton`s first law: If no net force acts on a body, it will move on a straight line at constant velocity or will stay at
Dynamics Dynamics of mechanical particle and particle systems (many body systems) Newton`s first law: If no net force acts on a body, it will move on a straight line at constant velocity or will stay at
TA: Sheng Zhgang (Th 1:20) / 342 (W 1:20) / 343 (W 2:25) / 344 (W 12:05) Haoyang Fan (W 1:20) / 346 (Th 12:05) FINAL EXAM
 / 342 (W 1:20) / 343 (W 2:25) / 344 (W 12:05) Haoyang Fan (W 1:20) / 346 (Th 12:05) FINAL EXAM") STAT 301, Fall 2011 Name Lec 4: Ismor Fischer Discussion Section: Please circle one! TA: Sheng Zhgang... 341 (Th 1:20) / 342 (W 1:20) / 343 (W 2:25) / 344 (W 12:05) Haoyang Fan... 345 (W 1:20) / 346 (Th
STAT 301, Fall 2011 Name Lec 4: Ismor Fischer Discussion Section: Please circle one! TA: Sheng Zhgang... 341 (Th 1:20) / 342 (W 1:20) / 343 (W 2:25) / 344 (W 12:05) Haoyang Fan... 345 (W 1:20) / 346 (Th
PATTERN RECOGNITION AND MACHINE LEARNING
 PATTERN RECOGNITION AND MACHINE LEARNING Slide Set 3: Detection Theory January 2018 Heikki Huttunen heikki.huttunen@tut.fi Department of Signal Processing Tampere University of Technology Detection theory
Experiment: Momentum & Impulse in Collisions (Video)
") Phy201: General Physics I Laboratory 1 Experiment: Momentum & Impulse in Collisions (Video) Objectives: To utilize momentum carts to investigate the nature of different types of collisions To perform video
Phy201: General Physics I Laboratory 1 Experiment: Momentum & Impulse in Collisions (Video) Objectives: To utilize momentum carts to investigate the nature of different types of collisions To perform video
Modeling of Surface EMG Signals using System Identification Techniques
 Modeling of Surface EMG Signals using System Identification Techniques Vishnu R S PG Scholar, Dept. of Electrical and Electronics Engg. Mar Baselios College of Engineering and Technology Thiruvananthapuram,
Chapter 22 Magnetism
 Chapter 22 Magnetism 1 Overview of Chapter 22 The Magnetic Field The Magnetic Force on Moving Charges The Motion of Charged Particles in a Magnetic Field The Magnetic Force Exerted on a Current-Carrying
Unit 6 - Simple linear regression
 Sta 101: Data Analysis and Statistical Inference Dr. Çetinkaya-Rundel Unit 6 - Simple linear regression LO 1. Define the explanatory variable as the independent variable (predictor), and the response variable
A discussion on multiple regression models
 A discussion on multiple regression models In our previous discussion of simple linear regression, we focused on a model in which one independent or explanatory variable X was used to predict the value
Forced oscillation - Pohl s pendulum with measure Dynamics. Equipment TEP
 Forced oscillation - Pohl s pendulum TEP Related topics Angular velocity, characteristic frequency, resonance frequency, torsional pendulum, torsional oscillation, restoring torque, damped/undamped free
HOOKE S LAW FORCE AND STRETCH OF A SPRING
 HOOKE S LAW FORCE AND STRETCH OF A SPRING NAME DATE PERIOD Hooke's Law Lab Report 1 of 5 PURPOSE: The purpose of this experiment was to determine the relationship between the stretch of a spring and the
8.012 Physics I: Classical Mechanics Fall 2008
 MIT OpenCourseWare http://ocw.mit.edu 8.012 Physics I: Classical Mechanics Fall 2008 For information about citing these materials or our Terms of Use, visit: http://ocw.mit.edu/terms. MASSACHUSETTS INSTITUTE
Announcements. J. Parman (UC-Davis) Analysis of Economic Data, Winter 2011 February 8, / 45
 Analysis of Economic Data, Winter 2011 February 8, / 45") Announcements Solutions to Problem Set 3 are posted Problem Set 4 is posted, It will be graded and is due a week from Friday You already know everything you need to work on Problem Set 4 Professor Miller
Announcements Solutions to Problem Set 3 are posted Problem Set 4 is posted, It will be graded and is due a week from Friday You already know everything you need to work on Problem Set 4 Professor Miller
Mechanics Kit #MECHKT
 Phone: 417.347.7431 Fax: 417.374.7442 service@gosciencecrazy.com 1747 North Deffer Drive Nixa, Missouri 65714 Mechanics Kit #MECHKT Introduction Warning: Mechanics refers broadly to the study of forces
A simulation study on the effects of neuronal ensemble properties on decoding algorithms for intracortical brain machine interfaces
 https://doi.org/10.1186/s12938-018-0459-7 BioMedical Engineering OnLine RESEARCH Open Access A simulation study on the effects of neuronal ensemble properties on decoding algorithms for intracortical brain
Name: Biostatistics 1 st year Comprehensive Examination: Applied in-class exam. June 8 th, 2016: 9am to 1pm
 Name: Biostatistics 1 st year Comprehensive Examination: Applied in-class exam June 8 th, 2016: 9am to 1pm Instructions: 1. This is exam is to be completed independently. Do not discuss your work with
Passing-Bablok Regression for Method Comparison
 Chapter 313 Passing-Bablok Regression for Method Comparison Introduction Passing-Bablok regression for method comparison is a robust, nonparametric method for fitting a straight line to two-dimensional
A RAIN PIXEL RESTORATION ALGORITHM FOR VIDEOS WITH DYNAMIC SCENES
 A RAIN PIXEL RESTORATION ALGORITHM FOR VIDEOS WITH DYNAMIC SCENES V.Sridevi, P.Malarvizhi, P.Mathivannan Abstract Rain removal from a video is a challenging problem due to random spatial distribution and
Nonparametric Statistics. Leah Wright, Tyler Ross, Taylor Brown
 Nonparametric Statistics Leah Wright, Tyler Ross, Taylor Brown Before we get to nonparametric statistics, what are parametric statistics? These statistics estimate and test population means, while holding
The main force acting on the body is the gravitational force!
 The main force acting on the body is the gravitational force! (W= weight!) W = m g Stability of the body against the gravitational force is maintained by the bone structure of the skeleton! Gravitational
On The Role Of Head Motion In Affective Expression
 On The Role Of Head Motion In Affective Expression Atanu Samanta, Tanaya Guha March 9, 2017 Department of Electrical Engineering Indian Institute of Technology, Kanpur, India Introduction Applications
E X P E R I M E N T 11
 E X P E R I M E N T 11 Conservation of Angular Momentum Produced by the Physics Staff at Collin College Copyright Collin College Physics Department. All Rights Reserved. University Physics, Exp 11: Conservation
Empirical Risk Minimization, Model Selection, and Model Assessment
 Empirical Risk Minimization, Model Selection, and Model Assessment CS6780 Advanced Machine Learning Spring 2015 Thorsten Joachims Cornell University Reading: Murphy 5.7-5.7.2.4, 6.5-6.5.3.1 Dietterich,
Analysis of 2x2 Cross-Over Designs using T-Tests
 Chapter 234 Analysis of 2x2 Cross-Over Designs using T-Tests Introduction This procedure analyzes data from a two-treatment, two-period (2x2) cross-over design. The response is assumed to be a continuous
Lecture 7 Predictive Coding & Quantization
 Shujun LI (李树钧): INF-10845-20091 Multimedia Coding Lecture 7 Predictive Coding & Quantization June 3, 2009 Outline Predictive Coding Motion Estimation and Compensation Context-Based Coding Quantization
BIOMECHANICS AND MOTOR CONTROL OF HUMAN MOVEMENT
 BIOMECHANICS AND MOTOR CONTROL OF HUMAN MOVEMENT Third Edition DAVID Α. WINTER University of Waterloo Waterloo, Ontario, Canada WILEY JOHN WILEY & SONS, INC. CONTENTS Preface to the Third Edition xv 1
DETAILED CONTENTS PART I INTRODUCTION AND DESCRIPTIVE STATISTICS. 1. Introduction to Statistics
 DETAILED CONTENTS About the Author Preface to the Instructor To the Student How to Use SPSS With This Book PART I INTRODUCTION AND DESCRIPTIVE STATISTICS 1. Introduction to Statistics 1.1 Descriptive and
Vertical and Horizontal Stability of a Bouncing Ball on an Oscillating Surface. by Eric Bell
 Vertical and Horizontal Stability of a Bouncing Ball on an Oscillating Surface by Eric Bell ME 399 7 June, 1 I. Introduction. The behavior of a bouncing ball on an oscillating surface is a very basic problem
Delay Coordinate Embedding
 Chapter 7 Delay Coordinate Embedding Up to this point, we have known our state space explicitly. But what if we do not know it? How can we then study the dynamics is phase space? A typical case is when
Chap. 15: Simple Harmonic Motion
 Chap. 15: Simple Harmonic Motion Announcements: CAPA is due next Tuesday and next Friday. Web page: http://www.colorado.edu/physics/phys1110/phys1110_sp12/ Examples of periodic motion vibrating guitar
Biomechanical Modelling of Musculoskeletal Systems
 Biomechanical Modelling of Musculoskeletal Systems Lecture 6 Presented by Phillip Tran AMME4981/9981 Semester 1, 2016 The University of Sydney Slide 1 The Musculoskeletal System The University of Sydney
Simple Harmonic Motion
 [International Campus Lab] Objective Investigate simple harmonic motion using an oscillating spring and a simple pendulum. Theory ----------------------------- Reference -------------------------- Young
Game Physics. Game and Media Technology Master Program - Utrecht University. Dr. Nicolas Pronost
 Game and Media Technology Master Program - Utrecht University Dr. Nicolas Pronost Rigid body physics Particle system Most simple instance of a physics system Each object (body) is a particle Each particle
THE EFFECT OF SAMPLE SIZE, TURBULENCE INTENSITY AND THE VELOCITY FIELD ON THE EXPERIMENTAL ACCURACY OF ENSEMBLE AVERAGED PIV MEASUREMENTS
 4th International Symposium on Particle Image Velocimetry Göttingen, Germany, September 7-9, 00 PIV 0 Paper 096 THE EFFECT OF SAMPLE SIZE, TURBULECE ITESITY AD THE VELOCITY FIELD O THE EXPERIMETAL ACCURACY
This is the third of 3 parts detailing my experience of auto guiding for astrophotography.
 AstronomyShed Tutorials Autoguiding - Part 3 - Using you autoguiding setup This is the third of 3 parts detailing my experience of auto guiding for astrophotography. Prerequisites In writing this article
MODELING SINGLE LINK MOTION AND MUSCLE BEHAVIOR WITH A MODIFIED PENDULUM EQUATION
 MODELING SINGLE LINK MOTION AND MUSCLE BEHAVIOR WITH A MODIFIED PENDULUM EQUATION By ALLISON SUTHERLIN A SENIOR RESEARCH PAPER PRESENTED TO THE DEPARTMENT OF MATHEMATICS AND COMPUTER SCIENCE OF STETSON
Mechatronics II Laboratory EXPERIMENT #1 MOTOR CHARACTERISTICS FORCE/TORQUE SENSORS AND DYNAMOMETER PART 1
 Mechatronics II Laboratory EXPEIMENT #1 MOTO CHAACTEISTICS FOCE/TOQUE SENSOS AND DYNAMOMETE PAT 1 Force Sensors Force and torque are not measured directly. Typically, the deformation or strain of some
Table of Contents. Pg. # Momentum & Impulse (Bozemanscience Videos) Lab 2 Determination of Rotational Inertia 1 1/11/16
 Lab 2 Determination of Rotational Inertia 1 1/11/16") Table of Contents g. # 1 1/11/16 Momentum & Impulse (Bozemanscience Videos) 2 1/13/16 Conservation of Momentum 3 1/19/16 Elastic and Inelastic Collisions 4 1/19/16 Lab 1 Momentum 5 1/26/16 Rotational tatics
Table of Contents g. # 1 1/11/16 Momentum & Impulse (Bozemanscience Videos) 2 1/13/16 Conservation of Momentum 3 1/19/16 Elastic and Inelastic Collisions 4 1/19/16 Lab 1 Momentum 5 1/26/16 Rotational tatics
Chapter 13 Correlation
 Chapter Correlation Page. Pearson correlation coefficient -. Inferential tests on correlation coefficients -9. Correlational assumptions -. on-parametric measures of correlation -5 5. correlational example
Mixing in Colliding, Ultrasonically Levitated Drops
 Mixing in Colliding, Ultrasonically Levitated Drops Supporting information Details of acoustic levitation. Delivering drops into the acoustic levitation zone is easily ignored as a challenging first step
Experiment 9: Compound Pendulum
 COMSATS nstitute of nformation Technology, slamabad Campus PHYS - 108 Experiment 9: Compound Pendulum A compound pendulum (also known as a physical pendulum) consists of a rigid body oscillating about
Ref: GIS Math G 8 A, B, E, F
 Ref: GIS Math G 8 A, B, E, F. 2017-2018 2011-2012 SUBJECT : Math TITLE OF COURSE : Algebra 1, Geometry GRADE LEVEL : 8 DURATION : ONE YEAR NUMBER OF CREDITS : 1.25 Goals: The Number System 8.NS Know that
Objectives Simple linear regression. Statistical model for linear regression. Estimating the regression parameters
 Objectives 10.1 Simple linear regression Statistical model for linear regression Estimating the regression parameters Confidence interval for regression parameters Significance test for the slope Confidence
What is a Hypothesis?
 What is a Hypothesis? A hypothesis is a claim (assumption) about a population parameter: population mean Example: The mean monthly cell phone bill in this city is μ = $42 population proportion Example:
THE PEARSON CORRELATION COEFFICIENT
 CORRELATION Two variables are said to have a relation if knowing the value of one variable gives you information about the likely value of the second variable this is known as a bivariate relation There
Evaluating ICs. EEGLAB Workshop, June 16-18, 2012, Beijing, China: Julie Onton Evaluating ICA Components
 Evaluating ICs ICA weights in EEG structure * * EEG.icawinv = inv(eeg.icaweights * EEG.icasphere) channels channels Applying ICA weights to EEG data matrix EEG.data frames multiplication channels EEG.icaweights
Student Sheet: Self-Assessment
 Student s Name Date Class Student Sheet: Self-Assessment Directions: Use the space provided to prepare a KWL chart. In the first column, write things you already know about energy, forces, and motion.
PHY2053 General Physics I
 PHY2053 General Physics I Section 584771 Prof. Douglas H. Laurence Final Exam May 3, 2018 Name: 1 Instructions: This final exam is a take home exam. It will be posted online sometime around noon of the
Vote. Vote on timing for night section: Option 1 (what we have now) Option 2. Lecture, 6:10-7:50 25 minute dinner break Tutorial, 8:15-9
 Option 2. Lecture, 6:10-7:50 25 minute dinner break Tutorial, 8:15-9") Vote Vote on timing for night section: Option 1 (what we have now) Lecture, 6:10-7:50 25 minute dinner break Tutorial, 8:15-9 Option 2 Lecture, 6:10-7 10 minute break Lecture, 7:10-8 10 minute break Tutorial,
Vote Vote on timing for night section: Option 1 (what we have now) Lecture, 6:10-7:50 25 minute dinner break Tutorial, 8:15-9 Option 2 Lecture, 6:10-7 10 minute break Lecture, 7:10-8 10 minute break Tutorial,
A SIMPLE CLOUD SIMULATOR FOR INVESTIGATING THE CORRELATION SCALING COEFFICIENT USED IN THE WAVELET VARIABILITY MODEL (WVM)
") A SIMPLE CLOUD SIMULATOR FOR INVESTIGATING THE CORRELATION SCALING COEFFICIENT USED IN THE WAVELET VARIABILITY MODEL (WVM) Matthew Lave Jan Kleissl University of California, San Diego 9 Gilman Dr. #11
A SIMPLE CLOUD SIMULATOR FOR INVESTIGATING THE CORRELATION SCALING COEFFICIENT USED IN THE WAVELET VARIABILITY MODEL (WVM) Matthew Lave Jan Kleissl University of California, San Diego 9 Gilman Dr. #11