Dimension Reduc-on. Example: height of iden-cal twins. PCA, SVD, MDS, and clustering [ RI ] Twin 2 (inches away from avg)
|
|
|
- Albert Doyle
- 6 years ago
- Views:
Transcription
1 Dimension Reduc-on PCA, SVD, MDS, and clustering Example: height of iden-cal twins Twin (inches away from avg) Twin (inches away from avg)
2 Expression between two ethnic groups Frequency log0 (p value) p values 0 Effect size Ethnicity is confounded with year Year ASN CEU
3 Two batches within ethnic groups Frequency log0 (p value) p values 0 Effect size males and females, months, 09 genes Female Male June October 005 9
4 Finding an unknown batch i (Y i,,y i,n )(/n,,/n, /n,, /n )= n Xn j= Y i,j n nx +n j=n + Y i,j Find n and n that make this difference large for many genes More precisely, maximize: m mx i= i i= Finding an unknown batch More generally, let v be any vector with mean 0 and variance, find the v that maximizes 8 9 mx < nx = Y : i,j v j =(Y ; m n v n ) 0 (Y m n v n ) j= The v that maximizes this variance is called the first principal component direc0on or eigenvector, and Y m n v n is the first principal component
5 Principal components We can remove the variability explained by v, and find the vector v that maximizes the variability in these residuals By con0nuing this process we end up with n eigenvectors: v n n =(v v n ) Singular value decomposi-on (SVD) SVD is a powerful mathema0cal approach that permits us to compute matrices U, D and V such that and V are the eigenvectors U and V are both orthogonal matrices and D is diagonal Y m n = U m n D n n V 0 n n U orthogonal means that the columns of U are such that U 0 iu i = and U 0 iu j =0 In other words, the sample standard devia0on of each column is and the sample correla0on of any two columns is 0

 0 (Y m n V n n )=DU")
6 RMSD from SVD PMID 8588 Principal components from SVD No0ce that we can get the principal components from U and D Y m n V n n = U m n D n n and the variance from D: (Y m n V n n ) 0 (Y m n V n n )=DU 0 UD = D n n
7 Example: height of iden-cal twins Twin (inches away from avg) Twin (inches away from avg) Example: principal components Second PC First PC
8 Example: eigenvectors and SDs V = p p m D = 0 0 Gene expression example batch batch First eigenvector

9 Gene-c heterogeneity Principal Compenent Parents from cleft trios Parents from control trios Parents from HapMap CEU trios Parents from HapMap JPT/CHB trios Parents from HapMap YRI trios Principal Compenent PMID 5899 Gene-c heterogeneity PMID 8758
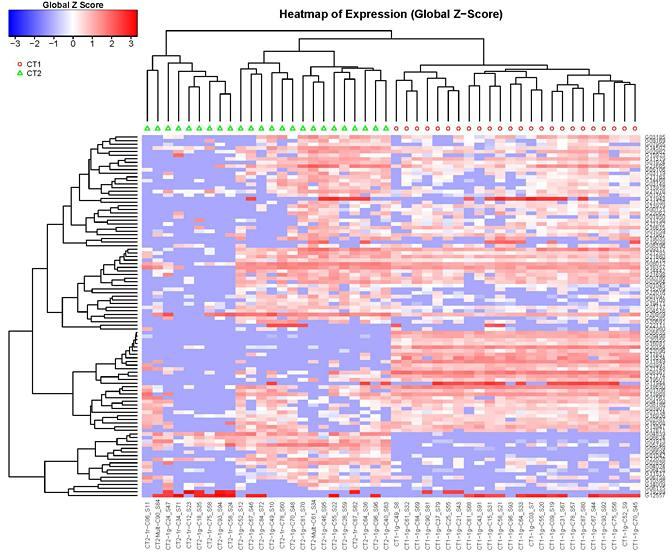
10 A heatmap commonswikimediaorg/wiki/file:heatmappng Another heatmap wwwfluidigmcom
11 Distance Clustering organizes things that are close into groups What does it mean for two genes to be close? What does it mean for two samples to be close? Once we know this, how do we define groups? Distance in two dimension
12 Gene expression Subset of a,5 x 89 gene expression table: Distances There are 7,776 pairs of samples for which we can compute a distance: d(j, k) = v u X t,5 i= (X i,j X i,k ) There are 6,7,005 pairs of genes for which we can compute a distance: d(h, i) = v ux t N (X h,j X i,j ) j=
13 The similarity / distance matrices N G G G DATA MATRIX GENE SIMILARITY MATRIX [ 0688 ] The similarity / distance matrices N N G N SAMPLE SIMILARITY MATRIX DATA MATRIX [ 0688 ]
14 Mul-dimensional scaling We can find a linear transforma0on for the data Z = AX such that v u t,5 X (X i,j X i,k ) i= q (Z,j Z,k ) +(Z,j Z,k ) Mul-dimensional scaling mds[, ] endometriu hippocamp placenta mds[, ]

15 Single cell RNAseq PMIDs 6586, 6059 Single cell RNAseq PMID 6995


16 Single cell RNAseq PMID Hierarchical Clustering Par00oning (K-means) [ 0688 ]
17 K-means We start with some data For example: We are showing expression for two samples for genes We are showing expression for two genes for samples This is simplifac0on Iteration = 0 [ 0688 ] K-means Choose K centroids These are star0ng values that the user picks There are some data driven ways to do it Iteration = 0 [ 0688 ]
18 Make first paron by finding the closest centroid for each point This is where distance is used K-means Iteration = [ 0688 ] Now re-compute the centroids by taking the middle of each cluster K-means Iteration = [ 0688 ]
19 Repeat un0l the centroids stop moving or un0l you get 0red of wai0ng K-means Iteration = [ 0688 ] Hierarchical clustering algorithm Say every point is its own cluster Merge closest points Repeat Distance Between Two Sets of Points Centroids Single Linkage
20 Linkage Single linkage defines the distance between clusters as the distance between the closest two points Single linkage can lead to a lot of singleton clusters, and to clusters that look stringlike in high dimensions Complete linkage defines the distance between clusters as the distance between the farthest two points Complete linkage tends to lead to more compact spherical structures Average linkage is the average of all the pairwise distances between points in the two clusters Average linkage is between single and complete linkage in terms of the type of clusters it outputs compbiopbworkscom A dendogram Height Cluster Dendrogram placenta placenta placenta placenta placenta placenta

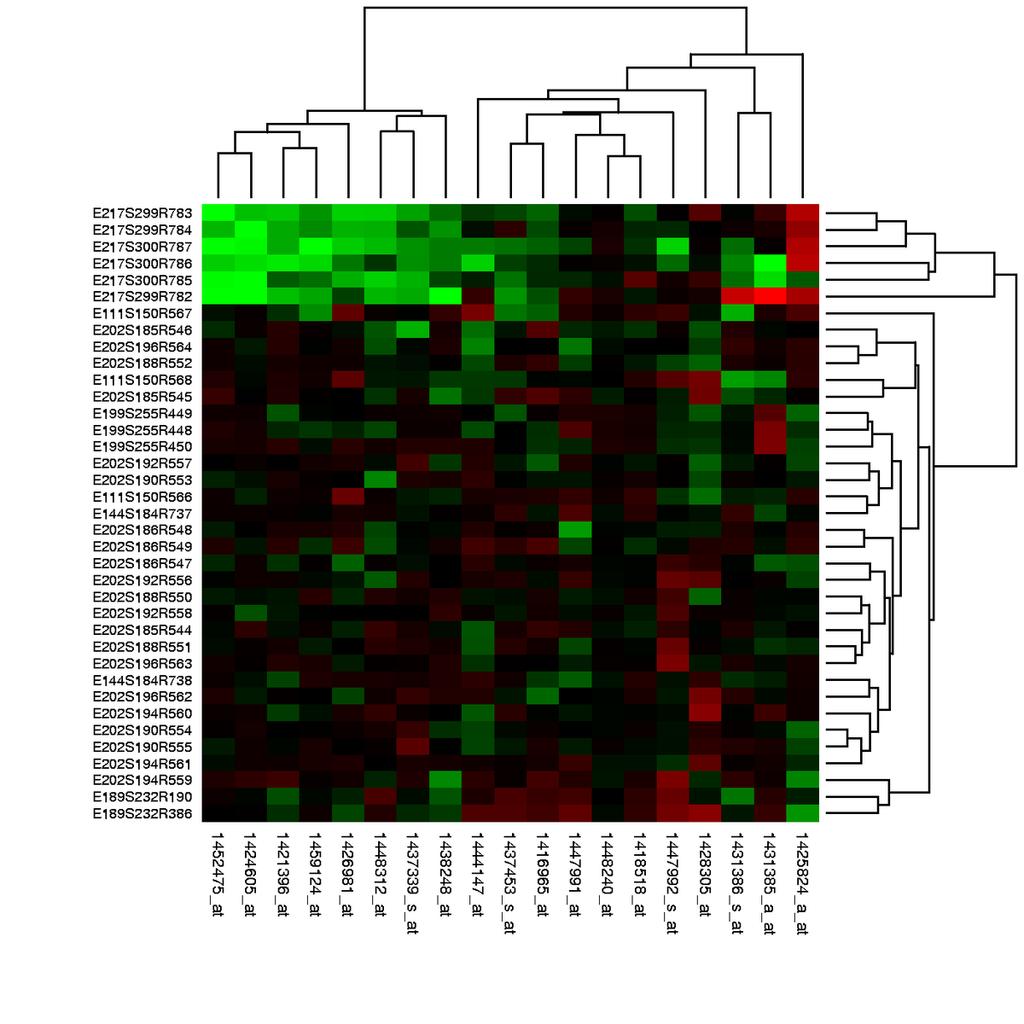
21 A heatmap PMID 97008

22 PMID PMID 97008
23 PMID PMID 97008
24 Result The distance is equivalent to the correla0on when the data are standardized M MX i= Xi X s X Y i Ȳ s Y = M MX i= Xi s X X + M MX i= Yi s Y Ȳ M MX i= Xi s X X Yi s Y Ȳ = ( r) Result The difference in the averages can drive the distance M MX (X i Y i ) = M i= MX i= (X i X) (Yi Ȳ )+( X Ȳ ) = M MX i= (X i X) (Yi Ȳ ) + ( X Ȳ ) M MX i= (X i X) (Yi Ȳ ) + M MX ( X Ȳ ) i= = ( r)+ M MX ( X Ȳ ) i= = ( r)+( X Ȳ ) MX M (assuming (X i X) =) i=

25 Four gene cluster no mean removal Four gene cluster awer mean removal
26 Simula-on only differen-ally expressed genes Height Simula-on all genes Height
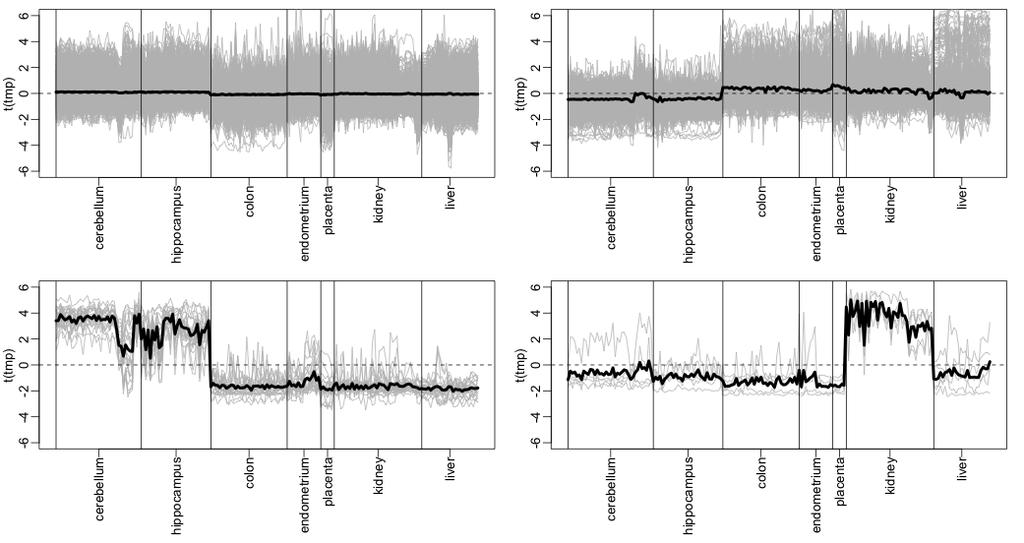
27 Batch effects Height Cluster Dendrogram placenta placenta placenta placenta placenta placenta Color represents -ssue mds[,] hippocamp mds[,]
28 Color represents study hippocamp mds[,] GSE GSE90 GSE97 GSE6 GSE mds[,] Null distribu-on of p-values only p value tt$pvalue
Clusters. Unsupervised Learning. Luc Anselin. Copyright 2017 by Luc Anselin, All Rights Reserved
 Clusters Unsupervised Learning Luc Anselin http://spatial.uchicago.edu 1 curse of dimensionality principal components multidimensional scaling classical clustering methods 2 Curse of Dimensionality 3 Curse
CSE 554 Lecture 7: Alignment
 CSE 554 Lecture 7: Alignment Fall 2012 CSE554 Alignment Slide 1 Review Fairing (smoothing) Relocating vertices to achieve a smoother appearance Method: centroid averaging Simplification Reducing vertex
Overview of clustering analysis. Yuehua Cui
 Overview of clustering analysis Yuehua Cui Email: cuiy@msu.edu http://www.stt.msu.edu/~cui A data set with clear cluster structure How would you design an algorithm for finding the three clusters in this
Dimensionality Reduction: PCA. Nicholas Ruozzi University of Texas at Dallas
 Dimensionality Reduction: PCA Nicholas Ruozzi University of Texas at Dallas Eigenvalues λ is an eigenvalue of a matrix A R n n if the linear system Ax = λx has at least one non-zero solution If Ax = λx
MLCC 2015 Dimensionality Reduction and PCA
 MLCC 2015 Dimensionality Reduction and PCA Lorenzo Rosasco UNIGE-MIT-IIT June 25, 2015 Outline PCA & Reconstruction PCA and Maximum Variance PCA and Associated Eigenproblem Beyond the First Principal Component
PCA and admixture models
 PCA and admixture models CM226: Machine Learning for Bioinformatics. Fall 2016 Sriram Sankararaman Acknowledgments: Fei Sha, Ameet Talwalkar, Alkes Price PCA and admixture models 1 / 57 Announcements HW1
CS4495/6495 Introduction to Computer Vision. 8B-L2 Principle Component Analysis (and its use in Computer Vision)
") CS4495/6495 Introduction to Computer Vision 8B-L2 Principle Component Analysis (and its use in Computer Vision) Wavelength 2 Wavelength 2 Principal Components Principal components are all about the directions
CS4495/6495 Introduction to Computer Vision 8B-L2 Principle Component Analysis (and its use in Computer Vision) Wavelength 2 Wavelength 2 Principal Components Principal components are all about the directions
Machine Learning - MT Clustering
 Machine Learning - MT 2016 15. Clustering Varun Kanade University of Oxford November 28, 2016 Announcements No new practical this week All practicals must be signed off in sessions this week Firm Deadline:
Lecture 5 Singular value decomposition
 Lecture 5 Singular value decomposition Weinan E 1,2 and Tiejun Li 2 1 Department of Mathematics, Princeton University, weinan@princeton.edu 2 School of Mathematical Sciences, Peking University, tieli@pku.edu.cn
What is Principal Component Analysis?
 What is Principal Component Analysis? Principal component analysis (PCA) Reduce the dimensionality of a data set by finding a new set of variables, smaller than the original set of variables Retains most
Principal Component Analysis
 Principal Component Analysis CS5240 Theoretical Foundations in Multimedia Leow Wee Kheng Department of Computer Science School of Computing National University of Singapore Leow Wee Kheng (NUS) Principal
14 Singular Value Decomposition
 14 Singular Value Decomposition For any high-dimensional data analysis, one s first thought should often be: can I use an SVD? The singular value decomposition is an invaluable analysis tool for dealing
Statistical Machine Learning
 Statistical Machine Learning Christoph Lampert Spring Semester 2015/2016 // Lecture 12 1 / 36 Unsupervised Learning Dimensionality Reduction 2 / 36 Dimensionality Reduction Given: data X = {x 1,..., x
THE UNIVERSITY OF CHICAGO Graduate School of Business Business 41912, Spring Quarter 2008, Mr. Ruey S. Tsay. Solutions to Final Exam
 THE UNIVERSITY OF CHICAGO Graduate School of Business Business 41912, Spring Quarter 2008, Mr. Ruey S. Tsay Solutions to Final Exam 1. (13 pts) Consider the monthly log returns, in percentages, of five
Computation. For QDA we need to calculate: Lets first consider the case that
 Computation For QDA we need to calculate: δ (x) = 1 2 log( Σ ) 1 2 (x µ ) Σ 1 (x µ ) + log(π ) Lets first consider the case that Σ = I,. This is the case where each distribution is spherical, around the
High-dimensional data: Exploratory data analysis
 High-dimensional data: Exploratory data analysis Mark van de Wiel mark.vdwiel@vumc.nl Department of Epidemiology and Biostatistics, VUmc & Department of Mathematics, VU University Contributions by Wessel
Computational functional genomics
 Computational functional genomics (Spring 2005: Lecture 8) David K. Gifford (Adapted from a lecture by Tommi S. Jaakkola) MIT CSAIL Basic clustering methods hierarchical k means mixture models Multi variate
Machine Learning - MT & 14. PCA and MDS
 Machine Learning - MT 2016 13 & 14. PCA and MDS Varun Kanade University of Oxford November 21 & 23, 2016 Announcements Sheet 4 due this Friday by noon Practical 3 this week (continue next week if necessary)
Machine Learning. CUNY Graduate Center, Spring Lectures 11-12: Unsupervised Learning 1. Professor Liang Huang.
 Machine Learning CUNY Graduate Center, Spring 2013 Lectures 11-12: Unsupervised Learning 1 (Clustering: k-means, EM, mixture models) Professor Liang Huang huang@cs.qc.cuny.edu http://acl.cs.qc.edu/~lhuang/teaching/machine-learning
Probabilistic Latent Semantic Analysis
 Probabilistic Latent Semantic Analysis Seungjin Choi Department of Computer Science and Engineering Pohang University of Science and Technology 77 Cheongam-ro, Nam-gu, Pohang 37673, Korea seungjin@postech.ac.kr
Data Exploration and Unsupervised Learning with Clustering
 Data Exploration and Unsupervised Learning with Clustering Paul F Rodriguez,PhD San Diego Supercomputer Center Predictive Analytic Center of Excellence Clustering Idea Given a set of data can we find a
Introduction to Machine Learning. PCA and Spectral Clustering. Introduction to Machine Learning, Slides: Eran Halperin
 1 Introduction to Machine Learning PCA and Spectral Clustering Introduction to Machine Learning, 2013-14 Slides: Eran Halperin Singular Value Decomposition (SVD) The singular value decomposition (SVD)
CS 340 Lec. 6: Linear Dimensionality Reduction
 CS 340 Lec. 6: Linear Dimensionality Reduction AD January 2011 AD () January 2011 1 / 46 Linear Dimensionality Reduction Introduction & Motivation Brief Review of Linear Algebra Principal Component Analysis
GI07/COMPM012: Mathematical Programming and Research Methods (Part 2) 2. Least Squares and Principal Components Analysis. Massimiliano Pontil
 2. Least Squares and Principal Components Analysis. Massimiliano Pontil") GI07/COMPM012: Mathematical Programming and Research Methods (Part 2) 2. Least Squares and Principal Components Analysis Massimiliano Pontil 1 Today s plan SVD and principal component analysis (PCA) Connection
GI07/COMPM012: Mathematical Programming and Research Methods (Part 2) 2. Least Squares and Principal Components Analysis Massimiliano Pontil 1 Today s plan SVD and principal component analysis (PCA) Connection
Machine Learning (BSMC-GA 4439) Wenke Liu
 Wenke Liu") Machine Learning (BSMC-GA 4439) Wenke Liu 02-01-2018 Biomedical data are usually high-dimensional Number of samples (n) is relatively small whereas number of features (p) can be large Sometimes p>>n Problems
Machine Learning (BSMC-GA 4439) Wenke Liu 02-01-2018 Biomedical data are usually high-dimensional Number of samples (n) is relatively small whereas number of features (p) can be large Sometimes p>>n Problems
Focus was on solving matrix inversion problems Now we look at other properties of matrices Useful when A represents a transformations.
 Previously Focus was on solving matrix inversion problems Now we look at other properties of matrices Useful when A represents a transformations y = Ax Or A simply represents data Notion of eigenvectors,
LECTURE 16: PCA AND SVD
 Instructor: Sael Lee CS549 Computational Biology LECTURE 16: PCA AND SVD Resource: PCA Slide by Iyad Batal Chapter 12 of PRML Shlens, J. (2003). A tutorial on principal component analysis. CONTENT Principal
Principal component analysis
 Principal component analysis Motivation i for PCA came from major-axis regression. Strong assumption: single homogeneous sample. Free of assumptions when used for exploration. Classical tests of significance
Principal component analysis (PCA) for clustering gene expression data
 for clustering gene expression data") Principal component analysis (PCA) for clustering gene expression data Ka Yee Yeung Walter L. Ruzzo Bioinformatics, v17 #9 (2001) pp 763-774 1 Outline of talk Background and motivation Design of our empirical
Principal component analysis (PCA) for clustering gene expression data Ka Yee Yeung Walter L. Ruzzo Bioinformatics, v17 #9 (2001) pp 763-774 1 Outline of talk Background and motivation Design of our empirical
PCA, Kernel PCA, ICA
 PCA, Kernel PCA, ICA Learning Representations. Dimensionality Reduction. Maria-Florina Balcan 04/08/2015 Big & High-Dimensional Data High-Dimensions = Lot of Features Document classification Features per
Unsupervised dimensionality reduction
 Unsupervised dimensionality reduction Guillaume Obozinski Ecole des Ponts - ParisTech SOCN course 2014 Guillaume Obozinski Unsupervised dimensionality reduction 1/30 Outline 1 PCA 2 Kernel PCA 3 Multidimensional
Lecture 13. Principal Component Analysis. Brett Bernstein. April 25, CDS at NYU. Brett Bernstein (CDS at NYU) Lecture 13 April 25, / 26
 Lecture 13 April 25, / 26") Principal Component Analysis Brett Bernstein CDS at NYU April 25, 2017 Brett Bernstein (CDS at NYU) Lecture 13 April 25, 2017 1 / 26 Initial Question Intro Question Question Let S R n n be symmetric. 1
Principal Component Analysis Brett Bernstein CDS at NYU April 25, 2017 Brett Bernstein (CDS at NYU) Lecture 13 April 25, 2017 1 / 26 Initial Question Intro Question Question Let S R n n be symmetric. 1
15 Singular Value Decomposition
 15 Singular Value Decomposition For any high-dimensional data analysis, one s first thought should often be: can I use an SVD? The singular value decomposition is an invaluable analysis tool for dealing
Quantitative Genomics and Genetics BTRY 4830/6830; PBSB
 Quantitative Genomics and Genetics BTRY 4830/6830; PBSB.5201.01 Lecture16: Population structure and logistic regression I Jason Mezey jgm45@cornell.edu April 11, 2017 (T) 8:40-9:55 Announcements I April
DATA MINING LECTURE 8. Dimensionality Reduction PCA -- SVD
 DATA MINING LECTURE 8 Dimensionality Reduction PCA -- SVD The curse of dimensionality Real data usually have thousands, or millions of dimensions E.g., web documents, where the dimensionality is the vocabulary
linearly indepedent eigenvectors as the multiplicity of the root, but in general there may be no more than one. For further discussion, assume matrice
 3. Eigenvalues and Eigenvectors, Spectral Representation 3.. Eigenvalues and Eigenvectors A vector ' is eigenvector of a matrix K, if K' is parallel to ' and ' 6, i.e., K' k' k is the eigenvalue. If is
Relations Between Adjacency And Modularity Graph Partitioning: Principal Component Analysis vs. Modularity Component Analysis
 Relations Between Adjacency And Modularity Graph Partitioning: Principal Component Analysis vs. Modularity Component Analysis Hansi Jiang Carl Meyer North Carolina State University October 27, 2015 1 /
PCA vignette Principal components analysis with snpstats
 PCA vignette Principal components analysis with snpstats David Clayton October 30, 2018 Principal components analysis has been widely used in population genetics in order to study population structure
7 Principal Component Analysis
 7 Principal Component Analysis This topic will build a series of techniques to deal with high-dimensional data. Unlike regression problems, our goal is not to predict a value (the y-coordinate), it is
Dimension Reduction and Iterative Consensus Clustering
 Dimension Reduction and Iterative Consensus Clustering Southeastern Clustering and Ranking Workshop August 24, 2009 Dimension Reduction and Iterative 1 Document Clustering Geometry of the SVD Centered
Regularized Discriminant Analysis and Reduced-Rank LDA
 Regularized Discriminant Analysis and Reduced-Rank LDA Department of Statistics The Pennsylvania State University Email: jiali@stat.psu.edu Regularized Discriminant Analysis A compromise between LDA and
EE16B Designing Information Devices and Systems II
 EE6B Designing Information Devices and Systems II Lecture 9B Geometry of SVD, PCA Uniqueness of the SVD Find SVD of A 0 A 0 AA T 0 ) ) 0 0 ~u ~u 0 ~u ~u ~u ~u Uniqueness of the SVD Find SVD of A 0 A 0
Unsupervised Learning: K- Means & PCA
 Unsupervised Learning: K- Means & PCA Unsupervised Learning Supervised learning used labeled data pairs (x, y) to learn a func>on f : X Y But, what if we don t have labels? No labels = unsupervised learning
December 20, MAA704, Multivariate analysis. Christopher Engström. Multivariate. analysis. Principal component analysis
 .. December 20, 2013 Todays lecture. (PCA) (PLS-R) (LDA) . (PCA) is a method often used to reduce the dimension of a large dataset to one of a more manageble size. The new dataset can then be used to make
Weighted gene co-expression analysis. Yuehua Cui June 7, 2013
 Weighted gene co-expression analysis Yuehua Cui June 7, 2013 Weighted gene co-expression network (WGCNA) A type of scale-free network: A scale-free network is a network whose degree distribution follows
Principal Component Analysis
 Machine Learning Michaelmas 2017 James Worrell Principal Component Analysis 1 Introduction 1.1 Goals of PCA Principal components analysis (PCA) is a dimensionality reduction technique that can be used
Clustering compiled by Alvin Wan from Professor Benjamin Recht s lecture, Samaneh s discussion
 Clustering compiled by Alvin Wan from Professor Benjamin Recht s lecture, Samaneh s discussion 1 Overview With clustering, we have several key motivations: archetypes (factor analysis) segmentation hierarchy
More Linear Algebra. Edps/Soc 584, Psych 594. Carolyn J. Anderson
 More Linear Algebra Edps/Soc 584, Psych 594 Carolyn J. Anderson Department of Educational Psychology I L L I N O I S university of illinois at urbana-champaign c Board of Trustees, University of Illinois
Lecture 5: Clustering, Linear Regression
 Lecture 5: Clustering, Linear Regression Reading: Chapter 10, Sections 3.1-3.2 STATS 202: Data mining and analysis October 4, 2017 1 / 22 .0.0 5 5 1.0 7 5 X2 X2 7 1.5 1.0 0.5 3 1 2 Hierarchical clustering
Clustering. Léon Bottou COS 424 3/4/2010. NEC Labs America
 Clustering Léon Bottou NEC Labs America COS 424 3/4/2010 Agenda Goals Representation Capacity Control Operational Considerations Computational Considerations Classification, clustering, regression, other.
Linear Algebra Methods for Data Mining
 Linear Algebra Methods for Data Mining Saara Hyvönen, Saara.Hyvonen@cs.helsinki.fi Spring 2007 The Singular Value Decomposition (SVD) continued Linear Algebra Methods for Data Mining, Spring 2007, University
Machine Learning. Principal Components Analysis. Le Song. CSE6740/CS7641/ISYE6740, Fall 2012
 Machine Learning CSE6740/CS7641/ISYE6740, Fall 2012 Principal Components Analysis Le Song Lecture 22, Nov 13, 2012 Based on slides from Eric Xing, CMU Reading: Chap 12.1, CB book 1 2 Factor or Component
Jeffrey D. Ullman Stanford University
 Jeffrey D. Ullman Stanford University 2 Often, our data can be represented by an m-by-n matrix. And this matrix can be closely approximated by the product of two matrices that share a small common dimension
Lecture 6. Numerical methods. Approximation of functions
 Lecture 6 Numerical methods Approximation of functions Lecture 6 OUTLINE 1. Approximation and interpolation 2. Least-square method basis functions design matrix residual weighted least squares normal equation
Lecture 6: Methods for high-dimensional problems
 Lecture 6: Methods for high-dimensional problems Hector Corrada Bravo and Rafael A. Irizarry March, 2010 In this Section we will discuss methods where data lies on high-dimensional spaces. In particular,
Clustering using Mixture Models
 Clustering using Mixture Models The full posterior of the Gaussian Mixture Model is p(x, Z, µ,, ) =p(x Z, µ, )p(z )p( )p(µ, ) data likelihood (Gaussian) correspondence prob. (Multinomial) mixture prior
Introduction to Machine Learning
 10-701 Introduction to Machine Learning PCA Slides based on 18-661 Fall 2018 PCA Raw data can be Complex, High-dimensional To understand a phenomenon we measure various related quantities If we knew what
Lecture Topic Projects 1 Intro, schedule, and logistics 2 Applications of visual analytics, data types 3 Data sources and preparation Project 1 out 4
 Lecture Topic Projects 1 Intro, schedule, and logistics 2 Applications of visual analytics, data types 3 Data sources and preparation Project 1 out 4 Data reduction, similarity & distance, data augmentation
Preprocessing & dimensionality reduction
 Introduction to Data Mining Preprocessing & dimensionality reduction CPSC/AMTH 445a/545a Guy Wolf guy.wolf@yale.edu Yale University Fall 2016 CPSC 445 (Guy Wolf) Dimensionality reduction Yale - Fall 2016
.. CSC 566 Advanced Data Mining Alexander Dekhtyar..
 .. CSC 566 Advanced Data Mining Alexander Dekhtyar.. Information Retrieval Latent Semantic Indexing Preliminaries Vector Space Representation of Documents: TF-IDF Documents. A single text document is a
Singular Value Decomposition and Principal Component Analysis (PCA) I
 I") Singular Value Decomposition and Principal Component Analysis (PCA) I Prof Ned Wingreen MOL 40/50 Microarray review Data per array: 0000 genes, I (green) i,i (red) i 000 000+ data points! The expression
Singular Value Decomposition and Principal Component Analysis (PCA) I Prof Ned Wingreen MOL 40/50 Microarray review Data per array: 0000 genes, I (green) i,i (red) i 000 000+ data points! The expression
Principal Component Analysis & Factor Analysis. Psych 818 DeShon
 Principal Component Analysis & Factor Analysis Psych 818 DeShon Purpose Both are used to reduce the dimensionality of correlated measurements Can be used in a purely exploratory fashion to investigate
Frank C Porter and Ilya Narsky: Statistical Analysis Techniques in Particle Physics Chap. c /9/9 page 147 le-tex
 Frank C Porter and Ilya Narsky: Statistical Analysis Techniques in Particle Physics Chap. c08 2013/9/9 page 147 le-tex 8.3 Principal Component Analysis (PCA) 147 Figure 8.1 Principal and independent components
Lecture 5: Clustering, Linear Regression
 Lecture 5: Clustering, Linear Regression Reading: Chapter 10, Sections 3.1-3.2 STATS 202: Data mining and analysis October 4, 2017 1 / 22 Hierarchical clustering Most algorithms for hierarchical clustering
Cluster Analysis (Sect. 9.6/Chap. 14 of Wilks) Notes by Hong Li
 Notes by Hong Li") 77 Cluster Analysis (Sect. 9.6/Chap. 14 of Wilks) Notes by Hong Li 1) Introduction Cluster analysis deals with separating data into groups whose identities are not known in advance. In general, even the
77 Cluster Analysis (Sect. 9.6/Chap. 14 of Wilks) Notes by Hong Li 1) Introduction Cluster analysis deals with separating data into groups whose identities are not known in advance. In general, even the
Principle Components Analysis (PCA) Relationship Between a Linear Combination of Variables and Axes Rotation for PCA
 Relationship Between a Linear Combination of Variables and Axes Rotation for PCA") Principle Components Analysis (PCA) Relationship Between a Linear Combination of Variables and Axes Rotation for PCA Principle Components Analysis: Uses one group of variables (we will call this X) In
Principle Components Analysis (PCA) Relationship Between a Linear Combination of Variables and Axes Rotation for PCA Principle Components Analysis: Uses one group of variables (we will call this X) In
Multivariate Statistics
 Multivariate Statistics Chapter 6: Cluster Analysis Pedro Galeano Departamento de Estadística Universidad Carlos III de Madrid pedro.galeano@uc3m.es Course 2017/2018 Master in Mathematical Engineering
Mathematical foundations - linear algebra
 Mathematical foundations - linear algebra Andrea Passerini passerini@disi.unitn.it Machine Learning Vector space Definition (over reals) A set X is called a vector space over IR if addition and scalar
Manning & Schuetze, FSNLP, (c)
") page 554 554 15 Topics in Information Retrieval co-occurrence Latent Semantic Indexing Term 1 Term 2 Term 3 Term 4 Query user interface Document 1 user interface HCI interaction Document 2 HCI interaction
page 554 554 15 Topics in Information Retrieval co-occurrence Latent Semantic Indexing Term 1 Term 2 Term 3 Term 4 Query user interface Document 1 user interface HCI interaction Document 2 HCI interaction
STAT420 Midterm Exam. University of Illinois Urbana-Champaign October 19 (Friday), :00 4:15p. SOLUTIONS (Yellow)
, :00 4:15p. SOLUTIONS (Yellow)") STAT40 Midterm Exam University of Illinois Urbana-Champaign October 19 (Friday), 018 3:00 4:15p SOLUTIONS (Yellow) Question 1 (15 points) (10 points) 3 (50 points) extra ( points) Total (77 points) Points
STAT40 Midterm Exam University of Illinois Urbana-Champaign October 19 (Friday), 018 3:00 4:15p SOLUTIONS (Yellow) Question 1 (15 points) (10 points) 3 (50 points) extra ( points) Total (77 points) Points
Nonrobust and Robust Objective Functions
 Nonrobust and Robust Objective Functions The objective function of the estimators in the input space is built from the sum of squared Mahalanobis distances (residuals) d 2 i = 1 σ 2(y i y io ) C + y i
Principal Component Analysis
 Principal Component Analysis Yingyu Liang yliang@cs.wisc.edu Computer Sciences Department University of Wisconsin, Madison [based on slides from Nina Balcan] slide 1 Goals for the lecture you should understand
Multivariate analysis of genetic data: exploring groups diversity
 Multivariate analysis of genetic data: exploring groups diversity T. Jombart Imperial College London Bogota 01-12-2010 1/42 Outline Introduction Clustering algorithms Hierarchical clustering K-means Multivariate
Dimension reduction, PCA & eigenanalysis Based in part on slides from textbook, slides of Susan Holmes. October 3, Statistics 202: Data Mining
 Dimension reduction, PCA & eigenanalysis Based in part on slides from textbook, slides of Susan Holmes October 3, 2012 1 / 1 Combinations of features Given a data matrix X n p with p fairly large, it can
Dimensionality Reduc1on
 Dimensionality Reduc1on contd Aarti Singh Machine Learning 10-601 Nov 10, 2011 Slides Courtesy: Tom Mitchell, Eric Xing, Lawrence Saul 1 Principal Component Analysis (PCA) Principal Components are the
Eigenvalues, Eigenvectors, and an Intro to PCA
 Eigenvalues, Eigenvectors, and an Intro to PCA Eigenvalues, Eigenvectors, and an Intro to PCA Changing Basis We ve talked so far about re-writing our data using a new set of variables, or a new basis.
Data Mining and Matrices
 Data Mining and Matrices 05 Semi-Discrete Decomposition Rainer Gemulla, Pauli Miettinen May 16, 2013 Outline 1 Hunting the Bump 2 Semi-Discrete Decomposition 3 The Algorithm 4 Applications SDD alone SVD
Eigenvalues, Eigenvectors, and an Intro to PCA
 Eigenvalues, Eigenvectors, and an Intro to PCA Eigenvalues, Eigenvectors, and an Intro to PCA Changing Basis We ve talked so far about re-writing our data using a new set of variables, or a new basis.
Functional SVD for Big Data
 Functional SVD for Big Data Pan Chao April 23, 2014 Pan Chao Functional SVD for Big Data April 23, 2014 1 / 24 Outline 1 One-Way Functional SVD a) Interpretation b) Robustness c) CV/GCV 2 Two-Way Problem
Sta$s$cs for Genomics ( )
") Sta$s$cs for Genomics (140.688) Instructor: Jeff Leek Slide Credits: Rafael Irizarry, John Storey No announcements today. Hypothesis testing Once you have a given score for each gene, how do you decide
Sta$s$cs for Genomics (140.688) Instructor: Jeff Leek Slide Credits: Rafael Irizarry, John Storey No announcements today. Hypothesis testing Once you have a given score for each gene, how do you decide
Singular Value Decomposition
 Singular Value Decomposition Motivatation The diagonalization theorem play a part in many interesting applications. Unfortunately not all matrices can be factored as A = PDP However a factorization A =
Matrix Representation
 Matrix Representation Matrix Rep. Same basics as introduced already. Convenient method of working with vectors. Superposition Complete set of vectors can be used to express any other vector. Complete set
Methods for sparse analysis of high-dimensional data, II
 Methods for sparse analysis of high-dimensional data, II Rachel Ward May 26, 2011 High dimensional data with low-dimensional structure 300 by 300 pixel images = 90, 000 dimensions 2 / 55 High dimensional
Statistics 202: Data Mining. c Jonathan Taylor. Week 2 Based in part on slides from textbook, slides of Susan Holmes. October 3, / 1
 Week 2 Based in part on slides from textbook, slides of Susan Holmes October 3, 2012 1 / 1 Part I Other datatypes, preprocessing 2 / 1 Other datatypes Document data You might start with a collection of
Part I. Other datatypes, preprocessing. Other datatypes. Other datatypes. Week 2 Based in part on slides from textbook, slides of Susan Holmes
 Week 2 Based in part on slides from textbook, slides of Susan Holmes Part I Other datatypes, preprocessing October 3, 2012 1 / 1 2 / 1 Other datatypes Other datatypes Document data You might start with
Linear Algebra Review. Vectors
 Linear Algebra Review 9/4/7 Linear Algebra Review By Tim K. Marks UCSD Borrows heavily from: Jana Kosecka http://cs.gmu.edu/~kosecka/cs682.html Virginia de Sa (UCSD) Cogsci 8F Linear Algebra review Vectors
Unsupervised Learning
 2018 EE448, Big Data Mining, Lecture 7 Unsupervised Learning Weinan Zhang Shanghai Jiao Tong University http://wnzhang.net http://wnzhang.net/teaching/ee448/index.html ML Problem Setting First build and
Vector Space Models. wine_spectral.r
 Vector Space Models 137 wine_spectral.r Latent Semantic Analysis Problem with words Even a small vocabulary as in wine example is challenging LSA Reduce number of columns of DTM by principal components
Principal Component Analysis and Linear Discriminant Analysis
 Principal Component Analysis and Linear Discriminant Analysis Ying Wu Electrical Engineering and Computer Science Northwestern University Evanston, IL 60208 http://www.eecs.northwestern.edu/~yingwu 1/29
Linear Algebra (Review) Volker Tresp 2018
 Volker Tresp 2018") Linear Algebra (Review) Volker Tresp 2018 1 Vectors k, M, N are scalars A one-dimensional array c is a column vector. Thus in two dimensions, ( ) c1 c = c 2 c i is the i-th component of c c T = (c 1, c
Linear Algebra (Review) Volker Tresp 2018 1 Vectors k, M, N are scalars A one-dimensional array c is a column vector. Thus in two dimensions, ( ) c1 c = c 2 c i is the i-th component of c c T = (c 1, c
Lecture: Face Recognition and Feature Reduction
 Lecture: Face Recognition and Feature Reduction Juan Carlos Niebles and Ranjay Krishna Stanford Vision and Learning Lab Lecture 11-1 Recap - Curse of dimensionality Assume 5000 points uniformly distributed
Distances and similarities Based in part on slides from textbook, slides of Susan Holmes. October 3, Statistics 202: Data Mining
 Distances and similarities Based in part on slides from textbook, slides of Susan Holmes October 3, 2012 1 / 1 Similarities Start with X which we assume is centered and standardized. The PCA loadings were
Signal Analysis. Principal Component Analysis
 Multi dimensional Signal Analysis Lecture 2E Principal Component Analysis Subspace representation Note! Given avector space V of dimension N a scalar product defined by G 0 a subspace U of dimension M
From Arabidopsis roots to bilinear equations
 From Arabidopsis roots to bilinear equations Dustin Cartwright 1 October 22, 2008 1 joint with Philip Benfey, Siobhan Brady, David Orlando (Duke University) and Bernd Sturmfels (UC Berkeley), research
Linear Methods in Data Mining
 Why Methods? linear methods are well understood, simple and elegant; algorithms based on linear methods are widespread: data mining, computer vision, graphics, pattern recognition; excellent general software
LECTURE NOTE #11 PROF. ALAN YUILLE
 LECTURE NOTE #11 PROF. ALAN YUILLE 1. NonLinear Dimension Reduction Spectral Methods. The basic idea is to assume that the data lies on a manifold/surface in D-dimensional space, see figure (1) Perform
Machine Learning 2nd Edition
 INTRODUCTION TO Lecture Slides for Machine Learning 2nd Edition ETHEM ALPAYDIN, modified by Leonardo Bobadilla and some parts from http://www.cs.tau.ac.il/~apartzin/machinelearning/ The MIT Press, 2010
Methods for sparse analysis of high-dimensional data, II
 Methods for sparse analysis of high-dimensional data, II Rachel Ward May 23, 2011 High dimensional data with low-dimensional structure 300 by 300 pixel images = 90, 000 dimensions 2 / 47 High dimensional
CS 4495 Computer Vision Principle Component Analysis
 CS 4495 Computer Vision Principle Component Analysis (and it s use in Computer Vision) Aaron Bobick School of Interactive Computing Administrivia PS6 is out. Due *** Sunday, Nov 24th at 11:55pm *** PS7