Principal Component Analysis & Factor Analysis. Psych 818 DeShon
|
|
|
- Ami Daniels
- 6 years ago
- Views:
Transcription
1 Principal Component Analysis & Factor Analysis Psych 818 DeShon
2 Purpose Both are used to reduce the dimensionality of correlated measurements Can be used in a purely exploratory fashion to investigate dimensionality Or, can be used in a quasi-confirmatory fashion to investigate whether the empirical dimensionality is consistent with the expected or theoretical dimensionality Conceptually, very different analyses Mathematically, there is substantial overlap
3 Principal Component Analysis Principal component analysis is conceptually and mathematically less complex So, start here... First rule... Don't interpret components as factors or latent variables. Components are simply weighted composite variables They should be interpreted and called components or composites
4 Principal Component Analysis x 1 x 2 x 3 x 4 x 5 x 6 a 21 a 22 a 23 a 24 a 25 a 11 a 12 a 13 a 14 a 15 a 16 a 26 C 1 C 2 r = 0.0?
5 Principal Component Analysis Key Questions How do you determine the weights? How many composites do you need to reasonably reproduce the observed correlations among the measured variables? Fewer is better! Can the resulting components be transformed/rotated to yield more interpretable components? How do you compute a person's score on the composite variable?
6 Conceptually... From k original variables: x 1,x 2,...,x k : Produce k new variables: C 1, C 2,..., C k : C 1 = a 11 x 1 + a 12 x a 1k x k C 2 = a 21 x 1 + a 22 x a 2k x k... C k = a k1 x 1 + a k2 x a kk x k Notice that there are as many components as there are original variables
7 Conceptually... Find the weights such that Composite variables are orthogonal/uncorrelated C 1 explains as much variance as possible maximum variance criterion C 2 explains as much of the remaining variance as possible etc...
8 Conceptually nd Principal Component, C 2 1st Principal Component, C 1 X X 1
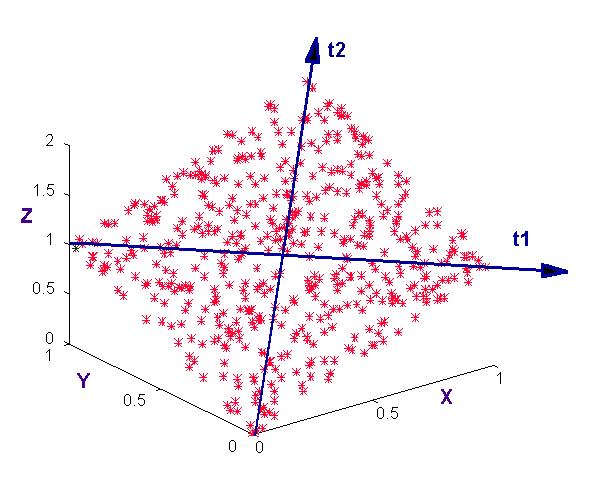
9 In 3 dimensions...
10 Conceptually... 5 λ 1 λ The variance of the resulting composite variables equal to the eigenvalues associated with the correlation or covariance matrix
11 Eigen..what? Determining the weights that maximize the variance of the components turns out to be a special case of Matrix Eigenvalues and Eigenvectors Criterion: s ij a i a j =a T S a max Problem: Can make this quantity as large as desired by simply increasing the weights to infinity So, put a constraint on the weights... Constraint : a i a j =a T a=1
12 Eigen..what? Lagrange Multipliers (λ) are frequently used when maximizing functions subject to constraints. 1 = a 1 T S a i 1 a 1 T a 1 1 The partial derivative (used to find the maximum) is: 1 a 1 2 S a a 1
13 Eigen..what? 1 = a 1 T S a i 1 a 1 T a 1 1 Set equal to zero, divide out the constant, and factor yields: S 1 I a 1 = 0 So, we need to solve for both the eigenvalue (λ) and the weights (eigenvector)


14 Eigen..what? Solving for the eigenvalues Characteristic Equation...solving for the determinant Once you have the eigenvalues, plug them back into the equation to solve for the eigenvectors
15 Example (by Hand...) X1 X S = [ ] Eigenvalues Sa = a S I a=0 [ ] =0
16 Example (by Hand...) [ 6.25 S = [ ] ] =0 ; 1 = =0.41 Eigenvectors [ ] [ a 11 a 12 ] [ ] [ a 21 a 22 ] = [ 1a 11 1 a 12 ] = [ 2 a 21 2 a 22 ] a 11 =0.81 a 12 =0.59 a = a 22 =0.81
17 Stopping Rules Problem: It requires k principal components to perfectly reproduce an observed covariance matrix among k measured variables But, this doesn't simplify the dimensionality Instead, how many principal components do you need to reproduce the observed covariance matrix reasonably well? Kaiser's Criterion If λj < 1 then component explains less variance than original variable (correlation matrix) Cattell's Scree Criterion
18 Scree Plot Scree Plot 5 Eigenvalue Number of Factors
19 Component Rotation The components have been achieved using a maximal variance criterion. Good for prediction using the fewest possible composites Bad for understanding So, once the number of desired components has been determined, rotate them to a more understandable pattern/criterion Simple Structure!
20 Simple Structure Thurstone, 1944 Each variable has at least one zero loading Each factor in a factor matrix with k columns should have k zero loadings Each pair of columns in a factor matrix should have several variables loading on one factor but not the other Each pair of columns should have a large proportion of variables with zero loadings in both columns Each pair of columns should only have a small proportion of variables with non zero loadings in both columns
21 Component Rotation Geometric Version Factor loadings are found by dropping a line from the variable coordinates to the factor at a right angle Repositioning the axes changes the loadings on the factor but keeps the relative positioning of the points the same
22 Simple Structure Rotations Orthogonal vs. Oblique Orthogonal rotation keeps factors un-correlated while increasing the meaning of the factors Oblique rotation allows the factors to correlate leading to a conceptually clearer picture but a nightmare for explanation
23 Orthogonal Rotations Varimax most popular Simple structure by maximizing variance of loadings within factors across variables Makes large loading larger and small loadings smaller Spreads the variance from first (largest) factor to other smaller factors Quartimax - Not used as often Opposite of Varimax minimizes the number of factors needed to explain each variable often generates a general factor on which most variables are loaded to a high or medium degree.
24 Orthogonal Rotations Equamax Not popular hybrid of the earlier two that tries to simultaneously simplify factors and variables compromise between Varimax and Quartimax criteria.
25 Oblique Rotations Direct Oblimin Most common oblique Begins with an unrotated solution Has a parameter (gamma in SPSS) that allows the user to define the amount of correlation acceptable gamma values near -4 -> orthogonal, 0 leads to mild correlations (also direct quartimin) and 1 highly correlated Promax more efficient Solution is rotated maximally with an orthogonal rotation Followed by oblique rotation - Easy and quick method Orthogonal loadings are raised to powers in order to drive down small loadings - Simple structure
26 Component Loadings Component loadings are the correlations between the variables (rows) and components (columns). Most would say should be higher than.3 accounts for 10% of variance in composite The squared factor loading is the percent of variance in that variable explained by the component In oblique rotation, one gets both a pattern matrix and a structure matrix
27 Component Loadings Structure matrix factor loading matrix as in orthogonal rotation Correlation of the variable with the component Contains both unique and common variance Pattern matrix coefficients represent partial correlations with components. Like regression weights The more factors, the lower the pattern coefficients because there will be more common contributions to variance explained
28 Component Loadings For oblique rotation, you should look at both the structure and pattern coefficients when attributing a label to a factor Pattern matrices often appear to give simpler structure. Many authors argue that this apparent simple structure is misleading because it ignores the correlation among the components.
29 Pattern vs. Structure matrices
30 Component Scores A person's score on a composite is simply the weighted sum of the variable scores A component score is a person s score on that composite variable -- when their variable values are applied as: PC 1 = a 11 X 1 + a 21 X a k1 X k The weights are the eigenvectors. These scores can be used as variables in further analyses (e.g., regression)
31 Covariance or Correlation Matrix? Covariance Matrix: Variables must be in same units Emphasizes variables with most variance Mean eigenvalue 1.0 Correlation Matrix: Variables are standardized (mean 0.0, SD 1.0) Variables can be in different units All variables have same impact on analysis Mean eigenvalue = 1.0
32 Example: US crime statistics Variables Murder Rape Robbery Assault Burglary Larceny Autotheft Component loadings 1 2 MURDER RAPE ROBBERY ASSAULT BURGLARY LARCENY AUTOTHFT Data: Frequency by state
33 Example: Component Loadings After Varimax Rotation: Factor Loadings Plot Factor Loadings Plot Component LARCENY AUTOTHFT BURGLARY ROBBERY RAPE ASSAULT MURDER Factor MURDER ASSAULT RAPE ROBBERY BURGLARY AUTOTHFT LARCENY Crimes against people Component Factor 1 Crimes against property
34 PC process summary Decide whether to use correlation or covariance matrix Find eigenvectors (components) and eigenvalues (variance accounted for) Decide how many components to use by examining eigenvalues (perhaps using scree diagram) Rotate subset of components to simple structure Examine loadings (perhaps vector loading plot) Plot scores
35 PCA Terminology & Relations jth principal component is jth eigenvector of correlation/covariance matrix scores are values of units on components (produced using coefficients) amount of variance accounted for by component is given by eigenvalue, λ j proportion of variance accounted for by component is given by λ j / Σ λ j loading of kth original variable on jth component is given by a jk λ j --correlation between variable and component
36 PCA Relations Sum of eigenvalues = p if the input matrix was a correlation matrix Sum of eigenvalues = sum of input variances if the input matrix was a covariance matrix Proportion of variance explained = eigenvalue / sum of eigenvalues Sum of squared factor loadings for jth principal component = eigenvalue j
37 PCA Relations Sum of squared factor loadings for variable i = variance explained in variable i = Cii (diagonal entry i in matrix C) = communality_i in common factor analysis = variance of variable i if m = p Sum of crossproducts between columns i and j of factor loading matrix = Cij (entry ij in matrix C) The relations in #4, #5 and #6 are still true after rotation.
38 Factor Analysis Model e 1 e 2 e 3 e 4 e 5 e 6 x 1 x 2 x 3 x 4 x 5 x 6 C 1 C 2 r = 0.0?
39 Factor Analysis Latent variables are thought to cause the manifest variables The relationship isn't perfect and so each measured variable is due, in part, to the latent variables and the residual variance is treated as random error x 1 = a 11 f 1 + a 12 f a 1k f k + e 1 x 2 = a 21 f 1 + a 22 f a 2k f k + e 2... x p = a p1 f 1 + a p2 f a pk f k + e 3
40 Is the Factor model identified? Look back at the factor model... 6 measured variables 6*7/2=21 free parameters How many parameters estimated in the factor analysis model? 6 error variances 12 path coefficients 1 factor correlation =19; okay...
41 Is the Factor model identified? What if you try to extract 3 factors? 6 error variances 18 loadings 3 correlations 27 parameters being estimated Uh-ohhhh... 27>21 There are many sources of mathematical indeterminacy in the factor analysis model
42 A useful dodge... The factor analysis method gets around the identification problem by estimating the loadings and the errors separately Mathematically, the main difference between FA and PCA is that FA uses a reduced correlation matrix Based on communality estimates Factor analysis finds the eigenvalues and eigenvectors of the correlation matrix with the squared multiple correlations each variable with other variables on the main diagonal
43 Estimating Communality Many ways to estimate communality and the many varieties of FA differ with respect to how communality is estimated Principle Factors aka Principle Axis Iterated Principle Factors The most common estimate of communality(h2 ) is the squared multiple correlation (SMC) In other words, regress each variable on all other variables and get the multiple R. x i2 = b o + b 1 x i1 + b 2 x i b p x ip
44 Reduce the correlation matrix
45 FA Analysis Now, just perform a PCA on the reduced correlation matrix Re-estimate communalities based on the factor solution
46 Common problems in FA The communality estimates are just that...estimates. These estimates can often result in impossible results. Communality estimates greater than 1.0 Error variance estimates less than 0.0 Collectively referred to as Heywood Cases When encountered, the model does not fit. Simplify the model or reduce the number of variables being analyzed.
47 Factor Scores Unlike PCA, a person's score on the latent variable is indeterminant Two unknowns (latent true score and error) but only one observed score for each person Can't compute the factor score as you can in PCA. Instead you have to estimate the person's factor score.
48 Differences between PCA and FA Unless you have lots of error (very low communalities) you will get virtually identical results when you perform these two analyses I always do both I've only seen a discrepancy one or two times Change FA model (number of factors extracted) or estimate communality differently or reduce the number of variables being factored
49 Some Guidelines Factors need at least three variables with high loadings or should not be interpreted Since the vars won't perform as expected you should probably start out with 6 to 10 variables per factor. If the loadings are low, you will need more variables, 10 or 20 per factor may be required. The larger the n, the larger the number of vars per factor, and the larger the loadings, the better Strength in one of these areas can compensate for weakness in another Velicer, W. F., & Fava, J. L. (1998). Effects of variable and subject sampling on factor pattern recovery. Psychological Methods, 3,
50 Some Guidelines Large N, high h2, and high overdetermination (each factor having at least three or four high loadings and simple structure) increase your chances of reproducing the population factor pattern When communalities are high (>.6), you should be in good shape even with N well below 100 With communalities moderate (about.5) and the factors well-determined, you should have 100 to 200 subjects
51 Some Guidelines With communalities low (<.5) but high overdetermination of factors (not many factors, each with 6 or 7 high loadings), you probably need well over 100 subjects. With low communalities and only 3 or 4 high loadings on each, you probably need over 300 subjects. With low communalities and poorly determined factors, you will need well over 500 subjects. MacCallum, R. C., Widaman, K. F., Zhang, S., & Hong, S. (1999). Sample size in factor analysis. Psychological Methods, 4,
52 Example...
Exploratory Factor Analysis and Principal Component Analysis
 Exploratory Factor Analysis and Principal Component Analysis Today s Topics: What are EFA and PCA for? Planning a factor analytic study Analysis steps: Extraction methods How many factors Rotation and
Exploratory Factor Analysis and Principal Component Analysis
 Exploratory Factor Analysis and Principal Component Analysis Today s Topics: What are EFA and PCA for? Planning a factor analytic study Analysis steps: Extraction methods How many factors Rotation and
2/26/2017. This is similar to canonical correlation in some ways. PSY 512: Advanced Statistics for Psychological and Behavioral Research 2
 PSY 512: Advanced Statistics for Psychological and Behavioral Research 2 What is factor analysis? What are factors? Representing factors Graphs and equations Extracting factors Methods and criteria Interpreting
Applied Multivariate Analysis
 Department of Mathematics and Statistics, University of Vaasa, Finland Spring 2017 Dimension reduction Exploratory (EFA) Background While the motivation in PCA is to replace the original (correlated) variables
Introduction to Factor Analysis
 to Factor Analysis Lecture 10 August 2, 2011 Advanced Multivariate Statistical Methods ICPSR Summer Session #2 Lecture #10-8/3/2011 Slide 1 of 55 Today s Lecture Factor Analysis Today s Lecture Exploratory
Applied Multivariate Analysis
 Department of Mathematics and Statistics, University of Vaasa, Finland Spring 2017 Dimension reduction Principal Component Analysis (PCA) The problem in exploratory multivariate data analysis usually is
Factor analysis. George Balabanis
 Factor analysis George Balabanis Key Concepts and Terms Deviation. A deviation is a value minus its mean: x - mean x Variance is a measure of how spread out a distribution is. It is computed as the average
UCLA STAT 233 Statistical Methods in Biomedical Imaging
 UCLA STAT 233 Statistical Methods in Biomedical Imaging Instructor: Ivo Dinov, Asst. Prof. In Statistics and Neurology University of California, Los Angeles, Spring 2004 http://www.stat.ucla.edu/~dinov/
Introduction to Factor Analysis
 to Factor Analysis Lecture 11 November 2, 2005 Multivariate Analysis Lecture #11-11/2/2005 Slide 1 of 58 Today s Lecture Factor Analysis. Today s Lecture Exploratory factor analysis (EFA). Confirmatory
1 A factor can be considered to be an underlying latent variable: (a) on which people differ. (b) that is explained by unknown variables
 on which people differ. (b) that is explained by unknown variables") 1 A factor can be considered to be an underlying latent variable: (a) on which people differ (b) that is explained by unknown variables (c) that cannot be defined (d) that is influenced by observed variables
1 A factor can be considered to be an underlying latent variable: (a) on which people differ (b) that is explained by unknown variables (c) that cannot be defined (d) that is influenced by observed variables
Or, in terms of basic measurement theory, we could model it as:
 1 Neuendorf Factor Analysis Assumptions: 1. Metric (interval/ratio) data 2. Linearity (in relationships among the variables--factors are linear constructions of the set of variables; the critical source
B. Weaver (18-Oct-2001) Factor analysis Chapter 7: Factor Analysis
 Factor analysis Chapter 7: Factor Analysis") B Weaver (18-Oct-2001) Factor analysis 1 Chapter 7: Factor Analysis 71 Introduction Factor analysis (FA) was developed by C Spearman It is a technique for examining the interrelationships in a set of variables
B Weaver (18-Oct-2001) Factor analysis 1 Chapter 7: Factor Analysis 71 Introduction Factor analysis (FA) was developed by C Spearman It is a technique for examining the interrelationships in a set of variables
Factor Analysis Continued. Psy 524 Ainsworth
 Factor Analysis Continued Psy 524 Ainsworth Equations Extraction Principal Axis Factoring Variables Skiers Cost Lift Depth Powder S1 32 64 65 67 S2 61 37 62 65 S3 59 40 45 43 S4 36 62 34 35 S5 62 46 43
VAR2 VAR3 VAR4 VAR5. Or, in terms of basic measurement theory, we could model it as:
 1 Neuendorf Factor Analysis Assumptions: 1. Metric (interval/ratio) data 2. Linearity (in the relationships among the variables) -Factors are linear constructions of the set of variables (see #8 under
LECTURE 4 PRINCIPAL COMPONENTS ANALYSIS / EXPLORATORY FACTOR ANALYSIS
 LECTURE 4 PRINCIPAL COMPONENTS ANALYSIS / EXPLORATORY FACTOR ANALYSIS NOTES FROM PRE- LECTURE RECORDING ON PCA PCA and EFA have similar goals. They are substantially different in important ways. The goal
Principle Components Analysis (PCA) Relationship Between a Linear Combination of Variables and Axes Rotation for PCA
 Relationship Between a Linear Combination of Variables and Axes Rotation for PCA") Principle Components Analysis (PCA) Relationship Between a Linear Combination of Variables and Axes Rotation for PCA Principle Components Analysis: Uses one group of variables (we will call this X) In
Principle Components Analysis (PCA) Relationship Between a Linear Combination of Variables and Axes Rotation for PCA Principle Components Analysis: Uses one group of variables (we will call this X) In
FACTOR ANALYSIS AND MULTIDIMENSIONAL SCALING
 FACTOR ANALYSIS AND MULTIDIMENSIONAL SCALING Vishwanath Mantha Department for Electrical and Computer Engineering Mississippi State University, Mississippi State, MS 39762 mantha@isip.msstate.edu ABSTRACT
PCA, Kernel PCA, ICA
 PCA, Kernel PCA, ICA Learning Representations. Dimensionality Reduction. Maria-Florina Balcan 04/08/2015 Big & High-Dimensional Data High-Dimensions = Lot of Features Document classification Features per
Linear Dimensionality Reduction
 Outline Hong Chang Institute of Computing Technology, Chinese Academy of Sciences Machine Learning Methods (Fall 2012) Outline Outline I 1 Introduction 2 Principal Component Analysis 3 Factor Analysis
Multivariate Fundamentals: Rotation. Exploratory Factor Analysis
 Multivariate Fundamentals: Rotation Exploratory Factor Analysis PCA Analysis A Review Precipitation Temperature Ecosystems PCA Analysis with Spatial Data Proportion of variance explained Comp.1 + Comp.2
Exploratory Factor Analysis: dimensionality and factor scores. Psychology 588: Covariance structure and factor models
 Exploratory Factor Analysis: dimensionality and factor scores Psychology 588: Covariance structure and factor models How many PCs to retain 2 Unlike confirmatory FA, the number of factors to extract is
Principal Component Analysis (PCA) Theory, Practice, and Examples
 Theory, Practice, and Examples") Principal Component Analysis (PCA) Theory, Practice, and Examples Data Reduction summarization of data with many (p) variables by a smaller set of (k) derived (synthetic, composite) variables. p k n A
Principal Component Analysis (PCA) Theory, Practice, and Examples Data Reduction summarization of data with many (p) variables by a smaller set of (k) derived (synthetic, composite) variables. p k n A
Retained-Components Factor Transformation: Factor Loadings and Factor Score Predictors in the Column Space of Retained Components
 Journal of Modern Applied Statistical Methods Volume 13 Issue 2 Article 6 11-2014 Retained-Components Factor Transformation: Factor Loadings and Factor Score Predictors in the Column Space of Retained
Unconstrained Ordination
 Unconstrained Ordination Sites Species A Species B Species C Species D Species E 1 0 (1) 5 (1) 1 (1) 10 (4) 10 (4) 2 2 (3) 8 (3) 4 (3) 12 (6) 20 (6) 3 8 (6) 20 (6) 10 (6) 1 (2) 3 (2) 4 4 (5) 11 (5) 8 (5)
Penalized varimax. Abstract
 Penalized varimax 1 Penalized varimax Nickolay T. Trendafilov and Doyo Gragn Department of Mathematics and Statistics, The Open University, Walton Hall, Milton Keynes MK7 6AA, UK Abstract A common weakness
Chapter 4: Factor Analysis
 Chapter 4: Factor Analysis In many studies, we may not be able to measure directly the variables of interest. We can merely collect data on other variables which may be related to the variables of interest.
Factor Analysis Edpsy/Soc 584 & Psych 594
 Factor Analysis Edpsy/Soc 584 & Psych 594 Carolyn J. Anderson University of Illinois, Urbana-Champaign April 29, 2009 1 / 52 Rotation Assessing Fit to Data (one common factor model) common factors Assessment
Data Preprocessing Tasks
 Data Tasks 1 2 3 Data Reduction 4 We re here. 1 Dimensionality Reduction Dimensionality reduction is a commonly used approach for generating fewer features. Typically used because too many features can
Factor Analysis. Summary. Sample StatFolio: factor analysis.sgp
 Factor Analysis Summary... 1 Data Input... 3 Statistical Model... 4 Analysis Summary... 5 Analysis Options... 7 Scree Plot... 9 Extraction Statistics... 10 Rotation Statistics... 11 D and 3D Scatterplots...
Intermediate Social Statistics
 Intermediate Social Statistics Lecture 5. Factor Analysis Tom A.B. Snijders University of Oxford January, 2008 c Tom A.B. Snijders (University of Oxford) Intermediate Social Statistics January, 2008 1
Factor Analysis. -Applied Multivariate Analysis- Lecturer: Darren Homrighausen, PhD
 Factor Analysis -Applied Multivariate Analysis- Lecturer: Darren Homrighausen, PhD 1 From PCA to factor analysis Remember: PCA tries to estimate a transformation of the data such that: 1. The maximum amount
Package paramap. R topics documented: September 20, 2017
 Package paramap September 20, 2017 Type Package Title paramap Version 1.4 Date 2017-09-20 Author Brian P. O'Connor Maintainer Brian P. O'Connor Depends R(>= 1.9.0), psych, polycor
Principal Components Analysis using R Francis Huang / November 2, 2016
 Principal Components Analysis using R Francis Huang / huangf@missouri.edu November 2, 2016 Principal components analysis (PCA) is a convenient way to reduce high dimensional data into a smaller number
Dimensionality Reduction Techniques (DRT)
") Dimensionality Reduction Techniques (DRT) Introduction: Sometimes we have lot of variables in the data for analysis which create multidimensional matrix. To simplify calculation and to get appropriate,
Dimensionality Reduction Techniques (DRT) Introduction: Sometimes we have lot of variables in the data for analysis which create multidimensional matrix. To simplify calculation and to get appropriate,
Introduction to Confirmatory Factor Analysis
 Introduction to Confirmatory Factor Analysis Multivariate Methods in Education ERSH 8350 Lecture #12 November 16, 2011 ERSH 8350: Lecture 12 Today s Class An Introduction to: Confirmatory Factor Analysis
Principal Component Analysis
 Principal Component Analysis Yingyu Liang yliang@cs.wisc.edu Computer Sciences Department University of Wisconsin, Madison [based on slides from Nina Balcan] slide 1 Goals for the lecture you should understand
CHAPTER 11 FACTOR TRANSFORMATIONS: ANALYTIC TRANSFORMATIONS. From Exploratory Factor Analysis Ledyard R Tucker and Robert C.
 CHAPTER 11 FACTOR TRANSFORMATIONS: ANALYTIC TRANSFORMATIONS From Exploratory Factor Analysis Ledyard R Tucker and Robert C. MacCallum 1997 363 CHAPTER 11 FACTOR TRANSFORMATIONS : ANALYTIC TRANSFORMATIONS
Lecture 13. Principal Component Analysis. Brett Bernstein. April 25, CDS at NYU. Brett Bernstein (CDS at NYU) Lecture 13 April 25, / 26
 Lecture 13 April 25, / 26") Principal Component Analysis Brett Bernstein CDS at NYU April 25, 2017 Brett Bernstein (CDS at NYU) Lecture 13 April 25, 2017 1 / 26 Initial Question Intro Question Question Let S R n n be symmetric. 1
Principal Component Analysis Brett Bernstein CDS at NYU April 25, 2017 Brett Bernstein (CDS at NYU) Lecture 13 April 25, 2017 1 / 26 Initial Question Intro Question Question Let S R n n be symmetric. 1
Exploratory Factor Analysis and Canonical Correlation
 Exploratory Factor Analysis and Canonical Correlation 3 Dec 2010 CPSY 501 Dr. Sean Ho Trinity Western University Please download: SAQ.sav Outline for today Factor analysis Latent variables Correlation
STAT 730 Chapter 9: Factor analysis
 STAT 730 Chapter 9: Factor analysis Timothy Hanson Department of Statistics, University of South Carolina Stat 730: Multivariate Data Analysis 1 / 15 Basic idea Factor analysis attempts to explain the
Multivariate and Multivariable Regression. Stella Babalola Johns Hopkins University
 Multivariate and Multivariable Regression Stella Babalola Johns Hopkins University Session Objectives At the end of the session, participants will be able to: Explain the difference between multivariable
Data Mining. Dimensionality reduction. Hamid Beigy. Sharif University of Technology. Fall 1395
 Data Mining Dimensionality reduction Hamid Beigy Sharif University of Technology Fall 1395 Hamid Beigy (Sharif University of Technology) Data Mining Fall 1395 1 / 42 Outline 1 Introduction 2 Feature selection
Short Answer Questions: Answer on your separate blank paper. Points are given in parentheses.
 ISQS 6348 Final exam solutions. Name: Open book and notes, but no electronic devices. Answer short answer questions on separate blank paper. Answer multiple choice on this exam sheet. Put your name on
The 3 Indeterminacies of Common Factor Analysis
 The 3 Indeterminacies of Common Factor Analysis James H. Steiger Department of Psychology and Human Development Vanderbilt University James H. Steiger (Vanderbilt University) The 3 Indeterminacies of Common
Principal component analysis
 Principal component analysis Angela Montanari 1 Introduction Principal component analysis (PCA) is one of the most popular multivariate statistical methods. It was first introduced by Pearson (1901) and
STATISTICAL LEARNING SYSTEMS
 STATISTICAL LEARNING SYSTEMS LECTURE 8: UNSUPERVISED LEARNING: FINDING STRUCTURE IN DATA Institute of Computer Science, Polish Academy of Sciences Ph. D. Program 2013/2014 Principal Component Analysis
Eigenvalues, Eigenvectors, and an Intro to PCA
 Eigenvalues, Eigenvectors, and an Intro to PCA Eigenvalues, Eigenvectors, and an Intro to PCA Changing Basis We ve talked so far about re-writing our data using a new set of variables, or a new basis.
Eigenvalues, Eigenvectors, and an Intro to PCA
 Eigenvalues, Eigenvectors, and an Intro to PCA Eigenvalues, Eigenvectors, and an Intro to PCA Changing Basis We ve talked so far about re-writing our data using a new set of variables, or a new basis.
Structure in Data. A major objective in data analysis is to identify interesting features or structure in the data.
 Structure in Data A major objective in data analysis is to identify interesting features or structure in the data. The graphical methods are very useful in discovering structure. There are basically two
Factor Analysis. Qian-Li Xue
 Factor Analysis Qian-Li Xue Biostatistics Program Harvard Catalyst The Harvard Clinical & Translational Science Center Short course, October 7, 06 Well-used latent variable models Latent variable scale
Principal Components Analysis (PCA)
") Principal Components Analysis (PCA) Principal Components Analysis (PCA) a technique for finding patterns in data of high dimension Outline:. Eigenvectors and eigenvalues. PCA: a) Getting the data b) Centering
Principal Components Analysis (PCA) Principal Components Analysis (PCA) a technique for finding patterns in data of high dimension Outline:. Eigenvectors and eigenvalues. PCA: a) Getting the data b) Centering
Psychology 405: Psychometric Theory Constructs, Components, and Factor Models
 Psychology 405: Psychometric Theory Constructs, Components, and Factor Models William Revelle Department of Psychology Northwestern University Evanston, Illinois USA April, 2012 1 / 58 Outline 1 Preliminaries
1 Principal Components Analysis
 Lecture 3 and 4 Sept. 18 and Sept.20-2006 Data Visualization STAT 442 / 890, CM 462 Lecture: Ali Ghodsi 1 Principal Components Analysis Principal components analysis (PCA) is a very popular technique for
Machine Learning 2nd Edition
 INTRODUCTION TO Lecture Slides for Machine Learning 2nd Edition ETHEM ALPAYDIN, modified by Leonardo Bobadilla and some parts from http://www.cs.tau.ac.il/~apartzin/machinelearning/ The MIT Press, 2010
PRINCIPAL COMPONENTS ANALYSIS
 121 CHAPTER 11 PRINCIPAL COMPONENTS ANALYSIS We now have the tools necessary to discuss one of the most important concepts in mathematical statistics: Principal Components Analysis (PCA). PCA involves
Factor Analysis. Statistical Background. Chapter. Herb Stenson and Leland Wilkinson
 Chapter 12 Herb Stenson and Leland Wilkinson FACTOR provides principal components analysis and common factor analysis (maximum likelihood and iterated principal axis). SYSTAT has options to rotate, sort,
e 2 e 1 (a) (b) (d) (c)
 (b) (d) (c)") 2.13 Rotated principal component analysis [Book, Sect. 2.2] Fig.: PCA applied to a dataset composed of (a) 1 cluster, (b) 2 clusters, (c) and (d) 4 clusters. In (c), an orthonormal rotation and (d) an
2.13 Rotated principal component analysis [Book, Sect. 2.2] Fig.: PCA applied to a dataset composed of (a) 1 cluster, (b) 2 clusters, (c) and (d) 4 clusters. In (c), an orthonormal rotation and (d) an
Introduction to Machine Learning
 10-701 Introduction to Machine Learning PCA Slides based on 18-661 Fall 2018 PCA Raw data can be Complex, High-dimensional To understand a phenomenon we measure various related quantities If we knew what
Principal Component Analysis (PCA) Principal Component Analysis (PCA)
 Principal Component Analysis (PCA)") Recall: Eigenvectors of the Covariance Matrix Covariance matrices are symmetric. Eigenvectors are orthogonal Eigenvectors are ordered by the magnitude of eigenvalues: λ 1 λ 2 λ p {v 1, v 2,..., v n } Recall:
Recall: Eigenvectors of the Covariance Matrix Covariance matrices are symmetric. Eigenvectors are orthogonal Eigenvectors are ordered by the magnitude of eigenvalues: λ 1 λ 2 λ p {v 1, v 2,..., v n } Recall:
CS281 Section 4: Factor Analysis and PCA
 CS81 Section 4: Factor Analysis and PCA Scott Linderman At this point we have seen a variety of machine learning models, with a particular emphasis on models for supervised learning. In particular, we
Inter Item Correlation Matrix (R )
") 7 1. I have the ability to influence my child s well-being. 2. Whether my child avoids injury is just a matter of luck. 3. Luck plays a big part in determining how healthy my child is. 4. I can do a lot
7 1. I have the ability to influence my child s well-being. 2. Whether my child avoids injury is just a matter of luck. 3. Luck plays a big part in determining how healthy my child is. 4. I can do a lot
Vector Space Models. wine_spectral.r
 Vector Space Models 137 wine_spectral.r Latent Semantic Analysis Problem with words Even a small vocabulary as in wine example is challenging LSA Reduce number of columns of DTM by principal components
Principal Components Analysis and Exploratory Factor Analysis
 Principal Components Analysis and Exploratory Factor Analysis PRE 905: Multivariate Analysis Lecture 12: May 6, 2014 PRE 905: PCA and EFA (with CFA) Today s Class Advanced matrix operations Principal Components
CHAPTER 4 THE COMMON FACTOR MODEL IN THE SAMPLE. From Exploratory Factor Analysis Ledyard R Tucker and Robert C. MacCallum
 CHAPTER 4 THE COMMON FACTOR MODEL IN THE SAMPLE From Exploratory Factor Analysis Ledyard R Tucker and Robert C. MacCallum 1997 65 CHAPTER 4 THE COMMON FACTOR MODEL IN THE SAMPLE 4.0. Introduction In Chapter
Statistical Analysis of Factors that Influence Voter Response Using Factor Analysis and Principal Component Analysis
 Statistical Analysis of Factors that Influence Voter Response Using Factor Analysis and Principal Component Analysis 1 Violet Omuchira, John Kihoro, 3 Jeremiah Kiingati Jomo Kenyatta University of Agriculture
Dimensionality Reduction: PCA. Nicholas Ruozzi University of Texas at Dallas
 Dimensionality Reduction: PCA Nicholas Ruozzi University of Texas at Dallas Eigenvalues λ is an eigenvalue of a matrix A R n n if the linear system Ax = λx has at least one non-zero solution If Ax = λx
Principal Component Analysis. Applied Multivariate Statistics Spring 2012
 Principal Component Analysis Applied Multivariate Statistics Spring 2012 Overview Intuition Four definitions Practical examples Mathematical example Case study 2 PCA: Goals Goal 1: Dimension reduction
Principles of factor analysis. Roger Watson
 Principles of factor analysis Roger Watson Factor analysis Factor analysis Factor analysis Factor analysis is a multivariate statistical method for reducing large numbers of variables to fewer underlying
Factor Analysis (1) Factor Analysis
 Factor Analysis") Factor Analysis (1) Outlines: 1. Introduction of factor analysis 2. Principle component analysis 4. Factor rotation 5. Case Shan-Yu Chou 1 Factor Analysis Combines questions or variables to create new
Factor Analysis (1) Outlines: 1. Introduction of factor analysis 2. Principle component analysis 4. Factor rotation 5. Case Shan-Yu Chou 1 Factor Analysis Combines questions or variables to create new
Multivariate Statistics (I) 2. Principal Component Analysis (PCA)
 2. Principal Component Analysis (PCA)") Multivariate Statistics (I) 2. Principal Component Analysis (PCA) 2.1 Comprehension of PCA 2.2 Concepts of PCs 2.3 Algebraic derivation of PCs 2.4 Selection and goodness-of-fit of PCs 2.5 Algebraic derivation
Multivariate Statistics (I) 2. Principal Component Analysis (PCA) 2.1 Comprehension of PCA 2.2 Concepts of PCs 2.3 Algebraic derivation of PCs 2.4 Selection and goodness-of-fit of PCs 2.5 Algebraic derivation
Eigenvalues, Eigenvectors, and an Intro to PCA
 Eigenvalues, Eigenvectors, and an Intro to PCA Eigenvalues, Eigenvectors, and an Intro to PCA Changing Basis We ve talked so far about re-writing our data using a new set of variables, or a new basis.
7. Variable extraction and dimensionality reduction
 7. Variable extraction and dimensionality reduction The goal of the variable selection in the preceding chapter was to find least useful variables so that it would be possible to reduce the dimensionality
Regularized Common Factor Analysis
 New Trends in Psychometrics 1 Regularized Common Factor Analysis Sunho Jung 1 and Yoshio Takane 1 (1) Department of Psychology, McGill University, 1205 Dr. Penfield Avenue, Montreal, QC, H3A 1B1, Canada
DYNAMIC AND COMPROMISE FACTOR ANALYSIS
 DYNAMIC AND COMPROMISE FACTOR ANALYSIS Marianna Bolla Budapest University of Technology and Economics marib@math.bme.hu Many parts are joint work with Gy. Michaletzky, Loránd Eötvös University and G. Tusnády,
Factor Analysis (10/2/13)
") STA561: Probabilistic machine learning Factor Analysis (10/2/13) Lecturer: Barbara Engelhardt Scribes: Li Zhu, Fan Li, Ni Guan Factor Analysis Factor analysis is related to the mixture models we have studied.
STA561: Probabilistic machine learning Factor Analysis (10/2/13) Lecturer: Barbara Engelhardt Scribes: Li Zhu, Fan Li, Ni Guan Factor Analysis Factor analysis is related to the mixture models we have studied.
Bootstrap Confidence Intervals for Ordinary Least Squares Factor Loadings and Correlations in Exploratory Factor Analysis
 Multivariate Behavioral Research, 45:104 134, 2010 Copyright Taylor & Francis Group, LLC ISSN: 0027-3171 print/1532-7906 online DOI: 10.1080/00273170903504836 Bootstrap Confidence Intervals for Ordinary
Principal Component Analysis
 Principal Component Analysis Giorgos Korfiatis Alfa-Informatica University of Groningen Seminar in Statistics and Methodology, 2007 What Is PCA? Dimensionality reduction technique Aim: Extract relevant
Quantitative Trendspotting. Rex Yuxing Du and Wagner A. Kamakura. Web Appendix A Inferring and Projecting the Latent Dynamic Factors
 1 Quantitative Trendspotting Rex Yuxing Du and Wagner A. Kamakura Web Appendix A Inferring and Projecting the Latent Dynamic Factors The procedure for inferring the latent state variables (i.e., [ ] ),
An Introduction to Mplus and Path Analysis
 An Introduction to Mplus and Path Analysis PSYC 943: Fundamentals of Multivariate Modeling Lecture 10: October 30, 2013 PSYC 943: Lecture 10 Today s Lecture Path analysis starting with multivariate regression
Principal Component Analysis (PCA) Our starting point consists of T observations from N variables, which will be arranged in an T N matrix R,
 Our starting point consists of T observations from N variables, which will be arranged in an T N matrix R,") Principal Component Analysis (PCA) PCA is a widely used statistical tool for dimension reduction. The objective of PCA is to find common factors, the so called principal components, in form of linear combinations
Principal Component Analysis (PCA) PCA is a widely used statistical tool for dimension reduction. The objective of PCA is to find common factors, the so called principal components, in form of linear combinations
Problems with parallel analysis in data sets with oblique simple structure
 Methods of Psychological Research Online 2001, Vol.6, No.2 Internet: http://www.mpr-online.de Institute for Science Education 2001 IPN Kiel Problems with parallel analysis in data sets with oblique simple
Factor Analysis: An Introduction. What is Factor Analysis? 100+ years of Factor Analysis FACTOR ANALYSIS AN INTRODUCTION NILAM RAM
 NILAM RAM 2018 PSYCHOLOGY R BOOTCAMP PENNSYLVANIA STATE UNIVERSITY AUGUST 16, 2018 FACTOR ANALYSIS https://psu-psychology.github.io/r-bootcamp-2018/index.html WITH ADDITIONAL MATERIALS AT https://quantdev.ssri.psu.edu/tutorials
CS 246 Review of Linear Algebra 01/17/19
 1 Linear algebra In this section we will discuss vectors and matrices. We denote the (i, j)th entry of a matrix A as A ij, and the ith entry of a vector as v i. 1.1 Vectors and vector operations A vector
TAMS39 Lecture 10 Principal Component Analysis Factor Analysis
 TAMS39 Lecture 10 Principal Component Analysis Factor Analysis Martin Singull Department of Mathematics Mathematical Statistics Linköping University, Sweden Content - Lecture Principal component analysis
The Common Factor Model. Measurement Methods Lecture 15 Chapter 9
 The Common Factor Model Measurement Methods Lecture 15 Chapter 9 Today s Class Common Factor Model Multiple factors with a single test ML Estimation Methods New fit indices because of ML Estimation method
Structural Equation Modeling and Confirmatory Factor Analysis. Types of Variables
 /4/04 Structural Equation Modeling and Confirmatory Factor Analysis Advanced Statistics for Researchers Session 3 Dr. Chris Rakes Website: http://csrakes.yolasite.com Email: Rakes@umbc.edu Twitter: @RakesChris
MLCC 2015 Dimensionality Reduction and PCA
 MLCC 2015 Dimensionality Reduction and PCA Lorenzo Rosasco UNIGE-MIT-IIT June 25, 2015 Outline PCA & Reconstruction PCA and Maximum Variance PCA and Associated Eigenproblem Beyond the First Principal Component
CHAPTER 7 INTRODUCTION TO EXPLORATORY FACTOR ANALYSIS. From Exploratory Factor Analysis Ledyard R Tucker and Robert C. MacCallum
 CHAPTER 7 INTRODUCTION TO EXPLORATORY FACTOR ANALYSIS From Exploratory Factor Analysis Ledyard R Tucker and Robert C. MacCallum 1997 144 CHAPTER 7 INTRODUCTION TO EXPLORATORY FACTOR ANALYSIS Factor analytic
SAMPLE SIZE IN EXPLORATORY FACTOR ANALYSIS WITH ORDINAL DATA
 SAMPLE SIZE IN EXPLORATORY FACTOR ANALYSIS WITH ORDINAL DATA By RONG JIN A DISSERTATION PRESENTED TO THE GRADUATE SCHOOL OF THE UNIVERSITY OF FLORIDA IN PARTIAL FULFILLMENT OF THE REQUIREMENTS FOR THE
Factor Analysis (FA) Non-negative Matrix Factorization (NMF) CSE Artificial Intelligence Grad Project Dr. Debasis Mitra
 Non-negative Matrix Factorization (NMF) CSE Artificial Intelligence Grad Project Dr. Debasis Mitra") Factor Analysis (FA) Non-negative Matrix Factorization (NMF) CSE 5290 - Artificial Intelligence Grad Project Dr. Debasis Mitra Group 6 Taher Patanwala Zubin Kadva Factor Analysis (FA) 1. Introduction Factor
Factor Analysis (FA) Non-negative Matrix Factorization (NMF) CSE 5290 - Artificial Intelligence Grad Project Dr. Debasis Mitra Group 6 Taher Patanwala Zubin Kadva Factor Analysis (FA) 1. Introduction Factor
Principal Components. Summary. Sample StatFolio: pca.sgp
 Principal Components Summary... 1 Statistical Model... 4 Analysis Summary... 5 Analysis Options... 7 Scree Plot... 8 Component Weights... 9 D and 3D Component Plots... 10 Data Table... 11 D and 3D Component
PRINCIPAL COMPONENT ANALYSIS
 PRINCIPAL COMPONENT ANALYSIS 1 INTRODUCTION One of the main problems inherent in statistics with more than two variables is the issue of visualising or interpreting data. Fortunately, quite often the problem
Implementing Horn s parallel analysis for principal component analysis and factor analysis
 The Stata Journal (2009) 9, Number 2, pp. 291 298 Implementing Horn s parallel analysis for principal component analysis and factor analysis Alexis Dinno Department of Biological Sciences California State
Feature Transformation
 Página 1 de 31 On this page Introduction to Nonnegative Matrix Factorization Principal Component Analysis (PCA) Quality of Life in U.S. Cities Factor Analysis Introduction to Feature transformation is
Multivariate Statistics
 Multivariate Statistics Chapter 4: Factor analysis Pedro Galeano Departamento de Estadística Universidad Carlos III de Madrid pedro.galeano@uc3m.es Course 2017/2018 Master in Mathematical Engineering Pedro
Multivariate Data Analysis a survey of data reduction and data association techniques: Principal Components Analysis
 Multivariate Data Analysis a survey of data reduction and data association techniques: Principal Components Analysis For example Data reduction approaches Cluster analysis Principal components analysis
GEOG 4110/5100 Advanced Remote Sensing Lecture 15
 GEOG 4110/5100 Advanced Remote Sensing Lecture 15 Principal Component Analysis Relevant reading: Richards. Chapters 6.3* http://www.ce.yildiz.edu.tr/personal/songul/file/1097/principal_components.pdf *For
Space-time data. Simple space-time analyses. PM10 in space. PM10 in time
 Space-time data Observations taken over space and over time Z(s, t): indexed by space, s, and time, t Here, consider geostatistical/time data Z(s, t) exists for all locations and all times May consider
A non-gaussian decomposition of Total Water Storage (TWS), using Independent Component Analysis (ICA)
, using Independent Component Analysis (ICA)") Titelmaster A non-gaussian decomposition of Total Water Storage (TWS, using Independent Component Analysis (ICA Ehsan Forootan and Jürgen Kusche Astronomical Physical & Mathematical Geodesy, Bonn University
Titelmaster A non-gaussian decomposition of Total Water Storage (TWS, using Independent Component Analysis (ICA Ehsan Forootan and Jürgen Kusche Astronomical Physical & Mathematical Geodesy, Bonn University
20 Unsupervised Learning and Principal Components Analysis (PCA)
") 116 Jonathan Richard Shewchuk 20 Unsupervised Learning and Principal Components Analysis (PCA) UNSUPERVISED LEARNING We have sample points, but no labels! No classes, no y-values, nothing to predict. Goal:
116 Jonathan Richard Shewchuk 20 Unsupervised Learning and Principal Components Analysis (PCA) UNSUPERVISED LEARNING We have sample points, but no labels! No classes, no y-values, nothing to predict. Goal: