Topological Data Analysis for Brain Networks
|
|
|
- Marilyn Nash
- 6 years ago
- Views:
Transcription
1 Topological Data Analysis for Brain Networks Relating Functional Brain Network Topology to Clinical Measures of Behavior Bei Wang Phillips 1,2 University of Utah Joint work with Eleanor Wong 1,2, Sourabh Palande 1,2, Brandon Zielinski 3, Jeffrey Anderson 4, P. Thomas Fletcher 1,2 1 Scientific Computing and Imaging (SCI) Institute 2 School of Computing 3 Pediatrics and Neurology 4 Radiology October 2, 2016

2 Big Picture Goal: Quantify the relationship between brain functional networks and behavioral measures. Our Contribution: Use topological features based on persistent homology. Result: Combining correlations with topological features gives better prediction of autism severity than using correlations alone.
3 Motivation About Autism Spectrum Disorders (ASD): No cure, causes unknown Diagnosis: No systematic method ADOS (Autism Diagnostic Observation Schedule) Correlate functional brain network to ADOS scores Early diagnosis Treatment tracking
 Preprocessing")
4 What is a Brain Network? Represents brain regions and pairwise associations Computation of Correlation Matrices: Resting state functional MRI (R-fMRI) Preprocessing Define regions of interest (ROIs) Estimate time series signals Compute pairwise associations - Pearson Correlation
5 Why Topology? How to use this data? Graph and graph theoretic measures (e.g. small worldness) Require binary associations (thresholding) Correlations as features High dimensionality, not enough samples Dimensionality reduction: PCA, random projections May lose structures in higher dimensions
6 Why Topology Projection - may lose structures in higher dimensions Topology captures structure In higher dimensions Across all continuous thresholds
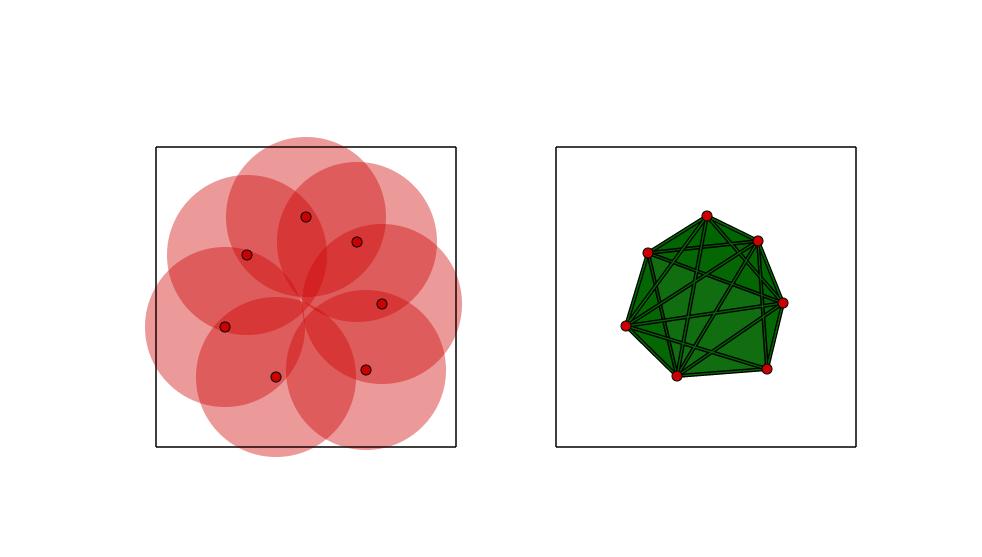
7 Persistent Homology What are topological features? Homological features: Dim 0 - Connected Components Dim 1 - Tunnels / Loops Dim 2 - Voids How to compute them (in a nutshell)? Begin with point cloud Grow balls of diameter t around each point Track features of the union of balls as t increases
8 Persistent Homology
9 Persistent Homology
10 Persistent Homology
11 Persistent Homology
12 Persistent Homology
13 Persistent Homology
14 Persistence Diagrams Persistent homological features - encoded as barcodes or persistent diagrams Figure: Barcode Figure: Persistence Diagram
15 Interpretation of Connected Components Dim 0 features - hierarchical clustering

16 Computing Topological Features for Brain Networks
17 Partial Least Squares (PLS) Regression A dimensionality reduction technique that finds two sets of latent dimensions from datasets X and Y such that their projections on the latent dimensions are maximally co-varying. X - features from brain imaging: correlations, topological features (zero mean) Y - clinical measure of behavior: ADOS scores (zero mean) PLS models the relations between X and Y by means of score vectors.
18 PLS Regression n - number of data points X - predictor/regressor (n N), Y - response (n M) PLS - decompose X, Y such that: X = TP T + E Y = UQ T + F Where T, U - latent variables/score vectors (n p), factor matrices P (N p), Q (M p) - orthogonal loading matrices E (n N), F (n M) - residuals/errors T, U are chosen such that projections of X, Y, that is, T and U, are maximally co-varying.
19 PLS Regression: the Algorithm Iterative NIPALS 1 algorithm Find first latent dimension i.e. find vectors w, c such that t = Xw, u = Yc have maximal covariance Deflate previous latent dimensions from X, Y and repeat 1 Nonlinear iterative partial least squares; [Wold 1975].
20 Kernel PLS Kernel form of NIPALS algorithm (kpls) 1. Initialize random vector u 2. Repeat until convergence (a) t = Ku/ Ku (b) c = Y T t (c) u = Yc/ Yc 3. Deflate K = (I tt T )K(I tt t ) 4. Repeat to compute subsequent latent dimensions
21 Data 87 Subjects: 30 Control, 57 ASD ADOS scores: 0 to ROIs (Power regions) correlation matrix. 34,716 distinct pairwise correlations per subject.
22 Experiments Given: Correlation matrices Map to metric space d(x, y) = 1 Cor(x, y) Compute persistence diagrams Define inner product of persistence diagrams 2 (i.e. kernel): Given two persistence diagrams F, G k σ (F, G) = 1 8πσ p F q G e p q 2 8σ where for every q = (x, y) G, q = (y, x) e p q 2 8σ 2 [Reininghaus Huber Bauer Kwitt 2015].
23 Experiments Performed experiments with 3 kernels: 1. K Cor - Euclidean dot product of vectorized correlations 2. K TDA = w 0 K TDA0 + (1 w 0 )K TDA1 K TDA 0 K TDA 1 - using only Dim 0 features - using only Dim 1 features 3. K TDA+Cor = w 0 K TDA0 + w 1 K TDA1 + (1 w 0 w 1 )K Cor Baseline predictor - mean ADOS score
24 Experiments Leave one out cross validation over parameters σ 0, σ 1 - (log 10 σ) from -8.0 to 6.0 by 0.2 w 0, w 1 - from 0.0 to 1.0 by 0.05 k TDA parameters: σ 0 = 6.6, σ 1 = 1.8, w 1 = 0.95 k TDA+Cor parameters: σ 0 = 7.8, σ 1 = 2.8, w 0 = 0.1, w 1 = 0.4 Compute RMSE Permutation test for significance
25 Results Result Highlights: Baseline RMSE: K TDA+Cor : Only method statistically significant over baseline Permutation test p-value: RMSE:
26 Conclusion Augmenting correlations with topological features gives a better prediction of autism severity than using correlations alone Topological features derived from R-fMRI have the potential to explain the connection between functional brain networks and autism severity
27 Future Work Many things to try Alternatives to correlation Different distance metric Different kernel Multi-site data
28 Publication Kernel Partial Least Squares Regression for Relating Functional Brian Network Topology to Clinical Measures of Behavior Authors: Eleanor Wong, Sourabh Palande, Bei Wang, Brandon Zielinski, Jeffrey Anderson and P. Thomas Fletcher IEEE International Symposium on Biomedical Imaging (ISBI), 2016
29 Acknowledgements This work was partially supported by NSF grant IIS and IIS Attending ACM-BCB is partially supported by NIH-1R01EB
30 Thank you! Bei Wang Phillips
Kernel Partial Least Squares for Nonlinear Regression and Discrimination
 Kernel Partial Least Squares for Nonlinear Regression and Discrimination Roman Rosipal Abstract This paper summarizes recent results on applying the method of partial least squares (PLS) in a reproducing
Learning from persistence diagrams
 Learning from persistence diagrams Ulrich Bauer TUM July 7, 2015 ACAT final meeting IST Austria Joint work with: Jan Reininghaus, Stefan Huber, Roland Kwitt 1 / 28 ? 2 / 28 ? 2 / 28 3 / 28 3 / 28 3 / 28
Multivariate Statistical Analysis of Deformation Momenta Relating Anatomical Shape to Neuropsychological Measures
 Multivariate Statistical Analysis of Deformation Momenta Relating Anatomical Shape to Neuropsychological Measures Nikhil Singh, Tom Fletcher, Sam Preston, Linh Ha, J. Stephen Marron, Michael Wiener, and
Dynamic-Inner Partial Least Squares for Dynamic Data Modeling
 Preprints of the 9th International Symposium on Advanced Control of Chemical Processes The International Federation of Automatic Control MoM.5 Dynamic-Inner Partial Least Squares for Dynamic Data Modeling
Analysis of Longitudinal Shape Variability via Subject Specific Growth Modeling
 Analysis of Longitudinal Shape Variability via Subject Specific Growth Modeling James Fishbaugh 1, Marcel Prastawa 1, Stanley Durrleman 2, Joseph Piven 3 for the IBIS Network, and Guido Gerig 1 1 Scientific
Regression. Goal: Learn a mapping from observations (features) to continuous labels given a training set (supervised learning)
 to continuous labels given a training set (supervised learning)") Linear Regression Regression Goal: Learn a mapping from observations (features) to continuous labels given a training set (supervised learning) Example: Height, Gender, Weight Shoe Size Audio features
Linear Regression Regression Goal: Learn a mapping from observations (features) to continuous labels given a training set (supervised learning) Example: Height, Gender, Weight Shoe Size Audio features
Introduction to Machine Learning
 10-701 Introduction to Machine Learning PCA Slides based on 18-661 Fall 2018 PCA Raw data can be Complex, High-dimensional To understand a phenomenon we measure various related quantities If we knew what
Regression. Goal: Learn a mapping from observations (features) to continuous labels given a training set (supervised learning)
 to continuous labels given a training set (supervised learning)") Linear Regression Regression Goal: Learn a mapping from observations (features) to continuous labels given a training set (supervised learning) Example: Height, Gender, Weight Shoe Size Audio features
Linear Regression Regression Goal: Learn a mapping from observations (features) to continuous labels given a training set (supervised learning) Example: Height, Gender, Weight Shoe Size Audio features
Clustering and Model Integration under the Wasserstein Metric. Jia Li Department of Statistics Penn State University
 Clustering and Model Integration under the Wasserstein Metric Jia Li Department of Statistics Penn State University Clustering Data represented by vectors or pairwise distances. Methods Top- down approaches
Nonparametric regression for topology. applied to brain imaging data
 , applied to brain imaging data Cleveland State University October 15, 2010 Motivation from Brain Imaging MRI Data Topology Statistics Application MRI Data Topology Statistics Application Cortical surface
Statistical Methods for Integration of Multiple Omics Data
 Statistical Methods for Integration of Multiple Omics Data Hae-Won Uh BMTL, October 2014, Naples October 23, 2014 Hae-Won Uh, BMTL, October 2014, Naples Statistical Methods for Integration of Multiple
A MULTIVARIATE MODEL FOR COMPARISON OF TWO DATASETS AND ITS APPLICATION TO FMRI ANALYSIS
 A MULTIVARIATE MODEL FOR COMPARISON OF TWO DATASETS AND ITS APPLICATION TO FMRI ANALYSIS Yi-Ou Li and Tülay Adalı University of Maryland Baltimore County Baltimore, MD Vince D. Calhoun The MIND Institute
December 20, MAA704, Multivariate analysis. Christopher Engström. Multivariate. analysis. Principal component analysis
 .. December 20, 2013 Todays lecture. (PCA) (PLS-R) (LDA) . (PCA) is a method often used to reduce the dimension of a large dataset to one of a more manageble size. The new dataset can then be used to make
Canonical Correlation Analysis with Kernels
 Canonical Correlation Analysis with Kernels Florian Markowetz Max-Planck-Institute for Molecular Genetics Computational Molecular Biology Berlin Computational Diagnostics Group Seminar 2003 Mar 10 1 Overview
Dimensionality Reduction
 Lecture 5 1 Outline 1. Overview a) What is? b) Why? 2. Principal Component Analysis (PCA) a) Objectives b) Explaining variability c) SVD 3. Related approaches a) ICA b) Autoencoders 2 Example 1: Sportsball
A Kernel on Persistence Diagrams for Machine Learning
 A Kernel on Persistence Diagrams for Machine Learning Jan Reininghaus 1 Stefan Huber 1 Roland Kwitt 2 Ulrich Bauer 1 1 Institute of Science and Technology Austria 2 FB Computer Science Universität Salzburg,
Distances and similarities Based in part on slides from textbook, slides of Susan Holmes. October 3, Statistics 202: Data Mining
 Distances and similarities Based in part on slides from textbook, slides of Susan Holmes October 3, 2012 1 / 1 Similarities Start with X which we assume is centered and standardized. The PCA loadings were
Principal Component Analysis (PCA) Principal Component Analysis (PCA)
 Principal Component Analysis (PCA)") Recall: Eigenvectors of the Covariance Matrix Covariance matrices are symmetric. Eigenvectors are orthogonal Eigenvectors are ordered by the magnitude of eigenvalues: λ 1 λ 2 λ p {v 1, v 2,..., v n } Recall:
Recall: Eigenvectors of the Covariance Matrix Covariance matrices are symmetric. Eigenvectors are orthogonal Eigenvectors are ordered by the magnitude of eigenvalues: λ 1 λ 2 λ p {v 1, v 2,..., v n } Recall:
Distributions of Persistence Diagrams and Approximations
 Distributions of Persistence Diagrams and Approximations Vasileios Maroulas Department of Mathematics Department of Business Analytics and Statistics University of Tennessee August 31, 2018 Thanks V. Maroulas
Spatiotemporal Anatomical Atlas Building
 Spatiotemporal Anatomical Atlas Building Population Shape Regression For Random Design Data Brad Davis 1, P. Thomas Fletcher 2, Elizabeth Bullitt 1, Sarang Joshi 2 1 The University of North Carolina at
Neuroscience Introduction
 Neuroscience Introduction The brain As humans, we can identify galaxies light years away, we can study particles smaller than an atom. But we still haven t unlocked the mystery of the three pounds of matter
Discriminative Direction for Kernel Classifiers
 Discriminative Direction for Kernel Classifiers Polina Golland Artificial Intelligence Lab Massachusetts Institute of Technology Cambridge, MA 02139 polina@ai.mit.edu Abstract In many scientific and engineering
Linear Regression (9/11/13)
") STA561: Probabilistic machine learning Linear Regression (9/11/13) Lecturer: Barbara Engelhardt Scribes: Zachary Abzug, Mike Gloudemans, Zhuosheng Gu, Zhao Song 1 Why use linear regression? Figure 1: Scatter
STA561: Probabilistic machine learning Linear Regression (9/11/13) Lecturer: Barbara Engelhardt Scribes: Zachary Abzug, Mike Gloudemans, Zhuosheng Gu, Zhao Song 1 Why use linear regression? Figure 1: Scatter
I L L I N O I S UNIVERSITY OF ILLINOIS AT URBANA-CHAMPAIGN
 Introduction Edps/Psych/Stat/ 584 Applied Multivariate Statistics Carolyn J Anderson Department of Educational Psychology I L L I N O I S UNIVERSITY OF ILLINOIS AT URBANA-CHAMPAIGN c Board of Trustees,
Statistics 202: Data Mining. c Jonathan Taylor. Week 2 Based in part on slides from textbook, slides of Susan Holmes. October 3, / 1
 Week 2 Based in part on slides from textbook, slides of Susan Holmes October 3, 2012 1 / 1 Part I Other datatypes, preprocessing 2 / 1 Other datatypes Document data You might start with a collection of
Part I. Other datatypes, preprocessing. Other datatypes. Other datatypes. Week 2 Based in part on slides from textbook, slides of Susan Holmes
 Week 2 Based in part on slides from textbook, slides of Susan Holmes Part I Other datatypes, preprocessing October 3, 2012 1 / 1 2 / 1 Other datatypes Other datatypes Document data You might start with
EXTENDING PARTIAL LEAST SQUARES REGRESSION
 EXTENDING PARTIAL LEAST SQUARES REGRESSION ATHANASSIOS KONDYLIS UNIVERSITY OF NEUCHÂTEL 1 Outline Multivariate Calibration in Chemometrics PLS regression (PLSR) and the PLS1 algorithm PLS1 from a statistical
Gromov-Hausdorff stable signatures for shapes using persistence
 Gromov-Hausdorff stable signatures for shapes using persistence joint with F. Chazal, D. Cohen-Steiner, L. Guibas and S. Oudot Facundo Mémoli memoli@math.stanford.edu l 1 Goal Shape discrimination is a
Nonlinear Dimensionality Reduction
 Nonlinear Dimensionality Reduction Piyush Rai CS5350/6350: Machine Learning October 25, 2011 Recap: Linear Dimensionality Reduction Linear Dimensionality Reduction: Based on a linear projection of the
Joint Emotion Analysis via Multi-task Gaussian Processes
 Joint Emotion Analysis via Multi-task Gaussian Processes Daniel Beck, Trevor Cohn, Lucia Specia October 28, 2014 1 Introduction 2 Multi-task Gaussian Process Regression 3 Experiments and Discussion 4 Conclusions
ROBUST PARTIAL LEAST SQUARES REGRESSION AND OUTLIER DETECTION USING REPEATED MINIMUM COVARIANCE DETERMINANT METHOD AND A RESAMPLING METHOD
 ROBUST PARTIAL LEAST SQUARES REGRESSION AND OUTLIER DETECTION USING REPEATED MINIMUM COVARIANCE DETERMINANT METHOD AND A RESAMPLING METHOD by Dilrukshika Manori Singhabahu BS, Information Technology, Slippery
FERMENTATION BATCH PROCESS MONITORING BY STEP-BY-STEP ADAPTIVE MPCA. Ning He, Lei Xie, Shu-qing Wang, Jian-ming Zhang
 FERMENTATION BATCH PROCESS MONITORING BY STEP-BY-STEP ADAPTIVE MPCA Ning He Lei Xie Shu-qing Wang ian-ming Zhang National ey Laboratory of Industrial Control Technology Zhejiang University Hangzhou 3007
Testing for group differences in brain functional connectivity
 Testing for group differences in brain functional connectivity Junghi Kim, Wei Pan, for ADNI Division of Biostatistics, School of Public Health, University of Minnesota, Minneapolis, MN 55455 Banff Feb
Unsupervised Machine Learning and Data Mining. DS 5230 / DS Fall Lecture 7. Jan-Willem van de Meent
 Unsupervised Machine Learning and Data Mining DS 5230 / DS 4420 - Fall 2018 Lecture 7 Jan-Willem van de Meent DIMENSIONALITY REDUCTION Borrowing from: Percy Liang (Stanford) Dimensionality Reduction Goal:
A Selective Review of Sufficient Dimension Reduction
 A Selective Review of Sufficient Dimension Reduction Lexin Li Department of Statistics North Carolina State University Lexin Li (NCSU) Sufficient Dimension Reduction 1 / 19 Outline 1 General Framework
Statistical Machine Learning
 Statistical Machine Learning Christoph Lampert Spring Semester 2015/2016 // Lecture 12 1 / 36 Unsupervised Learning Dimensionality Reduction 2 / 36 Dimensionality Reduction Given: data X = {x 1,..., x
On Inverse Problems in TDA
 Abel Symposium Geiranger, June 2018 On Inverse Problems in TDA Steve Oudot joint work with E. Solomon (Brown Math.) arxiv: 1712.03630 Features Data Rn The preimage problem in the data Sciences feature
Stabilizing the unstable output of persistent homology computations
 Stabilizing the unstable output of persistent homology computations Peter Bubenik with Paul Bendich (Duke) and Alex Wagner (Florida) May 5, 2017 Conference on Applied and Computational Algebraic Topology
DISCRIMINATION AND CLASSIFICATION IN NIR SPECTROSCOPY. 1 Dept. Chemistry, University of Rome La Sapienza, Rome, Italy
 DISCRIMINATION AND CLASSIFICATION IN NIR SPECTROSCOPY Federico Marini Dept. Chemistry, University of Rome La Sapienza, Rome, Italy Classification To find a criterion to assign an object (sample) to one
STATISTICAL LEARNING SYSTEMS
 STATISTICAL LEARNING SYSTEMS LECTURE 8: UNSUPERVISED LEARNING: FINDING STRUCTURE IN DATA Institute of Computer Science, Polish Academy of Sciences Ph. D. Program 2013/2014 Principal Component Analysis
PCA, Kernel PCA, ICA
 PCA, Kernel PCA, ICA Learning Representations. Dimensionality Reduction. Maria-Florina Balcan 04/08/2015 Big & High-Dimensional Data High-Dimensions = Lot of Features Document classification Features per
Uncertainty quantification and visualization for functional random variables
 Uncertainty quantification and visualization for functional random variables MascotNum Workshop 2014 S. Nanty 1,3 C. Helbert 2 A. Marrel 1 N. Pérot 1 C. Prieur 3 1 CEA, DEN/DER/SESI/LSMR, F-13108, Saint-Paul-lez-Durance,
Apprentissage non supervisée
 Apprentissage non supervisée Cours 3 Higher dimensions Jairo Cugliari Master ECD 2015-2016 From low to high dimension Density estimation Histograms and KDE Calibration can be done automacally But! Let
Overview. Motivation for the inner product. Question. Definition
 Overview Last time we studied the evolution of a discrete linear dynamical system, and today we begin the final topic of the course (loosely speaking) Today we ll recall the definition and properties of
Gaussian Process Regression with K-means Clustering for Very Short-Term Load Forecasting of Individual Buildings at Stanford
 Gaussian Process Regression with K-means Clustering for Very Short-Term Load Forecasting of Individual Buildings at Stanford Carol Hsin Abstract The objective of this project is to return expected electricity
Towards a Regression using Tensors
 February 27, 2014 Outline Background 1 Background Linear Regression Tensorial Data Analysis 2 Definition Tensor Operation Tensor Decomposition 3 Model Attention Deficit Hyperactivity Disorder Data Analysis
Machine Learning. CUNY Graduate Center, Spring Lectures 11-12: Unsupervised Learning 1. Professor Liang Huang.
 Machine Learning CUNY Graduate Center, Spring 2013 Lectures 11-12: Unsupervised Learning 1 (Clustering: k-means, EM, mixture models) Professor Liang Huang huang@cs.qc.cuny.edu http://acl.cs.qc.edu/~lhuang/teaching/machine-learning
Geometric Inference on Kernel Density Estimates
 Geometric Inference on Kernel Density Estimates Bei Wang 1 Jeff M. Phillips 2 Yan Zheng 2 1 Scientific Computing and Imaging Institute, University of Utah 2 School of Computing, University of Utah Feb
Longitudinal growth analysis of early childhood brain using deformation based morphometry
 Longitudinal growth analysis of early childhood brain using deformation based morphometry Junki Lee 1, Yasser Ad-Dab'bagh 2, Vladimir Fonov 1, Alan C. Evans 1 and the Brain Development Cooperative Group
Contributions to partial least squares regression and supervised principal component analysis modeling
 University of New Mexico UNM Digital Repository Mathematics & Statistics ETDs Electronic Theses and Dissertations 2-9-2010 Contributions to partial least squares regression and supervised principal component
Effects of Postprocessing on Topology of FMRI Connectivity in Spatial and Temporal Domains
 Effects of Postprocessing on Topology of FMRI Connectivity in Spatial and Temporal Domains Keri Anderson University of Utah UUCS-18-002 School of Computing University of Utah Salt Lake City, UT 84112 USA
Population-shrinkage of covariance to estimate better brain functional connectivity
 Population-shrinkage of covariance to estimate better brain functional connectivity Mehdi Rahim, Bertrand Thirion, Gaël Varoquaux To cite this version: Mehdi Rahim, Bertrand Thirion, Gaël Varoquaux. Population-shrinkage
Package sgpca. R topics documented: July 6, Type Package. Title Sparse Generalized Principal Component Analysis. Version 1.0.
 Package sgpca July 6, 2013 Type Package Title Sparse Generalized Principal Component Analysis Version 1.0 Date 2012-07-05 Author Frederick Campbell Maintainer Frederick Campbell
DIMENSION REDUCTION AND CLUSTER ANALYSIS
 DIMENSION REDUCTION AND CLUSTER ANALYSIS EECS 833, 6 March 2006 Geoff Bohling Assistant Scientist Kansas Geological Survey geoff@kgs.ku.edu 864-2093 Overheads and resources available at http://people.ku.edu/~gbohling/eecs833
Principal Components Analysis (PCA)
") Principal Components Analysis (PCA) Principal Components Analysis (PCA) a technique for finding patterns in data of high dimension Outline:. Eigenvectors and eigenvalues. PCA: a) Getting the data b) Centering
Principal Components Analysis (PCA) Principal Components Analysis (PCA) a technique for finding patterns in data of high dimension Outline:. Eigenvectors and eigenvalues. PCA: a) Getting the data b) Centering
Kernel Methods. Barnabás Póczos
 Kernel Methods Barnabás Póczos Outline Quick Introduction Feature space Perceptron in the feature space Kernels Mercer s theorem Finite domain Arbitrary domain Kernel families Constructing new kernels
Part I. Linear Discriminant Analysis. Discriminant analysis. Discriminant analysis
 Week 5 Based in part on slides from textbook, slides of Susan Holmes Part I Linear Discriminant Analysis October 29, 2012 1 / 1 2 / 1 Nearest centroid rule Suppose we break down our data matrix as by the
ANALYSIS OF NONLINEAR PARTIAL LEAST SQUARES ALGORITHMS
 ANALYSIS OF NONLINEAR PARIAL LEAS SQUARES ALGORIHMS S. Kumar U. Kruger,1 E. B. Martin, and A. J. Morris Centre of Process Analytics and Process echnology, University of Newcastle, NE1 7RU, U.K. Intelligent
Vector spaces. DS-GA 1013 / MATH-GA 2824 Optimization-based Data Analysis.
 Vector spaces DS-GA 1013 / MATH-GA 2824 Optimization-based Data Analysis http://www.cims.nyu.edu/~cfgranda/pages/obda_fall17/index.html Carlos Fernandez-Granda Vector space Consists of: A set V A scalar
Linear Models for Regression. Sargur Srihari
 Linear Models for Regression Sargur srihari@cedar.buffalo.edu 1 Topics in Linear Regression What is regression? Polynomial Curve Fitting with Scalar input Linear Basis Function Models Maximum Likelihood
Inverse Power Method for Non-linear Eigenproblems
 Inverse Power Method for Non-linear Eigenproblems Matthias Hein and Thomas Bühler Anubhav Dwivedi Department of Aerospace Engineering & Mechanics 7th March, 2017 1 / 30 OUTLINE Motivation Non-Linear Eigenproblems
Role and treatment of categorical variables in PLS Path Models for Composite Indicators
 Role and treatment of categorical variables in PLS Path Models for Composite Indicators Laura Trinchera 1,2 & Giorgio Russolillo 2! 1 Dipartimento di Studi sullo Sviluppo Economico, Università degli Studi
Probabilistic Graphical Models
 Probabilistic Graphical Models Brown University CSCI 295-P, Spring 213 Prof. Erik Sudderth Lecture 11: Inference & Learning Overview, Gaussian Graphical Models Some figures courtesy Michael Jordan s draft
A Hypothesis Testing Framework for High-Dimensional Shape Models
 A Hypothesis Testing Framework for High-Dimensional Shape Models Joshua Cates, P. Thomas Fletcher, Ross Whitaker Scientific Computing and Imaging Institute University of Utah Salt Lake City, Utah Abstract.
Nearest Correlation Louvain Method for Fast and Good Selection of Input Variables of Statistical Model
 Preprints of the 9th International Symposium on Advanced Control of Chemical Processes The International Federation of Automatic Control MoM3.6 Nearest Correlation Louvain Method for Fast and Good Selection
Linear Regression (continued)
") Linear Regression (continued) Professor Ameet Talwalkar Professor Ameet Talwalkar CS260 Machine Learning Algorithms February 6, 2017 1 / 39 Outline 1 Administration 2 Review of last lecture 3 Linear regression
Linear Regression (continued) Professor Ameet Talwalkar Professor Ameet Talwalkar CS260 Machine Learning Algorithms February 6, 2017 1 / 39 Outline 1 Administration 2 Review of last lecture 3 Linear regression
Drift Reduction For Metal-Oxide Sensor Arrays Using Canonical Correlation Regression And Partial Least Squares
 Drift Reduction For Metal-Oxide Sensor Arrays Using Canonical Correlation Regression And Partial Least Squares R Gutierrez-Osuna Computer Science Department, Wright State University, Dayton, OH 45435,
A New Generation of Brain-Computer Interfaces Driven by Discovery of Latent EEG-fMRI Linkages Using Tensor Decomposition
 A New Generation of Brain-Computer Interfaces Driven by Discovery of Latent EEG-fMRI Linkages Using Tensor Decomposition Gopikrishna Deshpande AU MRI Research Center AU Department of Electrical and Computer
Processing Big Data Matrix Sketching
 Processing Big Data Matrix Sketching Dimensionality reduction Linear Principal Component Analysis: SVD-based Compressed sensing Matrix sketching Non-linear Kernel PCA Isometric mapping Matrix sketching
c 4, < y 2, 1 0, otherwise,
 Fundamentals of Big Data Analytics Univ.-Prof. Dr. rer. nat. Rudolf Mathar Problem. Probability theory: The outcome of an experiment is described by three events A, B and C. The probabilities Pr(A) =,
PRINCIPAL COMPONENTS ANALYSIS
 121 CHAPTER 11 PRINCIPAL COMPONENTS ANALYSIS We now have the tools necessary to discuss one of the most important concepts in mathematical statistics: Principal Components Analysis (PCA). PCA involves
LVM METHODS IN THE PRESENCE OF STRUCTURED NOISE
 LVM METHODS IN THE PRESENCE OF STRUCTURED NOISE REGULARIZED LATENT VARIABLE METHODS IN THE PRESENCE OF STRUCTURED NOISE AND THEIR APPLICATION IN THE ANALYSIS OF ELECTROENCEPHALOGRAM DATA BY SIAMAK SALARI
New Machine Learning Methods for Neuroimaging
 New Machine Learning Methods for Neuroimaging Gatsby Computational Neuroscience Unit University College London, UK Dept of Computer Science University of Helsinki, Finland Outline Resting-state networks
Optimizing Model Development and Validation Procedures of Partial Least Squares for Spectral Based Prediction of Soil Properties
 Optimizing Model Development and Validation Procedures of Partial Least Squares for Spectral Based Prediction of Soil Properties Soil Spectroscopy Extracting chemical and physical attributes from spectral
Kernel Sliced Inverse Regression With Applications to Classification
 May 21-24, 2008 in Durham, NC Kernel Sliced Inverse Regression With Applications to Classification Han-Ming Wu (Hank) Department of Mathematics, Tamkang University Taipei, Taiwan 2008/05/22 http://www.hmwu.idv.tw
A New Bayesian Variable Selection Method: The Bayesian Lasso with Pseudo Variables
 A New Bayesian Variable Selection Method: The Bayesian Lasso with Pseudo Variables Qi Tang (Joint work with Kam-Wah Tsui and Sijian Wang) Department of Statistics University of Wisconsin-Madison Feb. 8,
Latent Factor Regression Models for Grouped Outcomes
 Latent Factor Regression Models for Grouped Outcomes Dawn Woodard Operations Research and Information Engineering Cornell University with T. M. T. Love, S. W. Thurston, D. Ruppert S. Sathyanarayana and
Sufficient Dimension Reduction for Longitudinally Measured Predictors
 Sufficient Dimension Reduction for Longitudinally Measured Predictors Ruth Pfeiffer National Cancer Institute, NIH, HHS joint work with Efstathia Bura and Wei Wang TU Wien and GWU University JSM Vancouver
Modeling Mutagenicity Status of a Diverse Set of Chemical Compounds by Envelope Methods
 Modeling Mutagenicity Status of a Diverse Set of Chemical Compounds by Envelope Methods Subho Majumdar School of Statistics, University of Minnesota Envelopes in Chemometrics August 4, 2014 1 / 23 Motivation
The prediction of house price
 000 001 002 003 004 005 006 007 008 009 010 011 012 013 014 015 016 017 018 019 020 021 022 023 024 025 026 027 028 029 030 031 032 033 034 035 036 037 038 039 040 041 042 043 044 045 046 047 048 049 050
VCMC: Variational Consensus Monte Carlo
 VCMC: Variational Consensus Monte Carlo Maxim Rabinovich, Elaine Angelino, Michael I. Jordan Berkeley Vision and Learning Center September 22, 2015 probabilistic models! sky fog bridge water grass object
Advanced Introduction to Machine Learning
 10-715 Advanced Introduction to Machine Learning Homework 3 Due Nov 12, 10.30 am Rules 1. Homework is due on the due date at 10.30 am. Please hand over your homework at the beginning of class. Please see
Principal component analysis (PCA) for clustering gene expression data
 for clustering gene expression data") Principal component analysis (PCA) for clustering gene expression data Ka Yee Yeung Walter L. Ruzzo Bioinformatics, v17 #9 (2001) pp 763-774 1 Outline of talk Background and motivation Design of our empirical
Principal component analysis (PCA) for clustering gene expression data Ka Yee Yeung Walter L. Ruzzo Bioinformatics, v17 #9 (2001) pp 763-774 1 Outline of talk Background and motivation Design of our empirical
Introduction to Machine Learning. PCA and Spectral Clustering. Introduction to Machine Learning, Slides: Eran Halperin
 1 Introduction to Machine Learning PCA and Spectral Clustering Introduction to Machine Learning, 2013-14 Slides: Eran Halperin Singular Value Decomposition (SVD) The singular value decomposition (SVD)
Principal Component Analysis
 Principal Component Analysis Yingyu Liang yliang@cs.wisc.edu Computer Sciences Department University of Wisconsin, Madison [based on slides from Nina Balcan] slide 1 Goals for the lecture you should understand
Vector Space Models. wine_spectral.r
 Vector Space Models 137 wine_spectral.r Latent Semantic Analysis Problem with words Even a small vocabulary as in wine example is challenging LSA Reduce number of columns of DTM by principal components
CSC 411: Lecture 03: Linear Classification
 CSC 411: Lecture 03: Linear Classification Richard Zemel, Raquel Urtasun and Sanja Fidler University of Toronto Zemel, Urtasun, Fidler (UofT) CSC 411: 03-Classification 1 / 24 Examples of Problems What
Non-Asymptotic Theory of Random Matrices Lecture 4: Dimension Reduction Date: January 16, 2007
 Non-Asymptotic Theory of Random Matrices Lecture 4: Dimension Reduction Date: January 16, 2007 Lecturer: Roman Vershynin Scribe: Matthew Herman 1 Introduction Consider the set X = {n points in R N } where
FACTOR ANALYSIS AND MULTIDIMENSIONAL SCALING
 FACTOR ANALYSIS AND MULTIDIMENSIONAL SCALING Vishwanath Mantha Department for Electrical and Computer Engineering Mississippi State University, Mississippi State, MS 39762 mantha@isip.msstate.edu ABSTRACT
Dimensionality Reduction for Exponential Family Data
 Dimensionality Reduction for Exponential Family Data Yoonkyung Lee* Department of Statistics The Ohio State University *joint work with Andrew Landgraf July 2-6, 2018 Computational Strategies for Large-Scale
Optimization of Designs for fmri
 Optimization of Designs for fmri UCLA Advanced Neuroimaging Summer School August 2, 2007 Thomas Liu, Ph.D. UCSD Center for Functional MRI Why optimize? Scans are expensive. Subjects can be difficult to
Data Mining. Dimensionality reduction. Hamid Beigy. Sharif University of Technology. Fall 1395
 Data Mining Dimensionality reduction Hamid Beigy Sharif University of Technology Fall 1395 Hamid Beigy (Sharif University of Technology) Data Mining Fall 1395 1 / 42 Outline 1 Introduction 2 Feature selection
Final Exam, Machine Learning, Spring 2009
 Name: Andrew ID: Final Exam, 10701 Machine Learning, Spring 2009 - The exam is open-book, open-notes, no electronics other than calculators. - The maximum possible score on this exam is 100. You have 3
CS168: The Modern Algorithmic Toolbox Lecture #8: How PCA Works
 CS68: The Modern Algorithmic Toolbox Lecture #8: How PCA Works Tim Roughgarden & Gregory Valiant April 20, 206 Introduction Last lecture introduced the idea of principal components analysis (PCA). The
An Introduction to Matrix Algebra
 An Introduction to Matrix Algebra EPSY 905: Fundamentals of Multivariate Modeling Online Lecture #8 EPSY 905: Matrix Algebra In This Lecture An introduction to matrix algebra Ø Scalars, vectors, and matrices
Neural Networks, Computation Graphs. CMSC 470 Marine Carpuat
 Neural Networks, Computation Graphs CMSC 470 Marine Carpuat Binary Classification with a Multi-layer Perceptron φ A = 1 φ site = 1 φ located = 1 φ Maizuru = 1 φ, = 2 φ in = 1 φ Kyoto = 1 φ priest = 0 φ
Experimental Design and Data Analysis for Biologists
 Experimental Design and Data Analysis for Biologists Gerry P. Quinn Monash University Michael J. Keough University of Melbourne CAMBRIDGE UNIVERSITY PRESS Contents Preface page xv I I Introduction 1 1.1
-Principal components analysis is by far the oldest multivariate technique, dating back to the early 1900's; ecologists have used PCA since the
 1 2 3 -Principal components analysis is by far the oldest multivariate technique, dating back to the early 1900's; ecologists have used PCA since the 1950's. -PCA is based on covariance or correlation
Scalable Gaussian process models on matrices and tensors
 Scalable Gaussian process models on matrices and tensors Alan Qi CS & Statistics Purdue University Joint work with F. Yan, Z. Xu, S. Zhe, and IBM Research! Models for graph and multiway data Model Algorithm
Lecture 13. Principal Component Analysis. Brett Bernstein. April 25, CDS at NYU. Brett Bernstein (CDS at NYU) Lecture 13 April 25, / 26
 Lecture 13 April 25, / 26") Principal Component Analysis Brett Bernstein CDS at NYU April 25, 2017 Brett Bernstein (CDS at NYU) Lecture 13 April 25, 2017 1 / 26 Initial Question Intro Question Question Let S R n n be symmetric. 1
Principal Component Analysis Brett Bernstein CDS at NYU April 25, 2017 Brett Bernstein (CDS at NYU) Lecture 13 April 25, 2017 1 / 26 Initial Question Intro Question Question Let S R n n be symmetric. 1