Correlation. Engineering Mathematics III
|
|
|
- Carmella Watson
- 5 years ago
- Views:
Transcription
1 Correlation
2 Correlation Finding the relationship between two quantitative variables without being able to infer causal relationships Correlation is a statistical technique used to determine the degree to which two variables are related
3 Scatter diagram Rectangular coordinate Two quantitative variables One variable is called independent (X) and the second is called dependent (Y) Points are not joined No frequency table Y * * * X
4 Example Wt (kg) SBP mmhg)
 80 60 70 80 90 100 110 10 Scatter diagram of weight and systolic blood")
5 Wt (kg) SBP SBP(mmHg) (mmhg) wt (kg) Scatter diagram of weight and systolic blood pressure
6 SBP (mmhg) Scatter diagram of weight and systolic blood pressure Wt (kg) 10
7 Scatter plots The pattern of data is indicative of the type of relationship between your two variables: positive relationship negative relationship no relationship
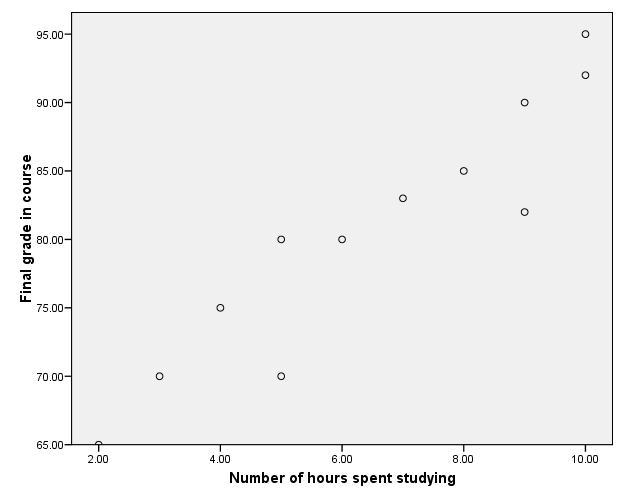
8 Positive relationship
9 Height in CM Age in Weeks
10 Negative relationship Reliability Age of Car

11 No relation
12 Correlation coefficient (r) It is also called Pearson's correlation or product moment correlation coefficient. It measures the nature and strength between two variables of the quantitative type.
13 The sign of r denotes the nature of association while the value of r denotes the strength of association.
14 If the sign is +ve this means the relation is direct (an increase in one variable is associated with an increase in the other variable and a decrease in one variable is associated with a decrease in the other variable). While if the sign is -ve this means an inverse or indirect relationship (which means an increase in one variable is associated with a decrease in the other).
15 The value of r ranges between ( -1) and ( +1) The value of r denotes the strength of the association as illustrated by the following diagram. strong -1 intermediate weak -0.5 weak 0 intermediate 0.5 indirect perfect correlation strong Direct no relation perfect correlation
16 If r = Zero this means no association or correlation between the two variables. If 0 < r < 0.5 = weak correlation. If 0.5 r < 0.75 = intermediate correlation. If 0.75 r < 1 = strong correlation. If r = l = perfect correlation.
17 How to compute the simple correlation coefficient (r) r x y xy n ( x) ( y) x. y n n
18 Example: A sample of 6 children was selected, data about their age in years and weight in kilograms was recorded as shown in the following table. It is required to find the correlation between age and weight. serial No Age (years) Weight (Kg)
19 These variables are of the quantitative type, one variable (Age) is called the independent and denoted as (X) variable and the other (weight) is called the dependent and denoted as (Y) variables to find the relation between age and weight compute the simple correlation coefficient using the following formula: r x y xy ( x) x n n ( y ). y n
20 Serial n. Age (years) (x) Weight (Kg) (y) xy X Y Total x= 41 y= 66 xy= 461 x= 91 y= 74
21 r (66) (41) r = strong direct correlation

22 EXAMPLE: Relationship between Anxiety and Test Scores X Y Anxiety (X) Test score (Y) X = Y = 3 X = 30 Y = 04 XY=19 XY
23 Calculating Correlation Coefficient r (6)(19) (3)(3) 6(30) 3 6(04) (356)(00) r = Indirect strong correlation
24 Spearman Rank Correlation Coefficient (rs) It is a non-parametric measure of correlation. This procedure makes use of the two sets of ranks that may be assigned to the sample values of x and Y. Spearman Rank correlation coefficient could be computed in the following cases: Both variables are quantitative. Both variables are qualitative ordinal. One variable is quantitative and the other is qualitative ordinal.
25 Procedure: Rank the values of X from 1 to n where n is the numbers of pairs of values of X and Y in the sample. Rank the values of Y from 1 to n. Compute the value of di for each pair of observation by subtracting the rank of Yi from the rank of Xi Square each di and compute di which is the sum of the squared values.
26 5. Apply the following formula 6 (di) rs 1 n(n 1) The value of rs denotes the magnitude and nature of association giving the same interpretation as simple r.
27 Example In a study of the relationship between level education and income the following data was obtained. Find the relationship between them and comment. sample numbers A B C D E F G level education (X) Preparatory. Primary. University. secondary secondary illiterate University. Income (Y)
28 Answer: Rank Y di di (X) (Y) Rank X A Preparatory B Primary C University D secondary E secondary F illiterate G university di=64
29 6 64 rs (48) Comment: There is an indirect weak correlation between level of education and income.
Correlation & Regression. Dr. Moataza Mahmoud Abdel Wahab Lecturer of Biostatistics High Institute of Public Health University of Alexandria
 بسم الرحمن الرحيم Correlation & Regression Dr. Moataza Mahmoud Abdel Wahab Lecturer of Biostatistics High Institute of Public Health University of Alexandria Correlation Finding the relationship between
CORRELATION ANALYSIS. Dr. Anulawathie Menike Dept. of Economics
 CORRELATION ANALYSIS Dr. Anulawathie Menike Dept. of Economics 1 What is Correlation The correlation is one of the most common and most useful statistics. It is a term used to describe the relationship
Correlation and Regression
 Correlation and Regression 1 Overview Introduction Scatter Plots Correlation Regression Coefficient of Determination 2 Objectives of the topic 1. Draw a scatter plot for a set of ordered pairs. 2. Compute
CORRELATION. compiled by Dr Kunal Pathak
 CORRELATION compiled by Dr Kunal Pathak Flow of Presentation Definition Types of correlation Method of studying correlation a) Scatter diagram b) Karl Pearson s coefficient of correlation c) Spearman s
CORRELATION AND REGRESSION
 CORRELATION AND REGRESSION CORRELATION The correlation coefficient is a number, between -1 and +1, which measures the strength of the relationship between two sets of data. The closer the correlation coefficient
Can you tell the relationship between students SAT scores and their college grades?
 Correlation One Challenge Can you tell the relationship between students SAT scores and their college grades? A: The higher SAT scores are, the better GPA may be. B: The higher SAT scores are, the lower
Correlation: Relationships between Variables
 Correlation Correlation: Relationships between Variables So far, nearly all of our discussion of inferential statistics has focused on testing for differences between group means However, researchers are
Measuring Associations : Pearson s correlation
 Measuring Associations : Pearson s correlation Scatter Diagram A scatter diagram is a graph that shows that the relationship between two variables measured on the same individual. Each individual in the
CORELATION - Pearson-r - Spearman-rho
 CORELATION - Pearson-r - Spearman-rho Scatter Diagram A scatter diagram is a graph that shows that the relationship between two variables measured on the same individual. Each individual in the set is
GROUP-RANK CORRELATION COEFFICIENT
 GROUP-RANK CORRELATION COEFFICIENT By S. V. SIMHADRI (Department of Electrical Communication Engineering Indian Institution of Science Bangalore- 12, India) [Received: October 30, 1972] ABSTRACT A new
Chapter 16: Correlation
 Chapter 16: Correlation Correlations: Measuring and Describing Relationships A correlation is a statistical method used to measure and describe the relationship between two variables. A relationship exists
Measures of Central Tendency and their dispersion and applications. Acknowledgement: Dr Muslima Ejaz
 Measures of Central Tendency and their dispersion and applications Acknowledgement: Dr Muslima Ejaz LEARNING OBJECTIVES: Compute and distinguish between the uses of measures of central tendency: mean,
Graphical Techniques Stem and Leaf Box plot Histograms Cumulative Frequency Distributions
 Class #8 Wednesday 9 February 2011 What did we cover last time? Description & Inference Robustness & Resistance Median & Quartiles Location, Spread and Symmetry (parallels from classical statistics: Mean,
Correlation and Regression
 Correlation and Regression. ITRDUCTI Till now, we have been working on one set of observations or measurements e.g. heights of students in a class, marks of students in an exam, weekly wages of workers
Correlation. Quantitative Aptitude & Business Statistics
 Correlation Statistics Correlation Correlation is the relationship that exists between two or more variables. If two variables are related to each other in such a way that change increases a corresponding
Parametric versus Nonparametric Statistics-when to use them and which is more powerful? Dr Mahmoud Alhussami
 Parametric versus Nonparametric Statistics-when to use them and which is more powerful? Dr Mahmoud Alhussami Parametric Assumptions The observations must be independent. Dependent variable should be continuous
psychological statistics
 psychological statistics B Sc. Counselling Psychology 011 Admission onwards III SEMESTER COMPLEMENTARY COURSE UNIVERSITY OF CALICUT SCHOOL OF DISTANCE EDUCATION CALICUT UNIVERSITY.P.O., MALAPPURAM, KERALA,
Reminder: Student Instructional Rating Surveys
 Reminder: Student Instructional Rating Surveys You have until May 7 th to fill out the student instructional rating surveys at https://sakai.rutgers.edu/portal/site/sirs The survey should be available
UGRC 120 Numeracy Skills
 UGRC 120 Numeracy Skills Session 7 MEASURE OF LINEAR ASSOCIATION & RELATION Lecturer: Dr. Ezekiel N. N. Nortey/Mr. Enoch Nii Boi Quaye, Statistics Contact Information: ennortey@ug.edu.gh/enbquaye@ug.edu.gh
Class 11 Maths Chapter 15. Statistics
 1 P a g e Class 11 Maths Chapter 15. Statistics Statistics is the Science of collection, organization, presentation, analysis and interpretation of the numerical data. Useful Terms 1. Limit of the Class
Analysing data: regression and correlation S6 and S7
 Basic medical statistics for clinical and experimental research Analysing data: regression and correlation S6 and S7 K. Jozwiak k.jozwiak@nki.nl 2 / 49 Correlation So far we have looked at the association
Introduction and Descriptive Statistics p. 1 Introduction to Statistics p. 3 Statistics, Science, and Observations p. 5 Populations and Samples p.
 Preface p. xi Introduction and Descriptive Statistics p. 1 Introduction to Statistics p. 3 Statistics, Science, and Observations p. 5 Populations and Samples p. 6 The Scientific Method and the Design of
Answer Key. 9.1 Scatter Plots and Linear Correlation. Chapter 9 Regression and Correlation. CK-12 Advanced Probability and Statistics Concepts 1
 9.1 Scatter Plots and Linear Correlation Answers 1. A high school psychologist wants to conduct a survey to answer the question: Is there a relationship between a student s athletic ability and his/her
UNIT 4 RANK CORRELATION (Rho AND KENDALL RANK CORRELATION
 UNIT 4 RANK CORRELATION (Rho AND KENDALL RANK CORRELATION Structure 4.0 Introduction 4.1 Objectives 4. Rank-Order s 4..1 Rank-order data 4.. Assumptions Underlying Pearson s r are Not Satisfied 4.3 Spearman
Key Concepts. Correlation (Pearson & Spearman) & Linear Regression. Assumptions. Correlation parametric & non-para. Correlation
 & Linear Regression. Assumptions. Correlation parametric & non-para. Correlation") Correlation (Pearson & Spearman) & Linear Regression Azmi Mohd Tamil Key Concepts Correlation as a statistic Positive and Negative Bivariate Correlation Range Effects Outliers Regression & Prediction Directionality
Correlation (Pearson & Spearman) & Linear Regression Azmi Mohd Tamil Key Concepts Correlation as a statistic Positive and Negative Bivariate Correlation Range Effects Outliers Regression & Prediction Directionality
About Bivariate Correlations and Linear Regression
 About Bivariate Correlations and Linear Regression TABLE OF CONTENTS About Bivariate Correlations and Linear Regression... 1 What is BIVARIATE CORRELATION?... 1 What is LINEAR REGRESSION... 1 Bivariate
PS2: Two Variable Statistics
 PS2: Two Variable Statistics LT2: Measuring Correlation and Line of best fit by eye. LT3: Linear regression LT4: The χ 2 test of independence. 1 Pearson's Correlation Coefficient In examinations you are
Business Mathematics and Statistics (MATH0203) Chapter 1: Correlation & Regression
 Chapter 1: Correlation & Regression") Business Mathematics and Statistics (MATH0203) Chapter 1: Correlation & Regression Dependent and independent variables The independent variable (x) is the one that is chosen freely or occur naturally.
Business Mathematics and Statistics (MATH0203) Chapter 1: Correlation & Regression Dependent and independent variables The independent variable (x) is the one that is chosen freely or occur naturally.
Chapter 16: Correlation
 Chapter : Correlation So far We ve focused on hypothesis testing Is the relationship we observe between x and y in our sample true generally (i.e. for the population from which the sample came) Which answers
Correlation and Simple Linear Regression
 Correlation and Simple Linear Regression Sasivimol Rattanasiri, Ph.D Section for Clinical Epidemiology and Biostatistics Ramathibodi Hospital, Mahidol University E-mail: sasivimol.rat@mahidol.ac.th 1 Outline
Correlation. A statistics method to measure the relationship between two variables. Three characteristics
 Correlation Correlation A statistics method to measure the relationship between two variables Three characteristics Direction of the relationship Form of the relationship Strength/Consistency Direction
Slide 7.1. Theme 7. Correlation
 Slide 7.1 Theme 7 Correlation Slide 7.2 Overview Researchers are often interested in exploring whether or not two variables are associated This lecture will consider Scatter plots Pearson correlation coefficient
Statistics Introductory Correlation
 Statistics Introductory Correlation Session 10 oscardavid.barrerarodriguez@sciencespo.fr April 9, 2018 Outline 1 Statistics are not used only to describe central tendency and variability for a single variable.
Correlation. What Is Correlation? Why Correlations Are Used
 Correlation 1 What Is Correlation? Correlation is a numerical value that describes and measures three characteristics of the relationship between two variables, X and Y The direction of the relationship
Contents. Acknowledgments. xix
 Table of Preface Acknowledgments page xv xix 1 Introduction 1 The Role of the Computer in Data Analysis 1 Statistics: Descriptive and Inferential 2 Variables and Constants 3 The Measurement of Variables
Chapter 9: Statistical Inference and the Relationship between Two Variables
 Chapter 9: Statstcal Inference and the Relatonshp between Two Varables Key Words The Regresson Model The Sample Regresson Equaton The Pearson Correlaton Coeffcent Learnng Outcomes After studyng ths chapter,
Chapter 11. Correlation and Regression
 Chapter 11. Correlation and Regression The word correlation is used in everyday life to denote some form of association. We might say that we have noticed a correlation between foggy days and attacks of
Correlation and Regression. Tudor Călinici 2017
 Correlation and Regression Tudor Călinici 2017 1 Objectives To verify the existence of a relation between two quantitative continuous variables using the coefficient of correlation If the correlation exists,
Nonparametric Statistics
 Nonparametric Statistics Nonparametric or Distribution-free statistics: used when data are ordinal (i.e., rankings) used when ratio/interval data are not normally distributed (data are converted to ranks)
Describing Bivariate Data
 Describing Bivariate Data Correlation Linear Regression Assessing the Fit of a Line Nonlinear Relationships & Transformations The Linear Correlation Coefficient, r Recall... Bivariate Data: data that consists
Nonparametric Statistics. Leah Wright, Tyler Ross, Taylor Brown
 Nonparametric Statistics Leah Wright, Tyler Ross, Taylor Brown Before we get to nonparametric statistics, what are parametric statistics? These statistics estimate and test population means, while holding
Correlation & Linear Regression. Slides adopted fromthe Internet
 Correlation & Linear Regression Slides adopted fromthe Internet Roadmap Linear Correlation Spearman s rho correlation Kendall s tau correlation Linear regression Linear correlation Recall: Covariance n
1 A Review of Correlation and Regression
 1 A Review of Correlation and Regression SW, Chapter 12 Suppose we select n = 10 persons from the population of college seniors who plan to take the MCAT exam. Each takes the test, is coached, and then
Ø Set of mutually exclusive categories. Ø Classify or categorize subject. Ø No meaningful order to categorization.
 Statistical Tools in Evaluation HPS 41 Dr. Joe G. Schmalfeldt Types of Scores Continuous Scores scores with a potentially infinite number of values. Discrete Scores scores limited to a specific number
Correlation and Linear Regression
 Correlation and Linear Regression Correlation: Relationships between Variables So far, nearly all of our discussion of inferential statistics has focused on testing for differences between group means
not to be republished NCERT Correlation CHAPTER 1. INTRODUCTION
 CHAPTER 7 Studying this chapter should enable you to: understand the meaning of the term correlation; understand the nature of relationship between two variables; calculate the different measures of correlation;
EXAMINATIONS OF THE ROYAL STATISTICAL SOCIETY
 EXAMINATIONS OF THE ROYAL STATISTICAL SOCIETY HIGHER CERTIFICATE IN STATISTICS, 009 MODULE 4 : Linear models Time allowed: One and a half hours Candidates should answer THREE questions. Each question carries
Correlation and Regression
 Elementary Statistics A Step by Step Approach Sixth Edition by Allan G. Bluman http://www.mhhe.com/math/stat/blumanbrief SLIDES PREPARED BY LLOYD R. JAISINGH MOREHEAD STATE UNIVERSITY MOREHEAD KY Updated
CRP 272 Introduction To Regression Analysis
 CRP 272 Introduction To Regression Analysis 30 Relationships Among Two Variables: Interpretations One variable is used to explain another variable X Variable Independent Variable Explaining Variable Exogenous
Instrumentation (cont.) Statistics vs. Parameters. Descriptive Statistics. Types of Numerical Data
 Statistics vs. Parameters. Descriptive Statistics. Types of Numerical Data") Norm-Referenced vs. Criterion- Referenced Instruments Instrumentation (cont.) October 1, 2007 Note: Measurement Plan Due Next Week All derived scores give meaning to individual scores by comparing them
Norm-Referenced vs. Criterion- Referenced Instruments Instrumentation (cont.) October 1, 2007 Note: Measurement Plan Due Next Week All derived scores give meaning to individual scores by comparing them
Data files for today. CourseEvalua2on2.sav pontokprediktorok.sav Happiness.sav Ca;erplot.sav
 Correlation Data files for today CourseEvalua2on2.sav pontokprediktorok.sav Happiness.sav Ca;erplot.sav Defining Correlation Co-variation or co-relation between two variables These variables change together
Bivariate Relationships Between Variables
 Bivariate Relationships Between Variables BUS 735: Business Decision Making and Research 1 Goals Specific goals: Detect relationships between variables. Be able to prescribe appropriate statistical methods
Correlation. Patrick Breheny. November 15. Descriptive statistics Inference Summary
 Correlation Patrick Breheny November 15 Patrick Breheny University of Iowa Biostatistical Methods I (BIOS 5710) 1 / 21 Introduction Descriptive statistics Generally speaking, scientific questions often
Unit 14: Nonparametric Statistical Methods
 Unit 14: Nonparametric Statistical Methods Statistics 571: Statistical Methods Ramón V. León 8/8/2003 Unit 14 - Stat 571 - Ramón V. León 1 Introductory Remarks Most methods studied so far have been based
LOOKING FOR RELATIONSHIPS
 LOOKING FOR RELATIONSHIPS One of most common types of investigation we do is to look for relationships between variables. Variables may be nominal (categorical), for example looking at the effect of an
Correlation: From Picture to Formula
 Correlation: From icture to Formula KEYWORDS: Teaching; Scatter diagrams; Correlation coe cients. eter Holmes RSS Centre for Statistical Education, Nottingham Trent University, England. e-mail: peter.holmes@ntu.ac.uk
Ch. 16: Correlation and Regression
 Ch. 1: Correlation and Regression With the shift to correlational analyses, we change the very nature of the question we are asking of our data. Heretofore, we were asking if a difference was likely to
Spearman Rho Correlation
 Spearman Rho Correlation Learning Objectives After studying this Chapter, you should be able to: know when to use Spearman rho, Calculate Spearman rho coefficient, Interpret the correlation coefficient,
Nonparametric Statistics Notes
 Nonparametric Statistics Notes Chapter 5: Some Methods Based on Ranks Jesse Crawford Department of Mathematics Tarleton State University (Tarleton State University) Ch 5: Some Methods Based on Ranks 1
Regression and Correlation
 Regression and Correlation Raja Almukkahal Larry Ottman Danielle DeLancey Addie Evans Ellen Lawsky Brenda Meery Say Thanks to the Authors Click http://www.ck12.org/saythanks (No sign in required) To access
Effect Size Statistics:
 : The Craft of Statistical Analysis Webinars Karen Grace-Martin 1 What is an effect size statistic? an index that is (1) responsive to the strength of the association between an experimental manipulation
PhysicsAndMathsTutor.com
 1. The product moment correlation coefficient is denoted by r and Spearman s rank correlation coefficient is denoted by r s. (a) Sketch separate scatter diagrams, with five points on each diagram, to show
Statistics: A review. Why statistics?
 Statistics: A review Why statistics? What statistical concepts should we know? Why statistics? To summarize, to explore, to look for relations, to predict What kinds of data exist? Nominal, Ordinal, Interval
DETAILED CONTENTS PART I INTRODUCTION AND DESCRIPTIVE STATISTICS. 1. Introduction to Statistics
 DETAILED CONTENTS About the Author Preface to the Instructor To the Student How to Use SPSS With This Book PART I INTRODUCTION AND DESCRIPTIVE STATISTICS 1. Introduction to Statistics 1.1 Descriptive and
Correlation. January 11, 2018
 Correlation January 11, 2018 Contents Correlations The Scattterplot The Pearson correlation The computational raw-score formula Survey data Fun facts about r Sensitivity to outliers Spearman rank-order
11 Correlation and Regression
 Chapter 11 Correlation and Regression August 21, 2017 1 11 Correlation and Regression When comparing two variables, sometimes one variable (the explanatory variable) can be used to help predict the value
8.1 Frequency Distribution, Frequency Polygon, Histogram page 326
 page 35 8 Statistics are around us both seen and in ways that affect our lives without us knowing it. We have seen data organized into charts in magazines, books and newspapers. That s descriptive statistics!
Upon completion of this chapter, you should be able to:
 1 Chaptter 7:: CORRELATIION Upon completion of this chapter, you should be able to: Explain the concept of relationship between variables Discuss the use of the statistical tests to determine correlation
Glossary. The ISI glossary of statistical terms provides definitions in a number of different languages:
 Glossary The ISI glossary of statistical terms provides definitions in a number of different languages: http://isi.cbs.nl/glossary/index.htm Adjusted r 2 Adjusted R squared measures the proportion of the
Ø Set of mutually exclusive categories. Ø Classify or categorize subject. Ø No meaningful order to categorization.
 Statistical Tools in Evaluation HPS 41 Fall 213 Dr. Joe G. Schmalfeldt Types of Scores Continuous Scores scores with a potentially infinite number of values. Discrete Scores scores limited to a specific
Correlation. Chapter 9 (omit 9.5, 9.10, 9.13, 9.14) Aplia (week 6 Correlation; omit question 6)
 Aplia (week 6 Correlation; omit question 6)") Chapter 9 (omit 9.5, 9., 9.13, 9.1) Aplia (week Correlation; omit question ) Research report details in course syllabus due October 1 Assessing relationship between variables level of neurotransmitter
Chapter 9 (omit 9.5, 9., 9.13, 9.1) Aplia (week Correlation; omit question ) Research report details in course syllabus due October 1 Assessing relationship between variables level of neurotransmitter
PBAF 528 Week 8. B. Regression Residuals These properties have implications for the residuals of the regression.
 PBAF 528 Week 8 What are some problems with our model? Regression models are used to represent relationships between a dependent variable and one or more predictors. In order to make inference from the
9. Linear Regression and Correlation
 9. Linear Regression and Correlation Data: y a quantitative response variable x a quantitative explanatory variable (Chap. 8: Recall that both variables were categorical) For example, y = annual income,
Session III: New ETSI Model on Wideband Speech and Noise Transmission Quality Phase II. STF Validation results
 Session III: New ETSI Model on Wideband Speech and Noise Transmission Quality Phase II STF 294 - Validation results ETSI Workshop on Speech and Noise in Wideband Communication Javier Aguiar (University
Understand the difference between symmetric and asymmetric measures
 Chapter 9 Measures of Strength of a Relationship Learning Objectives Understand the strength of association between two variables Explain an association from a table of joint frequencies Understand a proportional
Simulating Realistic Ecological Count Data
 1 / 76 Simulating Realistic Ecological Count Data Lisa Madsen Dave Birkes Oregon State University Statistics Department Seminar May 2, 2011 2 / 76 Outline 1 Motivation Example: Weed Counts 2 Pearson Correlation
Answer keys for Assignment 10: Measurement of study variables (The correct answer is underlined in bold text)
") Answer keys for Assignment 10: Measurement of study variables (The correct answer is underlined in bold text) 1. A quick and easy indicator of dispersion is a. Arithmetic mean b. Variance c. Standard deviation
Answer keys for Assignment 10: Measurement of study variables (The correct answer is underlined in bold text) 1. A quick and easy indicator of dispersion is a. Arithmetic mean b. Variance c. Standard deviation
Use properties of exponents. Use the properties of rational exponents to simplify the expression. 12 d.
 EXAMPLE 1 Use properties of exponents Use the properties of rational exponents to simplify the expression. a. 7 1/ 7 1/2 7 (1/ + 1/2) 7 / b. (6 1/2 1/ ) 2 (6 1/2 ) 2 ( 1/ ) 2 6( 1/2 2 ) ( 1/ 2 ) 6 1 2/
Biostatistics for physicists fall Correlation Linear regression Analysis of variance
 Biostatistics for physicists fall 2015 Correlation Linear regression Analysis of variance Correlation Example: Antibody level on 38 newborns and their mothers There is a positive correlation in antibody
Inferences for Correlation
 Inferences for Correlation Quantitative Methods II Plan for Today Recall: correlation coefficient Bivariate normal distributions Hypotheses testing for population correlation Confidence intervals for population
Nemours Biomedical Research Biostatistics Core Statistics Course Session 4. Li Xie March 4, 2015
 Nemours Biomedical Research Biostatistics Core Statistics Course Session 4 Li Xie March 4, 2015 Outline Recap: Pairwise analysis with example of twosample unpaired t-test Today: More on t-tests; Introduction
Chapter 10. Correlation and Regression. Lecture 1 Sections:
 Chapter 10 Correlation and Regression Lecture 1 Sections: 10.1 10. You will now be introduced to important methods for making inferences based on sample data that come in pairs. In the previous chapter,
Relationships between variables. Association Examples: Smoking is associated with heart disease. Weight is associated with height.
 Relationships between variables. Association Examples: Smoking is associated with heart disease. Weight is associated with height. Income is associated with education. Functional relationships between
Bivariate statistics: correlation
 Research Methods for Political Science Bivariate statistics: correlation Dr. Thomas Chadefaux Assistant Professor in Political Science Thomas.chadefaux@tcd.ie 1 Bivariate relationships: interval-ratio
Correlation and simple linear regression S5
 Basic medical statistics for clinical and eperimental research Correlation and simple linear regression S5 Katarzyna Jóźwiak k.jozwiak@nki.nl November 15, 2017 1/41 Introduction Eample: Brain size and
Readings Howitt & Cramer (2014) Overview
 Overview") Readings Howitt & Cramer (4) Ch 7: Relationships between two or more variables: Diagrams and tables Ch 8: Correlation coefficients: Pearson correlation and Spearman s rho Ch : Statistical significance
Readings Howitt & Cramer (4) Ch 7: Relationships between two or more variables: Diagrams and tables Ch 8: Correlation coefficients: Pearson correlation and Spearman s rho Ch : Statistical significance
Ordinal Variables in 2 way Tables
 Ordinal Variables in 2 way Tables Edps/Psych/Soc 589 Carolyn J. Anderson Department of Educational Psychology c Board of Trustees, University of Illinois Fall 2018 C.J. Anderson (Illinois) Ordinal Variables
9 Correlation and Regression
 9 Correlation and Regression SW, Chapter 12. Suppose we select n = 10 persons from the population of college seniors who plan to take the MCAT exam. Each takes the test, is coached, and then retakes the
MATH 1070 Introductory Statistics Lecture notes Relationships: Correlation and Simple Regression
 MATH 1070 Introductory Statistics Lecture notes Relationships: Correlation and Simple Regression Objectives: 1. Learn the concepts of independent and dependent variables 2. Learn the concept of a scatterplot
Pearson s correlation coefficient is denoted by r and is defined by
 CRRELATIN ANALSIS Correlation is another way of assessing the relationship between variables. To be more precise, it measures the etent of correspondence between the ordering of two random variables. There
Readings Howitt & Cramer (2014)
") Readings Howitt & Cramer (014) Ch 7: Relationships between two or more variables: Diagrams and tables Ch 8: Correlation coefficients: Pearson correlation and Spearman s rho Ch 11: Statistical significance
Readings Howitt & Cramer (014) Ch 7: Relationships between two or more variables: Diagrams and tables Ch 8: Correlation coefficients: Pearson correlation and Spearman s rho Ch 11: Statistical significance
Chs. 15 & 16: Correlation & Regression
 Chs. 15 & 16: Correlation & Regression With the shift to correlational analyses, we change the very nature of the question we are asking of our data. Heretofore, we were asking if a difference was likely
Statistical Methods. by Robert W. Lindeman WPI, Dept. of Computer Science
 Statistical Methods by Robert W. Lindeman WPI, Dept. of Computer Science gogo@wpi.edu Descriptive Methods Frequency distributions How many people were similar in the sense that according to the dependent
REVIEW 8/2/2017 陈芳华东师大英语系
 REVIEW Hypothesis testing starts with a null hypothesis and a null distribution. We compare what we have to the null distribution, if the result is too extreme to belong to the null distribution (p
Correlation. Martin Bland. Correlation. Correlation coefficient. Clinical Biostatistics
 Clinical Biostatistics Correlation Martin Bland Professor of Health Statistics University of York http://martinbland.co.uk/ Correlation Example: Muscle and height in 42 alcoholics A scatter diagram: How
Assoc.Prof.Dr. Wolfgang Feilmayr Multivariate Methods in Regional Science: Regression and Correlation Analysis REGRESSION ANALYSIS
 REGRESSION ANALYSIS Regression Analysis can be broadly defined as the analysis of statistical relationships between one dependent and one or more independent variables. Although the terms dependent and
Chapter 18 Resampling and Nonparametric Approaches To Data
 Chapter 18 Resampling and Nonparametric Approaches To Data 18.1 Inferences in children s story summaries (McConaughy, 1980): a. Analysis using Wilcoxon s rank-sum test: Younger Children Older Children
Association Between Variables Measured at the Interval-Ratio Level: Bivariate Correlation and Regression
 Association Between Variables Measured at the Interval-Ratio Level: Bivariate Correlation and Regression Last couple of classes: Measures of Association: Phi, Cramer s V and Lambda (nominal level of measurement)
Draft Proof - Do not copy, post, or distribute. Chapter Learning Objectives REGRESSION AND CORRELATION THE SCATTER DIAGRAM
 1 REGRESSION AND CORRELATION As we learned in Chapter 9 ( Bivariate Tables ), the differential access to the Internet is real and persistent. Celeste Campos-Castillo s (015) research confirmed the impact
HYPOTHESIS TESTING II TESTS ON MEANS. Sorana D. Bolboacă
 HYPOTHESIS TESTING II TESTS ON MEANS Sorana D. Bolboacă OBJECTIVES Significance value vs p value Parametric vs non parametric tests Tests on means: 1 Dec 14 2 SIGNIFICANCE LEVEL VS. p VALUE Materials and