CORRELATION ANALYSIS. Dr. Anulawathie Menike Dept. of Economics
|
|
|
- Diane Glenn
- 6 years ago
- Views:
Transcription
1 CORRELATION ANALYSIS Dr. Anulawathie Menike Dept. of Economics 1
2 What is Correlation The correlation is one of the most common and most useful statistics. It is a term used to describe the relationship of two variables. Where one variable has an effect on the other. The correlation analysis enable us to have an idea about the strength/degree and direction of the relationship between two variables. It refers to the techniques used in measuring the closeness of the relationship between the variables. 2
3 What is Correlation Cont.. Eg: 1. monthly earnings of households and monthly expenses on entertainment. when monthly earnings increase, there is a increase on entertainment expenses. (Positive correlation) 2. price of a commodity and the demand for it. when price increases, there is a decline in its demand. (Negative correlation) 3. Temperature and Ice-cream sales. When temperature increases, Ice-cream sales go up. (Positive correlation) - Such relations are studied in correlation - 3
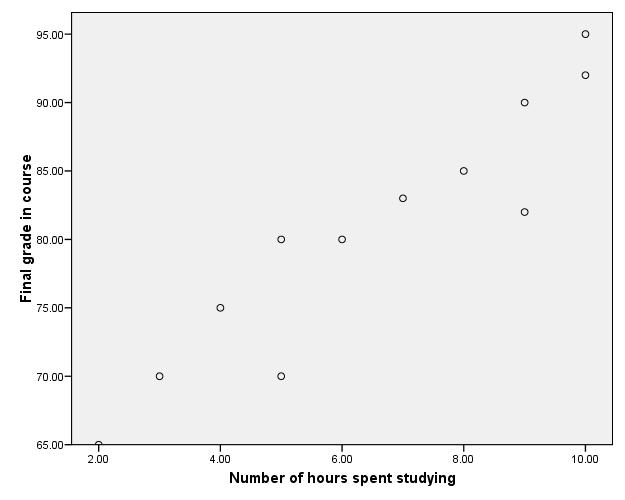
4 Examples of Correlation Fertilizer used and yield of rice per acre. Number of police round and number of crime. Monthly income and consumption expenditure. Age of car and selling price. Height and weight of individuals. Advertising expenditure and sales of a product. Calories eaten per day and IQ. No. of hours spent studying and final grade. Price and supply of a commodity. Number of dependents and monthly expenditure. 4
5 Types of Correlation There are different types of correlation. Some of the most important types are: 1. Positive and Negative Correlation. 2. Simple, Partial and Multiple Correlation. 5
6 Positive Correlation If the two variables increase or decrease together, they have a positive (direct) correlation. (If the values of two variables changing with same direction) Eg: The height and weight of a growing child. Price and supply of a commodity. Study time and grades. Statistics score and GPA. 6
7 Negative Correlation If one variable is increasing and the other is decreasing, they have a negative (inverse/indirect) correlation. (If the values of two variables changing with opposite direction) Eg: Price and demand of a commodity. Alcohol consumption and driving ability. Women's education and fertility. Age of the car and selling price. 7
8 Simple, partial and Multiple Correlation The distinction between these three types of correlation depends upon the number of variables studied. Simple correlation When only two variables are studied, it is a problem of simple correlation. Eg: Relationship between fertilizer used and yield of rice per acre. 8
9 Partial Correlation In partial correlation we recognize more than two variables. But consider only two variables, i.e. it is a study of the relationship between one dependent variable and one independent variable by keeping the other independent variables constant. 9
10 Partial Correlation Cont. Eg: X 1 = Sales of a product X 2 = Advertising expenditure X 3 = No. of sales representatives When we study the relationship between X 1 and X 3, keeping an advertising expenditure (X 2 ) as constant. 10
11 Multiple Correlation In multiple correlation 3 or more variables are studied simultaneously (all together). Eg: Relationship between the yield of rice per acre and both the amount of rainfall and the amount of fertilizers used. 11
12 Methods to Study Correlation 1. Scatter Diagram Method/Dot Diagram Method/ Scatter plot Method 2. Karl Pearson s Coefficient of Correlation Method 3. Spearman's Rank Correlation Method 4. Two-Way Frequency Table Method 12
13 Scatter Diagram The relationship between any two variables can be portrayed graphically on an x- and y- axis. It is a graph of plotted points where each point represents the values of X and Y as a coordinate. This diagram may indicate both degree and the type (nature) of correlation. 13
14 Scatter Plots The pattern of data reveals the type of relationship between our two variables. 1. Positive relationship 2. Negative relationship 3. No relationship 14
15 Positive Relationship
16 Negative Relationship Y Final Grades X Absences 16
17 No Relationship
18 Advantages of Scatter Diagram Simple & Non Mathematical method. Not influenced by the size of extreme item. First step in investing the relationship between two variables. 18
19 Different Types of Correlation Correlations that follow a line It is called Linear correlations 19
20 Disadvantages of scatter diagram Can not adopt the exact degree of correlation 20
21 Simple correlation coefficient (r) (Karl Pearson s Correlation Coefficient) The measure of correlation called the correlation coefficient. It is also called Pearson s Correlation Coefficient or Product Moment Correlation Coefficient. It measures the direction and strength of linear (straight line) relationship between two variables of the quantitative type. The numerical value of r ranges from -1 to +1 (-1 r +1 ) 21
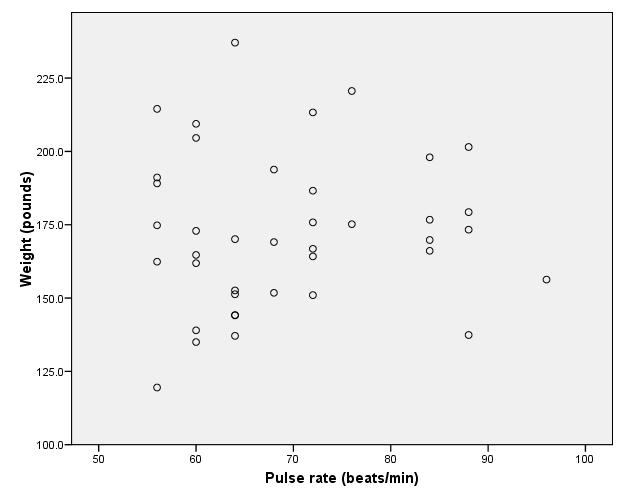
22 Interpretation of correlation coefficient (r) The numerical value of r ranges from -1 to +1. (-1 r +1 ) If the correlation coefficient higher, there is a strong relationship of two variables. In general, r > 0 indicates positive correlation r < 0 indicates negative correlation r = 0 indicates no relationship between two variables (Eg: weight and pulse rate, weight and hair color, shoe sizes and test scores, height and savings). 22
23 Interpretation of correlation coefficient (r) cont.. If r = +1, X and Y are perfectly positive linear relationship. If r = -1, X and Y are perfectly negative linear relationship. If r = 0, there is absolutely no association between the variables The closer to 1, the stronger the negative linear relationship The closer to +1, the stronger the positive linear relationship The closer to 0, the weaker any positive linear relationship 23
24 correlation coefficient (r) Pearson s correlation coefficient describes strength(degree) and direction(positive or negative) of linear relationship between two variables. 24
25 What is Strength/degree of the Relationship? Think of strength as to how closely the data points fall on and near a line drawn through the data. 25
26 What is Direction of the Relationship? (The sign + or - ) of r denotes the direction of association. If the sign is +ve, this means the relationship is positive or direct (Both variables rise or fall together in the same direction). If the sign is -ve, this means the relationship is negative (inverse) or indirect (A value of one variable increase, value of other variable decrease) 26

27 Linear Correlation (r) If X and Y indicate the two variables under consideration, a scatter diagram shows the location of points (X, Y) on a rectangular coordinate system. If all points in this scatter diagram seem to lie near a line, as in fig. 1 and 2, the correlation is called linear. Fig. 1 Fig. 2 Positive Linear Correlation Negative Linear Correlation No Correlation 27
28 Advantages of Pearson s Correlation Coefficient It summarizes in one value, the degree of correlation & direction of correlation also. 28
29 Limitations of Pearson s Correlation Coefficient Always assume linear relationship. Interpreting the value of r is difficult. Value of Correlation Coefficient is affected by the extreme values. Time consuming methods. 29
30 Y Final Grades Computation of correlation coefficient Scatter Diagram X Absences Absences Final Grade x y

31 Computation of correlation coefficient x y Method 1 xy x 2 y There is a strong negative correlation. 31
32 Exercises Calculate the correlation coefficient between the amount of radio time (X in minutes) and number of electrical appliances sold (Y). X Y Hint : X= 160, X 2 = 4480, Y= 116, Y 2 = 2462, XY= 3275 r = = 0.84 This shows a high degree of correlation (strong positive). 32
 (Y - Y) X Y x y x2 y2 xy 5 12-8 -13 64 169 104 9 20-4 -5 16 25 20 13 25 0 0 0 0 0 17 33 4 8 16 64 32 21 35 8 10 64 100 80 0 0 160 358 236 r = = 236 160 358 236")
33 Computation of correlation coefficient Method 2 (Mean deviation Method) Calculate the correlation coefficient between the price(x) and supply(y) from the given data. X Y (X - X) (Y - Y) X Y x y x2 y2 xy r = = = Two variables X and Y have almost perfect positive correlation. 33
34 Exercises Height of sisters (cm) Height of brothers(cm) x x 0, y 0, x 28, y 34, xy 25 r = Σxy Σx 2 Σy 2 34
35 Computation of correlation coefficient Method 3 (Assume mean method) A company manufactures different types of electrical appliances. It has been using radio for advertising its products. The following data shows amounts of radio time (X, in minutes) and the number of electrical appliances sold (Y) over the last six weeks. Calculate the coefficient of correlation between the two series. X Y
36 36
37 Coefficient of Determination (r 2 ) This indicates the percentage of the contribution that the factor makes towards the relationship between X and Y. In the first example, r = , then the coefficient of determination r 2 = This means that about 95% of the relationship is due to the absences. 37
38 Spearman's Rank Correlation Method It is a non-parametric measure of correlation. It is applied to the problems which data cannot be measured quantitatively. Eg: honesty, beauty, character, intelligence, morality etc. This method is based on the ranks (order) of the observations. 38
39 Spearman's Rank Correlation Cont. Spearman Rank correlation coefficient could be computed in the following cases: Both variables are quantitative. Both variables are qualitative ordinal. One variable is quantitative and the other is qualitative ordinal. 39
40 Computation of Rank Correlation Coefficient 1. When actual ranks are given In this situation the following steps are involved. I. Compute d (the difference of ranks). II. Compute d 2. III. Obtain the sum d 2. IV. Use the formula r s = 1-6Σd 2 n n
41 Example Suppose that 10 salesman employed by a company were given a month s training, they took a test and were ranked on the basis of their performance. They were then posted to their respective areas. At the end of six months, they were rated in respect of their sales performance. These ranks are shown below. calculate the coefficient of Rank Correlation. 41
42 Example Cont.. Salesman Ranks obtained in training Ranks based on sales performance d (R 1 - R 2 ) d d 2 = 24 r s = 1-6Σd 2 n n 2 1 = =
43 Computation of Rank Correlation Coefficient 2. When the ranks are not given If the ranks are not given, then we need to assign ranks to the data series. The lowest value in the series can be assigned rank 1 or the highest value in the series can be assigned rank 1. We need to follow the same scheme of ranking for the other series. Then calculate the rank correlation coefficient in similar way as we do when the ranks are given. 43
44 Procedure Rank the values of X from 1 to n. (n is the no. of pairs of values of X and Y in the sample). Rank the values of Y from 1 to n. Compute the value of d i (Subtracting the rank of Y from the rank of X). Square each d i squared values). Apply the formula. r s = 1 - and compute d 2 (Sum of the 6Σd 2 n(n 2 1) 44
45 Example For the following data, calculate the coefficient of Rank Correlation. X: Y:
46 Computation of Rank Correlation Coefficient X Rank X Y Rank Y d D r s = 1-6Σd 2 n n 2 1 = D 2 = 4 = =
47 Computation of Rank Correlation Coefficient 3. When equal ranks/repeated ranks are given In such cases average ranks should be assigned to each individual. 47
48 Example A psychologist wanted to compare two methods A and B of teaching. He selected a random sample of 22 students. He grouped them into 11 pairs so that the students in a pair have approximately equal scores on an intelligence test. In each pair one student was taught by method A and the other by method B and examined after the course. The marks obtained by them are tabulated below. Pair : A : B : Find the rank correlation coefficient. Let X denotes Method A and Y denotes Method B. 48
49 Computation X Y Rank X Rank Y d = X - Y d d 2 =
50 Computation r = 1-6 Σd m3 1 m m3 2 m m3 3 m 3 + n n 2 1 r = = = =
51 Correlation Coefficient for Grouped Data (Two Way Frequency Table) A bivariate distribution refers to data concerning two variables X and Y. If in a bivariate distribution data, the number of pairs of observation is large, then it becomes very difficult to calculate the coefficient of correlation (R). Therefore, to facilitate the calculation of R in such a large pairs of observations, the data are summarized in the form of a Two way Frequency Table. It is also called Bivariate Frequency Table or Contingency Table or Correlation Table, or simply Two way Table. 51
52 Example Below table shows the frequency distribution of the final grades of 100 students in mathematics and Economics. Referring to this table, find: 1. The coefficient of correlation (r). 2. The number of students who received grades of in Mathematics and in Economics. 3 The percentage of students with mathematics grades below The number of students who received a grade of 70 or more in Economics and of less than 80 in Mathematics. 5. The percentage of students who passed at least one of the subjects; assume that the minimum passing grade is
53 Economics Grades (Y) Correlation Table Mathematics Grades (X) Total Total
54 54
55 Computation: fd x d y = Sum of corner numbers in each column/row. Eg: fd x d y = = 32 (column) fd x d y = = 33 (row) f x = = 7 f y = = 12 f x d x = -2 x 7 = -14 f y d y = -3 x 12 = -36 f x d x2 = -2 2 x 7 = 28 f y d y2 = -3 2 x 12 =
56 Computation of Correlation Coefficient r = r = n Σfd x dy Σf x d x Σf y d y 2 n Σf x d x Σfx d x n Σf y d y Σfy d y (64)( 55) ( 55) 2 r = r =
57 Cont.. r = r = r = r =
58 1. R = Answers = 47, the percentage is 47% = The number of students with grades below 60 in both subjects are = 17. Thus the number of students with grades 60 or over in either Economics or Mathematics or in both is = 83, the percentage is 83% 58
59 Exercises Calculate the coefficient of correlation between the ages of husbands and wives from the following table. Age of Husbands Age of Wives Total T0tal
60 Age of Husbands X m dx Y m dy Age of Wives fx N = 53 fxdx= fxdx 10 fxdx 2 fxdx 2 = 98 fdxdy= fdxdy 86 fy fydy fydy 2 fdxdy fydy =16 fydy 2 = 92 fdxdy = 86 60
CORRELATION. compiled by Dr Kunal Pathak
 CORRELATION compiled by Dr Kunal Pathak Flow of Presentation Definition Types of correlation Method of studying correlation a) Scatter diagram b) Karl Pearson s coefficient of correlation c) Spearman s
CORRELATION AND REGRESSION
 CORRELATION AND REGRESSION CORRELATION The correlation coefficient is a number, between -1 and +1, which measures the strength of the relationship between two sets of data. The closer the correlation coefficient
UGRC 120 Numeracy Skills
 UGRC 120 Numeracy Skills Session 7 MEASURE OF LINEAR ASSOCIATION & RELATION Lecturer: Dr. Ezekiel N. N. Nortey/Mr. Enoch Nii Boi Quaye, Statistics Contact Information: ennortey@ug.edu.gh/enbquaye@ug.edu.gh
not to be republished NCERT Correlation CHAPTER 1. INTRODUCTION
 CHAPTER 7 Studying this chapter should enable you to: understand the meaning of the term correlation; understand the nature of relationship between two variables; calculate the different measures of correlation;
Correlation. Engineering Mathematics III
 Correlation Correlation Finding the relationship between two quantitative variables without being able to infer causal relationships Correlation is a statistical technique used to determine the degree
Correlation and Regression
 Correlation and Regression. ITRDUCTI Till now, we have been working on one set of observations or measurements e.g. heights of students in a class, marks of students in an exam, weekly wages of workers
Correlation. Quantitative Aptitude & Business Statistics
 Correlation Statistics Correlation Correlation is the relationship that exists between two or more variables. If two variables are related to each other in such a way that change increases a corresponding
UNIVERSITY OF CALICUT
 QUANTITATIVE TECHNIQUES FOR BUSINESS COMPLEMENTARY COURSE BBA (III Semester) B Com( (IV Semester) (2011 Admission) UNIVERSITY OF CALICUT SCHOOL OF DISTANCE EDUCATION Calicut University P.O. Malappuram,
Correlation & Regression. Dr. Moataza Mahmoud Abdel Wahab Lecturer of Biostatistics High Institute of Public Health University of Alexandria
 بسم الرحمن الرحيم Correlation & Regression Dr. Moataza Mahmoud Abdel Wahab Lecturer of Biostatistics High Institute of Public Health University of Alexandria Correlation Finding the relationship between
Bivariate Relationships Between Variables
 Bivariate Relationships Between Variables BUS 735: Business Decision Making and Research 1 Goals Specific goals: Detect relationships between variables. Be able to prescribe appropriate statistical methods
Quantitative Bivariate Data
 Statistics 211 (L02) - Linear Regression Quantitative Bivariate Data Consider two quantitative variables, defined in the following way: X i - the observed value of Variable X from subject i, i = 1, 2,,
Business Mathematics and Statistics (MATH0203) Chapter 1: Correlation & Regression
 Chapter 1: Correlation & Regression") Business Mathematics and Statistics (MATH0203) Chapter 1: Correlation & Regression Dependent and independent variables The independent variable (x) is the one that is chosen freely or occur naturally.
Business Mathematics and Statistics (MATH0203) Chapter 1: Correlation & Regression Dependent and independent variables The independent variable (x) is the one that is chosen freely or occur naturally.
Correlation and Regression
 Correlation and Regression 1 Overview Introduction Scatter Plots Correlation Regression Coefficient of Determination 2 Objectives of the topic 1. Draw a scatter plot for a set of ordered pairs. 2. Compute
6. 5x Division Property. CHAPTER 2 Linear Models, Equations, and Inequalities. Toolbox Exercises. 1. 3x = 6 Division Property
 CHAPTER Linear Models, Equations, and Inequalities CHAPTER Linear Models, Equations, and Inequalities Toolbox Exercises. x = 6 Division Property x 6 = x =. x 7= Addition Property x 7= x 7+ 7= + 7 x = 8.
CORRELATION AND SIMPLE REGRESSION 10.0 OBJECTIVES 10.1 INTRODUCTION
 UNIT 10 CORRELATION AND SIMPLE REGRESSION STRUCTURE 10.0 Objectives 10.1 Introduction 10. Correlation 10..1 Scatter Diagram 10.3 The Correlation Coefficient 10.3.1 Karl Pearson s Correlation Coefficient
Regression Analysis. BUS 735: Business Decision Making and Research
 Regression Analysis BUS 735: Business Decision Making and Research 1 Goals and Agenda Goals of this section Specific goals Learn how to detect relationships between ordinal and categorical variables. Learn
Year 10 Mathematics Semester 2 Bivariate Data Chapter 13
 Year 10 Mathematics Semester 2 Bivariate Data Chapter 13 Why learn this? Observations of two or more variables are often recorded, for example, the heights and weights of individuals. Studying the data
Chapter 10. Correlation and Regression. McGraw-Hill, Bluman, 7th ed., Chapter 10 1
 Chapter 10 Correlation and Regression McGraw-Hill, Bluman, 7th ed., Chapter 10 1 Chapter 10 Overview Introduction 10-1 Scatter Plots and Correlation 10- Regression 10-3 Coefficient of Determination and
Chapter 1 Linear Equations
 . Lines. True. True. If the slope of a line is undefined, the line is vertical. 7. The point-slope form of the equation of a line x, y is with slope m containing the point ( ) y y = m ( x x ). Chapter
Scatterplots and Correlations
 Scatterplots and Correlations Section 4.1 1 New Definitions Explanatory Variable: (independent, x variable): attempts to explain observed outcome. Response Variable: (dependent, y variable): measures outcome
CHAPTER 5 LINEAR REGRESSION AND CORRELATION
 CHAPTER 5 LINEAR REGRESSION AND CORRELATION Expected Outcomes Able to use simple and multiple linear regression analysis, and correlation. Able to conduct hypothesis testing for simple and multiple linear
AP Statistics Unit 2 (Chapters 7-10) Warm-Ups: Part 1
 Warm-Ups: Part 1") AP Statistics Unit 2 (Chapters 7-10) Warm-Ups: Part 1 2. A researcher is interested in determining if one could predict the score on a statistics exam from the amount of time spent studying for the exam.
AP Statistics Unit 2 (Chapters 7-10) Warm-Ups: Part 1 2. A researcher is interested in determining if one could predict the score on a statistics exam from the amount of time spent studying for the exam.
Finding Relationships Among Variables
 Finding Relationships Among Variables BUS 230: Business and Economic Research and Communication 1 Goals Specific goals: Re-familiarize ourselves with basic statistics ideas: sampling distributions, hypothesis
MATH 2070 Test 3 (Sections , , & )
") Multiple Choice: Use a #2 pencil and completely fill in each bubble on your scantron to indicate the answer to each question. Each question has one correct answer. If you indicate more than one answer,
Multiple Choice: Use a #2 pencil and completely fill in each bubble on your scantron to indicate the answer to each question. Each question has one correct answer. If you indicate more than one answer,
Identify the scale of measurement most appropriate for each of the following variables. (Use A = nominal, B = ordinal, C = interval, D = ratio.
 Answers to Items from Problem Set 1 Item 1 Identify the scale of measurement most appropriate for each of the following variables. (Use A = nominal, B = ordinal, C = interval, D = ratio.) a. response latency
Math 1101 Chapter 2 Review Solve the equation. 1) (y - 7) - (y + 2) = 4y A) B) D) C) ) 2 5 x x = 5
 (y - 7) - (y + 2) = 4y A) B) D) C) ) 2 5 x x = 5") Math 1101 Chapter 2 Review Solve the equation. 1) (y - 7) - (y + 2) = 4y A) - 1 2 B) - 9 C) - 9 7 D) - 9 4 2) 2 x - 1 3 x = A) -10 B) 7 C) -7 D) 10 Find the zero of f(x). 3) f(x) = 6x + 12 A) -12 B) -2
Math 1101 Chapter 2 Review Solve the equation. 1) (y - 7) - (y + 2) = 4y A) - 1 2 B) - 9 C) - 9 7 D) - 9 4 2) 2 x - 1 3 x = A) -10 B) 7 C) -7 D) 10 Find the zero of f(x). 3) f(x) = 6x + 12 A) -12 B) -2
Chapter 10. Correlation and Regression. McGraw-Hill, Bluman, 7th ed., Chapter 10 1
 Chapter 10 Correlation and Regression McGraw-Hill, Bluman, 7th ed., Chapter 10 1 Example 10-2: Absences/Final Grades Please enter the data below in L1 and L2. The data appears on page 537 of your textbook.
Mathematics Practice Test 2
 Mathematics Practice Test 2 Complete 50 question practice test The questions in the Mathematics section require you to solve mathematical problems. Most of the questions are presented as word problems.
Practice Questions for Math 131 Exam # 1
 Practice Questions for Math 131 Exam # 1 1) A company produces a product for which the variable cost per unit is $3.50 and fixed cost 1) is $20,000 per year. Next year, the company wants the total cost
Data files for today. CourseEvalua2on2.sav pontokprediktorok.sav Happiness.sav Ca;erplot.sav
 Correlation Data files for today CourseEvalua2on2.sav pontokprediktorok.sav Happiness.sav Ca;erplot.sav Defining Correlation Co-variation or co-relation between two variables These variables change together
Math 082 Final Examination Review
 Math 08 Final Examination Review 1) Write the equation of the line that passes through the points (4, 6) and (0, 3). Write your answer in slope-intercept form. ) Write the equation of the line that passes
Describing Bivariate Data
 Describing Bivariate Data Correlation Linear Regression Assessing the Fit of a Line Nonlinear Relationships & Transformations The Linear Correlation Coefficient, r Recall... Bivariate Data: data that consists
Correlation: Relationships between Variables
 Correlation Correlation: Relationships between Variables So far, nearly all of our discussion of inferential statistics has focused on testing for differences between group means However, researchers are
15. (,4)
") CHAPTER Algebra Toolbox CHAPTER Functions Graphs, and Models; Linear Functions Toolbox Exercises. {,,,,5,6,7,8} and { xx< 9, x N} Remember that x N means that x is a natural number.. (,7]. (,7 ] 5. (,)
CHAPTER Algebra Toolbox CHAPTER Functions Graphs, and Models; Linear Functions Toolbox Exercises. {,,,,5,6,7,8} and { xx< 9, x N} Remember that x N means that x is a natural number.. (,7]. (,7 ] 5. (,)
Association Between Variables Measured at the Interval-Ratio Level: Bivariate Correlation and Regression
 Association Between Variables Measured at the Interval-Ratio Level: Bivariate Correlation and Regression Last couple of classes: Measures of Association: Phi, Cramer s V and Lambda (nominal level of measurement)
Graphing Skill #1: What Type of Graph is it? There are several types of graphs that scientists often use to display data.
 Graphing Skill #1: What Type of Graph is it? There are several types of graphs that scientists often use to display data. They include: Pie Graphs Bar Graphs Histograms Line Graphs Scatter Plots Dependent
OCR Maths S1. Topic Questions from Papers. Bivariate Data
 OCR Maths S1 Topic Questions from Papers Bivariate Data PhysicsAndMathsTutor.com 1 The scatter diagrams below illustrate three sets of bivariate data, A, B and C. State, with an explanation in each case,
Reminder: Student Instructional Rating Surveys
 Reminder: Student Instructional Rating Surveys You have until May 7 th to fill out the student instructional rating surveys at https://sakai.rutgers.edu/portal/site/sirs The survey should be available
SALES AND MARKETING Department MATHEMATICS. 2nd Semester. Bivariate statistics. Tutorials and exercises
 SALES AND MARKETING Department MATHEMATICS 2nd Semester Bivariate statistics Tutorials and exercises Online document: http://jff-dut-tc.weebly.com section DUT Maths S2. IUT de Saint-Etienne Département
Regression Models REVISED TEACHING SUGGESTIONS ALTERNATIVE EXAMPLES
 M04_REND6289_10_IM_C04.QXD 5/7/08 2:49 PM Page 46 4 C H A P T E R Regression Models TEACHING SUGGESTIONS Teaching Suggestion 4.1: Which Is the Independent Variable? We find that students are often confused
MATH 2070 Test 3 (Sections , , & )
") Multiple Choice: Use a #2 pencil and completely fill in each bubble on your scantron to indicate the answer to each question. Each question has one correct answer. If you indicate more than one answer,
Multiple Choice: Use a #2 pencil and completely fill in each bubble on your scantron to indicate the answer to each question. Each question has one correct answer. If you indicate more than one answer,
BOARD QUESTION PAPER : MARCH 2018
 Board Question Paper : March 08 BOARD QUESTION PAPER : MARCH 08 Notes: i. All questions are compulsory. Figures to the right indicate full marks. i Graph paper is necessary for L.P.P iv. Use of logarithmic
LI EAR REGRESSIO A D CORRELATIO
 CHAPTER 6 LI EAR REGRESSIO A D CORRELATIO Page Contents 6.1 Introduction 10 6. Curve Fitting 10 6.3 Fitting a Simple Linear Regression Line 103 6.4 Linear Correlation Analysis 107 6.5 Spearman s Rank Correlation
Upon completion of this chapter, you should be able to:
 1 Chaptter 7:: CORRELATIION Upon completion of this chapter, you should be able to: Explain the concept of relationship between variables Discuss the use of the statistical tests to determine correlation
Solutionbank S1 Edexcel AS and A Level Modular Mathematics
 file://c:\users\buba\kaz\ouba\s1_6_a_1.html Exercise A, Question 1 The following scatter diagrams were drawn. a Describe the type of correlation shown by each scatter diagram. b Interpret each correlation.
Study Unit 2 : Linear functions Chapter 2 : Sections and 2.6
 1 Study Unit 2 : Linear functions Chapter 2 : Sections 2.1 2.4 and 2.6 1. Function Humans = relationships Function = mathematical form of a relationship Temperature and number of ice cream sold Independent
Quadratic function and equations Quadratic function/equations, supply, demand, market equilibrium
 Exercises 8 Quadratic function and equations Quadratic function/equations, supply, demand, market equilibrium Objectives - know and understand the relation between a quadratic function and a quadratic
Regression Analysis. BUS 735: Business Decision Making and Research. Learn how to detect relationships between ordinal and categorical variables.
 Regression Analysis BUS 735: Business Decision Making and Research 1 Goals of this section Specific goals Learn how to detect relationships between ordinal and categorical variables. Learn how to estimate
Chapter 10. Correlation and Regression. Lecture 1 Sections:
 Chapter 10 Correlation and Regression Lecture 1 Sections: 10.1 10. You will now be introduced to important methods for making inferences based on sample data that come in pairs. In the previous chapter,
Chapter 3: Examining Relationships
 Chapter 3 Review Chapter 3: Examining Relationships 1. A study is conducted to determine if one can predict the yield of a crop based on the amount of yearly rainfall. The response variable in this study
Essential Math For Economics
 Essential Math For Economics D I A N N A D A S I L V A - G L A S G O W D E P A R T M E N T O F E C O N O M I C S U N I V E R S I T Y O F G U Y A N A S E P T E M B E R 7, 2 0 1 7 Wk 2 Lecture 1... INTRODUCTION
1.4 CONCEPT QUESTIONS, page 49
 .4 CONCEPT QUESTIONS, page 49. The intersection must lie in the first quadrant because only the parts of the demand and supply curves in the first quadrant are of interest.. a. The breakeven point P0(
8.1 Frequency Distribution, Frequency Polygon, Histogram page 326
 page 35 8 Statistics are around us both seen and in ways that affect our lives without us knowing it. We have seen data organized into charts in magazines, books and newspapers. That s descriptive statistics!
Systems and Matrices CHAPTER 7
 CHAPTER 7 Systems and Matrices 7.1 Solving Systems of Two Equations 7.2 Matrix Algebra 7.3 Multivariate Linear Systems and Row Operations 7.4 Partial Fractions 7.5 Systems of Inequalities in Two Variables
System of Linear Equations. Slide for MA1203 Business Mathematics II Week 1 & 2
 System of Linear Equations Slide for MA1203 Business Mathematics II Week 1 & 2 Function A manufacturer would like to know how his company s profit is related to its production level. How does one quantity
Relationships between variables. Visualizing Bivariate Distributions: Scatter Plots
 SFBS Course Notes Part 7: Correlation Bivariate relationships (p. 1) Linear transformations (p. 3) Pearson r : Measuring a relationship (p. 5) Interpretation of correlations (p. 10) Relationships between
In 1 6, match each scatterplot with the appropriate correlation coefficient. a) +1 b) +0.8 c) +0.3 d) 0 e) -0.6 f) -0.9
 +1 b) +0.8 c) +0.3 d) 0 e) -0.6 f) -0.9") Homework 11.1 In 1 6, match each scatterplot with the appropriate correlation coefficient. a) +1 b) +0.8 c) +0.3 d) 0 e) -0.6 f) -0.9 1. 2. 3. 4. 5. 6. Match each graph with a description of its correlation
Homework 11.1 In 1 6, match each scatterplot with the appropriate correlation coefficient. a) +1 b) +0.8 c) +0.3 d) 0 e) -0.6 f) -0.9 1. 2. 3. 4. 5. 6. Match each graph with a description of its correlation
Class 11 Maths Chapter 15. Statistics
 1 P a g e Class 11 Maths Chapter 15. Statistics Statistics is the Science of collection, organization, presentation, analysis and interpretation of the numerical data. Useful Terms 1. Limit of the Class
Solutionbank S1 Edexcel AS and A Level Modular Mathematics
 Page 1 of 2 Exercise A, Question 1 As part of a statistics project, Gill collected data relating to the length of time, to the nearest minute, spent by shoppers in a supermarket and the amount of money
4 6 Quarter. During which of the following periods is the increase in the number of students with part-time jobs largest?
 1 of 1 9/22/2016 7:59 PM Math: Question 1 Number of students 70 60 50 40 30 20 10 0 0 Number of Students with Part-Time Jobs 2 4 6 8 10 12 14 16 Quarter During which of the following periods is the increase
12 STD BUSINESS MATHEMATICS
 STD BUSINESS MATHEMATICS www.kalvisolai.com 0 MARK FAQ S: CHAPTER :. APPLICATION OF MATRICES AND DETERMINANTS. If A verify that AAdjA AdjA A AI. (M 0). Show that the equations y + z = 7, + y 5z =, + y
UNIVERSITY OF KWA-ZULU NATAL
 UNIVERSITY OF KWA-ZULU NATAL EXAMINATIONS: June 006 Solutions Subject, course and code: Mathematics 34 MATH34P Multiple Choice Answers. B. B 3. E 4. E 5. C 6. A 7. A 8. C 9. A 0. D. C. A 3. D 4. E 5. B
(quantitative or categorical variables) Numerical descriptions of center, variability, position (quantitative variables)
 Numerical descriptions of center, variability, position (quantitative variables)") 3. Descriptive Statistics Describing data with tables and graphs (quantitative or categorical variables) Numerical descriptions of center, variability, position (quantitative variables) Bivariate descriptions
3. Descriptive Statistics Describing data with tables and graphs (quantitative or categorical variables) Numerical descriptions of center, variability, position (quantitative variables) Bivariate descriptions
Copyright 2017 Edmentum - All rights reserved.
 Study Island Copyright 2017 Edmentum - All rights reserved. Generation Date: 11/30/2017 Generated By: Charisa Reggie 1. The Little Shop of Sweets on the Corner sells ice cream, pastries, and hot cocoa.
You are permitted to use your own calculator where it has been stamped as approved by the University.
 ECONOMICS TRIPOS Part I Friday 11 June 004 9 1 Paper 3 Quantitative Methods in Economics This exam comprises four sections. Sections A and B are on Mathematics; Sections C and D are on Statistics. You
8th Grade. Two Variable Data. Slide 1 / 122 Slide 2 / 122. Slide 4 / 122. Slide 3 / 122. Slide 6 / 122. Slide 5 / 122. Data.
 Slide 1 / 122 Slide 2 / 122 8th Grade ata 2015-11-20 www.njctl.org Slide 3 / 122 Slide 4 / 122 Table of ontents click on the topic to go to that section Two Variable ata Line of est Fit etermining the
Midterm 2 - Solutions
 Ecn 102 - Analysis of Economic Data University of California - Davis February 24, 2010 Instructor: John Parman Midterm 2 - Solutions You have until 10:20am to complete this exam. Please remember to put
MATH 2070 Mixed Practice KEY Sections (25) 900(.95 )
 900(.95 )") 1. The demand for board games can be modeled by D( p ) = 9(.9) p thousand games where p is the price in dollars per game. Find the consumers surplus when the market price for the board game is $. per game.
1. The demand for board games can be modeled by D( p ) = 9(.9) p thousand games where p is the price in dollars per game. Find the consumers surplus when the market price for the board game is $. per game.
MA 181 Lecture Chapter 7 College Algebra and Calculus by Larson/Hodgkins Limits and Derivatives
 7.5) Rates of Change: Velocity and Marginals MA 181 Lecture Chapter 7 College Algebra and Calculus by Larson/Hodgkins Limits and Derivatives Previously we learned two primary applications of derivatives.
Biostatistics: Correlations
 Biostatistics: s One of the most common errors we find in the press is the confusion between correlation and causation in scientific and health-related studies. In theory, these are easy to distinguish
Chapter 16: Correlation
 Chapter 16: Correlation Correlations: Measuring and Describing Relationships A correlation is a statistical method used to measure and describe the relationship between two variables. A relationship exists
Name: Class: Date: ID: A
 Name: Class: Date: 8th Grade Advanced Topic III, Linear Equations and Systems of Linear Equations, MA.8.A.1.1, MA.8.1.1.2, MA.8.A.1.3, *MA.8.A.1.4, MA.8.A.1.5, MA.8.A.1.6 Multiple Choice Identify the choice
Estadística I Exercises Chapter 4 Academic year 2015/16
 Estadística I Exercises Chapter 4 Academic year 2015/16 1. An urn contains 15 balls numbered from 2 to 16. One ball is drawn at random and its number is reported. (a) Define the following events by listing
Unit 2. Describing Data: Numerical
 Unit 2 Describing Data: Numerical Describing Data Numerically Describing Data Numerically Central Tendency Arithmetic Mean Median Mode Variation Range Interquartile Range Variance Standard Deviation Coefficient
THE ROYAL STATISTICAL SOCIETY 2008 EXAMINATIONS SOLUTIONS HIGHER CERTIFICATE (MODULAR FORMAT) MODULE 4 LINEAR MODELS
 MODULE 4 LINEAR MODELS") THE ROYAL STATISTICAL SOCIETY 008 EXAMINATIONS SOLUTIONS HIGHER CERTIFICATE (MODULAR FORMAT) MODULE 4 LINEAR MODELS The Society provides these solutions to assist candidates preparing for the examinations
THE ROYAL STATISTICAL SOCIETY 008 EXAMINATIONS SOLUTIONS HIGHER CERTIFICATE (MODULAR FORMAT) MODULE 4 LINEAR MODELS The Society provides these solutions to assist candidates preparing for the examinations
MATH 112 Final Exam, Spring Honor Statement
 NAME: QUIZ Section: STUDENT ID: MATH 112 Final Exam, Spring 2013 Honor Statement I affirm that my work upholds the highest standards of honesty and academic integrity at the University of Washington, and
Bivariate data data from two variables e.g. Maths test results and English test results. Interpolate estimate a value between two known values.
 Key words: Bivariate data data from two variables e.g. Maths test results and English test results Interpolate estimate a value between two known values. Extrapolate find a value by following a pattern
Linear Programming II NOT EXAMINED
 Chapter 9 Linear Programming II NOT EXAMINED 9.1 Graphical solutions for two variable problems In last week s lecture we discussed how to formulate a linear programming problem; this week, we consider
UNIT-IV CORRELATION AND REGRESSION
 Correlation coefficient: UNIT-IV CORRELATION AND REGRESSION The quantity r, called the linear correlation coefficient, measures the strength and the direction of a linear relationship between two variables.
Examining Relationships. Chapter 3
 Examining Relationships Chapter 3 Scatterplots A scatterplot shows the relationship between two quantitative variables measured on the same individuals. The explanatory variable, if there is one, is graphed
MAT 121: Mathematics for Business and Information Science Final Exam Review Packet
 MAT 121: Mathematics for Business and Information Science Final Exam Review Packet A. Calculate the exact distance (i.e., simplified radicals where appropriate, not decimal approximations using a calculator)
Ch 13 & 14 - Regression Analysis
 Ch 3 & 4 - Regression Analysis Simple Regression Model I. Multiple Choice:. A simple regression is a regression model that contains a. only one independent variable b. only one dependent variable c. more
Doug Clark The Learning Center 100 Student Success Center learningcenter.missouri.edu Overview
 Math 1400 Final Exam Review Saturday, December 9 in Ellis Auditorium 1:00 PM 3:00 PM, Saturday, December 9 Part 1: Derivatives and Applications of Derivatives 3:30 PM 5:30 PM, Saturday, December 9 Part
Solutionbank S1 Edexcel AS and A Level Modular Mathematics
 Mathematical models in probability and statistics Exercise A, Question 1 Give one advantage and one disadvantage of using a mathematical model. Mathematical models are quicker and cheaper to produce. But
Introduction to Systems of Equations
 Systems of Equations 1 Introduction to Systems of Equations Remember, we are finding a point of intersection x 2y 5 2x y 4 1. A golfer scored only 4 s and 5 s in a round of 18 holes. His score was 80.
Measures of Central Tendency. For Ungrouped Data
 Measures of Central Tendency For Ungrouped Data Recall: What are the three ways on how we can define central tendency or center of the distribution? We can also say: (1) the point on which a distribution
Partial derivatives, linear approximation and optimization
 ams 11b Study Guide 4 econ 11b Partial derivatives, linear approximation and optimization 1. Find the indicated partial derivatives of the functions below. a. z = 3x 2 + 4xy 5y 2 4x + 7y 2, z x = 6x +
Chapter (7) Continuous Probability Distributions Examples Normal probability distribution
 Continuous Probability Distributions Examples Normal probability distribution") Chapter (7) Continuous robability Distributions Examples Normal probability distribution Example () How to find the area under the normal curve? If 50 Find & 6 60.8 50 X 60.8 6 0.8 p 6 0.5 0.464 0.964.8
Chapter (7) Continuous robability Distributions Examples Normal probability distribution Example () How to find the area under the normal curve? If 50 Find & 6 60.8 50 X 60.8 6 0.8 p 6 0.5 0.464 0.964.8
Correlation measures the strength of the relationship between 2 variables.
 Correlation measures the strength of the relationship between 2 variables. Types of Correla-ons Positive: 2 or more variables move in the same direction Negative: 2 variables move in opposite directions
Chapter 3 The Integral Business Calculus 197
 Chapter The Integral Business Calculus 97 Chapter Exercises. Let A(x) represent the area bounded by the graph and the horizontal axis and vertical lines at t=0 and t=x for the graph in Fig.. Evaluate A(x)
***** Sorry - Solutions will not be posted *****
 ***** Sorry - Solutions will not be posted ***** FINAL EXAMINATION MATA32 - Calculus for Management I Examiners: R. Grinnell E. Moore Date: December 11, 2007 X. Jiang T. Pham Duration: 3 hours Provide
Ohio s State Tests ITEM RELEASE SPRING 2016 GRADE 8 MATHEMATICS
 Ohio s State Tests ITEM RELEASE SPRING 2016 GRADE 8 MATHEMATICS Table of Contents Questions 1 15: Content Summary and Answer Key... ii Question 1: Question and Scoring Guidelines...1 Question 1: Sample
Pre-Leaving Certificate Examination, 2017 Triailscrúdú na hardteistiméireachta, Mathematics. Paper 1. Higher Level. 2½ hours.
 *P6* Pre-Leaving Certificate Examination, 2017 Triailscrúdú na hardteistiméireachta, 2017 Mathematics Paper 1 Higher Level 2½ hours 300 marks Name: School: Address: Class: Teacher: For examiner Question
Math 142 (Summer 2018) Business Calculus 5.8 Notes
 Business Calculus 5.8 Notes") Math 142 (Summer 2018) Business Calculus 5.8 Notes Implicit Differentiation and Related Rates Why? We have learned how to take derivatives of functions, and we have seen many applications of this. However
Math 142 (Summer 2018) Business Calculus 5.8 Notes Implicit Differentiation and Related Rates Why? We have learned how to take derivatives of functions, and we have seen many applications of this. However
SECTION 5.1: Polynomials
 1 SECTION 5.1: Polynomials Functions Definitions: Function, Independent Variable, Dependent Variable, Domain, and Range A function is a rule that assigns to each input value x exactly output value y =
Interpreting Correlation & Examining Cause and Effect
 LESSON 15 Interpreting Correlation & Examining Cause and Effect LEARNING OBJECTIVES Today I am: exploring linear relationships between data sets. So that I can: determine if the r-value will be closer
Measuring Associations : Pearson s correlation
 Measuring Associations : Pearson s correlation Scatter Diagram A scatter diagram is a graph that shows that the relationship between two variables measured on the same individual. Each individual in the
A LEVEL MATHEMATICS QUESTIONBANKS REGRESSION AND CORRELATION. 1. Sketch scatter diagrams with at least 5 points to illustrate the following:
 1. Sketch scatter diagrams with at least 5 points to illustrate the following: a) Data with a product moment correlation coefficient of 1 b) Data with a rank correlation coefficient of 1, but product moment
SALES AND MARKETING Department MATHEMATICS. 2nd Semester. Bivariate statistics. SOLUTIONS of tutorials and exercises
 SALES AND MARKETING Department MATHEMATICS 2nd Semester Bivariate statistics SOLUTIONS of tutorials and exercises Online document: http://jff-dut-tc.weebly.com section DUT Maths S2. IUT de Saint-Etienne
The questions listed below are drawn from midterm and final exams from the last few years at OSU. As the text book and structure of the class have
 The questions listed below are drawn from midterm and final eams from the last few years at OSU. As the tet book and structure of the class have recently changed, it made more sense to list the questions