Essential Math For Economics
|
|
|
- Randolf Carson
- 5 years ago
- Views:
Transcription
1 Essential Math For Economics D I A N N A D A S I L V A - G L A S G O W D E P A R T M E N T O F E C O N O M I C S U N I V E R S I T Y O F G U Y A N A S E P T E M B E R 7,
2 Wk 2 Lecture 1... INTRODUCTION TO GRAPHS
3 GRAPHS AND THEIR MEANING Graphs are extensively used in economics for modeling A graph is a visual representation of the relationship between two variables.
4
5 Types of variables We can distinguish between two types of variables 1. Dependent and 2. Independent This is a Means Of Differentiating Which Variable is the Cause And Which Is The Effect.
6 The DEPENDENT VARIABLE THE DEPENDENT VARIABLE IS THE EFFECT OR OUTCOME; IT IS THE VARIABLE THAT CHANGES BECAUSE OF CHANGES IN THE INDEPENDENT VARIABLE.
7 The independent variable THE INDEPENDENT VARIABLE IS THE CAUSE OR SOURCE; IT IS THE VARIABLE THAT CHANGES FIRST.
8 Quick Quiz Identify the dependent and the independent variables below: A painter must measure a room before deciding how much paint to buy. The height of a candle decrease d centimeters for every hour it burns. A veterinarian must weight an animal before determining the amount of medication. A company charges $10 per hour to rent a jackhammer. Camryn buys p pounds of apples at $0.99 per pound. Grade Point Average and Time Spent Studying
9 Quick Quiz A painter must measure a room before deciding how much paint to buy. Dependent: amount of paint Independent: measurement of the room The height of a candle decrease d centimeters for every hour it burns. A veterinarian must weight an animal before determining the amount of medication. Dependent: height of candle Independent: time Dependent: amount of medication Independent: weight of animal
10 Quick Quiz A company charges $10 per hour to rent a jackhammer. Camryn buys p pounds of apples at $0.99 per pound. Dependent variable: cost Independent variable: time Grade Point Average and Time Spent Studying Dependent variable: cost Independent variable: pounds Dependent variable: GPA Independent variable: Time
11 Graphing variables On a Graph how do we reflect independent and dependent variables Cause is plotted on the X-axis Effect is plotted on the Y-axis All Rights Reserved DR. DAVID P ECHEVARRIA 11
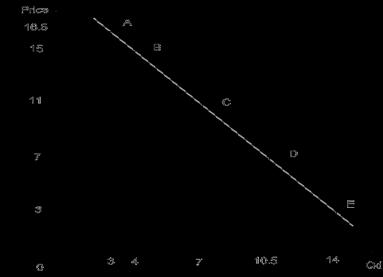
12 Example 1
13 Types of Relationships Among variables CORRELATION A POSITIVE RELATIONSHIP A NEGATIVE RELATIONSHIP
14 Positive relationship A POSITIVE RELATIONSHIP IS ONE WHERE THE TWO VARIABLES CHANGE IN THE SAME DIRECTION. THAT IS WHEN ONE INCREASE THE OTHER ALSO INCREASES OR WHEN ONE DECREASES THE OTHER ALSO DECREASES. THE CURVE FOR SUCH A GRAPH IS UPWARD SLOPING, E.G. CONSUMPTION AND INCOME.
15 Positive Correlation As one variable increases, so does the other. y x
16
17 Example of positive correlation The longer you exercise, the more calories you burn. *As exercise increases, calories burned increases Can you think of one?
18 Negative relationship A NEGATIVE RELATIONSHIP IS ONE WHERE THE TWO VARIABLES CHANGE IN THE OPPOSITE DIRECTION. THAT IS WHEN ONE INCREASE THE OTHER DECREASES OR WHEN ONE DECREASES THE OTHER INCREASES. IN THIS CASE WE SAY THAT THE RELATIONSHIP IS INVERSE E.G. PRICE AND QUANTITY DEMANDED. THE CURVE FOR SUCH A GRAPH IS DOWNWARD SLOPING, E.G. CONSUMPTION AND INCOME.
19 Negative Correlation: As one variable increases, the other decreases. y x
20
21 Example of negative correlation The longer the air conditioner is turned on, the colder the temperature. *As time increases, the temperature decreases Can you think of one?
22 No Correlation: As one variable increases, you cannot tell what the other is doing. y x
23 Example of no correlation The number of students in the classroom and the average height. *As the number of students increases, you cannot tell what the average height will do. Can you think of one?
24 Correlation Coefficient A statistic that quantifies a relation between two variables Can be either positive or negative Falls between and 1.00 The value of the number (not the sign) indicates the strength of the relation The sign indicates the direction of the impact, whether positive or negative

25
26 Check Your Learning Which is stronger? A correlation of 0.25 or -0.74?
27 Misleading Correlations Something to think about There is a 0.91 correlation between ice cream consumption and drowning deaths. Does eating ice cream cause drowning? Does grief cause us to eat more ice cream?
28 The Limitations of Correlation Correlation is not causation. Invisible third variables Three Possible Causal Explanations for a Correlation
29 The Pearson Correlation Coefficient A statistic that quantifies a linear relation between two scale variables. Symbolized by the italic letter r when it is a statistic based on sample data. Symbolized by the italic letter p rho when it is a population parameter.
30 Pearson correlation coefficient r Linear relationship [( X M )( Y M r X ( SS )( SS ) X Y Y )]
31 Linear vs non-linear effects
32
33 Slopes Lines can be described in terms of their slopes (gradient). The slope of a straight line is the ratio of change in the dependent variable to changes in the independent variable. This tells us how steep a straight line is. Slopes can be positive or negative and depict the underpinning relationship between the two variables.
34 The gradient or gradient of a line is a number that tells us how steep the line is and which direction it goes. If you move along the line from left to right and are climbing, it is a positive gradient. This one has the greatest gradient These are all positive gradients. The steeper the line, the larger the gradient value.
35 rise We could compute the run by looking at the difference between the x values. We compute the gradient by taking the ratio of how much the line rises (goes up) and how much the line runs (goes over) run (x 2, y 2 ) (x 1, y 1 ) y 2 - y 1 If we took two points on the line, we could compute the rise by looking at the difference between the y values. x 2 - x 1 So the gradient or gradient is the rise over the run m risey ( 2y 2 m runx ( x 2 2 y 1y x x ) ) This is the gradient formula gradient is designated with an m
36 Let s figure out the gradient of this line. We know it should be a positive number. 2 y x 1 (1, 2) (0, 0) (2, 4) Choose two points on the line. The rise over the run is 2 over 1 which is 2. Let s compute it with the gradient formula. (-2, -4) What if we'd chosen two different points on the line? m It doesn't matter which two points we pick, we'll always get a constant ratio of 2 for this line.
37 If we look at any points on this line we see that they all have a y coordinate of 3 and the x coordinate varies. y (-4, 3) (-1, 3) (2, 3) x Let's choose the points (-4, 3) and (2, 3) and compute the gradient. m This makes sense because as you go from left to right on the line, you are not rising or falling (so zero gradient) The equation of this line is y = 3 since y is 3 everywhere along the line. In general, the equation of a horizontal line is y = b, where b is the y coordinate of any point on the line.
38 Analysis Infinite and zero slopes 0 slopes show no relationship among variables. For instance, consumption is completely unrelated to the divorce rate. The line parallel to the horizontal axis represents this lack of relationship. C o n s u m p t i o n Divorce Rate Slope = 0
39 If we look at any points on this line we see that they all have a x coordinate of - 2 and the y coordinate varies. (-2, 3) y Let's choose the points (-2, 3) and (-2, - 2) and compute the gradient. (-2, 0) x (-2, -2) m undefined(or infinite) Dividing by 0 is undefined so we say the gradient is undefined. You can't go from left to right on the line since there isn't a left and right. The equation of this line is x = - 2 since x is - 2 everywhere along the line. In general, the equation of a vertical line is x = a, where a is the x coordinate of any point on the line.
40 Analysis Price Of infinite slope Bananas Quantity of computers THE GRAPH OF THIS RELATIONSHIP IS A LINE PARALLEL TO THE VERTICAL AXIS INDICATING THAT THE SAME QUANTITY OF COMPUTER IS PURCHASED NO MATTER WHAT THE PRICE OF BANANAS IS. THE SLOPE OF SUCH LINE IS INFINITE. SIMILARLY, CONSUMPTION IS COMPLETELY UNRELATED TO THE DIVORCE RATE.
41 zero gradient (or no gradient) It is easy to remember 0 gradient because the line does not slope at all (it is horizontal) undefined gradient It is easy to remember undefined gradient because you can t move along from left to right (it is vertical)
42 Slopes and Marginal Analysis ECONOMICS IS LARGELY CONCERNED WITH CHANGES FROM THE STATUS QUO. THE CONCEPT OF SLOPE IS IMPORTANT IN ECONOMICS BECAUSE IT REFLECTS MARGINAL CHANGES- THOSE INVOLVE 1 MORE (OR LESS) UNIT- BETWEEN TWO VARIABLES.
43 Quick Quiz If THE VARIABLES ARE PRICE AND QUANTITY DEMANDED AND THE SLOPE IS -5, WHAT IS THE MEANING OF THIS SLOPE?
44 The vertical Intercept Intercept: The value of Y when X = zero. The intercept of a line is the point where the line meets the vertical axis.
3-3 Writing Functions
 Example 1: Using a Table to Write an Equation Determine a relationship between the x- and y-values. Write an equation. x y 5 10 15 20 1 2 3 4 Step 1 List possible relationships between the first x or y-values.
1 Numbers, Sets, Algebraic Expressions
 AAU - Business Mathematics I Lecture #1, February 27, 2010 1 Numbers, Sets, Algebraic Expressions 1.1 Constants, Variables, and Sets A constant is something that does not change, over time or otherwise:
Chapter 4 - Writing Linear Functions
 Chapter 4 - Writing Linear Functions Write an equation of the line with the given slope and y-intercept. 1. slope: 3 y-intercept: 6 a. y = 6x + 3 c. y = 6x 3 b. y = 3m + 6 d. y = 3x 6 2. D REF: Algebra
Business Statistics. Lecture 10: Correlation and Linear Regression
 Business Statistics Lecture 10: Correlation and Linear Regression Scatterplot A scatterplot shows the relationship between two quantitative variables measured on the same individuals. It displays the Form
Algebra 1 Topic 4: Relations & Functions
 Algebra 1 Topic 4: Relations & Functions Miami Traffic Which graph could show a car sitting at a stoplight? How do you know? Table of Contents 1. Using Graphs to Relate Quantities 2. Patterns and Linear
Lesson four. Linear Depreciation 29. Terminal Objective. Lesson 4. Students will solve depreciation word problems by writing linear equations.
 esson four Terminal Objective Students will solve depreciation word problems by writing linear equations. Content Standard Reference: Algebra 5: Students solve multi-step problems, including word problems,
Math M111: Lecture Notes For Chapter 3
 Section 3.1: Math M111: Lecture Notes For Chapter 3 Note: Make sure you already printed the graphing papers Plotting Points, Quadrant s signs, x-intercepts and y-intercepts Example 1: Plot the following
Study Guide: Systems of Linear Equations
 Study Guide: Systems of Linear Equations Systems of Linear Equations A system of linear equations is when two or more linear equations are involved in the same problem. The solution for a system of linear
MATHS TEACHING RESOURCES. For teachers of high-achieving students in KS2. 2 Linear Equations
 MATHS TEACHING RESOURCES For teachers of high-achieving students in KS Linear Equations Welcome These resources have been put together with you, the primary teacher, at the forefront of our thinking. At
ALGEBRA. COPYRIGHT 1996 Mark Twain Media, Inc. ISBN Printing No EB
 ALGEBRA By Don Blattner and Myrl Shireman COPYRIGHT 1996 Mark Twain Media, Inc. ISBN 978-1-58037-826-0 Printing No. 1874-EB Mark Twain Media, Inc., Publishers Distributed by Carson-Dellosa Publishing Company,
2.4 Slope and Rate of Change
 2.4 Slope and Rate of Change Learning Objectives Find positive and negative slopes. Recognize and find slopes for horizontal and vertical lines. Understand rates of change. Interpret graphs and compare
Study Unit 2 : Linear functions Chapter 2 : Sections and 2.6
 1 Study Unit 2 : Linear functions Chapter 2 : Sections 2.1 2.4 and 2.6 1. Function Humans = relationships Function = mathematical form of a relationship Temperature and number of ice cream sold Independent
MATH 1070 Introductory Statistics Lecture notes Relationships: Correlation and Simple Regression
 MATH 1070 Introductory Statistics Lecture notes Relationships: Correlation and Simple Regression Objectives: 1. Learn the concepts of independent and dependent variables 2. Learn the concept of a scatterplot
Chapter 6. Functions. 01/2017 LSowatsky 1
 Chapter 6 Functions 01/2017 LSowatsky 1 6.1A Constant Rate of Change I can Identify proportional and nonproportional linear relationships by finding a constant rate of change CCSS 8.EE.5, 8.F.4 LSowatsky
Algebra 1. Standard Linear Functions. Categories Graphs Tables Equations Context. Summative Assessment Date: Friday, September 14 th.
 Algebra 1 Standard Linear Functions Categories Graphs Tables Equations Contet Summative Assessment Date: Friday, September 14 th Page 1 Page 2 Page 3 Linear Functions DAY 1 Notesheet Topic Increasing and
('')''* = 1- $302. It is common to include parentheses around negative numbers when they appear after an operation symbol.
''* = 1- $302. It is common to include parentheses around negative numbers when they appear after an operation symbol.") 2.2 ADDING INTEGERS Adding Integers with the Same Sign We often associate the + and - symbols with positive and negative situations. We can find the sum of integers by considering the outcome of these
2.2 ADDING INTEGERS Adding Integers with the Same Sign We often associate the + and - symbols with positive and negative situations. We can find the sum of integers by considering the outcome of these
Final Exam - Solutions
 Ecn 102 - Analysis of Economic Data University of California - Davis March 17, 2010 Instructor: John Parman Final Exam - Solutions You have until 12:30pm to complete this exam. Please remember to put your
Reteaching Using Deductive and Inductive Reasoning
 Name Date Class Reteaching Using Deductive and Inductive Reasoning INV There are two types of basic reasoning in mathematics: deductive reasoning and inductive reasoning. Deductive reasoning bases a conclusion
ABE Math Review Package
 P a g e ABE Math Review Package This material is intended as a review of skills you once learned and wish to review before your assessment. Before studying Algebra, you should be familiar with all of the
Sect 2.4 Linear Functions
 36 Sect 2.4 Linear Functions Objective 1: Graphing Linear Functions Definition A linear function is a function in the form y = f(x) = mx + b where m and b are real numbers. If m 0, then the domain and
6-1 Slope. Objectives 1. find the slope of a line 2. use rate of change to solve problems
 6-1 Slope Objectives 1. find the slope of a line 2. use rate of change to solve problems What is the meaning of this sign? 1. Icy Road Ahead 2. Steep Road Ahead 3. Curvy Road Ahead 4. Trucks Entering Highway
Evaluate and Simplify Algebraic Expressions
 TEKS 1.2 a.1, a.2, 2A.2.A, A.4.B Evaluate and Simplify Algebraic Expressions Before You studied properties of real numbers. Now You will evaluate and simplify expressions involving real numbers. Why? So
CHAPTER FIVE. g(t) = t, h(n) = n, v(z) = z, w(c) = c, u(k) = ( 0.003)k,
 = t, h(n) = n, v(z) = z, w(c) = c, u(k) = ( 0.003)k,") CHAPTER FIVE 5.1 SOLUTIONS 121 Solutions for Section 5.1 EXERCISES 1. Since the distance is decreasing, the rate of change is negative. The initial value of D is 1000 and it decreases by 50 each day, so
CHAPTER FIVE 5.1 SOLUTIONS 121 Solutions for Section 5.1 EXERCISES 1. Since the distance is decreasing, the rate of change is negative. The initial value of D is 1000 and it decreases by 50 each day, so
Linear Equations in Medical Professions, Chemistry, Geography, Economics, Psychology, Physics and Everyday Life REVISED: MICHAEL LOLKUS 2018
 Linear Equations in Medical Professions, Chemistry, Geography, Economics, Psychology, Physics and Everyday Life REVISED: MICHAEL LOLKUS 2018 Linear Equations Linear Equation Basics What is a linear equation?
Relationships between variables. Visualizing Bivariate Distributions: Scatter Plots
 SFBS Course Notes Part 7: Correlation Bivariate relationships (p. 1) Linear transformations (p. 3) Pearson r : Measuring a relationship (p. 5) Interpretation of correlations (p. 10) Relationships between
EconS 301. Math Review. Math Concepts
 EconS 301 Math Review Math Concepts Functions: Functions describe the relationship between input variables and outputs y f x where x is some input and y is some output. Example: x could number of Bananas
Year 10 Mathematics Semester 2 Bivariate Data Chapter 13
 Year 10 Mathematics Semester 2 Bivariate Data Chapter 13 Why learn this? Observations of two or more variables are often recorded, for example, the heights and weights of individuals. Studying the data
Guide to Maths for Scientists
 Contents 1. Statistical graphs, charts and tables: data, bar charts, frequency tables and diagrams, pie charts, histograms 3 1.1 Data 4 1.2 Bar charts 4 1.3 Frequency table 7 1.4 Frequency diagram 8 1.5
Thou Shalt Not Distribute Powers or Radicals. Copyright c 2010 Jason Underdown Some rights reserved. Thou Shalt Not Split a Denominator
 Copyright & License Review Copyright c 2010 Jason Underdown Some rights reserved. Thou Shalt Not Distribute Powers or Radicals Review Review Thou Shalt Not Split a Denominator Thou Shalt Not Cancel Terms
BIOSTATISTICS NURS 3324
 Simple Linear Regression and Correlation Introduction Previously, our attention has been focused on one variable which we designated by x. Frequently, it is desirable to learn something about the relationship
4 The Cartesian Coordinate System- Pictures of Equations
 4 The Cartesian Coordinate System- Pictures of Equations Concepts: The Cartesian Coordinate System Graphs of Equations in Two Variables x-intercepts and y-intercepts Distance in Two Dimensions and the
Solving and Graphing a Linear Inequality of a Single Variable
 Chapter 3 Graphing Fundamentals Section 3.1 Solving and Graphing a Linear Inequality of a Single Variable TERMINOLOGY 3.1 Previously Used: Isolate a Variable Simplifying Expressions Prerequisite Terms:
MATH150-E01 Test #2 Summer 2016 Show all work. Name 1. Find an equation in slope-intercept form for the line through (4, 2) and (1, 3).
 and (1, 3).") 1. Find an equation in slope-intercept form for the line through (4, 2) and (1, 3). 2. Let the supply and demand functions for sugar be given by p = S(q) = 1.4q 0.6 and p = D(q) = 2q + 3.2 where p is the
1. Find an equation in slope-intercept form for the line through (4, 2) and (1, 3). 2. Let the supply and demand functions for sugar be given by p = S(q) = 1.4q 0.6 and p = D(q) = 2q + 3.2 where p is the
Name: Class: Date: ID: A
 Name: Class: Date: ID: A 6A Short Answer Solve the equation. 1.!5d! 24 =!4(d + 6)! d Write the inequality for the graph. 2. 3. 4. 5. Solve the inequality. 6. p + 7
Lecture 4 Scatterplots, Association, and Correlation
 Lecture 4 Scatterplots, Association, and Correlation Previously, we looked at Single variables on their own One or more categorical variable In this lecture: We shall look at two quantitative variables.
Table of contents. Jakayla Robbins & Beth Kelly (UK) Precalculus Notes Fall / 53
 Precalculus Notes Fall / 53") Table of contents The Cartesian Coordinate System - Pictures of Equations Your Personal Review Graphs of Equations with Two Variables Distance Equations of Circles Midpoints Quantifying the Steepness of
Table of contents The Cartesian Coordinate System - Pictures of Equations Your Personal Review Graphs of Equations with Two Variables Distance Equations of Circles Midpoints Quantifying the Steepness of
Lecture 4 Scatterplots, Association, and Correlation
 Lecture 4 Scatterplots, Association, and Correlation Previously, we looked at Single variables on their own One or more categorical variables In this lecture: We shall look at two quantitative variables.
Section 5.3: Linear Inequalities
 336 Section 5.3: Linear Inequalities In the first section, we looked at a company that produces a basic and premium version of its product, and we determined how many of each item they should produce fully
ALGEBRA 1 SEMESTER 1 INSTRUCTIONAL MATERIALS Courses: Algebra 1 S1 (#2201) and Foundations in Algebra 1 S1 (#7769)
 and Foundations in Algebra 1 S1 (#7769)") Multiple Choice: Identify the choice that best completes the statement or answers the question. 1. Ramal goes to the grocery store and buys pounds of apples and pounds of bananas. Apples cost dollars per
Multiple Choice: Identify the choice that best completes the statement or answers the question. 1. Ramal goes to the grocery store and buys pounds of apples and pounds of bananas. Apples cost dollars per
Chapter 2.1 Relations and Functions
 Analyze and graph relations. Find functional values. Chapter 2.1 Relations and Functions We are familiar with a number line. A number line enables us to locate points, denoted by numbers, and find distances
The letter m is used to denote the slope and we say that m = rise run = change in y change in x = 5 7. change in y change in x = 4 6 =
 Section 4 3: Slope Introduction We use the term Slope to describe how steep a line is as ou move between an two points on the line. The slope or steepness is a ratio of the vertical change in (rise) compared
Essential Question How can you solve a system of linear equations? $15 per night. Cost, C (in dollars) $75 per Number of. Revenue, R (in dollars)
 $75 per Number of. Revenue, R (in dollars)") 5.1 Solving Sstems of Linear Equations b Graphing Essential Question How can ou solve a sstem of linear equations? Writing a Sstem of Linear Equations Work with a partner. Your famil opens a bed-and-breakfast.
5.1 Solving Sstems of Linear Equations b Graphing Essential Question How can ou solve a sstem of linear equations? Writing a Sstem of Linear Equations Work with a partner. Your famil opens a bed-and-breakfast.
Warm Up. Unit #1: Basics of Algebra
 1) Write an equation of the given points ( 3, 4) & (5, 6) Warm Up 2) Which of the following choices is the Associative Property 1) 4(x + 2) = 4x + 8 2) 4 + 5 = 5 + 4 3) 5 + ( 5) = 0 4) 4 + (3 + 1) = (4
Block 3. Introduction to Regression Analysis
 Block 3 Introduction to Regression Analysis Block 3 Introduction to Regression Analysis Overview Introduction In this block, we will discuss: The equation of a straight line. Linear Regression Variation
Analyzing Lines of Fit
 4.5 Analyzing Lines of Fit Essential Question How can you analytically find a line of best fit for a scatter plot? Finding a Line of Best Fit Work with a partner. The scatter plot shows the median ages
CORRELATION ANALYSIS. Dr. Anulawathie Menike Dept. of Economics
 CORRELATION ANALYSIS Dr. Anulawathie Menike Dept. of Economics 1 What is Correlation The correlation is one of the most common and most useful statistics. It is a term used to describe the relationship
Chapter 19 Sir Migo Mendoza
 The Linear Regression Chapter 19 Sir Migo Mendoza Linear Regression and the Line of Best Fit Lesson 19.1 Sir Migo Mendoza Question: Once we have a Linear Relationship, what can we do with it? Something
Chapter 11. Correlation and Regression
 Chapter 11. Correlation and Regression The word correlation is used in everyday life to denote some form of association. We might say that we have noticed a correlation between foggy days and attacks of
2. In Exercise 1, suppose the two pricing plans changed as follows. Complete parts (a) (d) based on these two plans.
 (d) based on these two plans.") A C E Applications Connections Extensions Applications 1. A school is planning a Saturday Back-to-School Festival to raise funds for the school art and music programs. Some of the planned activities are
A C E Applications Connections Extensions Applications 1. A school is planning a Saturday Back-to-School Festival to raise funds for the school art and music programs. Some of the planned activities are
Linear Equations and Inequalities
 Unit 2 Linear Equations and Inequalities 9/26/2016 10/21/2016 Name: By the end of this unit, you will be able to Use rate of change to solve problems Find the slope of a line Model real-world data with
8/28/2017. Both examine linear (straight line) relationships Correlation works with a pair of scores One score on each of two variables (X and Y)
 relationships Correlation works with a pair of scores One score on each of two variables (X and Y)") PS 5101: Advanced Statistics for Psychological and Behavioral Research 1 Both examine linear (straight line) relationships Correlation works with a pair of scores One score on each of two variables ( and
PS 5101: Advanced Statistics for Psychological and Behavioral Research 1 Both examine linear (straight line) relationships Correlation works with a pair of scores One score on each of two variables ( and
Lecture 12. Functional form
 Lecture 12. Functional form Multiple linear regression model β1 + β2 2 + L+ β K K + u Interpretation of regression coefficient k Change in if k is changed by 1 unit and the other variables are held constant.
Rate of Change and slope. Objective: To find rates of change from tables. To find slope.
 Linear Functions Rate of Change and slope Objective: To find rates of change from tables. To find slope. Objectives I can find the rate of change using a table. I can find the slope of an equation using
Economic Principles II : Math Memo
 Economic Principles II : Math Memo Prof. Séverine Toussaert - Section 2.002 July 8, 2013 Computing a Rate of Change Suppose we wanted to know by how much a variable increased relative to some reference
AP Statistics. Chapter 6 Scatterplots, Association, and Correlation
 AP Statistics Chapter 6 Scatterplots, Association, and Correlation Objectives: Scatterplots Association Outliers Response Variable Explanatory Variable Correlation Correlation Coefficient Lurking Variables
8th Grade. Two Variable Data. Slide 1 / 122 Slide 2 / 122. Slide 4 / 122. Slide 3 / 122. Slide 6 / 122. Slide 5 / 122. Data.
 Slide 1 / 122 Slide 2 / 122 8th Grade ata 2015-11-20 www.njctl.org Slide 3 / 122 Slide 4 / 122 Table of ontents click on the topic to go to that section Two Variable ata Line of est Fit etermining the
Create your own system of equations: 1. Prove (2, 5) is a solution for the following system: 2. Is (-2, 0) a solution for the following system?
 is a solution for the following system: 2. Is (-2, 0) a solution for the following system?") 5.1 Explain Solving Systems of Linear Equations by Graphing - Notes Main Ideas/ Questions What You Will Learn What is a system of linear equations? Essential Question: How can you solve a system of linear
5.1 Explain Solving Systems of Linear Equations by Graphing - Notes Main Ideas/ Questions What You Will Learn What is a system of linear equations? Essential Question: How can you solve a system of linear
AP Statistics Unit 6 Note Packet Linear Regression. Scatterplots and Correlation
 Scatterplots and Correlation Name Hr A scatterplot shows the relationship between two quantitative variables measured on the same individuals. variable (y) measures an outcome of a study variable (x) may
Graphing Systems of Linear Equations
 Graphing Systems of Linear Equations Groups of equations, called systems, serve as a model for a wide variety of applications in science and business. In these notes, we will be concerned only with groups
Focusing on Linear Functions and Linear Equations
 Focusing on Linear Functions and Linear Equations In grade, students learn how to analyze and represent linear functions and solve linear equations and systems of linear equations. They learn how to represent
Any student who registers as a new attendee of Teaneck High School after August 15 th will have an extra week to complete the summer assignment.
 Dear Parents and Students: All students entering Algebra I or Algebra I Honors in September are required to complete this assignment. This assignment is comprised of two components: a review of essential
Summit Public Schools. Summit, New Jersey. Grade Level 8/ Content Area: Mathematics. Length of Course: Full Academic Year
 Summit Public Schools Summit, New Jersey Grade Level 8/ Content Area: Mathematics Length of Course: Full Academic Year Curriculum: Foundations of Algebra Developed by: Colin Breivogel 207 Course Description:
Graphing Skill #1: What Type of Graph is it? There are several types of graphs that scientists often use to display data.
 Graphing Skill #1: What Type of Graph is it? There are several types of graphs that scientists often use to display data. They include: Pie Graphs Bar Graphs Histograms Line Graphs Scatter Plots Dependent
Average Rate of Change & Slope of a Line MATH 092
 Average Rate of Change Average Rate of Change & Slope of a Line MATH 092 Functions are used to model the way one quantity changes with respect to another quantity. For instance, how does the distance traveled
Differentiation. 1. What is a Derivative? CHAPTER 5
 CHAPTER 5 Differentiation Differentiation is a technique that enables us to find out how a function changes when its argument changes It is an essential tool in economics If you have done A-level maths,
Quadratic function and equations Quadratic function/equations, supply, demand, market equilibrium
 Exercises 8 Quadratic function and equations Quadratic function/equations, supply, demand, market equilibrium Objectives - know and understand the relation between a quadratic function and a quadratic
Helping Students Understand Algebra
 Helping Students Understand Algebra By Barbara Sandall, Ed.D., and Mary Swarthout, Ph.D. COPYRIGHT 2005 Mark Twain Media, Inc. ISBN 10-digit: 1-58037-293-7 13-digit: 978-1-58037-293-0 Printing No. CD-404020
Mathematics Level D: Lesson 2 Representations of a Line
 Mathematics Level D: Lesson 2 Representations of a Line Targeted Student Outcomes Students graph a line specified by a linear function. Students graph a line specified by an initial value and rate of change
Student: We have to buy a new access code? I'm afraid you have to buy a new one. Talk to the bookstore about that.
 Physics 1-21-09 Wednesday Daily Homework Statistics 118 Responses Mean: 0.944 Median: 0.96 Do we want to turn the front lights off? This okay? A friend of mine used to visit a psychology class back in
Anna D Aloise May 2, 2017 INTD 302: Final Project. Demonstrate an Understanding of the Fundamental Concepts of Calculus
 Anna D Aloise May 2, 2017 INTD 302: Final Project Demonstrate an Understanding of the Fundamental Concepts of Calculus Analyzing the concept of limit numerically, algebraically, graphically, and in writing.
AP Calculus Worksheet: Chapter 2 Review Part I
 AP Calculus Worksheet: Chapter 2 Review Part I 1. Given y = f(x), what is the average rate of change of f on the interval [a, b]? What is the graphical interpretation of your answer? 2. The derivative
Linear Functions A linear function is a common function that represents a straight line
 This handout will: Define Linear and Quadratic Functions both graphically and algebraically Examine the associated equations and their components. Look at how each component could affect shape graphically
Exponential and Logarithmic Functions. Copyright Cengage Learning. All rights reserved.
 3 Exponential and Logarithmic Functions Copyright Cengage Learning. All rights reserved. 3.2 Logarithmic Functions and Their Graphs Copyright Cengage Learning. All rights reserved. What You Should Learn
Chapter 3: Examining Relationships
 Chapter 3 Review Chapter 3: Examining Relationships 1. A study is conducted to determine if one can predict the yield of a crop based on the amount of yearly rainfall. The response variable in this study
Math 9 Practice Final Exam #2
 Class: Date: Math Practice Final Exam #2 Multiple Choice Identify the choice that best completes the statement or answers the question. 1. Determine the value of 0.0. a. 0.02 b. 0.0 c. 0.1 d. 0.2 2. Which
Lesson 23: The Defining Equation of a Line
 Student Outcomes Students know that two equations in the form of and graph as the same line when and at least one of or is nonzero. Students know that the graph of a linear equation, where,, and are constants
Sections 8.1 & 8.2 Systems of Linear Equations in Two Variables
 Sections 8.1 & 8.2 Systems of Linear Equations in Two Variables Department of Mathematics Porterville College September 7, 2014 Systems of Linear Equations in Two Variables Learning Objectives: Solve Systems
Chapter 7. Lesson Lesson 7.1.2
 Chapter 7 Lesson 7.1.1 7-. Customer A should order y=4x instead; Customer B should order y= x+ instead; Customer C s order is correct; Customer D s table is not linear, so the customer should revise his
Lesson 4. Is it a proportion?
 Learning Target Ratios and Proportional Relationships Lesson 4 Is it a proportion? Analyze proportional relationships and use them to solve real world and mathematical problems. CCSS.Math.Content.7.RP.A.2
STANDARDS OF LEARNING CONTENT REVIEW NOTES. ALGEBRA I Part II 1 st Nine Weeks,
 STANDARDS OF LEARNING CONTENT REVIEW NOTES ALGEBRA I Part II 1 st Nine Weeks, 2016-2017 OVERVIEW Algebra I Content Review Notes are designed by the High School Mathematics Steering Committee as a resource
Name: Essential Skills Practice for students entering Geometry or Accelerated Geometry
 Name: Essential Skills Practice for students entering Geometry or Accelerated Geometry Use this document to review the mathematics that you have learned previously. Completion of the Essential Skills Practice
STATISTICS Relationships between variables: Correlation
 STATISTICS 16 Relationships between variables: Correlation The gentleman pictured above is Sir Francis Galton. Galton invented the statistical concept of correlation and the use of the regression line.
Economics 203: Intermediate Microeconomics. Calculus Review. A function f, is a rule assigning a value y for each value x.
 Economics 203: Intermediate Microeconomics Calculus Review Functions, Graphs and Coordinates Econ 203 Calculus Review p. 1 Functions: A function f, is a rule assigning a value y for each value x. The following
Mini Lecture 2.1 Introduction to Functions
 Mini Lecture.1 Introduction to Functions 1. Find the domain and range of a relation.. Determine whether a relation is a function. 3. Evaluate a function. 1. Find the domain and range of the relation. a.
Calculus 140, section 4.7 Concavity and Inflection Points notes by Tim Pilachowski
 Calculus 140, section 4.7 Concavity and Inflection Points notes by Tim Pilachowski Reminder: You will not be able to use a graphing calculator on tests! Theory Eample: Consider the graph of y = pictured
Unit 1. Thinking with Mathematical Models Investigation 2: Linear Models & Equations
 Unit 1 Thinking with Mathematical Models Investigation 2: Linear Models & Equations I can recognize and model linear and nonlinear relationships in two-variable data. Investigation 2 In Investigation 1,
8th Grade Common Core Math
 8th Grade Common Core Math Booklet 5 Functions Part 2 One of the Main Idea of Functions: Use functions to model relationships between quantities What are functions? Functions are like machines. You give
Algebra 1 Semester 1 Review
 Class: Date: Algebra 1 Semester 1 Review 2013-2014 1. 7 4 2. What is the simplified form of each expression? 343 16,384 16,807 2,401 Ê ËÁ 4 7 ˆ 3 343 64 64 343 21952 407 What is the simplified form of
Basic ALGEBRA 2 SUMMER PACKET
 Name Basic ALGEBRA SUMMER PACKET This packet contains Algebra I topics that you have learned before and should be familiar with coming into Algebra II. We will use these concepts on a regular basis throughout
Summer Review Packet for Students Entering Honors Algebra (9-4) in September
 in September") Page 1 of 14 Summer Review Packet for Students Entering Honors Algebra (9-4) in September Introduction The learning objectives and sample problems that follow were adapted from the Honors 8th grade math
Page 1 of 14 Summer Review Packet for Students Entering Honors Algebra (9-4) in September Introduction The learning objectives and sample problems that follow were adapted from the Honors 8th grade math
Big Data Analysis with Apache Spark UC#BERKELEY
 Big Data Analysis with Apache Spark UC#BERKELEY This Lecture: Relation between Variables An association A trend» Positive association or Negative association A pattern» Could be any discernible shape»
Unit 2 Linear Equations and Inequalities
 Unit 2 Linear Equations and Inequalities Test Date: Name: By the end of this unit, you will be able to Use rate of change to solve problems Find the slope of a line Model real-world data with linear equations
B. Linear equations can be written in the form y = mx+b or f(x) = mx+b. which is called: Or Ax + By = C which is called:
 = mx+b. which is called: Or Ax + By = C which is called:") Math 95, Mod 1, Sec. 3.3 Graphing Linear functions A. Graphing Linear functions E. 1: Graph: f() = 3, g() = 3 + 2 and h() = 3-3 f() g() h() 0-2 2 What happens? B. Linear equations can be written in the
Math 95, Mod 1, Sec. 3.3 Graphing Linear functions A. Graphing Linear functions E. 1: Graph: f() = 3, g() = 3 + 2 and h() = 3-3 f() g() h() 0-2 2 What happens? B. Linear equations can be written in the
Algebra 1 Practice Test Modeling with Linear Functions Unit 6. Name Period Date
 Name Period Date Vocabular: Define each word and give an example.. Correlation 2. Residual plot. Translation Short Answer: 4. Statement: If a strong correlation is present between two variables, causation
1.1 Linear Equations and Inequalities
 1.1 Linear Equations and Inequalities Linear Equation in 1 Variable Any equation that can be written in the following form: ax + b = 0 a,b R, a 0 and x is a variable Any equation has a solution, sometimes
Module 2 Study Guide. The second module covers the following sections of the textbook: , 4.1, 4.2, 4.5, and
 Module 2 Study Guide The second module covers the following sections of the textbook: 3.3-3.7, 4.1, 4.2, 4.5, and 5.1-5.3 Sections 3.3-3.6 This is a continuation of the study of linear functions that we
REVIEW 8/2/2017 陈芳华东师大英语系
 REVIEW Hypothesis testing starts with a null hypothesis and a null distribution. We compare what we have to the null distribution, if the result is too extreme to belong to the null distribution (p
Purpose of the experiment
 Kinematics PES 1160 Advanced Physics Lab I Purpose of the experiment To measure a value of g, the acceleration of gravity at the Earth s surface. To understand the relationships between position, velocity
ACTIVITY: Using a Table to Plot Points
 .5 Graphing Linear Equations in Standard Form equation a + b = c? How can ou describe the graph of the ACTIVITY: Using a Table to Plot Points Work with a partner. You sold a total of $6 worth of tickets
= - = = 1 = -2 = 3. Jeremy can plant 10 trees in 4 hours. How many trees can he plant in 10 hours? A. 16
 7 th Grade Only 1. Four points are graphed on a line. Which point is located at the opposite of -2? A. Point J B. Point K C. Point L D. Point M OPPOSITE means the SAME DISTANCE from 0 on the opposite side