ITEC 621 Predictive Analytics 6. Variable Selection
|
|
|
- Paulina Jemima Williams
- 5 years ago
- Views:
Transcription

1 ITEC 621 Predictive Analytics 6. Variable Selection
2 Multi-Collinearity XI(û) X s are not independent (are correlated) Y = X * B Approximately: X has no inverse because its columns are dependent Really: X *X has no (pseudo)-inverse because its columns are (too) dependent 2
3 Testing for Multi-Collinearity First, you need to analyze the correlation matrix and inspect for desirable correlations à high between the dependent and any independent variable; and low among independent variables. Run your regression model and report multi-collinearity statistics in the results. Two are most widely used: Ø Condition Index (CI): a composite score of the linear association of all independent variables for the model as a whole ürule of thumb: CI < 3 no problem, 3 < CI < 5 some concern, CI > 5 severe, no good 3 Ø Variance Inflation Factors (VIF): a statistic measuring the contribution of each predictor (X i ) to the model s multicollinearity, which helps figure out which variables are problematic ü VIF X i = 1 1-R 2 for X i regressed against all other predictors ü Rule of thumb: VIF < 1 no problem, VIF >= 1 too high,
4 4 Variable Selection Methods XI(û) X s are not independent (are correlated)
5 Subset Comparison: Intuition You can test any 2 related models: Large vs. Reduced (or Restricted): Reduced Model: Y = β + β 1 (X 1 ) + β 2 (X 2 ) + + ε Large Model: Y = β + β 1 (X 1 ) + β 2 (X 2 ) + + β 3 (X 3 ) + β 4 (X 4 ) + ε We need to test if the Large model s SSE is significantly lower than the Reduced model s SSE, taking into account the loss of degrees of freedom caused by adding more variables to the model. We can do this with an ANOVA F-Test (or any other fit statistic comparison). Generally, if any of the added coefficients to the Full Model are significant, the ANOVA F-Test will also be significant, but this is not always the case. The F-Test rules. 5
6 Best Subset Selection: Intuition Suppose you have P possible predictors à 2 extreme models: Null Model (NO predictors): Y = β + ε Full Model (ALL predictors): Y = β + β 1 (X 1 ) + β 2 (X 2 ) + + β P (X P ) + ε 6
7 library(islr) # Contains Hitters data set lm.reduced <- lm(salary ~ AtBat + Hits + Walks, data=hitters) lm.large <- lm(salary ~ AtBat + Hits + Walks + Division + PutOuts, data=hitters) lm.full <- lm(salary ~ AtBat + Hits + Walks + Division + PutOuts + Errors, data=hitters) summary(lm.reduced); summary(lm.large); summary(lm.full) anova(lm.reduced, lm.large, lm.full) # Compare all 3 models (from smaller to larger) Null Model Example: Subset Comparison Full Model 7
 + ε 8 Start with the Null model, then try all single-predictor models, then all possible 2-predictor models, etc.")
8 Best Subset Selection: Intuition Suppose you have P possible predictors à 2 extreme models: Null Model (NO predictors): Y = β + ε Full Model (ALL predictors): Y = β + β 1 (X 1 ) + β 2 (X 2 ) + + β P (X P ) + ε 8 Start with the Null model, then try all single-predictor models, then all possible 2-predictor models, etc., ending with the Full model Then compare all resulting models using cross-validation This method works well when P is small because you end up testing all possible models But if P is large, the pool of possible models will grow exponentially (2 P -1) and it may not be computationally practical to test all of them. Ø 1 variables à = 1,24 models Ø 2 variables à = 1,48,576 models There are R packages for best subset selection, with algorithms to test most plausible models.
9 Example: Best Subset Selection library(islr) # Needed for the Hitters data set library(leaps) # Contains the regsubsets() function for subset selection regfit.full=regsubsets(salary~., Hitters) # Fit the full model summary(regfit.full) reg.summary <- summary(regfit.full) plot(reg.summary$rss, xlab="number of Variables", ylab="rss",type="l") plot(reg.summary$adjr2, xlab="number of Variables", ylab="adjusted RSq", type="l") 9
10 Breakout 1
11 Regularization in Sports Analytics ITEC 621, Week 6

12 All-Star

13 New York Times
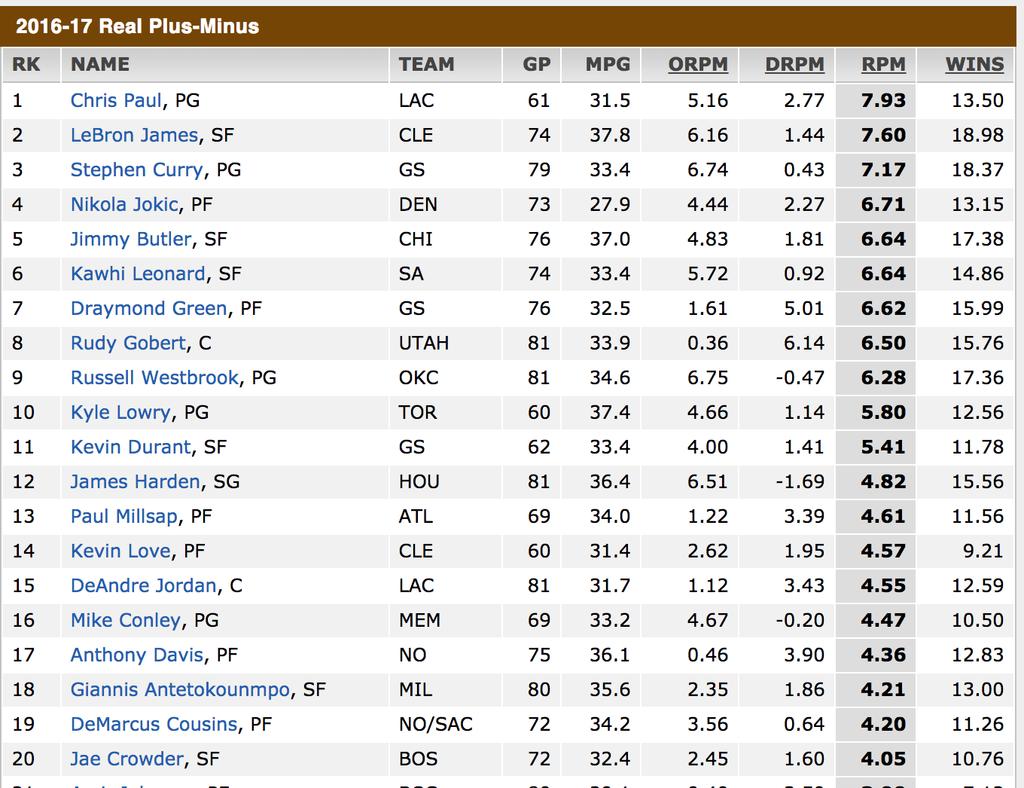
14 Plus-Minus Totals, 1/29/13 Adjusted Plus-Minus Each possession ORL scoring: y = [,,, -2,,,, -3,,, -2,, -1,, 1, ] (IND scoring: y = [,,, +2,,,, +3,,, +2,, +1,, -1 ])
15 Plus Minus (PM): How many (net) points does the team score while a player plays? Adjusted Plus-Minus (APM): Regularized APM (RAPM): Predictive model for PM based on lineups (i.e. improves PM by controlling for teammate & opponent quality) APM, with regularization to overcome multicollinearity & small samples (i.e. tries to identify players with most impact)
16
17 Adjusted Plus-Minus (APM): Predict points scored for each possession based on lineup = ??????????? Y: Team points = X: Lineups * B: APM
18 Adjusted Plus-Minus (APM): Predict points scored for each possession based on lineup = Shane Battier Y: Team points = X: Lineups * B: APM
19 Regularization: Adding a penalty term to the error function before minimizing it Ridge Regression LASSO Regression Tuning parameter: How much to regularize?

20 Tuning parameter: How much to regularize?
21 Regularized Adjusted Plus-Minus (RAPM) APM with regularization for multicollinearity & small samples Ridge regularization = Y: Team points = X: Lineups * B: RAPM


22 Regularized Adjusted Plus-Minus (RAPM) APM with regularization for multicollinearity & small samples LASSO regularization = Y: Team points = X: Lineups * B: RAPM
MULTICOLLINEARITY AND VARIANCE INFLATION FACTORS. F. Chiaromonte 1
 MULTICOLLINEARITY AND VARIANCE INFLATION FACTORS F. Chiaromonte 1 Pool of available predictors/terms from them in the data set. Related to model selection, are the questions: What is the relative importance
n i n T Note: You can use the fact that t(.975; 10) = 2.228, t(.95; 10) = 1.813, t(.975; 12) = 2.179, t(.95; 12) =
 = 2.228, t(.95; 10) = 1.813, t(.975; 12) = 2.179, t(.95; 12) =") MAT 3378 3X Midterm Examination (Solutions) 1. An experiment with a completely randomized design was run to determine whether four specific firing temperatures affect the density of a certain type of brick.
MAT 3378 3X Midterm Examination (Solutions) 1. An experiment with a completely randomized design was run to determine whether four specific firing temperatures affect the density of a certain type of brick.
Classification & Regression. Multicollinearity Intro to Nominal Data
 Multicollinearity Intro to Nominal Let s Start With A Question y = β 0 + β 1 x 1 +β 2 x 2 y = Anxiety Level x 1 = heart rate x 2 = recorded pulse Since we can all agree heart rate and pulse are related,
Linear regression methods
 Linear regression methods Most of our intuition about statistical methods stem from linear regression. For observations i = 1,..., n, the model is Y i = p X ij β j + ε i, j=1 where Y i is the response
STAT 4385 Topic 06: Model Diagnostics
 STAT 4385 Topic 06: Xiaogang Su, Ph.D. Department of Mathematical Science University of Texas at El Paso xsu@utep.edu Spring, 2016 1/ 40 Outline Several Types of Residuals Raw, Standardized, Studentized
L7: Multicollinearity
 L7: Multicollinearity Feng Li feng.li@cufe.edu.cn School of Statistics and Mathematics Central University of Finance and Economics Introduction ï Example Whats wrong with it? Assume we have this data Y
Chapter 2 Multiple Regression (Part 4)
") Chapter 2 Multiple Regression (Part 4) 1 The effect of multi-collinearity Now, we know to find the estimator (X X) 1 must exist! Therefore, n must be great or at least equal to p + 1 (WHY?) However, even
Chapter 2 Multiple Regression (Part 4) 1 The effect of multi-collinearity Now, we know to find the estimator (X X) 1 must exist! Therefore, n must be great or at least equal to p + 1 (WHY?) However, even
Penalized Regression
 Penalized Regression Deepayan Sarkar Penalized regression Another potential remedy for collinearity Decreases variability of estimated coefficients at the cost of introducing bias Also known as regularization
Multiple Linear Regression
 Andrew Lonardelli December 20, 2013 Multiple Linear Regression 1 Table Of Contents Introduction: p.3 Multiple Linear Regression Model: p.3 Least Squares Estimation of the Parameters: p.4-5 The matrix approach
Multiple Linear Regression
 Multiple Linear Regression Simple linear regression tries to fit a simple line between two variables Y and X. If X is linearly related to Y this explains some of the variability in Y. In most cases, there
Chapter 14 Student Lecture Notes 14-1
 Chapter 14 Student Lecture Notes 14-1 Business Statistics: A Decision-Making Approach 6 th Edition Chapter 14 Multiple Regression Analysis and Model Building Chap 14-1 Chapter Goals After completing this
MS-C1620 Statistical inference
 MS-C1620 Statistical inference 10 Linear regression III Joni Virta Department of Mathematics and Systems Analysis School of Science Aalto University Academic year 2018 2019 Period III - IV 1 / 32 Contents
Checking model assumptions with regression diagnostics
 @graemeleehickey www.glhickey.com graeme.hickey@liverpool.ac.uk Checking model assumptions with regression diagnostics Graeme L. Hickey University of Liverpool Conflicts of interest None Assistant Editor
Ridge Regression. Summary. Sample StatFolio: ridge reg.sgp. STATGRAPHICS Rev. 10/1/2014
 Ridge Regression Summary... 1 Data Input... 4 Analysis Summary... 5 Analysis Options... 6 Ridge Trace... 7 Regression Coefficients... 8 Standardized Regression Coefficients... 9 Observed versus Predicted...
Hypothesis testing Goodness of fit Multicollinearity Prediction. Applied Statistics. Lecturer: Serena Arima
 Applied Statistics Lecturer: Serena Arima Hypothesis testing for the linear model Under the Gauss-Markov assumptions and the normality of the error terms, we saw that β N(β, σ 2 (X X ) 1 ) and hence s
Regression in R. Seth Margolis GradQuant May 31,
 Regression in R Seth Margolis GradQuant May 31, 2018 1 GPA What is Regression Good For? Assessing relationships between variables This probably covers most of what you do 4 3.8 3.6 3.4 Person Intelligence
Psychology Seminar Psych 406 Dr. Jeffrey Leitzel
 Psychology Seminar Psych 406 Dr. Jeffrey Leitzel Structural Equation Modeling Topic 1: Correlation / Linear Regression Outline/Overview Correlations (r, pr, sr) Linear regression Multiple regression interpreting
STAT 212: BUSINESS STATISTICS II Third Exam Tuesday Dec 12, 6:00 PM
 STAT212_E3 KING FAHD UNIVERSITY OF PETROLEUM & MINERALS DEPARTMENT OF MATHEMATICS & STATISTICS Term 171 Page 1 of 9 STAT 212: BUSINESS STATISTICS II Third Exam Tuesday Dec 12, 2017 @ 6:00 PM Name: ID #:
Lecture 14: Shrinkage
 Lecture 14: Shrinkage Reading: Section 6.2 STATS 202: Data mining and analysis October 27, 2017 1 / 19 Shrinkage methods The idea is to perform a linear regression, while regularizing or shrinking the
Multiple Regression and Model Building (cont d) + GIS Lecture 21 3 May 2006 R. Ryznar
 + GIS Lecture 21 3 May 2006 R. Ryznar") Multiple Regression and Model Building (cont d) + GIS 11.220 Lecture 21 3 May 2006 R. Ryznar Model Summary b 1-[(SSE/n-k+1)/(SST/n-1)] Model 1 Adjusted Std. Error of R R Square R Square the Estimate.991
Multiple Regression and Model Building (cont d) + GIS 11.220 Lecture 21 3 May 2006 R. Ryznar Model Summary b 1-[(SSE/n-k+1)/(SST/n-1)] Model 1 Adjusted Std. Error of R R Square R Square the Estimate.991
Part V. Model Slection and Regularization. As of Nov 21, 2018
 Part V Model Slection and Regularization As of Nov 21, 2018 Some of the figures in this presentation are taken from An Introduction to Statistical Learning, with applications in R (Springer, 2013) with
Collaborative Statistics: Symbols and their Meanings
 OpenStax-CNX module: m16302 1 Collaborative Statistics: Symbols and their Meanings Susan Dean Barbara Illowsky, Ph.D. This work is produced by OpenStax-CNX and licensed under the Creative Commons Attribution
Lecture 10 Multiple Linear Regression
 Lecture 10 Multiple Linear Regression STAT 512 Spring 2011 Background Reading KNNL: 6.1-6.5 10-1 Topic Overview Multiple Linear Regression Model 10-2 Data for Multiple Regression Y i is the response variable
Econometrics -- Final Exam (Sample)
") Econometrics -- Final Exam (Sample) 1) The sample regression line estimated by OLS A) has an intercept that is equal to zero. B) is the same as the population regression line. C) cannot have negative and
Econometrics -- Final Exam (Sample) 1) The sample regression line estimated by OLS A) has an intercept that is equal to zero. B) is the same as the population regression line. C) cannot have negative and
1 Multiple Regression
 1 Multiple Regression In this section, we extend the linear model to the case of several quantitative explanatory variables. There are many issues involved in this problem and this section serves only
STA121: Applied Regression Analysis
 STA121: Applied Regression Analysis Linear Regression Analysis - Chapters 3 and 4 in Dielman Artin Department of Statistical Science September 15, 2009 Outline 1 Simple Linear Regression Analysis 2 Using
LINEAR REGRESSION, RIDGE, LASSO, SVR
 LINEAR REGRESSION, RIDGE, LASSO, SVR Supervised Learning Katerina Tzompanaki Linear regression one feature* Price (y) What is the estimated price of a new house of area 30 m 2? 30 Area (x) *Also called
Chapter 3 Multiple Regression Complete Example
 Department of Quantitative Methods & Information Systems ECON 504 Chapter 3 Multiple Regression Complete Example Spring 2013 Dr. Mohammad Zainal Review Goals After completing this lecture, you should be
Prediction of Bike Rental using Model Reuse Strategy
 Prediction of Bike Rental using Model Reuse Strategy Arun Bala Subramaniyan and Rong Pan School of Computing, Informatics, Decision Systems Engineering, Arizona State University, Tempe, USA. {bsarun, rong.pan}@asu.edu
Correlation. Tests of Relationships: Correlation. Correlation. Correlation. Bivariate linear correlation. Correlation 9/8/2018
 Tests of Relationships: Parametric and non parametric approaches Whether samples from two different variables vary together in a linear fashion Parametric: Pearson product moment correlation Non parametric:
MS&E 226. In-Class Midterm Examination Solutions Small Data October 20, 2015
 MS&E 226 In-Class Midterm Examination Solutions Small Data October 20, 2015 PROBLEM 1. Alice uses ordinary least squares to fit a linear regression model on a dataset containing outcome data Y and covariates
Data analysis strategies for high dimensional social science data M3 Conference May 2013
 Data analysis strategies for high dimensional social science data M3 Conference May 2013 W. Holmes Finch, Maria Hernández Finch, David E. McIntosh, & Lauren E. Moss Ball State University High dimensional
This paper is not to be removed from the Examination Halls
 ~~ST104B ZA d0 This paper is not to be removed from the Examination Halls UNIVERSITY OF LONDON ST104B ZB BSc degrees and Diplomas for Graduates in Economics, Management, Finance and the Social Sciences,
Stability and the elastic net
 Stability and the elastic net Patrick Breheny March 28 Patrick Breheny High-Dimensional Data Analysis (BIOS 7600) 1/32 Introduction Elastic Net Our last several lectures have concentrated on methods for
Multiple Linear Regression. Chapter 12
 13 Multiple Linear Regression Chapter 12 Multiple Regression Analysis Definition The multiple regression model equation is Y = b 0 + b 1 x 1 + b 2 x 2 +... + b p x p + ε where E(ε) = 0 and Var(ε) = s 2.
Predictive Analytics : QM901.1x Prof U Dinesh Kumar, IIMB. All Rights Reserved, Indian Institute of Management Bangalore
 What is Multiple Linear Regression Several independent variables may influence the change in response variable we are trying to study. When several independent variables are included in the equation, the
Stat 5100 Handout #26: Variations on OLS Linear Regression (Ch. 11, 13)
") Stat 5100 Handout #26: Variations on OLS Linear Regression (Ch. 11, 13) 1. Weighted Least Squares (textbook 11.1) Recall regression model Y = β 0 + β 1 X 1 +... + β p 1 X p 1 + ε in matrix form: (Ch. 5,
Stat 5100 Handout #26: Variations on OLS Linear Regression (Ch. 11, 13) 1. Weighted Least Squares (textbook 11.1) Recall regression model Y = β 0 + β 1 X 1 +... + β p 1 X p 1 + ε in matrix form: (Ch. 5,
MLR Model Selection. Author: Nicholas G Reich, Jeff Goldsmith. This material is part of the statsteachr project
 MLR Model Selection Author: Nicholas G Reich, Jeff Goldsmith This material is part of the statsteachr project Made available under the Creative Commons Attribution-ShareAlike 3.0 Unported License: http://creativecommons.org/licenses/by-sa/3.0/deed.en
Multiple Regression Methods
 Chapter 1: Multiple Regression Methods Hildebrand, Ott and Gray Basic Statistical Ideas for Managers Second Edition 1 Learning Objectives for Ch. 1 The Multiple Linear Regression Model How to interpret
y response variable x 1, x 2,, x k -- a set of explanatory variables
 11. Multiple Regression and Correlation y response variable x 1, x 2,, x k -- a set of explanatory variables In this chapter, all variables are assumed to be quantitative. Chapters 12-14 show how to incorporate
Day 4: Shrinkage Estimators
 Day 4: Shrinkage Estimators Kenneth Benoit Data Mining and Statistical Learning March 9, 2015 n versus p (aka k) Classical regression framework: n > p. Without this inequality, the OLS coefficients have
Draft of an article prepared for the Encyclopedia of Social Science Research Methods, Sage Publications. Copyright by John Fox 2002
 Draft of an article prepared for the Encyclopedia of Social Science Research Methods, Sage Publications. Copyright by John Fox 00 Please do not quote without permission Variance Inflation Factors. Variance
Data Analysis and Statistical Methods Statistics 651
 Data Analysis and Statistical Methods Statistics 651 http://www.stat.tamu.edu/~suhasini/teaching.html Suhasini Subba Rao Motivations for the ANOVA We defined the F-distribution, this is mainly used in
Statistics 5100 Spring 2018 Exam 1
 Statistics 5100 Spring 2018 Exam 1 Directions: You have 60 minutes to complete the exam. Be sure to answer every question, and do not spend too much time on any part of any question. Be concise with all
STAT 462-Computational Data Analysis
 STAT 462-Computational Data Analysis Chapter 5- Part 2 Nasser Sadeghkhani a.sadeghkhani@queensu.ca October 2017 1 / 27 Outline Shrinkage Methods 1. Ridge Regression 2. Lasso Dimension Reduction Methods
Analysis of Variance
 Statistical Techniques II EXST7015 Analysis of Variance 15a_ANOVA_Introduction 1 Design The simplest model for Analysis of Variance (ANOVA) is the CRD, the Completely Randomized Design This model is also
Linear Regression. Aarti Singh. Machine Learning / Sept 27, 2010
 Linear Regression Aarti Singh Machine Learning 10-701/15-781 Sept 27, 2010 Discrete to Continuous Labels Classification Sports Science News Anemic cell Healthy cell Regression X = Document Y = Topic X
Machine Learning Linear Regression. Prof. Matteo Matteucci
 Machine Learning Linear Regression Prof. Matteo Matteucci Outline 2 o Simple Linear Regression Model Least Squares Fit Measures of Fit Inference in Regression o Multi Variate Regession Model Least Squares
Sampling distribution of t. 2. Sampling distribution of t. 3. Example: Gas mileage investigation. II. Inferential Statistics (8) t =
 t =") 2. The distribution of t values that would be obtained if a value of t were calculated for each sample mean for all possible random of a given size from a population _ t ratio: (X - µ hyp ) t s x The result
2. The distribution of t values that would be obtained if a value of t were calculated for each sample mean for all possible random of a given size from a population _ t ratio: (X - µ hyp ) t s x The result
Simple Linear Regression
 9-1 l Chapter 9 l Simple Linear Regression 9.1 Simple Linear Regression 9.2 Scatter Diagram 9.3 Graphical Method for Determining Regression 9.4 Least Square Method 9.5 Correlation Coefficient and Coefficient
Homework 1: Solutions
 Homework 1: Solutions Statistics 413 Fall 2017 Data Analysis: Note: All data analysis results are provided by Michael Rodgers 1. Baseball Data: (a) What are the most important features for predicting players
STAT 212 Business Statistics II 1
 STAT 1 Business Statistics II 1 KING FAHD UNIVERSITY OF PETROLEUM & MINERALS DEPARTMENT OF MATHEMATICAL SCIENCES DHAHRAN, SAUDI ARABIA STAT 1: BUSINESS STATISTICS II Semester 091 Final Exam Thursday Feb
Tentative solutions TMA4255 Applied Statistics 16 May, 2015
 Norwegian University of Science and Technology Department of Mathematical Sciences Page of 9 Tentative solutions TMA455 Applied Statistics 6 May, 05 Problem Manufacturer of fertilizers a) Are these independent
1-Way ANOVA MATH 143. Spring Department of Mathematics and Statistics Calvin College
 1-Way ANOVA MATH 143 Department of Mathematics and Statistics Calvin College Spring 2010 The basic ANOVA situation Two variables: 1 Categorical, 1 Quantitative Main Question: Do the (means of) the quantitative
Single and multiple linear regression analysis
 Single and multiple linear regression analysis Marike Cockeran 2017 Introduction Outline of the session Simple linear regression analysis SPSS example of simple linear regression analysis Additional topics
" M A #M B. Standard deviation of the population (Greek lowercase letter sigma) σ 2
 σ 2") Notation and Equations for Final Exam Symbol Definition X The variable we measure in a scientific study n The size of the sample N The size of the population M The mean of the sample µ The mean of the
Notation and Equations for Final Exam Symbol Definition X The variable we measure in a scientific study n The size of the sample N The size of the population M The mean of the sample µ The mean of the
Chapter 19: Logistic regression
 Chapter 19: Logistic regression Self-test answers SELF-TEST Rerun this analysis using a stepwise method (Forward: LR) entry method of analysis. The main analysis To open the main Logistic Regression dialog
Theorems. Least squares regression
 Theorems In this assignment we are trying to classify AML and ALL samples by use of penalized logistic regression. Before we indulge on the adventure of classification we should first explain the most
Questions 3.83, 6.11, 6.12, 6.17, 6.25, 6.29, 6.33, 6.35, 6.50, 6.51, 6.53, 6.55, 6.59, 6.60, 6.65, 6.69, 6.70, 6.77, 6.79, 6.89, 6.
 Chapter 7 Reading 7.1, 7.2 Questions 3.83, 6.11, 6.12, 6.17, 6.25, 6.29, 6.33, 6.35, 6.50, 6.51, 6.53, 6.55, 6.59, 6.60, 6.65, 6.69, 6.70, 6.77, 6.79, 6.89, 6.112 Introduction In Chapter 5 and 6, we emphasized
x3,..., Multiple Regression β q α, β 1, β 2, β 3,..., β q in the model can all be estimated by least square estimators
 Multiple Regression Relating a response (dependent, input) y to a set of explanatory (independent, output, predictor) variables x, x 2, x 3,, x q. A technique for modeling the relationship between variables.
Tutorial on Linear Regression
 Tutorial on Linear Regression HY-539: Advanced Topics on Wireless Networks & Mobile Systems Prof. Maria Papadopouli Evripidis Tzamousis tzamusis@csd.uoc.gr Agenda 1. Simple linear regression 2. Multiple
No other aids are allowed. For example you are not allowed to have any other textbook or past exams.
 UNIVERSITY OF TORONTO SCARBOROUGH Department of Computer and Mathematical Sciences Sample Exam Note: This is one of our past exams, In fact the only past exam with R. Before that we were using SAS. In
The prediction of house price
 000 001 002 003 004 005 006 007 008 009 010 011 012 013 014 015 016 017 018 019 020 021 022 023 024 025 026 027 028 029 030 031 032 033 034 035 036 037 038 039 040 041 042 043 044 045 046 047 048 049 050
Statistics 203: Introduction to Regression and Analysis of Variance Penalized models
 Statistics 203: Introduction to Regression and Analysis of Variance Penalized models Jonathan Taylor - p. 1/15 Today s class Bias-Variance tradeoff. Penalized regression. Cross-validation. - p. 2/15 Bias-variance
Trendlines Simple Linear Regression Multiple Linear Regression Systematic Model Building Practical Issues
 Trendlines Simple Linear Regression Multiple Linear Regression Systematic Model Building Practical Issues Overfitting Categorical Variables Interaction Terms Non-linear Terms Linear Logarithmic y = a +
Inference for the Regression Coefficient
 Inference for the Regression Coefficient Recall, b 0 and b 1 are the estimates of the slope β 1 and intercept β 0 of population regression line. We can shows that b 0 and b 1 are the unbiased estimates
Remedial Measures for Multiple Linear Regression Models
 Remedial Measures for Multiple Linear Regression Models Yang Feng http://www.stat.columbia.edu/~yangfeng Yang Feng (Columbia University) Remedial Measures for Multiple Linear Regression Models 1 / 25 Outline
Dr. Maddah ENMG 617 EM Statistics 11/28/12. Multiple Regression (3) (Chapter 15, Hines)
 (Chapter 15, Hines)") Dr. Maddah ENMG 617 EM Statistics 11/28/12 Multiple Regression (3) (Chapter 15, Hines) Problems in multiple regression: Multicollinearity This arises when the independent variables x 1, x 2,, x k, are
Dr. Maddah ENMG 617 EM Statistics 11/28/12 Multiple Regression (3) (Chapter 15, Hines) Problems in multiple regression: Multicollinearity This arises when the independent variables x 1, x 2,, x k, are
Multivariate Regression (Chapter 10)
") Multivariate Regression (Chapter 10) This week we ll cover multivariate regression and maybe a bit of canonical correlation. Today we ll mostly review univariate multivariate regression. With multivariate
Multivariate Regression (Chapter 10) This week we ll cover multivariate regression and maybe a bit of canonical correlation. Today we ll mostly review univariate multivariate regression. With multivariate
LECTURE 10: LINEAR MODEL SELECTION PT. 1. October 16, 2017 SDS 293: Machine Learning
 LECTURE 10: LINEAR MODEL SELECTION PT. 1 October 16, 2017 SDS 293: Machine Learning Outline Model selection: alternatives to least-squares Subset selection - Best subset - Stepwise selection (forward and
Stat 401B Final Exam Fall 2015
 Stat 401B Final Exam Fall 015 I have neither given nor received unauthorized assistance on this exam. Name Signed Date Name Printed ATTENTION! Incorrect numerical answers unaccompanied by supporting reasoning
The simple linear regression model discussed in Chapter 13 was written as
 1519T_c14 03/27/2006 07:28 AM Page 614 Chapter Jose Luis Pelaez Inc/Blend Images/Getty Images, Inc./Getty Images, Inc. 14 Multiple Regression 14.1 Multiple Regression Analysis 14.2 Assumptions of the Multiple
Chapter 26 Multiple Regression, Logistic Regression, and Indicator Variables
 Chapter 26 Multiple Regression, Logistic Regression, and Indicator Variables 26.1 S 4 /IEE Application Examples: Multiple Regression An S 4 /IEE project was created to improve the 30,000-footlevel metric
Regression, Ridge Regression, Lasso
 Regression, Ridge Regression, Lasso Fabio G. Cozman - fgcozman@usp.br October 2, 2018 A general definition Regression studies the relationship between a response variable Y and covariates X 1,..., X n.
Confidence Interval for the mean response
 Week 3: Prediction and Confidence Intervals at specified x. Testing lack of fit with replicates at some x's. Inference for the correlation. Introduction to regression with several explanatory variables.
Inference for Regression Simple Linear Regression
 Inference for Regression Simple Linear Regression IPS Chapter 10.1 2009 W.H. Freeman and Company Objectives (IPS Chapter 10.1) Simple linear regression p Statistical model for linear regression p Estimating
STA 4210 Practise set 2b
 STA 410 Practise set b For all significance tests, use = 0.05 significance level. S.1. A linear regression model is fit, relating fish catch (Y, in tons) to the number of vessels (X 1 ) and fishing pressure
Ridge Regression. Chapter 335. Introduction. Multicollinearity. Effects of Multicollinearity. Sources of Multicollinearity
 Chapter 335 Introduction is a technique for analyzing multiple regression data that suffer from multicollinearity. When multicollinearity occurs, least squares estimates are unbiased, but their variances
Simple Linear Regression: One Qualitative IV
 Simple Linear Regression: One Qualitative IV 1. Purpose As noted before regression is used both to explain and predict variation in DVs, and adding to the equation categorical variables extends regression
Multicollinearity Exercise
 Multicollinearity Exercise Use the attached SAS output to answer the questions. [OPTIONAL: Copy the SAS program below into the SAS editor window and run it.] You do not need to submit any output, so there
PubH 7405: REGRESSION ANALYSIS. MLR: INFERENCES, Part I
 PubH 7405: REGRESSION ANALYSIS MLR: INFERENCES, Part I TESTING HYPOTHESES Once we have fitted a multiple linear regression model and obtained estimates for the various parameters of interest, we want to
Exam Applied Statistical Regression. Good Luck!
 Dr. M. Dettling Summer 2011 Exam Applied Statistical Regression Approved: Tables: Note: Any written material, calculator (without communication facility). Attached. All tests have to be done at the 5%-level.
Multiple linear regression S6
 Basic medical statistics for clinical and experimental research Multiple linear regression S6 Katarzyna Jóźwiak k.jozwiak@nki.nl November 15, 2017 1/42 Introduction Two main motivations for doing multiple
Regression Models. Chapter 4. Introduction. Introduction. Introduction
 Chapter 4 Regression Models Quantitative Analysis for Management, Tenth Edition, by Render, Stair, and Hanna 008 Prentice-Hall, Inc. Introduction Regression analysis is a very valuable tool for a manager
What If There Are More Than. Two Factor Levels?
 What If There Are More Than Chapter 3 Two Factor Levels? Comparing more that two factor levels the analysis of variance ANOVA decomposition of total variability Statistical testing & analysis Checking
Inferences for Regression
 Inferences for Regression An Example: Body Fat and Waist Size Looking at the relationship between % body fat and waist size (in inches). Here is a scatterplot of our data set: Remembering Regression In
PENALIZING YOUR MODELS
 PENALIZING YOUR MODELS AN OVERVIEW OF THE GENERALIZED REGRESSION PLATFORM Michael Crotty & Clay Barker Research Statisticians JMP Division, SAS Institute Copyr i g ht 2012, SAS Ins titut e Inc. All rights
Categorical Predictor Variables
 Categorical Predictor Variables We often wish to use categorical (or qualitative) variables as covariates in a regression model. For binary variables (taking on only 2 values, e.g. sex), it is relatively
Chapter 4: Regression Models
 Sales volume of company 1 Textbook: pp. 129-164 Chapter 4: Regression Models Money spent on advertising 2 Learning Objectives After completing this chapter, students will be able to: Identify variables,
MULTIPLE REGRESSION AND ISSUES IN REGRESSION ANALYSIS
 MULTIPLE REGRESSION AND ISSUES IN REGRESSION ANALYSIS Page 1 MSR = Mean Regression Sum of Squares MSE = Mean Squared Error RSS = Regression Sum of Squares SSE = Sum of Squared Errors/Residuals α = Level
Sections 7.1, 7.2, 7.4, & 7.6
 Sections 7.1, 7.2, 7.4, & 7.6 Adapted from Timothy Hanson Department of Statistics, University of South Carolina Stat 704: Data Analysis I 1 / 25 Chapter 7 example: Body fat n = 20 healthy females 25 34
Ch 3: Multiple Linear Regression
 Ch 3: Multiple Linear Regression 1. Multiple Linear Regression Model Multiple regression model has more than one regressor. For example, we have one response variable and two regressor variables: 1. delivery
Review of Statistics 101
 Review of Statistics 101 We review some important themes from the course 1. Introduction Statistics- Set of methods for collecting/analyzing data (the art and science of learning from data). Provides methods
Linear model selection and regularization
 Linear model selection and regularization Problems with linear regression with least square 1. Prediction Accuracy: linear regression has low bias but suffer from high variance, especially when n p. It
Statistics 262: Intermediate Biostatistics Model selection
 Statistics 262: Intermediate Biostatistics Model selection Jonathan Taylor & Kristin Cobb Statistics 262: Intermediate Biostatistics p.1/?? Today s class Model selection. Strategies for model selection.
Prediction & Feature Selection in GLM
 Tarigan Statistical Consulting & Coaching statistical-coaching.ch Doctoral Program in Computer Science of the Universities of Fribourg, Geneva, Lausanne, Neuchâtel, Bern and the EPFL Hands-on Data Analysis
Biostatistics and Design of Experiments Prof. Mukesh Doble Department of Biotechnology Indian Institute of Technology, Madras
 Biostatistics and Design of Experiments Prof. Mukesh Doble Department of Biotechnology Indian Institute of Technology, Madras Lecture - 39 Regression Analysis Hello and welcome to the course on Biostatistics
STAT Checking Model Assumptions
 STAT 704 --- Checking Model Assumptions Recall we assumed the following in our model: (1) The regression relationship between the response and the predictor(s) specified in the model is appropriate (2)
One-Way Analysis of Variance: A Guide to Testing Differences Between Multiple Groups
 One-Way Analysis of Variance: A Guide to Testing Differences Between Multiple Groups In analysis of variance, the main research question is whether the sample means are from different populations. The
ISyE 691 Data mining and analytics
 ISyE 691 Data mining and analytics Regression Instructor: Prof. Kaibo Liu Department of Industrial and Systems Engineering UW-Madison Email: kliu8@wisc.edu Office: Room 3017 (Mechanical Engineering Building)