Regression in R. Seth Margolis GradQuant May 31,
|
|
|
- Fay McCarthy
- 5 years ago
- Views:
Transcription
1 Regression in R Seth Margolis GradQuant May 31,
2 GPA What is Regression Good For? Assessing relationships between variables This probably covers most of what you do Person Intelligence GPA Example: What is the relationship between intelligence and GPA? Intelligence is the independent variable, which we will call X GPA is the dependent variable, which we will call Y Intelligence 2
 from 1+ predictors (Xs) Fitting a line to data Y = mx + b + error Y = intercept + slope*x + error Y = b 0 + b 1 X 1 + + b 2 X 2 + e Y is one column of data Each X is a column")
3 What is Regression? Predicts an outcome (Y) from 1+ predictors (Xs) Fitting a line to data Y = mx + b + error Y = intercept + slope*x + error Y = b 0 + b 1 X b 2 X 2 + e Y is one column of data Each X is a column of data b x is the coefficient/weight for that x b 0 is the intercept Prediction for Y when all Xs are 0 e is error/residual What is left over after prediction Y actual -Y predicted 1 value for each case (row of data) 3
4 How does R select the best bs? Y = b 0 + b 1 X 1 + b 2 X 2 + e What would the best bs do? They would lead to predictions of Y that are closest to the actual Y values How close is one prediction from the actual value for that case (row in data)? The residual/error Y actual -Y predicted Better bs will lead to smaller residuals/errors Proposed solution: Find bs that lead to the lowest average residuals/errors Problem: Average residual = 0 Solution: Find bs that lead to lowest average squared residuals/errors Ordinary least squares (OLS) regression R finds the bs that minimize the squared residuals/errors using matrix algebra 4
5 Assumptions 1. Homoscedasticity Variance of residuals does not change at levels of X When violated, bootstrap 2. Residuals/errors normally distributed Can use histogram or P-P / Q-Q plot When violated, bootstrap 3. Independence of residuals/errors When violated, we can use multilevel modeling 4. Linearity When violated, transform Xs to meet this assumption Xs can have any distribution 5

6 R and RStudio Script Console Environment Object assignment Plotting Packages Help Commenting Data frames Functions and arguments 6
 We will use a dataset in the corrgram package about 322 Major League")
7 Load Data Usually will use dataname = read.csv( filepath ) We will use a dataset in the corrgram package about 322 Major League Baseball regular and substitute hitters in

8 Some Data Transformations Not Focus of this Workshop 8
9 1 Continuous Predictor Scatterplot Y = b 0 + b 1 X 1 + e Scatterplot can be quite revealing Want to make sure the relationship looks linear Otherwise you will probably want to transform your predictor Later in workshop Season Batting Average Salary and Season Batting Average Salary (thousands of $ per year) 9
 For each 1-unit increase in")
10 1 Continuous Predictor Model Estimate = b = regression coefficient Standard error = standard deviation of sampling distribution Provides confidence intervals Most affected by N (sample size) t = b / se t and df -> p df = N-k-1 N = sample size k = number of predictors Multiple R 2 = correlation of predicted and actual values squared p-value is p from F (lower right) For each 1-unit increase in SeasonSalary, the Adjusted R 2 adjusts R 2 based on expected SeasonBattingAvg increases by number of predictors 10
11 Standardized Coefficients What if all values were standardized before entering model? Z = (X Mean) / SD βs can be interpreted like correlations -1 to 1 Called standardized regression coefficients For each 1 SD increase in SeasonSalary, SeasonBattingAvg increases by.33 SDs 11
12 Multiple Continuous Predictors Coefficients are partial coefficients Contribution of that variable holding other variables constant Unique contribution of that variable over and above other variables Y X1 X2 12
13 Adding a Predictor For each 1 unit increase in CareerYears, the expected SeasonBattingAvg increases by , holding other variables constant 13

14 Adding a Predictor 14
15 Categorical Predictors: Dichotomous Season Batting Average A N League The NL has a batting average.0036 lower than the AL 15
16 Categorical Predictors: 3+ Levels Dummy Coding Pick a reference group Estimate that group s level of Y as the intercept For all other groups, estimate how different their level of Y is, compared to the dummy group as the bs I usually prefer this over effects coding Effects Coding Estimate the grand mean (mean of all groups) as the intercept For all other groups (except 1), estimate how different their level of Y is, compared to the grand mean as the bs Dummy Coding B B B C DH OF SS Effects Coding B B B C DH OF SS
17 Categorical Predictors: 3+ Levels 17
18 Categorical Predictors: 3+ Levels Season Batting Average B 2B 3B C DH OF SS Position Catchers have a batting average.019 lower than outfielders 18

19 Comparing to ANOVA Between-Group Variability Within-Group Variability 19
20 ANCOVA Categorical and Continuous Predictors Catchers have a batting average.010 lower than outfielders, holding other variables constant 20
21 Non-linear Relationships Season Batting Average Career Years 21
22 Interactions Interaction = effect of X 1 depends on level of X 2 If that is true, opposite is true too Y = b 0 + b 1 X 1 + b 2 X 2 + b 3 X 1 X 2 Y = b 0 + b 1 X 1 + (b 2 + b 3 X 1 )X 2 b 3 = For each 1-unit increase in X how much does b 2 increase And vice-versa Can have 3-way, 4-way, etc. interactions 22


23 Interaction Plot 23


24 Spline Regression Making Data 24
25 Spline Regression Model bs are slopes before and after knot 25

26 Count Outcome 26


27 Count Outcome Negative Binomial Model 27
28 Count Outcome Negative Binomial Model For each 1-unit increase in log(careeryears), the expected log(careeratbats) increases by
")
29 Count Outcome Zero-Inflated Model BaseballData$SeasonHitsZeroInflated BaseballData$SeasonSalary Use when many observations have a 0 on the Y For each 1-unit increase in SeasonSalary, the expected log(seasonhits) increases by


30 Proportional Outcome Beta Regression For each 1-unit increase in SeasonSalary, the log odds of SeasonBatting Avg increases by Log odds = log(probability/1-probability) 30 Can do algebra to get probability at each X
31 Quantile (Percentile) Regression Predict a certain percentile at each X Season Batting Average th percentile 80th 50th percentile 50th 20th percentile Season Salary 31
32 Dichotomous Outcome Logistic Regression odds ratio = 2 -> probability of.66 For each 1-unit increase in SeasonBattingAvg, the log odds of being an outfielder increases by 65 Probability of Outfielder Season Batting Average 32
33 Ordinal Outcome - Ordered Logistic Regression 33

34 Ordinal Outcome - Ordered Logistic Regression 34

35 Ordinal Outcome Ordered Logistic Regression Probability Hits 40 Hits 50 Hits 60 Hits 70 Hits 80 Hits 90 Hits 100 Hits 200 Hits Season Walks 35
36 Categorical Outcome Multinomial Logistic Regression 36

37 Categorical Outcome Multinomial Logistic Regression 37

38 Categorical Outcome Multinomial Logistic Regression Probability Catcher 1st Baseman 2nd Baseman 3rd Baseman Shortstop Outfielder Season Batting Average 38
39 Nested Data Multilevel Modeling Assumption of regression: independence of residuals/errors When violated, we can use multilevel modeling Dependence of residuals/errors usually results from grouping/nesting in the measured DV Students nested in classrooms/teachers Observations nested within participants (i.e., repeated measures) Participants nested in countries Conceptually, it s like running separate regression models for each classroom and then aggregating them Can have student-level and classroom-level predictors Can have more than 2 levels 39
40 Multilevel Equations Example with level-1 and level-2 predictors: Level-1 Model: Y ij = β 0j + β 1j X ij + r ij Level-2 Model: β 0j = γ 00 + γ 01 W j + u 0j β 1j = γ 10 + γ 11 W j + u 1j Combined Model: Y ij = γ 00 + γ 01 W j + γ 10 X ij + γ 11 W j X ij + u 0j + u 1j X ij + r ij Var(r ij ) = σ 2 Var(u 0j ) = τ 00 Var(u 1j ) = τ 11 Cov(u 0j, u 1j ) = τ 01 40
41 Nested Data Multilevel Modeling Level-1 Model: Salary ij = β 0j + β 1j SeasonHomeRuns ij + r ij Level-2 Model: β 0j = u 0j β 1j = u 1j Var(r ij ) = σ 2 = Var(u 0j ) = τ 00 = Var(u 1j ) = τ 11 = Cor(u 0j, u 1j ) = -.71 Within teams, a 1-unit increase in SeasonHomeRuns the expected Salary increases by 19.3 units 41
42 Nested Data Multilevel Modeling 42
43 Nested Data Multilevel Modeling 43

44 Nested Data Multilevel Modeling 44
45 Regularization To prevent overfitting, take parsimony into account Ridge (L 2 ) Causes regression coefficients to shrink Lasso (L 1 ) Causes some regression coefficients to become 0 Elastic Net Hybrid of other 2 45
46 Overfit Multiple Regression Model BaseballData$SeasonBattingAvg MultipleRegressionModel$fitted.values 46
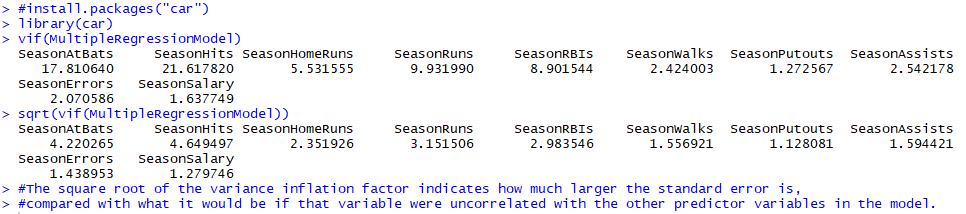
47 Multicollinearity 47
48 Ridge Regression Mean-Squared Error log(lambda) 48
49 Ridge Regression Actual Season Batting Average Predicted Season Batting Average 49
50 Lasso Regression 50
51 Elastic Net Regression 51
52 Bootstrapping Two assumptions of regression: 1. Homoscedasticity Variance of residuals does not change at levels of X 2. Residuals/errors normally distributed Can use histogram or P-P / Q-Q plot Can solve each with bootstrapping Imagine a dataset with N rows Could sample rows with replacement N times Run model with that new dataset Record results Repeat 10,000 times Provides distribution of results with a mean and standard deviation/error 52


53 Bootstrapping Three-Predictor Model 53
54 Causal Claims Correctly specified model Regression coefficients can be interpreted as causal effects if model is correctly specified Other models still valid prediction models All causes of Y that are correlated with any Xs in the model are in the model Rare, except for Random assignment Creates a correctly specified model If randomly assigned condition is a predictor, nothing is correlated to it (assuming large enough N) So model is correctly specified If add covariates, can still interpret effects of condition causally Must be able to manipulate IV If cannot, try to make model as correct as possible 54
55 Future Directions Structural Equation Modeling (SEM) Path analysis Mediation Latent variables model measurement error Factor Analysis Longitudinal data analysis Regressed change Predict t 2 from t 1 and other variables Difference scores Outcome is t 2 -t 1 MLM SEM Latent growth models Cross-lagged models Time series analyses Machine Learning 55
Introducing Generalized Linear Models: Logistic Regression
 Ron Heck, Summer 2012 Seminars 1 Multilevel Regression Models and Their Applications Seminar Introducing Generalized Linear Models: Logistic Regression The generalized linear model (GLM) represents and
Ron Heck, Fall Week 8: Introducing Generalized Linear Models: Logistic Regression 1 (Replaces prior revision dated October 20, 2011)
") Ron Heck, Fall 2011 1 EDEP 768E: Seminar in Multilevel Modeling rev. January 3, 2012 (see footnote) Week 8: Introducing Generalized Linear Models: Logistic Regression 1 (Replaces prior revision dated October
Ron Heck, Fall 2011 1 EDEP 768E: Seminar in Multilevel Modeling rev. January 3, 2012 (see footnote) Week 8: Introducing Generalized Linear Models: Logistic Regression 1 (Replaces prior revision dated October
Multilevel Modeling: A Second Course
 Multilevel Modeling: A Second Course Kristopher Preacher, Ph.D. Upcoming Seminar: February 2-3, 2017, Ft. Myers, Florida What this workshop will accomplish I will review the basics of multilevel modeling
One-Way ANOVA. Some examples of when ANOVA would be appropriate include:
 One-Way ANOVA 1. Purpose Analysis of variance (ANOVA) is used when one wishes to determine whether two or more groups (e.g., classes A, B, and C) differ on some outcome of interest (e.g., an achievement
The Application and Promise of Hierarchical Linear Modeling (HLM) in Studying First-Year Student Programs
 in Studying First-Year Student Programs") The Application and Promise of Hierarchical Linear Modeling (HLM) in Studying First-Year Student Programs Chad S. Briggs, Kathie Lorentz & Eric Davis Education & Outreach University Housing Southern Illinois
The Application and Promise of Hierarchical Linear Modeling (HLM) in Studying First-Year Student Programs Chad S. Briggs, Kathie Lorentz & Eric Davis Education & Outreach University Housing Southern Illinois
Hierarchical Generalized Linear Models. ERSH 8990 REMS Seminar on HLM Last Lecture!
 Hierarchical Generalized Linear Models ERSH 8990 REMS Seminar on HLM Last Lecture! Hierarchical Generalized Linear Models Introduction to generalized models Models for binary outcomes Interpreting parameter
Simple Linear Regression
 Simple Linear Regression 1 Correlation indicates the magnitude and direction of the linear relationship between two variables. Linear Regression: variable Y (criterion) is predicted by variable X (predictor)
Example. Multiple Regression. Review of ANOVA & Simple Regression /749 Experimental Design for Behavioral and Social Sciences
 36-309/749 Experimental Design for Behavioral and Social Sciences Sep. 29, 2015 Lecture 5: Multiple Regression Review of ANOVA & Simple Regression Both Quantitative outcome Independent, Gaussian errors
EPSY 905: Fundamentals of Multivariate Modeling Online Lecture #7
 Introduction to Generalized Univariate Models: Models for Binary Outcomes EPSY 905: Fundamentals of Multivariate Modeling Online Lecture #7 EPSY 905: Intro to Generalized In This Lecture A short review
Correlation and Linear Regression
 Correlation and Linear Regression Correlation: Relationships between Variables So far, nearly all of our discussion of inferential statistics has focused on testing for differences between group means
Categorical Predictor Variables
 Categorical Predictor Variables We often wish to use categorical (or qualitative) variables as covariates in a regression model. For binary variables (taking on only 2 values, e.g. sex), it is relatively
Ronald Heck Week 14 1 EDEP 768E: Seminar in Categorical Data Modeling (F2012) Nov. 17, 2012
 Nov. 17, 2012") Ronald Heck Week 14 1 From Single Level to Multilevel Categorical Models This week we develop a two-level model to examine the event probability for an ordinal response variable with three categories (persist
Ronald Heck Week 14 1 From Single Level to Multilevel Categorical Models This week we develop a two-level model to examine the event probability for an ordinal response variable with three categories (persist
Class Notes: Week 8. Probit versus Logit Link Functions and Count Data
 Ronald Heck Class Notes: Week 8 1 Class Notes: Week 8 Probit versus Logit Link Functions and Count Data This week we ll take up a couple of issues. The first is working with a probit link function. While
Linear Regression Measurement & Evaluation of HCC Systems
 Linear Regression Measurement & Evaluation of HCC Systems Linear Regression Today s goal: Evaluate the effect of multiple variables on an outcome variable (regression) Outline: - Basic theory - Simple
This document contains 3 sets of practice problems.
 P RACTICE PROBLEMS This document contains 3 sets of practice problems. Correlation: 3 problems Regression: 4 problems ANOVA: 8 problems You should print a copy of these practice problems and bring them
Multiple Regression. Peerapat Wongchaiwat, Ph.D.
 Peerapat Wongchaiwat, Ph.D. wongchaiwat@hotmail.com The Multiple Regression Model Examine the linear relationship between 1 dependent (Y) & 2 or more independent variables (X i ) Multiple Regression Model
DISCOVERING STATISTICS USING R
 DISCOVERING STATISTICS USING R ANDY FIELD I JEREMY MILES I ZOE FIELD Los Angeles London New Delhi Singapore j Washington DC CONTENTS Preface How to use this book Acknowledgements Dedication Symbols used
Inferences for Regression
 Inferences for Regression An Example: Body Fat and Waist Size Looking at the relationship between % body fat and waist size (in inches). Here is a scatterplot of our data set: Remembering Regression In
Activity #12: More regression topics: LOWESS; polynomial, nonlinear, robust, quantile; ANOVA as regression
 Activity #12: More regression topics: LOWESS; polynomial, nonlinear, robust, quantile; ANOVA as regression Scenario: 31 counts (over a 30-second period) were recorded from a Geiger counter at a nuclear
Psychology Seminar Psych 406 Dr. Jeffrey Leitzel
 Psychology Seminar Psych 406 Dr. Jeffrey Leitzel Structural Equation Modeling Topic 1: Correlation / Linear Regression Outline/Overview Correlations (r, pr, sr) Linear regression Multiple regression interpreting
Correlation and Regression Bangkok, 14-18, Sept. 2015
 Analysing and Understanding Learning Assessment for Evidence-based Policy Making Correlation and Regression Bangkok, 14-18, Sept. 2015 Australian Council for Educational Research Correlation The strength
Multiple Regression. More Hypothesis Testing. More Hypothesis Testing The big question: What we really want to know: What we actually know: We know:
 Multiple Regression Ψ320 Ainsworth More Hypothesis Testing What we really want to know: Is the relationship in the population we have selected between X & Y strong enough that we can use the relationship
STAT 4385 Topic 06: Model Diagnostics
 STAT 4385 Topic 06: Xiaogang Su, Ph.D. Department of Mathematical Science University of Texas at El Paso xsu@utep.edu Spring, 2016 1/ 40 Outline Several Types of Residuals Raw, Standardized, Studentized
Classification & Regression. Multicollinearity Intro to Nominal Data
 Multicollinearity Intro to Nominal Let s Start With A Question y = β 0 + β 1 x 1 +β 2 x 2 y = Anxiety Level x 1 = heart rate x 2 = recorded pulse Since we can all agree heart rate and pulse are related,
Review of the General Linear Model
 Review of the General Linear Model EPSY 905: Multivariate Analysis Online Lecture #2 Learning Objectives Types of distributions: Ø Conditional distributions The General Linear Model Ø Regression Ø Analysis
STA441: Spring Multiple Regression. This slide show is a free open source document. See the last slide for copyright information.
 STA441: Spring 2018 Multiple Regression This slide show is a free open source document. See the last slide for copyright information. 1 Least Squares Plane 2 Statistical MODEL There are p-1 explanatory
13.1 Causal effects with continuous mediator and. predictors in their equations. The definitions for the direct, total indirect,
 13 Appendix 13.1 Causal effects with continuous mediator and continuous outcome Consider the model of Section 3, y i = β 0 + β 1 m i + β 2 x i + β 3 x i m i + β 4 c i + ɛ 1i, (49) m i = γ 0 + γ 1 x i +
Final Exam. Name: Solution:
 Final Exam. Name: Instructions. Answer all questions on the exam. Open books, open notes, but no electronic devices. The first 13 problems are worth 5 points each. The rest are worth 1 point each. HW1.
Can you tell the relationship between students SAT scores and their college grades?
 Correlation One Challenge Can you tell the relationship between students SAT scores and their college grades? A: The higher SAT scores are, the better GPA may be. B: The higher SAT scores are, the lower
Correlation & Simple Regression
 Chapter 11 Correlation & Simple Regression The previous chapter dealt with inference for two categorical variables. In this chapter, we would like to examine the relationship between two quantitative variables.
26:010:557 / 26:620:557 Social Science Research Methods
 26:010:557 / 26:620:557 Social Science Research Methods Dr. Peter R. Gillett Associate Professor Department of Accounting & Information Systems Rutgers Business School Newark & New Brunswick 1 Overview
Inference in Regression Analysis
 ECNS 561 Inference Inference in Regression Analysis Up to this point 1.) OLS is unbiased 2.) OLS is BLUE (best linear unbiased estimator i.e., the variance is smallest among linear unbiased estimators)
Correlation: Relationships between Variables
 Correlation Correlation: Relationships between Variables So far, nearly all of our discussion of inferential statistics has focused on testing for differences between group means However, researchers are
Longitudinal Modeling with Logistic Regression
 Newsom 1 Longitudinal Modeling with Logistic Regression Longitudinal designs involve repeated measurements of the same individuals over time There are two general classes of analyses that correspond to
Econometrics -- Final Exam (Sample)
") Econometrics -- Final Exam (Sample) 1) The sample regression line estimated by OLS A) has an intercept that is equal to zero. B) is the same as the population regression line. C) cannot have negative and
Econometrics -- Final Exam (Sample) 1) The sample regression line estimated by OLS A) has an intercept that is equal to zero. B) is the same as the population regression line. C) cannot have negative and
Generalized Linear Models for Non-Normal Data
 Generalized Linear Models for Non-Normal Data Today s Class: 3 parts of a generalized model Models for binary outcomes Complications for generalized multivariate or multilevel models SPLH 861: Lecture
Review of Statistics 101
 Review of Statistics 101 We review some important themes from the course 1. Introduction Statistics- Set of methods for collecting/analyzing data (the art and science of learning from data). Provides methods
Estimation and Centering
 Estimation and Centering PSYED 3486 Feifei Ye University of Pittsburgh Main Topics Estimating the level-1 coefficients for a particular unit Reading: R&B, Chapter 3 (p85-94) Centering-Location of X Reading
Cheat Sheet: Linear Regression
 Cheat Sheet: Linear Regression Measurement and Evaluation of HCC Systems Scenario Use regression if you want to test the simultaneous linear effect of several variables varx1, varx2, on a continuous outcome
WU Weiterbildung. Linear Mixed Models
 Linear Mixed Effects Models WU Weiterbildung SLIDE 1 Outline 1 Estimation: ML vs. REML 2 Special Models On Two Levels Mixed ANOVA Or Random ANOVA Random Intercept Model Random Coefficients Model Intercept-and-Slopes-as-Outcomes
Machine Learning Linear Classification. Prof. Matteo Matteucci
 Machine Learning Linear Classification Prof. Matteo Matteucci Recall from the first lecture 2 X R p Regression Y R Continuous Output X R p Y {Ω 0, Ω 1,, Ω K } Classification Discrete Output X R p Y (X)
36-309/749 Experimental Design for Behavioral and Social Sciences. Dec 1, 2015 Lecture 11: Mixed Models (HLMs)
") 36-309/749 Experimental Design for Behavioral and Social Sciences Dec 1, 2015 Lecture 11: Mixed Models (HLMs) Independent Errors Assumption An error is the deviation of an individual observed outcome (DV)
36-309/749 Experimental Design for Behavioral and Social Sciences Dec 1, 2015 Lecture 11: Mixed Models (HLMs) Independent Errors Assumption An error is the deviation of an individual observed outcome (DV)
Introduction and Background to Multilevel Analysis
 Introduction and Background to Multilevel Analysis Dr. J. Kyle Roberts Southern Methodist University Simmons School of Education and Human Development Department of Teaching and Learning Background and
Logistic Regression in R. by Kerry Machemer 12/04/2015
 Logistic Regression in R by Kerry Machemer 12/04/2015 Linear Regression {y i, x i1,, x ip } Linear Regression y i = dependent variable & x i = independent variable(s) y i = α + β 1 x i1 + + β p x ip +
sphericity, 5-29, 5-32 residuals, 7-1 spread and level, 2-17 t test, 1-13 transformations, 2-15 violations, 1-19
 additive tree structure, 10-28 ADDTREE, 10-51, 10-53 EXTREE, 10-31 four point condition, 10-29 ADDTREE, 10-28, 10-51, 10-53 adjusted R 2, 8-7 ALSCAL, 10-49 ANCOVA, 9-1 assumptions, 9-5 example, 9-7 MANOVA
Extensions of One-Way ANOVA.
 Extensions of One-Way ANOVA http://www.pelagicos.net/classes_biometry_fa18.htm What do I want You to Know What are two main limitations of ANOVA? What two approaches can follow a significant ANOVA? How
Single and multiple linear regression analysis
 Single and multiple linear regression analysis Marike Cockeran 2017 Introduction Outline of the session Simple linear regression analysis SPSS example of simple linear regression analysis Additional topics
Instructions: Closed book, notes, and no electronic devices. Points (out of 200) in parentheses
 in parentheses") ISQS 5349 Final Spring 2011 Instructions: Closed book, notes, and no electronic devices. Points (out of 200) in parentheses 1. (10) What is the definition of a regression model that we have used throughout
ISQS 5349 Final Spring 2011 Instructions: Closed book, notes, and no electronic devices. Points (out of 200) in parentheses 1. (10) What is the definition of a regression model that we have used throughout
Multinomial Logistic Regression Models
 Stat 544, Lecture 19 1 Multinomial Logistic Regression Models Polytomous responses. Logistic regression can be extended to handle responses that are polytomous, i.e. taking r>2 categories. (Note: The word
Chapter 1. Modeling Basics
 Chapter 1. Modeling Basics What is a model? Model equation and probability distribution Types of model effects Writing models in matrix form Summary 1 What is a statistical model? A model is a mathematical
Investigating Models with Two or Three Categories
 Ronald H. Heck and Lynn N. Tabata 1 Investigating Models with Two or Three Categories For the past few weeks we have been working with discriminant analysis. Let s now see what the same sort of model might
Model Estimation Example
 Ronald H. Heck 1 EDEP 606: Multivariate Methods (S2013) April 7, 2013 Model Estimation Example As we have moved through the course this semester, we have encountered the concept of model estimation. Discussions
Stat 587: Key points and formulae Week 15
 Odds ratios to compare two proportions: Difference, p 1 p 2, has issues when applied to many populations Vit. C: P[cold Placebo] = 0.82, P[cold Vit. C] = 0.74, Estimated diff. is 8% What if a year or place
General linear models. One and Two-way ANOVA in SPSS Repeated measures ANOVA Multiple linear regression
 General linear models One and Two-way ANOVA in SPSS Repeated measures ANOVA Multiple linear regression 2-way ANOVA in SPSS Example 14.1 2 3 2-way ANOVA in SPSS Click Add 4 Repeated measures The stroop
Extensions of One-Way ANOVA.
 Extensions of One-Way ANOVA http://www.pelagicos.net/classes_biometry_fa17.htm What do I want You to Know What are two main limitations of ANOVA? What two approaches can follow a significant ANOVA? How
Review of Multiple Regression
 Ronald H. Heck 1 Let s begin with a little review of multiple regression this week. Linear models [e.g., correlation, t-tests, analysis of variance (ANOVA), multiple regression, path analysis, multivariate
Course Introduction and Overview Descriptive Statistics Conceptualizations of Variance Review of the General Linear Model
 Course Introduction and Overview Descriptive Statistics Conceptualizations of Variance Review of the General Linear Model EPSY 905: Multivariate Analysis Lecture 1 20 January 2016 EPSY 905: Lecture 1 -
Turning a research question into a statistical question.
 Turning a research question into a statistical question. IGINAL QUESTION: Concept Concept Concept ABOUT ONE CONCEPT ABOUT RELATIONSHIPS BETWEEN CONCEPTS TYPE OF QUESTION: DESCRIBE what s going on? DECIDE
Final Overview. Introduction to ML. Marek Petrik 4/25/2017
 Final Overview Introduction to ML Marek Petrik 4/25/2017 This Course: Introduction to Machine Learning Build a foundation for practice and research in ML Basic machine learning concepts: max likelihood,
Applied Machine Learning Annalisa Marsico
 Applied Machine Learning Annalisa Marsico OWL RNA Bionformatics group Max Planck Institute for Molecular Genetics Free University of Berlin 22 April, SoSe 2015 Goals Feature Selection rather than Feature
Regression Model Building
 Regression Model Building Setting: Possibly a large set of predictor variables (including interactions). Goal: Fit a parsimonious model that explains variation in Y with a small set of predictors Automated
Lecture 12: Effect modification, and confounding in logistic regression
 Lecture 12: Effect modification, and confounding in logistic regression Ani Manichaikul amanicha@jhsph.edu 4 May 2007 Today Categorical predictor create dummy variables just like for linear regression
Formula for the t-test
 Formula for the t-test: How the t-test Relates to the Distribution of the Data for the Groups Formula for the t-test: Formula for the Standard Error of the Difference Between the Means Formula for the
Trendlines Simple Linear Regression Multiple Linear Regression Systematic Model Building Practical Issues
 Trendlines Simple Linear Regression Multiple Linear Regression Systematic Model Building Practical Issues Overfitting Categorical Variables Interaction Terms Non-linear Terms Linear Logarithmic y = a +
Contents. 1 Review of Residuals. 2 Detecting Outliers. 3 Influential Observations. 4 Multicollinearity and its Effects
 Contents 1 Review of Residuals 2 Detecting Outliers 3 Influential Observations 4 Multicollinearity and its Effects W. Zhou (Colorado State University) STAT 540 July 6th, 2015 1 / 32 Model Diagnostics:
Mixed- Model Analysis of Variance. Sohad Murrar & Markus Brauer. University of Wisconsin- Madison. Target Word Count: Actual Word Count: 2755
 Mixed- Model Analysis of Variance Sohad Murrar & Markus Brauer University of Wisconsin- Madison The SAGE Encyclopedia of Educational Research, Measurement and Evaluation Target Word Count: 3000 - Actual
Correlation and Regression
 Correlation and Regression Dr. Bob Gee Dean Scott Bonney Professor William G. Journigan American Meridian University 1 Learning Objectives Upon successful completion of this module, the student should
Exam Applied Statistical Regression. Good Luck!
 Dr. M. Dettling Summer 2011 Exam Applied Statistical Regression Approved: Tables: Note: Any written material, calculator (without communication facility). Attached. All tests have to be done at the 5%-level.
Repeated Measures ANOVA Multivariate ANOVA and Their Relationship to Linear Mixed Models
 Repeated Measures ANOVA Multivariate ANOVA and Their Relationship to Linear Mixed Models EPSY 905: Multivariate Analysis Spring 2016 Lecture #12 April 20, 2016 EPSY 905: RM ANOVA, MANOVA, and Mixed Models
Checking model assumptions with regression diagnostics
 @graemeleehickey www.glhickey.com graeme.hickey@liverpool.ac.uk Checking model assumptions with regression diagnostics Graeme L. Hickey University of Liverpool Conflicts of interest None Assistant Editor
q3_3 MULTIPLE CHOICE. Choose the one alternative that best completes the statement or answers the question.
 q3_3 MULTIPLE CHOICE. Choose the one alternative that best completes the statement or answers the question. Provide an appropriate response. 1) In 2007, the number of wins had a mean of 81.79 with a standard
Review for Final. Chapter 1 Type of studies: anecdotal, observational, experimental Random sampling
 Review for Final For a detailed review of Chapters 1 7, please see the review sheets for exam 1 and. The following only briefly covers these sections. The final exam could contain problems that are included
Simple, Marginal, and Interaction Effects in General Linear Models
 Simple, Marginal, and Interaction Effects in General Linear Models PRE 905: Multivariate Analysis Lecture 3 Today s Class Centering and Coding Predictors Interpreting Parameters in the Model for the Means
Homework 2: Simple Linear Regression
 STAT 4385 Applied Regression Analysis Homework : Simple Linear Regression (Simple Linear Regression) Thirty (n = 30) College graduates who have recently entered the job market. For each student, the CGPA
A Re-Introduction to General Linear Models (GLM)
") A Re-Introduction to General Linear Models (GLM) Today s Class: You do know the GLM Estimation (where the numbers in the output come from): From least squares to restricted maximum likelihood (REML) Reviewing
A Re-Introduction to General Linear Models (GLM) Today s Class: You do know the GLM Estimation (where the numbers in the output come from): From least squares to restricted maximum likelihood (REML) Reviewing
Glossary for the Triola Statistics Series
 Glossary for the Triola Statistics Series Absolute deviation The measure of variation equal to the sum of the deviations of each value from the mean, divided by the number of values Acceptance sampling
FAQ: Linear and Multiple Regression Analysis: Coefficients
 Question 1: How do I calculate a least squares regression line? Answer 1: Regression analysis is a statistical tool that utilizes the relation between two or more quantitative variables so that one variable
Contents. Acknowledgments. xix
 Table of Preface Acknowledgments page xv xix 1 Introduction 1 The Role of the Computer in Data Analysis 1 Statistics: Descriptive and Inferential 2 Variables and Constants 3 The Measurement of Variables
Regression, Part I. - In correlation, it would be irrelevant if we changed the axes on our graph.
 Regression, Part I I. Difference from correlation. II. Basic idea: A) Correlation describes the relationship between two variables, where neither is independent or a predictor. - In correlation, it would
Generalized linear models
 Generalized linear models Douglas Bates November 01, 2010 Contents 1 Definition 1 2 Links 2 3 Estimating parameters 5 4 Example 6 5 Model building 8 6 Conclusions 8 7 Summary 9 1 Generalized Linear Models
Logistic Regression. Continued Psy 524 Ainsworth
 Logistic Regression Continued Psy 524 Ainsworth Equations Regression Equation Y e = 1 + A+ B X + B X + B X 1 1 2 2 3 3 i A+ B X + B X + B X e 1 1 2 2 3 3 Equations The linear part of the logistic regression
ANCOVA. ANCOVA allows the inclusion of a 3rd source of variation into the F-formula (called the covariate) and changes the F-formula
 and changes the F-formula") ANCOVA Workings of ANOVA & ANCOVA ANCOVA, Semi-Partial correlations, statistical control Using model plotting to think about ANCOVA & Statistical control You know how ANOVA works the total variation among
ANCOVA Workings of ANOVA & ANCOVA ANCOVA, Semi-Partial correlations, statistical control Using model plotting to think about ANCOVA & Statistical control You know how ANOVA works the total variation among
University of Maryland Spring Economics 422 Final Examination
 Department of Economics John C. Chao University of Maryland Spring 2009 Economics 422 Final Examination This exam contains 4 regular questions and 1 bonus question. The total number of points for the regular
Simple Linear Regression Using Ordinary Least Squares
 Simple Linear Regression Using Ordinary Least Squares Purpose: To approximate a linear relationship with a line. Reason: We want to be able to predict Y using X. Definition: The Least Squares Regression
Chapter 19 Sir Migo Mendoza
 The Linear Regression Chapter 19 Sir Migo Mendoza Linear Regression and the Line of Best Fit Lesson 19.1 Sir Migo Mendoza Question: Once we have a Linear Relationship, what can we do with it? Something
The prediction of house price
 000 001 002 003 004 005 006 007 008 009 010 011 012 013 014 015 016 017 018 019 020 021 022 023 024 025 026 027 028 029 030 031 032 033 034 035 036 037 038 039 040 041 042 043 044 045 046 047 048 049 050
A Re-Introduction to General Linear Models
 A Re-Introduction to General Linear Models Today s Class: Big picture overview Why we are using restricted maximum likelihood within MIXED instead of least squares within GLM Linear model interpretation
Comparing IRT with Other Models
 Comparing IRT with Other Models Lecture #14 ICPSR Item Response Theory Workshop Lecture #14: 1of 45 Lecture Overview The final set of slides will describe a parallel between IRT and another commonly used
Introduction to Regression
 Regression Introduction to Regression If two variables covary, we should be able to predict the value of one variable from another. Correlation only tells us how much two variables covary. In regression,
An Introduction to Multilevel Models. PSYC 943 (930): Fundamentals of Multivariate Modeling Lecture 25: December 7, 2012
: Fundamentals of Multivariate Modeling Lecture 25: December 7, 2012") An Introduction to Multilevel Models PSYC 943 (930): Fundamentals of Multivariate Modeling Lecture 25: December 7, 2012 Today s Class Concepts in Longitudinal Modeling Between-Person vs. +Within-Person
An Introduction to Multilevel Models PSYC 943 (930): Fundamentals of Multivariate Modeling Lecture 25: December 7, 2012 Today s Class Concepts in Longitudinal Modeling Between-Person vs. +Within-Person
Ron Heck, Fall Week 3: Notes Building a Two-Level Model
 Ron Heck, Fall 2011 1 EDEP 768E: Seminar on Multilevel Modeling rev. 9/6/2011@11:27pm Week 3: Notes Building a Two-Level Model We will build a model to explain student math achievement using student-level
Daniel Boduszek University of Huddersfield
 Daniel Boduszek University of Huddersfield d.boduszek@hud.ac.uk Introduction to moderator effects Hierarchical Regression analysis with continuous moderator Hierarchical Regression analysis with categorical
Introduction and Single Predictor Regression. Correlation
 Introduction and Single Predictor Regression Dr. J. Kyle Roberts Southern Methodist University Simmons School of Education and Human Development Department of Teaching and Learning Correlation A correlation
Describing Change over Time: Adding Linear Trends
 Describing Change over Time: Adding Linear Trends Longitudinal Data Analysis Workshop Section 7 University of Georgia: Institute for Interdisciplinary Research in Education and Human Development Section
Experimental Design and Data Analysis for Biologists
 Experimental Design and Data Analysis for Biologists Gerry P. Quinn Monash University Michael J. Keough University of Melbourne CAMBRIDGE UNIVERSITY PRESS Contents Preface page xv I I Introduction 1 1.1
Lecture #11: Classification & Logistic Regression
 Lecture #11: Classification & Logistic Regression CS 109A, STAT 121A, AC 209A: Data Science Weiwei Pan, Pavlos Protopapas, Kevin Rader Fall 2016 Harvard University 1 Announcements Midterm: will be graded
ISQS 5349 Spring 2013 Final Exam
 ISQS 5349 Spring 2013 Final Exam Name: General Instructions: Closed books, notes, no electronic devices. Points (out of 200) are in parentheses. Put written answers on separate paper; multiple choices
Mathematical Notation Math Introduction to Applied Statistics
 Mathematical Notation Math 113 - Introduction to Applied Statistics Name : Use Word or WordPerfect to recreate the following documents. Each article is worth 10 points and should be emailed to the instructor
Course Introduction and Overview Descriptive Statistics Conceptualizations of Variance Review of the General Linear Model
 Course Introduction and Overview Descriptive Statistics Conceptualizations of Variance Review of the General Linear Model PSYC 943 (930): Fundamentals of Multivariate Modeling Lecture 1: August 22, 2012
Ordinary Least Squares Regression Explained: Vartanian
 Ordinary Least Squares Regression Eplained: Vartanian When to Use Ordinary Least Squares Regression Analysis A. Variable types. When you have an interval/ratio scale dependent variable.. When your independent