Regression Retrieval Overview. Larry McMillin
|
|
|
- Caren Heath
- 5 years ago
- Views:
Transcription
1 Regression Retrieval Overview Larry McMillin Climate Research and Applications Division National Environmental Satellite, Data, and Information Service Washington, D.C.
2 Pick one - This is All you ever wanted to know about regression All you never wanted to know about regression
3 Overview What is regression? How correlated predictors affect the solution Synthetic regression or real regression? Regression with constraints Theory and applications Classification Normalized regression AMSU sample Recommendations
4 Regression - What are we trying to do? Obtain the estimate with the lowest RMS error. Or Obtain the true relationship
5 Which line do we want?
6 Considerations Single predictors Easy Multiple uncorrelated predictors Easy Multiple predictors with correlations Assume two predictors are highly correlated and each has a noise Difference is small with a larger noise than any of the two And that is the problem Theoretical approach is hard for these cases If there is an independent component, then you want the difference If they are perfectly correlated, then you want to average to reduce noise
7 Considerations continued Observational approach using stepwise regression Stability depends on the ratio of predictors to the predictands Stepwise steps 1. Find the predictor with the highest correlation with the predictand 2. Generate the regression coefficient 3. Make the predictands orthogonal to the selected predictor 4. Make all remaining predictors orthogonal to the selected predictor Problem When two predictors are highly correlated and one is removed, the calculation of correlation of the other one involves a division by essentially zero The other predictor is selected next The predictors end up with large coefficients of opposite sign
8 Considerations continued Consider two predictands with the same predictors Stable case (temperature for example) The correlation with the predictand is high Unstable case (water vapor for example) The correlation with the predictand is low Essentially when a selected predictor is removed from the predictand and the predictors If the residual variance of the predictand decays at least as fast as the residual variance of the predictors, the solution remains stable
9 Considerations continued Desire Damp the small eigenvectors but don t damp the regression coefficients C = YX T (XX T ) -1 But when removing the variable want to use (XX T + γι) 1 Solutions Decrease the contributions from the smaller eigenvectors This damps the slope of the regression coefficients and forces the solution towards the mean value Alternatives Increase the constraint with each step of the stepwise regression But no theory exists
10 Regression Retrievals T = T guess + C(R R guess ) R is measured R guess Measured Apples subtracted from apples (measured measured) Calculated Apples subtracted from oranges (measured calculated) This leads to a need for bias adjustment (tuning)
11 Synthetic or Real Synthetic regression use calculated radiances to generate regression coefficients Errors Can be controlled Need to be realistic Sample needs to be representative Systematic errors result if measurements and calculations are not perfectly matched Real regression - uses matches with radiosondes Compares measured to measured - no bias adjustment needed Sample size issues - sample size can be hard to achieve Sample consistency across scan spots - different samples for each angle Additional errors - match errors, truth errors
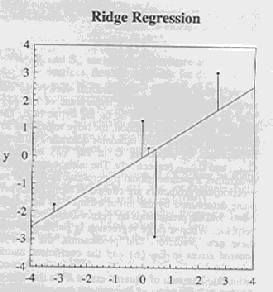
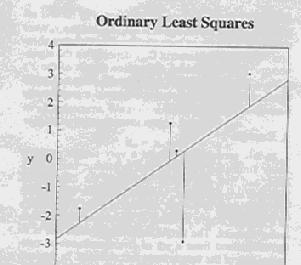
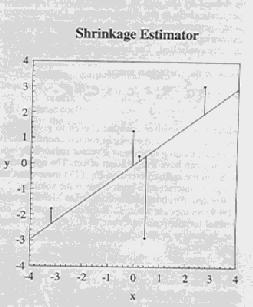
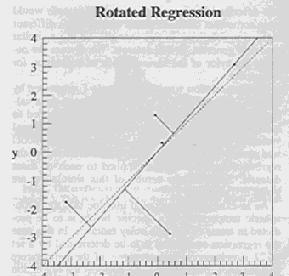
12 Regression with constraints Why add constraints? Problem is often singular or nearly so Possible regressions Normal regression Ridge regression Shrinkage Rotated regression Orthogonal regression Eigenvector regression Stepwise regression Stagewise regression Search all combinations for a subset
13 Definitions Y = predictands X = predictors C = coefficients C normal = normal coefficients C 0 = initial coefficients C ridge = ridge coefficients C shrinkage = shrinkage coefficients C rotated = rotated coefficients C orthogonal = orthogonal coefficients C eigenvector = eigenvector coefficients
14 Definitions continued γ = a constant ε = errors in y δ = errors in x X t = true value when known
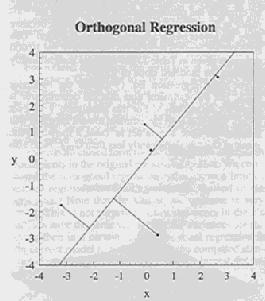
15 Equations Y = C X C normal = YX T (XX T ) 1 C ridge = YX T (XX T + γi) 1 C shrinkage = (YX T + γc 0 )(XX T + γi) 1 C rotated = (YY T C 0T + YX T + γc 0 )(C 0T YX T + XX T + γi) -1 C orthogonal = multiple rotated regression until solution converges Note many of these differ only in the directions used to calculate the components The first 3 minimize differences along the y direction Rotated minimizes differences perpendicular to the previous solution Orthogonal minimizes differences perpendicular to the final solution
16 Regression examples
17 Regression examples
18 Regression Examples
19 Constraint summary True relationship Y = 1.2 X Guess Y = 1.0 X ss = Ordinary Least Squares Y = 0.71 X ss = Ridge - gamma = 2 Y = 0.64 X ss = Shrinkage - gamma = 2 Y = 0.74 X ss = Rotated - gamma = 4 ( equivalent to gamma = 2) Y = 1.15 X ss = ss = 7.35 in rotated space Orthogonal - gamma = 4 Y = 1.22 X ss = ss = 7.29 in orthogonal space


20 Regression Examples


21 Regression Examples


22 Regression Examples

23 Regression Examples

24 Regression Examples
25 Popular myth - Or the devil is in the details Two regression can be replaced by a single one Y = C X X = D Z Y = E Z Then Y = C D Z and E = C D True for normal regression but false for any constrained regression In particular, if X is a predicted value of Y from Z using an initial set of coefficients and C is obtained using a constrained regression, then the constrain is in a direction determined by D. If this is iterated, it becomes rotated regression.
26 Regression with Classification Pro Con Starts with a good guess Decreases the signal to noise ratio Can get a series of means values With noise, the adjacent groups have jumps at the boundaries
27 normalized regression Subtract the mean from both X an Y Divide by the standard deviation Theoretically makes no difference But numerical precision is not theory Good for variables with large dynamic range Recent experience with eigenvectors suggests dividing radiances by the noise
28 Example - Tuning AMSU on AQUA Predictors are the channel values Predictands are the observed minus calculated differences

29 Measured minus calculated
30 The predictors
31 Ordinary Least Squares
32 Ridge Regression
33 Shrinkage
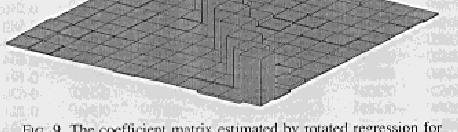
34 Rotated Regression

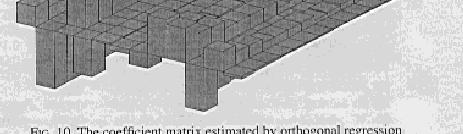
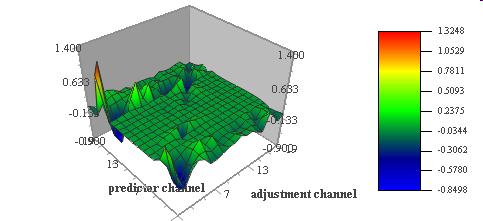
35 Orthogonal Regression
36 Results Summarized Maximum means maximum absolute value Ordinary least squares - max coefficient = Ridge regression - max coefficient = Shrinkage - max coefficient = Shrinkage to 0 as the guess coefficient is the same as ridge regression Rotated regression - max coefficient = Rotated to the ordinary least squares solution Orthogonal Regression
37 Recommendations Think Know what you are doing
Principal Component Analysis (PCA) of AIRS Data
 of AIRS Data") Principal Component Analysis (PCA) of AIRS Data Mitchell D. Goldberg 1, Lihang Zhou 2, Walter Wolf 2 and Chris Barnet 1 NOAA/NESDIS/Office of Research and Applications, Camp Springs, MD 1 QSS Group Inc.
Principal Component Analysis (PCA) of AIRS Data Mitchell D. Goldberg 1, Lihang Zhou 2, Walter Wolf 2 and Chris Barnet 1 NOAA/NESDIS/Office of Research and Applications, Camp Springs, MD 1 QSS Group Inc.
ISyE 691 Data mining and analytics
 ISyE 691 Data mining and analytics Regression Instructor: Prof. Kaibo Liu Department of Industrial and Systems Engineering UW-Madison Email: kliu8@wisc.edu Office: Room 3017 (Mechanical Engineering Building)
Linear regression methods
 Linear regression methods Most of our intuition about statistical methods stem from linear regression. For observations i = 1,..., n, the model is Y i = p X ij β j + ε i, j=1 where Y i is the response
Modeling Data with Linear Combinations of Basis Functions. Read Chapter 3 in the text by Bishop
 Modeling Data with Linear Combinations of Basis Functions Read Chapter 3 in the text by Bishop A Type of Supervised Learning Problem We want to model data (x 1, t 1 ),..., (x N, t N ), where x i is a vector
Machine Learning for Biomedical Engineering. Enrico Grisan
 Machine Learning for Biomedical Engineering Enrico Grisan enrico.grisan@dei.unipd.it Curse of dimensionality Why are more features bad? Redundant features (useless or confounding) Hard to interpret and
Data Mining Stat 588
 Data Mining Stat 588 Lecture 02: Linear Methods for Regression Department of Statistics & Biostatistics Rutgers University September 13 2011 Regression Problem Quantitative generic output variable Y. Generic
COMS 4771 Lecture Fixed-design linear regression 2. Ridge and principal components regression 3. Sparse regression and Lasso
 COMS 477 Lecture 6. Fixed-design linear regression 2. Ridge and principal components regression 3. Sparse regression and Lasso / 2 Fixed-design linear regression Fixed-design linear regression A simplified
Linear model selection and regularization
 Linear model selection and regularization Problems with linear regression with least square 1. Prediction Accuracy: linear regression has low bias but suffer from high variance, especially when n p. It
Linear Methods for Regression. Lijun Zhang
 Linear Methods for Regression Lijun Zhang zlj@nju.edu.cn http://cs.nju.edu.cn/zlj Outline Introduction Linear Regression Models and Least Squares Subset Selection Shrinkage Methods Methods Using Derived
STAT 462-Computational Data Analysis
 STAT 462-Computational Data Analysis Chapter 5- Part 2 Nasser Sadeghkhani a.sadeghkhani@queensu.ca October 2017 1 / 27 Outline Shrinkage Methods 1. Ridge Regression 2. Lasso Dimension Reduction Methods
COMS 4771 Regression. Nakul Verma
 COMS 4771 Regression Nakul Verma Last time Support Vector Machines Maximum Margin formulation Constrained Optimization Lagrange Duality Theory Convex Optimization SVM dual and Interpretation How get the
1 Least Squares Estimation - multiple regression.
 Introduction to multiple regression. Fall 2010 1 Least Squares Estimation - multiple regression. Let y = {y 1,, y n } be a n 1 vector of dependent variable observations. Let β = {β 0, β 1 } be the 2 1
Machine Learning Linear Regression. Prof. Matteo Matteucci
 Machine Learning Linear Regression Prof. Matteo Matteucci Outline 2 o Simple Linear Regression Model Least Squares Fit Measures of Fit Inference in Regression o Multi Variate Regession Model Least Squares
Linear Model Selection and Regularization
 Linear Model Selection and Regularization Recall the linear model Y = β 0 + β 1 X 1 + + β p X p + ɛ. In the lectures that follow, we consider some approaches for extending the linear model framework. In
Linear Regression Linear Regression with Shrinkage
 Linear Regression Linear Regression ith Shrinkage Introduction Regression means predicting a continuous (usually scalar) output y from a vector of continuous inputs (features) x. Example: Predicting vehicle
Lecture 14: Shrinkage
 Lecture 14: Shrinkage Reading: Section 6.2 STATS 202: Data mining and analysis October 27, 2017 1 / 19 Shrinkage methods The idea is to perform a linear regression, while regularizing or shrinking the
Ridge Regression and Ill-Conditioning
 Journal of Modern Applied Statistical Methods Volume 3 Issue Article 8-04 Ridge Regression and Ill-Conditioning Ghadban Khalaf King Khalid University, Saudi Arabia, albadran50@yahoo.com Mohamed Iguernane
Linear Regression Linear Regression with Shrinkage
 Linear Regression Linear Regression ith Shrinkage Introduction Regression means predicting a continuous (usually scalar) output y from a vector of continuous inputs (features) x. Example: Predicting vehicle
CONTENTS OF DAY 2. II. Why Random Sampling is Important 10 A myth, an urban legend, and the real reason NOTES FOR SUMMER STATISTICS INSTITUTE COURSE
 1 2 CONTENTS OF DAY 2 I. More Precise Definition of Simple Random Sample 3 Connection with independent random variables 4 Problems with small populations 9 II. Why Random Sampling is Important 10 A myth,
MS-C1620 Statistical inference
 MS-C1620 Statistical inference 10 Linear regression III Joni Virta Department of Mathematics and Systems Analysis School of Science Aalto University Academic year 2018 2019 Period III - IV 1 / 32 Contents
The NOAA Unique CrIS/ATMS Processing System (NUCAPS): first light retrieval results
: first light retrieval results") The NOAA Unique CrIS/ATMS Processing System (NUCAPS): first light retrieval results A. Gambacorta (1), C. Barnet (2), W.Wolf (2), M. Goldberg (2), T. King (1), X. Ziong (1), N. Nalli (3), E. Maddy (1),
The NOAA Unique CrIS/ATMS Processing System (NUCAPS): first light retrieval results A. Gambacorta (1), C. Barnet (2), W.Wolf (2), M. Goldberg (2), T. King (1), X. Ziong (1), N. Nalli (3), E. Maddy (1),
An evaluation of radiative transfer modelling error in AMSU-A data
 An evaluation of radiative transfer modelling error in AMSU-A data Cristina Lupu, Alan Geer, Niels Bormann and Stephen English 20 th International TOVS Study Conference, Lake Geneva, USA 28 October 2015
Linear Models: Comparing Variables. Stony Brook University CSE545, Fall 2017
 Linear Models: Comparing Variables Stony Brook University CSE545, Fall 2017 Statistical Preliminaries Random Variables Random Variables X: A mapping from Ω to ℝ that describes the question we care about
Linear Regression Models. Based on Chapter 3 of Hastie, Tibshirani and Friedman
 Linear Regression Models Based on Chapter 3 of Hastie, ibshirani and Friedman Linear Regression Models Here the X s might be: p f ( X = " + " 0 j= 1 X j Raw predictor variables (continuous or coded-categorical
Addition and subtraction: element by element, and dimensions must match.
 Matrix Essentials review: ) Matrix: Rectangular array of numbers. ) ranspose: Rows become columns and vice-versa ) single row or column is called a row or column) Vector ) R ddition and subtraction: element
High-dimensional regression
 High-dimensional regression Advanced Methods for Data Analysis 36-402/36-608) Spring 2014 1 Back to linear regression 1.1 Shortcomings Suppose that we are given outcome measurements y 1,... y n R, and
Learning with Singular Vectors
 Learning with Singular Vectors CIS 520 Lecture 30 October 2015 Barry Slaff Based on: CIS 520 Wiki Materials Slides by Jia Li (PSU) Works cited throughout Overview Linear regression: Given X, Y find w:
MS&E 226. In-Class Midterm Examination Solutions Small Data October 20, 2015
 MS&E 226 In-Class Midterm Examination Solutions Small Data October 20, 2015 PROBLEM 1. Alice uses ordinary least squares to fit a linear regression model on a dataset containing outcome data Y and covariates
Math 4329: Numerical Analysis Chapter 03: Newton s Method. Natasha S. Sharma, PhD
 Mathematical question we are interested in numerically answering How to find the x-intercepts of a function f (x)? These x-intercepts are called the roots of the equation f (x) = 0. Notation: denote the
Application of Principal Component Analysis to TES data
 Application of Principal Component Analysis to TES data Clive D Rodgers Clarendon Laboratory University of Oxford Madison, Wisconsin, 27th April 2006 1 My take on the PCA business 2/41 What is the best
Theorems. Least squares regression
 Theorems In this assignment we are trying to classify AML and ALL samples by use of penalized logistic regression. Before we indulge on the adventure of classification we should first explain the most
Simple Linear Regression for the Climate Data
 Prediction Prediction Interval Temperature 0.2 0.0 0.2 0.4 0.6 0.8 320 340 360 380 CO 2 Simple Linear Regression for the Climate Data What do we do with the data? y i = Temperature of i th Year x i =CO
Bias correction of satellite data at the Met Office
 Bias correction of satellite data at the Met Office Nigel Atkinson, James Cameron, Brett Candy and Steve English ECMWF/EUMETSAT NWP-SAF Workshop on Bias estimation and correction in data assimilation,
9/26/17. Ridge regression. What our model needs to do. Ridge Regression: L2 penalty. Ridge coefficients. Ridge coefficients
 What our model needs to do regression Usually, we are not just trying to explain observed data We want to uncover meaningful trends And predict future observations Our questions then are Is β" a good estimate
Global Soundings of the Atmosphere from ATOVS Measurements: The Algorithm and Validation
 1248 JOURNAL OF APPLIED METEOROLOGY Global Soundings of the Atmosphere from ATOVS Measurements: The Algorithm and Validation JUN LI ANDWALTER W. WOLF Cooperative Institute for Meteorological Satellite
Lecture VIII Dim. Reduction (I)
") Lecture VIII Dim. Reduction (I) Contents: Subset Selection & Shrinkage Ridge regression, Lasso PCA, PCR, PLS Lecture VIII: MLSC - Dr. Sethu Viayakumar Data From Human Movement Measure arm movement and
Lecture VIII Dim. Reduction (I) Contents: Subset Selection & Shrinkage Ridge regression, Lasso PCA, PCR, PLS Lecture VIII: MLSC - Dr. Sethu Viayakumar Data From Human Movement Measure arm movement and
Regression, Ridge Regression, Lasso
 Regression, Ridge Regression, Lasso Fabio G. Cozman - fgcozman@usp.br October 2, 2018 A general definition Regression studies the relationship between a response variable Y and covariates X 1,..., X n.
Outline Introduction OLS Design of experiments Regression. Metamodeling. ME598/494 Lecture. Max Yi Ren
 1 / 34 Metamodeling ME598/494 Lecture Max Yi Ren Department of Mechanical Engineering, Arizona State University March 1, 2015 2 / 34 1. preliminaries 1.1 motivation 1.2 ordinary least square 1.3 information
Regression Analysis: Basic Concepts
 The simple linear model Regression Analysis: Basic Concepts Allin Cottrell Represents the dependent variable, y i, as a linear function of one independent variable, x i, subject to a random disturbance
High-dimensional regression modeling
 High-dimensional regression modeling David Causeur Department of Statistics and Computer Science Agrocampus Ouest IRMAR CNRS UMR 6625 http://www.agrocampus-ouest.fr/math/causeur/ Course objectives Making
Multivariate Regression (Chapter 10)
") Multivariate Regression (Chapter 10) This week we ll cover multivariate regression and maybe a bit of canonical correlation. Today we ll mostly review univariate multivariate regression. With multivariate
Multivariate Regression (Chapter 10) This week we ll cover multivariate regression and maybe a bit of canonical correlation. Today we ll mostly review univariate multivariate regression. With multivariate
Machine Learning for OR & FE
 Machine Learning for OR & FE Regression II: Regularization and Shrinkage Methods Martin Haugh Department of Industrial Engineering and Operations Research Columbia University Email: martin.b.haugh@gmail.com
8.6 Bayesian neural networks (BNN) [Book, Sect. 6.7]
![8.6 Bayesian neural networks (BNN) [Book, Sect. 6.7]](/thumbs/81/83120300.jpg "8.6 Bayesian neural networks (BNN) [Book, Sect. 6.7]") 8.6 Bayesian neural networks (BNN) [Book, Sect. 6.7] While cross-validation allows one to find the weight penalty parameters which would give the model good generalization capability, the separation of
8.6 Bayesian neural networks (BNN) [Book, Sect. 6.7] While cross-validation allows one to find the weight penalty parameters which would give the model good generalization capability, the separation of
Simple and Multiple Linear Regression
 Sta. 113 Chapter 12 and 13 of Devore March 12, 2010 Table of contents 1 Simple Linear Regression 2 Model Simple Linear Regression A simple linear regression model is given by Y = β 0 + β 1 x + ɛ where
Next is material on matrix rank. Please see the handout
 B90.330 / C.005 NOTES for Wednesday 0.APR.7 Suppose that the model is β + ε, but ε does not have the desired variance matrix. Say that ε is normal, but Var(ε) σ W. The form of W is W w 0 0 0 0 0 0 w 0
The Perceptron algorithm
 The Perceptron algorithm Tirgul 3 November 2016 Agnostic PAC Learnability A hypothesis class H is agnostic PAC learnable if there exists a function m H : 0,1 2 N and a learning algorithm with the following
Machine Learning Linear Classification. Prof. Matteo Matteucci
 Machine Learning Linear Classification Prof. Matteo Matteucci Recall from the first lecture 2 X R p Regression Y R Continuous Output X R p Y {Ω 0, Ω 1,, Ω K } Classification Discrete Output X R p Y (X)
Retrieval Algorithm Using Super channels
 Retrieval Algorithm Using Super channels Xu Liu NASA Langley Research Center, Hampton VA 23662 D. K. Zhou, A. M. Larar (NASA LaRC) W. L. Smith (HU and UW) P. Schluessel (EUMETSAT) Hank Revercomb (UW) Jonathan
Inferences for Regression
 Inferences for Regression An Example: Body Fat and Waist Size Looking at the relationship between % body fat and waist size (in inches). Here is a scatterplot of our data set: Remembering Regression In
Variable Selection and Model Building
 LINEAR REGRESSION ANALYSIS MODULE XIII Lecture - 37 Variable Selection and Model Building Dr. Shalabh Department of Mathematics and Statistics Indian Institute of Technology Kanpur The complete regression
Simple Linear Regression Analysis
 LINEAR REGRESSION ANALYSIS MODULE II Lecture - 6 Simple Linear Regression Analysis Dr. Shalabh Department of Mathematics and Statistics Indian Institute of Technology Kanpur Prediction of values of study
Interpretation of two error statistics estimation methods: 1 - the Derozier s method 2 the NMC method (lagged forecast)
") Interpretation of two error statistics estimation methods: 1 - the Derozier s method 2 the NMC method (lagged forecast) Richard Ménard, Yan Yang and Yves Rochon Air Quality Research Division Environment
Interpretation of two error statistics estimation methods: 1 - the Derozier s method 2 the NMC method (lagged forecast) Richard Ménard, Yan Yang and Yves Rochon Air Quality Research Division Environment
APPENDIX 1 BASIC STATISTICS. Summarizing Data
 1 APPENDIX 1 Figure A1.1: Normal Distribution BASIC STATISTICS The problem that we face in financial analysis today is not having too little information but too much. Making sense of large and often contradictory
Optimal Interpolation ( 5.4) We now generalize the least squares method to obtain the OI equations for vectors of observations and background fields.
 We now generalize the least squares method to obtain the OI equations for vectors of observations and background fields.") Optimal Interpolation ( 5.4) We now generalize the least squares method to obtain the OI equations for vectors of observations and background fields. Optimal Interpolation ( 5.4) We now generalize the
Optimal Interpolation ( 5.4) We now generalize the least squares method to obtain the OI equations for vectors of observations and background fields. Optimal Interpolation ( 5.4) We now generalize the
Bias correction of satellite data at the Met Office
 Bias correction of satellite data at the Met Office Nigel Atkinson, James Cameron, Brett Candy and Stephen English Met Office, Fitzroy Road, Exeter, EX1 3PB, United Kingdom 1. Introduction At the Met Office,
COMS 4771 Introduction to Machine Learning. James McInerney Adapted from slides by Nakul Verma
 COMS 4771 Introduction to Machine Learning James McInerney Adapted from slides by Nakul Verma Announcements HW1: Please submit as a group Watch out for zero variance features (Q5) HW2 will be released
Statistical Techniques II EXST7015 Simple Linear Regression
 Statistical Techniques II EXST7015 Simple Linear Regression 03a_SLR 1 Y - the dependent variable 35 30 25 The objective Given points plotted on two coordinates, Y and X, find the best line to fit the data.
Linear Regression 9/23/17. Simple linear regression. Advertising sales: Variance changes based on # of TVs. Advertising sales: Normal error?
 Simple linear regression Linear Regression Nicole Beckage y " = β % + β ' x " + ε so y* " = β+ % + β+ ' x " Method to assess and evaluate the correlation between two (continuous) variables. The slope of
IASI Level 2 Processing
 IASI Level Processing Peter Schlüssel EUMESA Soundings from High Spectral esolution Observations Madison 06-08 May 003 EUM.EPS.SYS..03.00 Issue Slide: Outline IASI instrument properties IASI Level processor
The May 2013 SNPP Cal/Val Campaign Validation of Satellite Soundings W. L. Smith Sr., A. M. Larar, H. E. Revercomb, M. Yesalusky, and E.
 The May 2013 SNPP Cal/Val Campaign Validation of Satellite Soundings W. L. Smith Sr., A. M. Larar, H. E. Revercomb, M. Yesalusky, and E. Weisz May 2013 Suomi NPP Aircraft Campaign SHIS, NAST I, NAST M,MASTER/AVIRIS
Regression Shrinkage and Selection via the Lasso
 Regression Shrinkage and Selection via the Lasso ROBERT TIBSHIRANI, 1996 Presenter: Guiyun Feng April 27 () 1 / 20 Motivation Estimation in Linear Models: y = β T x + ɛ. data (x i, y i ), i = 1, 2,...,
December 20, MAA704, Multivariate analysis. Christopher Engström. Multivariate. analysis. Principal component analysis
 .. December 20, 2013 Todays lecture. (PCA) (PLS-R) (LDA) . (PCA) is a method often used to reduce the dimension of a large dataset to one of a more manageble size. The new dataset can then be used to make
MS&E 226: Small Data
 MS&E 226: Small Data Lecture 6: Bias and variance (v5) Ramesh Johari ramesh.johari@stanford.edu 1 / 49 Our plan today We saw in last lecture that model scoring methods seem to be trading off two different
Regression Models - Introduction
 Regression Models - Introduction In regression models there are two types of variables that are studied: A dependent variable, Y, also called response variable. It is modeled as random. An independent
COMS 4721: Machine Learning for Data Science Lecture 10, 2/21/2017
 COMS 4721: Machine Learning for Data Science Lecture 10, 2/21/2017 Prof. John Paisley Department of Electrical Engineering & Data Science Institute Columbia University FEATURE EXPANSIONS FEATURE EXPANSIONS
MSA220/MVE440 Statistical Learning for Big Data
 MSA220/MVE440 Statistical Learning for Big Data Lecture 9-10 - High-dimensional regression Rebecka Jörnsten Mathematical Sciences University of Gothenburg and Chalmers University of Technology Recap from
Ridge Regression. Summary. Sample StatFolio: ridge reg.sgp. STATGRAPHICS Rev. 10/1/2014
 Ridge Regression Summary... 1 Data Input... 4 Analysis Summary... 5 Analysis Options... 6 Ridge Trace... 7 Regression Coefficients... 8 Standardized Regression Coefficients... 9 Observed versus Predicted...
Day 4: Shrinkage Estimators
 Day 4: Shrinkage Estimators Kenneth Benoit Data Mining and Statistical Learning March 9, 2015 n versus p (aka k) Classical regression framework: n > p. Without this inequality, the OLS coefficients have
MSA220/MVE440 Statistical Learning for Big Data
 MSA220/MVE440 Statistical Learning for Big Data Lecture 7/8 - High-dimensional modeling part 1 Rebecka Jörnsten Mathematical Sciences University of Gothenburg and Chalmers University of Technology Classification
LECTURE 10: LINEAR MODEL SELECTION PT. 1. October 16, 2017 SDS 293: Machine Learning
 LECTURE 10: LINEAR MODEL SELECTION PT. 1 October 16, 2017 SDS 293: Machine Learning Outline Model selection: alternatives to least-squares Subset selection - Best subset - Stepwise selection (forward and
ACCESS TO SCIENCE, ENGINEERING AND AGRICULTURE: MATHEMATICS 1 MATH00030 SEMESTER / Lines and Their Equations
 ACCESS TO SCIENCE, ENGINEERING AND AGRICULTURE: MATHEMATICS 1 MATH00030 SEMESTER 1 017/018 DR. ANTHONY BROWN. Lines and Their Equations.1. Slope of a Line and its y-intercept. In Euclidean geometry (where
Statistical View of Least Squares
 Basic Ideas Some Examples Least Squares May 22, 2007 Basic Ideas Simple Linear Regression Basic Ideas Some Examples Least Squares Suppose we have two variables x and y Basic Ideas Simple Linear Regression
Lecture Data Science
 Web Science & Technologies University of Koblenz Landau, Germany Lecture Data Science Regression Analysis JProf. Dr. Last Time How to find parameter of a regression model Normal Equation Gradient Decent
Improved Historical Reconstructions of SST and Marine Precipitation Variations
 Improved Historical Reconstructions of SST and Marine Precipitation Variations Thomas M. Smith 1 Richard W. Reynolds 2 Phillip A. Arkin 3 Viva Banzon 2 1. NOAA/NESDIS/STAR SCSB and CICS, College Park,
Atmospheric Soundings of Temperature, Moisture and Ozone from AIRS
 Atmospheric Soundings of Temperature, Moisture and Ozone from AIRS M.D. Goldberg, W. Wolf, L. Zhou, M. Divakarla,, C.D. Barnet, L. McMillin, NOAA/NESDIS/ORA Oct 31, 2003 Presented at ITSC-13 Risk Reduction
Statistics 910, #5 1. Regression Methods
 Statistics 910, #5 1 Overview Regression Methods 1. Idea: effects of dependence 2. Examples of estimation (in R) 3. Review of regression 4. Comparisons and relative efficiencies Idea Decomposition Well-known
Lecture 18 Miscellaneous Topics in Multiple Regression
 Lecture 18 Miscellaneous Topics in Multiple Regression STAT 512 Spring 2011 Background Reading KNNL: 8.1-8.5,10.1, 11, 12 18-1 Topic Overview Polynomial Models (8.1) Interaction Models (8.2) Qualitative
CSE446: Linear Regression Regulariza5on Bias / Variance Tradeoff Winter 2015
 CSE446: Linear Regression Regulariza5on Bias / Variance Tradeoff Winter 2015 Luke ZeElemoyer Slides adapted from Carlos Guestrin Predic5on of con5nuous variables Billionaire says: Wait, that s not what
A Modern Look at Classical Multivariate Techniques
 A Modern Look at Classical Multivariate Techniques Yoonkyung Lee Department of Statistics The Ohio State University March 16-20, 2015 The 13th School of Probability and Statistics CIMAT, Guanajuato, Mexico
Consider the joint probability, P(x,y), shown as the contours in the figure above. P(x) is given by the integral of P(x,y) over all values of y.
, shown as the contours in the figure above. P(x) is given by the integral of P(x,y) over all values of y.") ATMO/OPTI 656b Spring 009 Bayesian Retrievals Note: This follows the discussion in Chapter of Rogers (000) As we have seen, the problem with the nadir viewing emission measurements is they do not contain
ATMO/OPTI 656b Spring 009 Bayesian Retrievals Note: This follows the discussion in Chapter of Rogers (000) As we have seen, the problem with the nadir viewing emission measurements is they do not contain
Extreme Values and Positive/ Negative Definite Matrix Conditions
 Extreme Values and Positive/ Negative Definite Matrix Conditions James K. Peterson Department of Biological Sciences and Department of Mathematical Sciences Clemson University November 8, 016 Outline 1
Spectral Methods for Subgraph Detection
 Spectral Methods for Subgraph Detection Nadya T. Bliss & Benjamin A. Miller Embedded and High Performance Computing Patrick J. Wolfe Statistics and Information Laboratory Harvard University 12 July 2010
MULTICOLLINEARITY AND VARIANCE INFLATION FACTORS. F. Chiaromonte 1
 MULTICOLLINEARITY AND VARIANCE INFLATION FACTORS F. Chiaromonte 1 Pool of available predictors/terms from them in the data set. Related to model selection, are the questions: What is the relative importance
Week 3: Simple Linear Regression
 Week 3: Simple Linear Regression Marcelo Coca Perraillon University of Colorado Anschutz Medical Campus Health Services Research Methods I HSMP 7607 2017 c 2017 PERRAILLON ALL RIGHTS RESERVED 1 Outline
Lectures 5 & 6: Hypothesis Testing
 Lectures 5 & 6: Hypothesis Testing in which you learn to apply the concept of statistical significance to OLS estimates, learn the concept of t values, how to use them in regression work and come across
Applied Machine Learning Annalisa Marsico
 Applied Machine Learning Annalisa Marsico OWL RNA Bionformatics group Max Planck Institute for Molecular Genetics Free University of Berlin 22 April, SoSe 2015 Goals Feature Selection rather than Feature
Sect Properties of Real Numbers and Simplifying Expressions
 Sect 1.7 - Properties of Real Numbers and Simplifying Expressions Concept #1 Commutative Properties of Real Numbers Ex. 1a 9.34 + 2.5 Ex. 1b 2.5 + ( 9.34) Ex. 1c 6.3(4.2) Ex. 1d 4.2( 6.3) a) 9.34 + 2.5
Econometric Forecasting Overview
 Econometric Forecasting Overview April 30, 2014 Econometric Forecasting Econometric models attempt to quantify the relationship between the parameter of interest (dependent variable) and a number of factors
IASI PC compression Searching for signal in the residuals. Thomas August, Nigel Atkinson, Fiona Smith
 IASI PC compression Searching for signal in the residuals Tim.Hultberg@EUMETSAT.INT Thomas August, Nigel Atkinson, Fiona Smith Raw radiance (minus background) Reconstructed radiance (minus background)
Prediction & Feature Selection in GLM
 Tarigan Statistical Consulting & Coaching statistical-coaching.ch Doctoral Program in Computer Science of the Universities of Fribourg, Geneva, Lausanne, Neuchâtel, Bern and the EPFL Hands-on Data Analysis
Stat 5100 Handout #26: Variations on OLS Linear Regression (Ch. 11, 13)
") Stat 5100 Handout #26: Variations on OLS Linear Regression (Ch. 11, 13) 1. Weighted Least Squares (textbook 11.1) Recall regression model Y = β 0 + β 1 X 1 +... + β p 1 X p 1 + ε in matrix form: (Ch. 5,
Stat 5100 Handout #26: Variations on OLS Linear Regression (Ch. 11, 13) 1. Weighted Least Squares (textbook 11.1) Recall regression model Y = β 0 + β 1 X 1 +... + β p 1 X p 1 + ε in matrix form: (Ch. 5,
Linear Regression Models
 Linear Regression Models Model Description and Model Parameters Modelling is a central theme in these notes. The idea is to develop and continuously improve a library of predictive models for hazards,
CS545 Contents XVI. Adaptive Control. Reading Assignment for Next Class. u Model Reference Adaptive Control. u Self-Tuning Regulators
 CS545 Contents XVI Adaptive Control u Model Reference Adaptive Control u Self-Tuning Regulators u Linear Regression u Recursive Least Squares u Gradient Descent u Feedback-Error Learning Reading Assignment
Linear Models. DS-GA 1013 / MATH-GA 2824 Optimization-based Data Analysis.
 Linear Models DS-GA 1013 / MATH-GA 2824 Optimization-based Data Analysis http://www.cims.nyu.edu/~cfgranda/pages/obda_fall17/index.html Carlos Fernandez-Granda Linear regression Least-squares estimation
MSA220 Statistical Learning for Big Data
 MSA220 Statistical Learning for Big Data Lecture 4 Rebecka Jörnsten Mathematical Sciences University of Gothenburg and Chalmers University of Technology More on Discriminant analysis More on Discriminant
Machine learning comes from Bayesian decision theory in statistics. There we want to minimize the expected value of the loss function.
 Bayesian learning: Machine learning comes from Bayesian decision theory in statistics. There we want to minimize the expected value of the loss function. Let y be the true label and y be the predicted
An update on the NOAA MSU/AMSU CDR development
 An update on the NOAA MSU/AMSU CDR development Cheng-Zhi Zou NOAA/NESDIS/Center for Satellite Applications and Research International TOVS Study Conferences (ITSC), Monterey, CA, April 14-20, 2010 1 Outline
CORRELATION BETWEEN ATMOSPHERIC COMPOSITION AND VERTICAL STRUCTURE AS MEASURED BY THREE GENERATIONS OF HYPERSPECTRAL SOUNDERS IN SPACE
 CORRELATION BETWEEN ATMOSPHERIC COMPOSITION AND VERTICAL STRUCTURE AS MEASURED BY THREE GENERATIONS OF HYPERSPECTRAL SOUNDERS IN SPACE Nadia Smith 1, Elisabeth Weisz 1, and Allen Huang 1 1 Space Science
GIFTS SOUNDING RETRIEVAL ALGORITHM DEVELOPMENT
 P2.32 GIFTS SOUNDING RETRIEVAL ALGORITHM DEVELOPMENT Jun Li, Fengying Sun, Suzanne Seemann, Elisabeth Weisz, and Hung-Lung Huang Cooperative Institute for Meteorological Satellite Studies (CIMSS) University
Assignment 3. Introduction to Machine Learning Prof. B. Ravindran
 Assignment 3 Introduction to Machine Learning Prof. B. Ravindran 1. In building a linear regression model for a particular data set, you observe the coefficient of one of the features having a relatively