Lecture 18 Miscellaneous Topics in Multiple Regression
|
|
|
- Janice Ward
- 5 years ago
- Views:
Transcription
1 Lecture 18 Miscellaneous Topics in Multiple Regression STAT 512 Spring 2011 Background Reading KNNL: ,10.1, 11,
2 Topic Overview Polynomial Models (8.1) Interaction Models (8.2) Qualitative Predictors ( ) Added-Variable Plots (10.1) More Complex Remedial Measures (11) Correlated (non-independent) Data (12) 18-2
3 Polynomial Models Can include 2 nd, 3 rd, 4 th, etc. order terms in models. If more than one predictor, can also include an interaction term. Useful for prediction; parameter interpretation becomes more difficult. Usually anything more than 2 nd or 3 rd order should be used with caution. 18-3
4 Polynomial Models (2) Variables X and X 2 will be correlated Intercorrelation can be reduced by centering the variables first (subtracting the mean) Instead of X, use transformation x= X X. Take squares, interactions using the transformed variables. Still equally useful for predictions as before. 18-4
5 Polynomial Models in SAS PROC STANDARD can be used to obtain centered variables. Obtain higher order terms by creating new predictor variables from the old ones, using data steps (from the centered variables). Do regression as usual, simply treating 2 things like X1, XX 1 2, etc. as additional predictors. 18-5
6 Model Building (Polynomial) Model building procedures that we ve discussed can be used. Generally include all lower order terms in the model (even if they test nonsignificant). For example, if including you would also include square and linear term. 3 X
7 Polynomial Models (Drawbacks) Intercorrelation / Multicollinearity can still be a major problem, despite centering. Uses additional degrees of freedom. Estimates may lack interpretative value. 18-7
8 Interaction Models Products of predictor variables incorporated into the model in the same way as squares, cubes, etc. Interaction means that the effect of one predictor depends on the value of the other. The model Y = β0+ β1x1+ β2x 2+ β3x1x 2+ ε can be rewritten as follows: Y = β0+ ( β1+ β3x 2) X1+ β2x 2+ ε Y = β + βx + ( β + β X ) X + ε
9 Interaction Models (2) Additive Effects no interaction (lines will be parallel) Reinforcing Effect combined effect is greater than simply adding them together Interference Effect Higher values of one variable suppress the effect of the other 18-9

10 Additive Model 18-10

11 Reinforcing Effect 18-11

12 Interference Effect 18-12
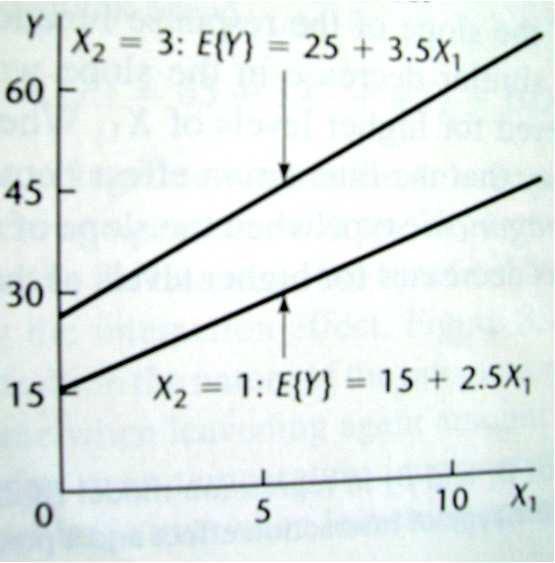
13 Qualitative Predictors X 1 takes values 0 and 1 corresponding to two different groups or categories X 2 is a continuous variable. Use this 0/1 coding along with an interaction term in the following model: Y =β +β X +β X +β X X +ε This is a convenient way of writing down two separate SLR models for the two categories
14 Qualitative Predictors (2) When X 1 = 0, the model becomes Y ( 0) X ( 0) X =β +β +β +β +ε =β +β X +ε This is a SLR model for Y as a function of X 2 with intercept β 0 and slope β 2. When X 1 = 1, the model becomes Y =β 0+β 1( 1) +β 2X 2+β 3( 1) X 2+ε = ( β +β ) + ( β +β ) X +ε This is a SLR model for Y as a function of X 2 with intercept (β 0 + β 1 ) and slope (β 2 + β 3 )
15 Qualitative Predictors (3) We could run two separate SLR for X 1 = 0, 1. But by modeling in this way, we use all the data to get the variance estimate, increasing our error degrees of freedom. Some useful tests in this situation include: - H0 : β1= β3 = 0 is the hypothesis that the regression lines are the same. - H0 : β 1= 0 is the hypothesis that the two intercepts are equal. - H0 : β 3= 0 is the hypothesis that the two slopes are equal
16 Example Y is the number of months it takes for an insurance company to adopt an innovation. X 1 is the type of firm (a qualitative or categorical variable): X 1 is 0 if it is a mutual fund firm and 1 if it is a stock fund firm. X 2 is the size of the firm (a continuous variable) SAS code: insurance.sas 18-16
 18-17")
17 Example (2) 18-17
18 Example (3) *Create the interaction variable; data insurance; set insurance; sizestock=size*stock; *Run the model and test whether the two lines are the same or different; proc reg data=insurance; model months = stock size sizestock; sameline: test stock, sizestock;run; Analysis of Variance Source DF Sum of Squares Mean Square F Value Pr > F Model <.0001 R-Square Adj R-Sq Error Corrected Total
19 Example (4) - The two lines are not the same. Test sameline Results for Dependent Variable months Source DF Mean Square F Value Pr > F Numerator Denominator The slopes are not significantly different, but the intercepts are. Parameter Estimates Variable DF Parameter Estimate Standard Error t Value Pr > t Intercept <.0001 stock size <.0001 sizestock
20 Example (5) proc reg data=insurance; model months = stock size; run; Parameter Estimates Variable DF Parameter Estimate Standard Error t Value Pr > t Intercept <.0001 stock <.0001 size <.0001 For mutual fund firms (X 1 =0), the estimated regression line is: Ŷ= X 2. For stock firms (X 1 =1), the estimated regression line is: Ŷ = ( ) X2 = X
21 Added Variable Plots Also called partial regression plots. Idea: Help you figure out the net effect of a given predictor on the response, given other variables in the model (related to partial correlations). One plot for each predictor
22 Added Variable Plots (2) To construct plot run two regressions: o Remove variation in Y due to X1. The residuals represent the variation in Y left to be explained after X1 is in the model. o Suppose you want to consider adding X2. X2 may be correlated to X1 remove this variation by regressing X2 on X1. Your residuals represent the part of X2 not explained by X
23 Added Variable Plots (3) Plot the residuals against each other a pattern suggests that X2 is an important variable (we account for X1 then leftover variation in Y is explained by what is left of X2) Additionally - the shape of the pattern suggests the type of relationship
24 Added Variable Plots (SAS) proc reg; model y = x1; output out=diag1 r=resid_y; proc reg; model x2 = x1; output out=diag2 r=resid_x2; data diag; merge diag1 diag2; proc gplot data=diag; plot resid_y = resid_x2; 18-24
25 Remedial Measures Needed for violations of assumptions (we ve discussed transformations) Needed when there are influential observations We ll mention several ideas, but not focus on any of the details. See Chapter 11 for more details
26 Weighted Least Squares Remedial measure for non-constant error variances. Regular regression estimates are still unbiased, but no longer minimum variance since observations of Y now have different variances. Observations with larger variance get less weight in the model, while more precise observations are given more weight 18-26
27 Weighted Least Squares Procedure for analysis begins by estimating weights. Some good procedures for doing this are described in the text Formulas are more complex (see, but perhaps don t try too hard to understand, p. 430) Once weights are obtained, you can use a weight statement in the regression procedure in SAS 18-27
28 Robust Regression Dampens the influence of outlying cases Several different types available, all have slightly different pros and cons IRLS (iteratively re-weighted least squares) is a common choice. o Employ weights that vary inversely with size of residual o Might read the case study in section 11.3 if you are interested
29 Bootstrap Useful for evaluating precision in nonstandard situations Example: To satisfy the assumptions of a linear regression model for the physicians data, we needed to do a log transformation. Everything was done on the log scale if we want to develop a prediction interval for a county, we might exponentiate the endpoints of the prediction interval in the log scale 18-29
30 Bootstrap (2) Example (cont) When we exponentiate, we have left the scale where the confidence intervals are valid (i.e. the assumptions no longer apply) Alternative is to obtain Bootstrap CI s Bootstrapping is further described, with some examples, in section
31 Essence of Bootstrap From original sample, take many (1000?) bootstrap samples (there are several different procedures for doing this) Estimate the value of the parameter(s) of interest for each sample. These form an empirical distribution. Use the empirical distribution to obtain a confidence interval 18-31
32 Autocorrelation / Time Series Error terms correlated over time (nonindependent) Time Series is STAT 520 we won t discuss this topic further in STAT
33 Upcoming in Lecture Introduction to ANOVA and Design of Experiments ( ) 18-33
Chapter 8 Quantitative and Qualitative Predictors
 STAT 525 FALL 2017 Chapter 8 Quantitative and Qualitative Predictors Professor Dabao Zhang Polynomial Regression Multiple regression using X 2 i, X3 i, etc as additional predictors Generates quadratic,
Lecture 10 Multiple Linear Regression
 Lecture 10 Multiple Linear Regression STAT 512 Spring 2011 Background Reading KNNL: 6.1-6.5 10-1 Topic Overview Multiple Linear Regression Model 10-2 Data for Multiple Regression Y i is the response variable
Lecture 12 Inference in MLR
 Lecture 12 Inference in MLR STAT 512 Spring 2011 Background Reading KNNL: 6.6-6.7 12-1 Topic Overview Review MLR Model Inference about Regression Parameters Estimation of Mean Response Prediction 12-2
Lecture 3: Inference in SLR
 Lecture 3: Inference in SLR STAT 51 Spring 011 Background Reading KNNL:.1.6 3-1 Topic Overview This topic will cover: Review of hypothesis testing Inference about 1 Inference about 0 Confidence Intervals
Lecture 11 Multiple Linear Regression
 Lecture 11 Multiple Linear Regression STAT 512 Spring 2011 Background Reading KNNL: 6.1-6.5 11-1 Topic Overview Review: Multiple Linear Regression (MLR) Computer Science Case Study 11-2 Multiple Regression
Lecture 13 Extra Sums of Squares
 Lecture 13 Extra Sums of Squares STAT 512 Spring 2011 Background Reading KNNL: 7.1-7.4 13-1 Topic Overview Extra Sums of Squares (Defined) Using and Interpreting R 2 and Partial-R 2 Getting ESS and Partial-R
Lecture 18: Simple Linear Regression
 Lecture 18: Simple Linear Regression BIOS 553 Department of Biostatistics University of Michigan Fall 2004 The Correlation Coefficient: r The correlation coefficient (r) is a number that measures the strength
Lecture 2 Simple Linear Regression STAT 512 Spring 2011 Background Reading KNNL: Chapter 1
 Lecture Simple Linear Regression STAT 51 Spring 011 Background Reading KNNL: Chapter 1-1 Topic Overview This topic we will cover: Regression Terminology Simple Linear Regression with a single predictor
Chapter 8: Regression Models with Qualitative Predictors
 Chapter 8: Regression Models with Qualitative Predictors Some predictors may be binary (e.g., male/female) or otherwise categorical (e.g., small/medium/large). These typically enter the regression model
Inference with Simple Regression
 1 Introduction Inference with Simple Regression Alan B. Gelder 06E:071, The University of Iowa 1 Moving to infinite means: In this course we have seen one-mean problems, twomean problems, and problems
Regression Models - Introduction
 Regression Models - Introduction In regression models there are two types of variables that are studied: A dependent variable, Y, also called response variable. It is modeled as random. An independent
Overview Scatter Plot Example
 Overview Topic 22 - Linear Regression and Correlation STAT 5 Professor Bruce Craig Consider one population but two variables For each sampling unit observe X and Y Assume linear relationship between variables
STAT 704 Sections IRLS and Bootstrap
 STAT 704 Sections 11.4-11.5. IRLS and John Grego Department of Statistics, University of South Carolina Stat 704: Data Analysis I 1 / 14 LOWESS IRLS LOWESS LOWESS (LOcally WEighted Scatterplot Smoothing)
Statistical Techniques II EXST7015 Simple Linear Regression
 Statistical Techniques II EXST7015 Simple Linear Regression 03a_SLR 1 Y - the dependent variable 35 30 25 The objective Given points plotted on two coordinates, Y and X, find the best line to fit the data.
Inference for Regression Inference about the Regression Model and Using the Regression Line, with Details. Section 10.1, 2, 3
 Inference for Regression Inference about the Regression Model and Using the Regression Line, with Details Section 10.1, 2, 3 Basic components of regression setup Target of inference: linear dependency
Categorical Predictor Variables
 Categorical Predictor Variables We often wish to use categorical (or qualitative) variables as covariates in a regression model. For binary variables (taking on only 2 values, e.g. sex), it is relatively
Chapter 14 Student Lecture Notes 14-1
 Chapter 14 Student Lecture Notes 14-1 Business Statistics: A Decision-Making Approach 6 th Edition Chapter 14 Multiple Regression Analysis and Model Building Chap 14-1 Chapter Goals After completing this
Simple linear regression
 Simple linear regression Biometry 755 Spring 2008 Simple linear regression p. 1/40 Overview of regression analysis Evaluate relationship between one or more independent variables (X 1,...,X k ) and a single
STAT 571A Advanced Statistical Regression Analysis. Chapter 8 NOTES Quantitative and Qualitative Predictors for MLR
 STAT 571A Advanced Statistical Regression Analysis Chapter 8 NOTES Quantitative and Qualitative Predictors for MLR 2015 University of Arizona Statistics GIDP. All rights reserved, except where previous
General Linear Model (Chapter 4)
") General Linear Model (Chapter 4) Outcome variable is considered continuous Simple linear regression Scatterplots OLS is BLUE under basic assumptions MSE estimates residual variance testing regression coefficients
General Linear Model (Chapter 4) Outcome variable is considered continuous Simple linear regression Scatterplots OLS is BLUE under basic assumptions MSE estimates residual variance testing regression coefficients
Chapter 14 Student Lecture Notes Department of Quantitative Methods & Information Systems. Business Statistics. Chapter 14 Multiple Regression
 Chapter 14 Student Lecture Notes 14-1 Department of Quantitative Methods & Information Systems Business Statistics Chapter 14 Multiple Regression QMIS 0 Dr. Mohammad Zainal Chapter Goals After completing
Chapter 1 Linear Regression with One Predictor
 STAT 525 FALL 2018 Chapter 1 Linear Regression with One Predictor Professor Min Zhang Goals of Regression Analysis Serve three purposes Describes an association between X and Y In some applications, the
Lecture 7 Remedial Measures
 Lecture 7 Remedial Measures STAT 512 Spring 2011 Background Reading KNNL: 3.8-3.11, Chapter 4 7-1 Topic Overview Review Assumptions & Diagnostics Remedial Measures for Non-normality Non-constant variance
Nature vs. nurture? Lecture 18 - Regression: Inference, Outliers, and Intervals. Regression Output. Conditions for inference.
 Understanding regression output from software Nature vs. nurture? Lecture 18 - Regression: Inference, Outliers, and Intervals In 1966 Cyril Burt published a paper called The genetic determination of differences
A discussion on multiple regression models
 A discussion on multiple regression models In our previous discussion of simple linear regression, we focused on a model in which one independent or explanatory variable X was used to predict the value
Basic Business Statistics, 10/e
 Chapter 4 4- Basic Business Statistics th Edition Chapter 4 Introduction to Multiple Regression Basic Business Statistics, e 9 Prentice-Hall, Inc. Chap 4- Learning Objectives In this chapter, you learn:
Statistics 5100 Spring 2018 Exam 1
 Statistics 5100 Spring 2018 Exam 1 Directions: You have 60 minutes to complete the exam. Be sure to answer every question, and do not spend too much time on any part of any question. Be concise with all
Analysis of Variance. Source DF Squares Square F Value Pr > F. Model <.0001 Error Corrected Total
 Math 221: Linear Regression and Prediction Intervals S. K. Hyde Chapter 23 (Moore, 5th Ed.) (Neter, Kutner, Nachsheim, and Wasserman) The Toluca Company manufactures refrigeration equipment as well as
Estimating σ 2. We can do simple prediction of Y and estimation of the mean of Y at any value of X.
 Estimating σ 2 We can do simple prediction of Y and estimation of the mean of Y at any value of X. To perform inferences about our regression line, we must estimate σ 2, the variance of the error term.
15.063: Communicating with Data
 15.063: Communicating with Data Summer 2003 Recitation 6 Linear Regression Today s Content Linear Regression Multiple Regression Some Problems 15.063 - Summer '03 2 Linear Regression Why? What is it? Pros?
Outline. Review regression diagnostics Remedial measures Weighted regression Ridge regression Robust regression Bootstrapping
 Topic 19: Remedies Outline Review regression diagnostics Remedial measures Weighted regression Ridge regression Robust regression Bootstrapping Regression Diagnostics Summary Check normality of the residuals
2. Outliers and inference for regression
 Unit6: Introductiontolinearregression 2. Outliers and inference for regression Sta 101 - Spring 2016 Duke University, Department of Statistical Science Dr. Çetinkaya-Rundel Slides posted at http://bit.ly/sta101_s16
Review: Second Half of Course Stat 704: Data Analysis I, Fall 2014
 Review: Second Half of Course Stat 704: Data Analysis I, Fall 2014 Tim Hanson, Ph.D. University of South Carolina T. Hanson (USC) Stat 704: Data Analysis I, Fall 2014 1 / 13 Chapter 8: Polynomials & Interactions
STAT 3A03 Applied Regression With SAS Fall 2017
 STAT 3A03 Applied Regression With SAS Fall 2017 Assignment 2 Solution Set Q. 1 I will add subscripts relating to the question part to the parameters and their estimates as well as the errors and residuals.
Chapter 3 Multiple Regression Complete Example
 Department of Quantitative Methods & Information Systems ECON 504 Chapter 3 Multiple Regression Complete Example Spring 2013 Dr. Mohammad Zainal Review Goals After completing this lecture, you should be
SMA 6304 / MIT / MIT Manufacturing Systems. Lecture 10: Data and Regression Analysis. Lecturer: Prof. Duane S. Boning
 SMA 6304 / MIT 2.853 / MIT 2.854 Manufacturing Systems Lecture 10: Data and Regression Analysis Lecturer: Prof. Duane S. Boning 1 Agenda 1. Comparison of Treatments (One Variable) Analysis of Variance
Variance. Standard deviation VAR = = value. Unbiased SD = SD = 10/23/2011. Functional Connectivity Correlation and Regression.
 10/3/011 Functional Connectivity Correlation and Regression Variance VAR = Standard deviation Standard deviation SD = Unbiased SD = 1 10/3/011 Standard error Confidence interval SE = CI = = t value for
Simple Linear Regression for the Climate Data
 Prediction Prediction Interval Temperature 0.2 0.0 0.2 0.4 0.6 0.8 320 340 360 380 CO 2 Simple Linear Regression for the Climate Data What do we do with the data? y i = Temperature of i th Year x i =CO
Regression, Part I. - In correlation, it would be irrelevant if we changed the axes on our graph.
 Regression, Part I I. Difference from correlation. II. Basic idea: A) Correlation describes the relationship between two variables, where neither is independent or a predictor. - In correlation, it would
df=degrees of freedom = n - 1
 One sample t-test test of the mean Assumptions: Independent, random samples Approximately normal distribution (from intro class: σ is unknown, need to calculate and use s (sample standard deviation)) Hypotheses:
Correlation and the Analysis of Variance Approach to Simple Linear Regression
 Correlation and the Analysis of Variance Approach to Simple Linear Regression Biometry 755 Spring 2009 Correlation and the Analysis of Variance Approach to Simple Linear Regression p. 1/35 Correlation
10. Alternative case influence statistics
 10. Alternative case influence statistics a. Alternative to D i : dffits i (and others) b. Alternative to studres i : externally-studentized residual c. Suggestion: use whatever is convenient with the
Lecture 19: Inference for SLR & Transformations
 Lecture 19: Inference for SLR & Transformations Statistics 101 Mine Çetinkaya-Rundel April 3, 2012 Announcements Announcements HW 7 due Thursday. Correlation guessing game - ends on April 12 at noon. Winner
Simple and Multiple Linear Regression
 Sta. 113 Chapter 12 and 13 of Devore March 12, 2010 Table of contents 1 Simple Linear Regression 2 Model Simple Linear Regression A simple linear regression model is given by Y = β 0 + β 1 x + ɛ where
Simple Linear Regression
 Simple Linear Regression ST 430/514 Recall: A regression model describes how a dependent variable (or response) Y is affected, on average, by one or more independent variables (or factors, or covariates)
Applied Regression Modeling: A Business Approach Chapter 3: Multiple Linear Regression Sections
 Applied Regression Modeling: A Business Approach Chapter 3: Multiple Linear Regression Sections 3.4 3.6 by Iain Pardoe 3.4 Model assumptions 2 Regression model assumptions.............................................
Statistical Modelling in Stata 5: Linear Models
 Statistical Modelling in Stata 5: Linear Models Mark Lunt Arthritis Research UK Epidemiology Unit University of Manchester 07/11/2017 Structure This Week What is a linear model? How good is my model? Does
: The model hypothesizes a relationship between the variables. The simplest probabilistic model: or.
 Chapter Simple Linear Regression : comparing means across groups : presenting relationships among numeric variables. Probabilistic Model : The model hypothesizes an relationship between the variables.
Lecture 27 Two-Way ANOVA: Interaction
 Lecture 27 Two-Way ANOVA: Interaction STAT 512 Spring 2011 Background Reading KNNL: Chapter 19 27-1 Topic Overview Review: Two-way ANOVA Models Basic Strategy for Analysis Studying Interactions 27-2 Two-way
Lecture 9 SLR in Matrix Form
 Lecture 9 SLR in Matrix Form STAT 51 Spring 011 Background Reading KNNL: Chapter 5 9-1 Topic Overview Matrix Equations for SLR Don t focus so much on the matrix arithmetic as on the form of the equations.
13 Simple Linear Regression
 B.Sc./Cert./M.Sc. Qualif. - Statistics: Theory and Practice 3 Simple Linear Regression 3. An industrial example A study was undertaken to determine the effect of stirring rate on the amount of impurity
Remedial Measures for Multiple Linear Regression Models
 Remedial Measures for Multiple Linear Regression Models Yang Feng http://www.stat.columbia.edu/~yangfeng Yang Feng (Columbia University) Remedial Measures for Multiple Linear Regression Models 1 / 25 Outline
Chapter 4. Regression Models. Learning Objectives
 Chapter 4 Regression Models To accompany Quantitative Analysis for Management, Eleventh Edition, by Render, Stair, and Hanna Power Point slides created by Brian Peterson Learning Objectives After completing
Regression Models. Chapter 4. Introduction. Introduction. Introduction
 Chapter 4 Regression Models Quantitative Analysis for Management, Tenth Edition, by Render, Stair, and Hanna 008 Prentice-Hall, Inc. Introduction Regression analysis is a very valuable tool for a manager
a. The least squares estimators of intercept and slope are (from JMP output): b 0 = 6.25 b 1 =
: b 0 = 6.25 b 1 =") Stat 28 Fall 2004 Key to Homework Exercise.10 a. There is evidence of a linear trend: winning times appear to decrease with year. A straight-line model for predicting winning times based on year is: Winning
Stat 28 Fall 2004 Key to Homework Exercise.10 a. There is evidence of a linear trend: winning times appear to decrease with year. A straight-line model for predicting winning times based on year is: Winning
STAT 3900/4950 MIDTERM TWO Name: Spring, 2015 (print: first last ) Covered topics: Two-way ANOVA, ANCOVA, SLR, MLR and correlation analysis
 Covered topics: Two-way ANOVA, ANCOVA, SLR, MLR and correlation analysis") STAT 3900/4950 MIDTERM TWO Name: Spring, 205 (print: first last ) Covered topics: Two-way ANOVA, ANCOVA, SLR, MLR and correlation analysis Instructions: You may use your books, notes, and SPSS/SAS. NO
STAT 3900/4950 MIDTERM TWO Name: Spring, 205 (print: first last ) Covered topics: Two-way ANOVA, ANCOVA, SLR, MLR and correlation analysis Instructions: You may use your books, notes, and SPSS/SAS. NO
Confidence Intervals, Testing and ANOVA Summary
 Confidence Intervals, Testing and ANOVA Summary 1 One Sample Tests 1.1 One Sample z test: Mean (σ known) Let X 1,, X n a r.s. from N(µ, σ) or n > 30. Let The test statistic is H 0 : µ = µ 0. z = x µ 0
Chapter 1: Linear Regression with One Predictor Variable also known as: Simple Linear Regression Bivariate Linear Regression
 BSTT523: Kutner et al., Chapter 1 1 Chapter 1: Linear Regression with One Predictor Variable also known as: Simple Linear Regression Bivariate Linear Regression Introduction: Functional relation between
Chapter 2 Inferences in Simple Linear Regression
 STAT 525 SPRING 2018 Chapter 2 Inferences in Simple Linear Regression Professor Min Zhang Testing for Linear Relationship Term β 1 X i defines linear relationship Will then test H 0 : β 1 = 0 Test requires
Topic 23: Diagnostics and Remedies
 Topic 23: Diagnostics and Remedies Outline Diagnostics residual checks ANOVA remedial measures Diagnostics Overview We will take the diagnostics and remedial measures that we learned for regression and
AMS 7 Correlation and Regression Lecture 8
 AMS 7 Correlation and Regression Lecture 8 Department of Applied Mathematics and Statistics, University of California, Santa Cruz Suumer 2014 1 / 18 Correlation pairs of continuous observations. Correlation
Objectives Simple linear regression. Statistical model for linear regression. Estimating the regression parameters
 Objectives 10.1 Simple linear regression Statistical model for linear regression Estimating the regression parameters Confidence interval for regression parameters Significance test for the slope Confidence
Table 1: Fish Biomass data set on 26 streams
 Math 221: Multiple Regression S. K. Hyde Chapter 27 (Moore, 5th Ed.) The following data set contains observations on the fish biomass of 26 streams. The potential regressors from which we wish to explain
Math 3330: Solution to midterm Exam
 Math 3330: Solution to midterm Exam Question 1: (14 marks) Suppose the regression model is y i = β 0 + β 1 x i + ε i, i = 1,, n, where ε i are iid Normal distribution N(0, σ 2 ). a. (2 marks) Compute the
Ch 3: Multiple Linear Regression
 Ch 3: Multiple Linear Regression 1. Multiple Linear Regression Model Multiple regression model has more than one regressor. For example, we have one response variable and two regressor variables: 1. delivery
Lecture 6 Multiple Linear Regression, cont.
 Lecture 6 Multiple Linear Regression, cont. BIOST 515 January 22, 2004 BIOST 515, Lecture 6 Testing general linear hypotheses Suppose we are interested in testing linear combinations of the regression
Chapter 16. Simple Linear Regression and dcorrelation
 Chapter 16 Simple Linear Regression and dcorrelation 16.1 Regression Analysis Our problem objective is to analyze the relationship between interval variables; regression analysis is the first tool we will
Applied Regression Analysis
 Applied Regression Analysis Lecture 2 January 27, 2005 Lecture #2-1/27/2005 Slide 1 of 46 Today s Lecture Simple linear regression. Partitioning the sum of squares. Tests of significance.. Regression diagnostics
Lecture 2. The Simple Linear Regression Model: Matrix Approach
 Lecture 2 The Simple Linear Regression Model: Matrix Approach Matrix algebra Matrix representation of simple linear regression model 1 Vectors and Matrices Where it is necessary to consider a distribution
Topic 14: Inference in Multiple Regression
 Topic 14: Inference in Multiple Regression Outline Review multiple linear regression Inference of regression coefficients Application to book example Inference of mean Application to book example Inference
Hypothesis testing Goodness of fit Multicollinearity Prediction. Applied Statistics. Lecturer: Serena Arima
 Applied Statistics Lecturer: Serena Arima Hypothesis testing for the linear model Under the Gauss-Markov assumptions and the normality of the error terms, we saw that β N(β, σ 2 (X X ) 1 ) and hence s
STA 302 H1F / 1001 HF Fall 2007 Test 1 October 24, 2007
 STA 302 H1F / 1001 HF Fall 2007 Test 1 October 24, 2007 LAST NAME: SOLUTIONS FIRST NAME: STUDENT NUMBER: ENROLLED IN: (circle one) STA 302 STA 1001 INSTRUCTIONS: Time: 90 minutes Aids allowed: calculator.
Lecture 1 Linear Regression with One Predictor Variable.p2
 Lecture Linear Regression with One Predictor Variablep - Basics - Meaning of regression parameters p - β - the slope of the regression line -it indicates the change in mean of the probability distn of
Stat 5100 Handout #26: Variations on OLS Linear Regression (Ch. 11, 13)
") Stat 5100 Handout #26: Variations on OLS Linear Regression (Ch. 11, 13) 1. Weighted Least Squares (textbook 11.1) Recall regression model Y = β 0 + β 1 X 1 +... + β p 1 X p 1 + ε in matrix form: (Ch. 5,
Stat 5100 Handout #26: Variations on OLS Linear Regression (Ch. 11, 13) 1. Weighted Least Squares (textbook 11.1) Recall regression model Y = β 0 + β 1 X 1 +... + β p 1 X p 1 + ε in matrix form: (Ch. 5,
Lecture 15 Multiple regression I Chapter 6 Set 2 Least Square Estimation The quadratic form to be minimized is
 Lecture 15 Multiple regression I Chapter 6 Set 2 Least Square Estimation The quadratic form to be minimized is Q = (Y i β 0 β 1 X i1 β 2 X i2 β p 1 X i.p 1 ) 2, which in matrix notation is Q = (Y Xβ) (Y
Inference for Regression Simple Linear Regression
 Inference for Regression Simple Linear Regression IPS Chapter 10.1 2009 W.H. Freeman and Company Objectives (IPS Chapter 10.1) Simple linear regression p Statistical model for linear regression p Estimating
Six Sigma Black Belt Study Guides
 Six Sigma Black Belt Study Guides 1 www.pmtutor.org Powered by POeT Solvers Limited. Analyze Correlation and Regression Analysis 2 www.pmtutor.org Powered by POeT Solvers Limited. Variables and relationships
Lectures on Simple Linear Regression Stat 431, Summer 2012
 Lectures on Simple Linear Regression Stat 43, Summer 0 Hyunseung Kang July 6-8, 0 Last Updated: July 8, 0 :59PM Introduction Previously, we have been investigating various properties of the population
Inference for Regression Inference about the Regression Model and Using the Regression Line
 Inference for Regression Inference about the Regression Model and Using the Regression Line PBS Chapter 10.1 and 10.2 2009 W.H. Freeman and Company Objectives (PBS Chapter 10.1 and 10.2) Inference about
Chapter 4: Regression Models
 Sales volume of company 1 Textbook: pp. 129-164 Chapter 4: Regression Models Money spent on advertising 2 Learning Objectives After completing this chapter, students will be able to: Identify variables,
22s:152 Applied Linear Regression. Take random samples from each of m populations.
 22s:152 Applied Linear Regression Chapter 8: ANOVA NOTE: We will meet in the lab on Monday October 10. One-way ANOVA Focuses on testing for differences among group means. Take random samples from each
Business Statistics. Lecture 9: Simple Regression
 Business Statistics Lecture 9: Simple Regression 1 On to Model Building! Up to now, class was about descriptive and inferential statistics Numerical and graphical summaries of data Confidence intervals
ST Correlation and Regression
 Chapter 5 ST 370 - Correlation and Regression Readings: Chapter 11.1-11.4, 11.7.2-11.8, Chapter 12.1-12.2 Recap: So far we ve learned: Why we want a random sample and how to achieve it (Sampling Scheme)
Chapter 7 Student Lecture Notes 7-1
 Chapter 7 Student Lecture Notes 7- Chapter Goals QM353: Business Statistics Chapter 7 Multiple Regression Analysis and Model Building After completing this chapter, you should be able to: Explain model
AMS 315/576 Lecture Notes. Chapter 11. Simple Linear Regression
 AMS 315/576 Lecture Notes Chapter 11. Simple Linear Regression 11.1 Motivation A restaurant opening on a reservations-only basis would like to use the number of advance reservations x to predict the number
Stat 500 Midterm 2 12 November 2009 page 0 of 11
 Stat 500 Midterm 2 12 November 2009 page 0 of 11 Please put your name on the back of your answer book. Do NOT put it on the front. Thanks. Do not start until I tell you to. The exam is closed book, closed
1 Multiple Regression
 1 Multiple Regression In this section, we extend the linear model to the case of several quantitative explanatory variables. There are many issues involved in this problem and this section serves only
Outline. Topic 22 - Interaction in Two Factor ANOVA. Interaction Not Significant. General Plan
 Topic 22 - Interaction in Two Factor ANOVA - Fall 2013 Outline Strategies for Analysis when interaction not present when interaction present when n ij = 1 when factor(s) quantitative Topic 22 2 General
Sociology 6Z03 Review II
 Sociology 6Z03 Review II John Fox McMaster University Fall 2016 John Fox (McMaster University) Sociology 6Z03 Review II Fall 2016 1 / 35 Outline: Review II Probability Part I Sampling Distributions Probability
Ch 2: Simple Linear Regression
 Ch 2: Simple Linear Regression 1. Simple Linear Regression Model A simple regression model with a single regressor x is y = β 0 + β 1 x + ɛ, where we assume that the error ɛ is independent random component
Lecture 11: Simple Linear Regression
 Lecture 11: Simple Linear Regression Readings: Sections 3.1-3.3, 11.1-11.3 Apr 17, 2009 In linear regression, we examine the association between two quantitative variables. Number of beers that you drink
22s:152 Applied Linear Regression. There are a couple commonly used models for a one-way ANOVA with m groups. Chapter 8: ANOVA
 22s:152 Applied Linear Regression Chapter 8: ANOVA NOTE: We will meet in the lab on Monday October 10. One-way ANOVA Focuses on testing for differences among group means. Take random samples from each
STOR 455 STATISTICAL METHODS I
 STOR 455 STATISTICAL METHODS I Jan Hannig Mul9variate Regression Y=X β + ε X is a regression matrix, β is a vector of parameters and ε are independent N(0,σ) Es9mated parameters b=(x X) - 1 X Y Predicted
Lecture 14 Simple Linear Regression
 Lecture 4 Simple Linear Regression Ordinary Least Squares (OLS) Consider the following simple linear regression model where, for each unit i, Y i is the dependent variable (response). X i is the independent
Inferences for Regression
 Inferences for Regression An Example: Body Fat and Waist Size Looking at the relationship between % body fat and waist size (in inches). Here is a scatterplot of our data set: Remembering Regression In
Statistics 512: Applied Linear Models. Topic 4
 Topic Overview This topic will cover General Linear Tests Extra Sums of Squares Partial Correlations Multicollinearity Model Selection Statistics 512: Applied Linear Models Topic 4 General Linear Tests
INFERENCE FOR REGRESSION
 CHAPTER 3 INFERENCE FOR REGRESSION OVERVIEW In Chapter 5 of the textbook, we first encountered regression. The assumptions that describe the regression model we use in this chapter are the following. We
Statistics for Managers using Microsoft Excel 6 th Edition
 Statistics for Managers using Microsoft Excel 6 th Edition Chapter 13 Simple Linear Regression 13-1 Learning Objectives In this chapter, you learn: How to use regression analysis to predict the value of
Analysis of Covariance. The following example illustrates a case where the covariate is affected by the treatments.
 Analysis of Covariance In some experiments, the experimental units (subjects) are nonhomogeneous or there is variation in the experimental conditions that are not due to the treatments. For example, a
Data Set 1A: Algal Photosynthesis vs. Salinity and Temperature
 Data Set A: Algal Photosynthesis vs. Salinity and Temperature Statistical setting These data are from a controlled experiment in which two quantitative variables were manipulated, to determine their effects