Causality through the stochastic system approach
|
|
|
- Teresa Murphy
- 5 years ago
- Views:
Transcription
1 Causality through the stochastic system approach Daniel Commenges INSERM, Centre de Recherche Epidémiologie et Biostatistique, Equipe Biostatistique, Bordeaux June 6, 2011
2 Organization of the talk 1. An epistemological theory of causality in epidemiology; 1.1 Levels 1.2 Systems and physical laws 2. A theory of influence between components of a stochastic process; 3. Examples: Good modeling and the WHI study.
3 An epistemological theory of causality in epidemiology We shall use the concept of cause with an extended meaning: not deterministic and plurality of causes We shall not use the counterfactual point of view We shall discuss the concept of intervention: intervention plays a central role but does not enter in the definition of causality I will begin with the story of the volcano.

4 Eruption of Vesuvius

5 Death of the inhabitants of Pompeii
6 The story of the volcano Causal link In 79 AC there was an eruption of Vesuvius and shortly after, it happened that all the inhabitants of Pompeii died. Most people would agree that there is a causal link between the two events. Although no intervention is possible It is impossible to prevent the eruption of a volcano Even if an intervention was possible it has not been implemented in Pompeii in 79
7 The story of the volcano Causal links through physical laws. Vulcanology tells us that an eruption can produce a great quantity of ashes, lava and a heat wave We know from biology that living beings cannot survive at a temperature higher than 200 C.
8 The story of the volcano Counterfactual point of view "There was no eruption of Vesuvius in 79 AC" is counterfactual Under this counterfactual assumption the inhabitants of Pompeii do not die in 79 Thus there is a causal link between eruption in 79 and death of the inhabitants in 79 For me the counterfactual point of view, although stimulating for the imagination, does not add anything to the physical law point of view.
9 The riddle of the rooster Post-hoc fallacy and the scientific approach Rooster crow is repeatedly followed by sun rise. Does the rooster crow cause the sun to rise? Causal effect can be dismissed on general scientific ground.
10 The stochastic system approach to causality Systems and physical laws Physical laws applied to a system give the correct law of the components of the system. If the evolution of a component k between t and t + t depends on the state of component j at time t then component j has a direct effect on component k: X j X X k If the evolution of a component k after t depends on the state of component j at time t then component j has a direct or indirect effect on component k. X j X X k
11 Problems and questions What is a physical law? What is a system? What is a good system? Does physical laws apply to biology, epidemiology, sociology? How does this point of view helps for distinguishing causal links from spurious associations? What can we do when we don t know the physical laws? What can we do when we don t know what is the good system? Or neither physical laws not the good system? How can we formalize influence between components? How can we compute the effects?
12 Levels Systems and physical laws are defined for a given level. Levels are specified in essentially two dimensions: Complexity: quarks, atoms, molecules, cells, organisms, societies scale: space-time size, number of entities
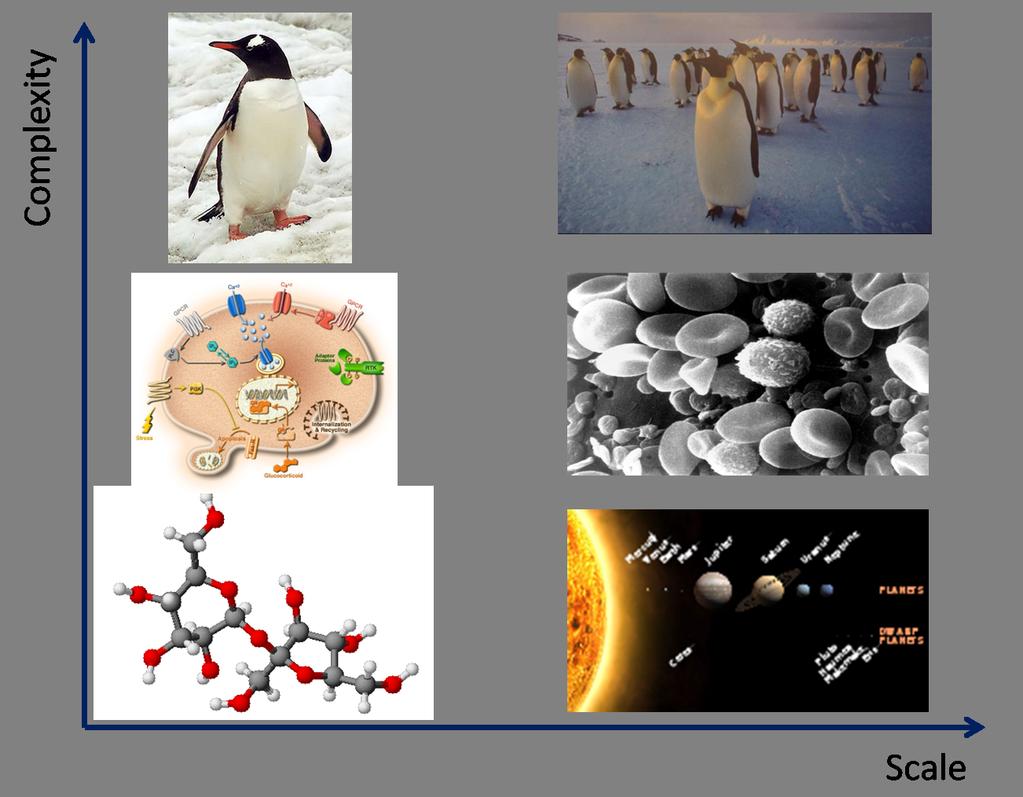

13
14 Physical laws and Systems Physical laws Rules that when applied to good (" perfect" ) systems allow to compute the law of the observed events. Intuition: the events are "produced" according to these laws. Example: Movement of the Earth conditioned on the position of the Sun, Mars and Venus. We must know both the physical laws (Newton laws) and the system to which to apply them. Distinguishing features: Wide applicability and reductionism Newton s laws can be applied to planets in the solar system and in other stellar systems, to satellites of planets; the law of mass attraction can be applied to atoms...see Pearl (2000), about "stability". Basic laws and laws at upper levels: laws at upper levels ca be explained by laws at lower level (Boltzman).
15 Levels, Physical laws and Systems Some laws are relevant at different levels: gravitation law (however negligible at particle level, main force at the level of celestial bodies) Generally different laws apply to different levels. Reductionism: Laws at one level can be grounded on laws of lower level. Example: law of ideal gases which can be explained by the (stochastic) kinetic laws of the molecules (Boltzman). Principle of emergence: Laws at one level are not mere application of the laws at a lower level. Generally at each level there is one or several particular sciences; a science can operate at different levels but there is often a privileged level.
16 Levels of epidemiology Epidemiology is mainly in between: individual level: risk factors of diseases population (human beings) level: impact of a disease (prevalence, incidence), infectious diseases At the margin of epidemiology and system biology one is interested in two levels: population of cells: interaction between virus and immune system individual level: occurrence of diseases in relation to number of CD4+ T cells
17 The scientific approach and epidemiology Causal effects in epidemiology antiretroviral treatment decreases the risk of AIDS; smoking increases the risk of lung cancer; excessive calory intake leads to obesity; obesity is a risk factor of ischemic heart disease. Causal effects rely on laws at lower level the antiretroviral may prevent new virions to be constructed after transcription of the integrated ADN of the virus; this in turn can be explained by biochemistry properties of the drug....
18 Example of a simple system Learning effects when the system is known Process of interest: D (a disease). We know which entities or states have a direct effect on D. Suppose that we find two entities G and F. Can we learn the physical law quantitatively, that is learn the effect of F on D by observation? " yes" : In any system containing both F and G the observed effect will be the causal effect. We learn by observing what happens to different systems, that is the subjects included in the sample of the study.
19 Example of a simple system Figure: Causal parents of D
20 The problem of epidemiology Both system and laws unknown Which factors modify the risk of a disease? Learning the system; What is the dynamics of this development? Learning the laws. How to learn? Advantage: we can have many replica of systems (subjects) Drawback: we have generally few longitudinal data. The situation is improving. Typically case-control studies do not have longitudinal observations, but cohorts have. Most models are inadequate in that they do not grasp the dynamics of the system. Dynamical models: Cox model, and multivariate: multistate models or joint models.
21 The problem of epidemiology Both system and laws unknown Which factors modify the risk of a disease? Learning the system; What is the dynamics of this development? Learning the laws. How to learn? Advantage: we can have many replica of systems (subjects) Drawback: we have generally few longitudinal data. The situation is improving. Typically case-control studies do not have longitudinal observations, but cohorts have. Most models are inadequate in that they do not grasp the dynamics of the system. Dynamical models: Cox model, and multivariate: multistate models or joint models.
22 A theory of influence between components of a stochastic process
23 Direct influence Doob-Meyer decomposition Let F t = F 0 X t ; F 0 contains the initial value and possibly other information. We shall consider the class of special semi-martingales, that is the class of processes which admit a unique Doob-Meyer decomposition in the (F t ) filtration, under probability P: X t = Λ t + M t, t 0, (1) where M t is a martingale and Λ t is a previsible process with bounded variation. We have defined a class D including in particular counting processes and diffusion processes.
24 Direct influence Doob-Meyer decomposition Let F t = F 0 X t ; F 0 contains the initial value and possibly other information. We shall consider the class of special semi-martingales, that is the class of processes which admit a unique Doob-Meyer decomposition in the (F t ) filtration, under probability P: X t = Λ t + M t, t 0, (1) where M t is a martingale and Λ t is a previsible process with bounded variation. We have defined a class D including in particular counting processes and diffusion processes.
25 Weak conditional local independence (WCLI) X k is WCLI of X j in X on [0, τ] if and only if Λ k is (F jt )-previsible on [0, τ], where F jt = F 0 X jt and X jt = l j X lt. Equivalently we can say in that case that X k has the same Doob-Meyer decomposition in (F t ) and in (F jt ). We will note in that case X j / X X k.
26 The differential equation representation Doob-Meyer decomposition; Λ t is differentiable with Λ t = t 0 λ udu. dx t = λ t dt + dm t, (2) Example: dx 1t = a dt + dw 1t ; dx 2t = X 1t dt + dw 2t we have X 1 X X 2 and X 2 / X X 1.
27 The differential equation representation Doob-Meyer decomposition; Λ t is differentiable with Λ t = t 0 λ udu. dx t = λ t dt + dm t, (2) Example: dx 1t = a dt + dw 1t ; dx 2t = X 1t dt + dw 2t we have X 1 X X 2 and X 2 / X X 1.
28 Joint model of HIV, immune system and disease The HIV-immune system model dt t = [λ γt t V t µ T T t ]dt dtt = [γt t V t µ T Tt ]dt dv t = [(1 ηit A )πtt µ V V t ]dt The disease-immune system model dd t = I {Dt =0}α 0 exp(β 1 T t + β 2 Z )dt + dm t, Guedj, Commenges, Thiébaut, Biometrics, 2011.
29 Figure: Graph for HIV: A: anti-protease; T: uninfected CD4; T*: infected CD4; D: clinical events.
30 Intervention systems Figure: Intervention system Figure: Observation system
31 Marginal causal effect F D U Figure: Imperfect intervention system Marginal causal effect: the effect of F on D in this (imperfect) intervention system: the way the law of D changes as one changes the value f taken by F.
32 Marginal causal effect Effect can be specified by: P(D t = 1 F = f ) = S(t f ). Generally, for G a time-constant process taking values 0 or 1 for all t : S(t f ) = P(G = 1 F = f )S(t f, G = 1)+P(G = 0 F = f )S(t f, G = 0) In the intervention system P(G = 1 F = f ) = P(G = 1). Thus: S I (t f ) = P(G = 1)S(t f, G = 1) + P(G = 0)S(t f, G = 0)
33 Computation of the marginal causal effect from an observational system From observation of a large number of replica of the good "observation system", we learn S(t f, G = 1 and S(t f, G = 0), and also the marginal distribution of G. Thus we can compute S I (t f ) = P(G = 1)S(t f, G = 1) + P(G = 0)S(t f, G = 0)
34 Imperfect observation system Rather than using the perfect system: Figure: Perfect observation system we use the imperfect system: Figure: Imperfect observation system
35 Observed effect in imperfect observation systems We learn: S O (t f ) = P(G = 1 F = f )S(t f, G = 1)+P(G = 0 F = f )S(t f, G = 0), This is different from S I (t f ) when G has an influence on F.
36 Limitations of observation systems Confounders We are never sure that we have a perfect system; thus confounding is always possible. Limitations of the marginal causal effect Emphasis on marginal causal effects: the so called back-door criterion for instance (Pearl, 2000: 3.3.1) gives conditions under which it can be computed. Dynamics better described in terms of causal effects including all the causal parents. S(t f, G) is more precise that S(t f ) For instance a treatment may be more efficient (or have less adverse effects) in subjects having a specific genotype or risk factor. Example of Statins: Give statins to every body to decrease CHD risk?
37 Limitations of intervention systems Excessive confidence in the fact that the intervention trial will yield the marginal causal effect leads to a lack of modeling highly selected short term studies small number (often 2) of modalities
38 The example of the Women s Health Initiative (WHI) Conflict between observation and intervention in the WHI Observational research on postmenopausal hormone therapy: 40 50% reduction in coronary heart disease incidence Clinical trial of the WHI estrogen plus progestin found an elevated incidence. Comparison between results from the WHI trial and observational study WHI observational study: 53,054 women 33% of whom were estrogen-plus-progestin users at baseline Trial:16,608 postmenopausal women aged years, Prentice et al. (2005), American J. Epidemiol.
39 Reconciliating observation and intervention in the WHI Adjusting Adjustment Trial: HR Observation: HR Crude incidence ratio Age-adjusted Adjusted on risk factors Crossing hazards Time Trial HR 95% CI Observation HR 95% CI < , , , , 1.58 > , , 1.01
40 Good modeling and common sense Good modeling Good modeling aims at identifying all the main factor which are causal parents of a process of interest Good modeling aims at estimating the effect of the main factors. For this, it is necessary to have a flexible model and to take into account the way observations have been collected: sampling scheme, incomplete observations. Bradford-Hill criteria Even if we can go beyond thanks to sophisticated statistics, the Bradford-Hill criteria remain relevant for practical epidemiology.
41 Bradford Hill Criteria 1. Strength of association (odds ratio) 2. Consistency 3. Specificity 4. Temporal relationship (temporality) - not heuristic; factually necessary for cause to precede consequence 5. Biological gradient (dose-response relationship) 6. Plausibility (biological plausibility) 7. Coherence 8. Experiment (reversibility) 9. Analogy (consideration of alternate explanations) Austin Bradford Hill (1965), "The Environment and Disease: Association or Causation?," Proceedings of the Royal Society of Medicine.
42 The Dynamic models approach to causality Granger, C. W. J Investigating causal relations by econometric models and cross-spectral methods. Econometrica 37, Aalen, O. (1987) Dynamic modeling and causality. Scand. Actuarial J. 1987, Didelez, V., Graphical models for marked point processes based on local independence, JRSS-B, 70, Fosen, J., Ferkingstad, E., Borgan, O and Aalen, O.O. (2006) Dynamic path analysis: a new approach to analyzing time-dependent covariates. Lifetime Data Analysis 12, Daniel Commenges and Anne Gégout-Petit (2009) A general dynamical model with causal interpretation. JRRS-B 71, part 4, Anne Gégout-Petit and Daniel Commenges (2010) A general definition of influence between stochastic processes. Lifetime Data Analysis 16,
Causality II: How does causal inference fit into public health and what it is the role of statistics?
 Causality II: How does causal inference fit into public health and what it is the role of statistics? Statistics for Psychosocial Research II November 13, 2006 1 Outline Potential Outcomes / Counterfactual
Bounding the Probability of Causation in Mediation Analysis
 arxiv:1411.2636v1 [math.st] 10 Nov 2014 Bounding the Probability of Causation in Mediation Analysis A. P. Dawid R. Murtas M. Musio February 16, 2018 Abstract Given empirical evidence for the dependence
A Decision Theoretic Approach to Causality
 A Decision Theoretic Approach to Causality Vanessa Didelez School of Mathematics University of Bristol (based on joint work with Philip Dawid) Bordeaux, June 2011 Based on: Dawid & Didelez (2010). Identifying
University of California, Berkeley
 University of California, Berkeley U.C. Berkeley Division of Biostatistics Working Paper Series Year 2004 Paper 155 Estimation of Direct and Indirect Causal Effects in Longitudinal Studies Mark J. van
MA/ST 810 Mathematical-Statistical Modeling and Analysis of Complex Systems
 MA/ST 810 Mathematical-Statistical Modeling and Analysis of Complex Systems Integrating Mathematical and Statistical Models Recap of mathematical models Models and data Statistical models and sources of
CAUSAL INFERENCE IN THE EMPIRICAL SCIENCES. Judea Pearl University of California Los Angeles (www.cs.ucla.edu/~judea)
") CAUSAL INFERENCE IN THE EMPIRICAL SCIENCES Judea Pearl University of California Los Angeles (www.cs.ucla.edu/~judea) OUTLINE Inference: Statistical vs. Causal distinctions and mental barriers Formal semantics
CAUSAL INFERENCE IN THE EMPIRICAL SCIENCES Judea Pearl University of California Los Angeles (www.cs.ucla.edu/~judea) OUTLINE Inference: Statistical vs. Causal distinctions and mental barriers Formal semantics
Lecture 5: ANOVA and Correlation
 Lecture 5: ANOVA and Correlation Ani Manichaikul amanicha@jhsph.edu 23 April 2007 1 / 62 Comparing Multiple Groups Continous data: comparing means Analysis of variance Binary data: comparing proportions
Effects of multiple interventions
 Chapter 28 Effects of multiple interventions James Robins, Miguel Hernan and Uwe Siebert 1. Introduction The purpose of this chapter is (i) to describe some currently available analytical methods for using
Estimation of direct causal effects.
 University of California, Berkeley From the SelectedWorks of Maya Petersen May, 2006 Estimation of direct causal effects. Maya L Petersen, University of California, Berkeley Sandra E Sinisi Mark J van
Mediation analyses. Advanced Psychometrics Methods in Cognitive Aging Research Workshop. June 6, 2016
 Mediation analyses Advanced Psychometrics Methods in Cognitive Aging Research Workshop June 6, 2016 1 / 40 1 2 3 4 5 2 / 40 Goals for today Motivate mediation analysis Survey rapidly developing field in
Comparative effectiveness of dynamic treatment regimes
 Comparative effectiveness of dynamic treatment regimes An application of the parametric g- formula Miguel Hernán Departments of Epidemiology and Biostatistics Harvard School of Public Health www.hsph.harvard.edu/causal
Causal Inference. Miguel A. Hernán, James M. Robins. May 19, 2017
 Causal Inference Miguel A. Hernán, James M. Robins May 19, 2017 ii Causal Inference Part III Causal inference from complex longitudinal data Chapter 19 TIME-VARYING TREATMENTS So far this book has dealt
Thursday. Threshold and Sensitivity Analysis
 Thursday Threshold and Sensitivity Analysis SIR Model without Demography ds dt di dt dr dt = βsi (2.1) = βsi γi (2.2) = γi (2.3) With initial conditions S(0) > 0, I(0) > 0, and R(0) = 0. This model can
OUTLINE THE MATHEMATICS OF CAUSAL INFERENCE IN STATISTICS. Judea Pearl University of California Los Angeles (www.cs.ucla.
 THE MATHEMATICS OF CAUSAL INFERENCE IN STATISTICS Judea Pearl University of California Los Angeles (www.cs.ucla.edu/~judea) OUTLINE Modeling: Statistical vs. Causal Causal Models and Identifiability to
Estimating the treatment effect on the treated under time-dependent confounding in an application to the Swiss HIV Cohort Study
 Appl. Statist. (2018) 67, Part 1, pp. 103 125 Estimating the treatment effect on the treated under time-dependent confounding in an application to the Swiss HIV Cohort Study Jon Michael Gran, Oslo University
Introduction to Causal Calculus
 Introduction to Causal Calculus Sanna Tyrväinen University of British Columbia August 1, 2017 1 / 1 2 / 1 Bayesian network Bayesian networks are Directed Acyclic Graphs (DAGs) whose nodes represent random
Multi-state Models: An Overview
 Multi-state Models: An Overview Andrew Titman Lancaster University 14 April 2016 Overview Introduction to multi-state modelling Examples of applications Continuously observed processes Intermittently observed
Lecture 7 Time-dependent Covariates in Cox Regression
 Lecture 7 Time-dependent Covariates in Cox Regression So far, we ve been considering the following Cox PH model: λ(t Z) = λ 0 (t) exp(β Z) = λ 0 (t) exp( β j Z j ) where β j is the parameter for the the
Estimating direct effects in cohort and case-control studies
 Estimating direct effects in cohort and case-control studies, Ghent University Direct effects Introduction Motivation The problem of standard approaches Controlled direct effect models In many research
Learning Causality. Sargur N. Srihari. University at Buffalo, The State University of New York USA
 Learning Causality Sargur N. Srihari University at Buffalo, The State University of New York USA 1 Plan of Discussion Bayesian Networks Causal Models Learning Causal Models 2 BN and Complexity of Prob
Sensitivity analysis and distributional assumptions
 Sensitivity analysis and distributional assumptions Tyler J. VanderWeele Department of Health Studies, University of Chicago 5841 South Maryland Avenue, MC 2007, Chicago, IL 60637, USA vanderweele@uchicago.edu
Chapter 2: Describing Contingency Tables - I
 : Describing Contingency Tables - I Dipankar Bandyopadhyay Department of Biostatistics, Virginia Commonwealth University BIOS 625: Categorical Data & GLM [Acknowledgements to Tim Hanson and Haitao Chu]
STAT331. Cox s Proportional Hazards Model
 STAT331 Cox s Proportional Hazards Model In this unit we introduce Cox s proportional hazards (Cox s PH) model, give a heuristic development of the partial likelihood function, and discuss adaptations
Statistics in medicine
 Statistics in medicine Lecture 3: Bivariate association : Categorical variables Proportion in one group One group is measured one time: z test Use the z distribution as an approximation to the binomial
Statistics in medicine
 Statistics in medicine Lecture 4: and multivariable regression Fatma Shebl, MD, MS, MPH, PhD Assistant Professor Chronic Disease Epidemiology Department Yale School of Public Health Fatma.shebl@yale.edu
Part IV Extensions: Competing Risks Endpoints and Non-Parametric AUC(t) Estimation
 Estimation") Part IV Extensions: Competing Risks Endpoints and Non-Parametric AUC(t) Estimation Patrick J. Heagerty PhD Department of Biostatistics University of Washington 166 ISCB 2010 Session Four Outline Examples
Part IV Extensions: Competing Risks Endpoints and Non-Parametric AUC(t) Estimation Patrick J. Heagerty PhD Department of Biostatistics University of Washington 166 ISCB 2010 Session Four Outline Examples
Flexible modelling of the cumulative effects of time-varying exposures
 Flexible modelling of the cumulative effects of time-varying exposures Applications in environmental, cancer and pharmaco-epidemiology Antonio Gasparrini Department of Medical Statistics London School
Causal Effect Evaluation and Causal Network Learning
 and Peking University, China June 25, 2014 and Outline 1 Yule-Simpson paradox Causal effects Surrogate and surrogate paradox 2 and Outline Yule-Simpson paradox Causal effects Surrogate and surrogate paradox
Causal Effect Models for Realistic Individualized Treatment and Intention to Treat Rules
 University of California, Berkeley From the SelectedWorks of Maya Petersen March, 2007 Causal Effect Models for Realistic Individualized Treatment and Intention to Treat Rules Mark J van der Laan, University
Causal Bayesian networks. Peter Antal
 Causal Bayesian networks Peter Antal antal@mit.bme.hu A.I. 4/8/2015 1 Can we represent exactly (in)dependencies by a BN? From a causal model? Suff.&nec.? Can we interpret edges as causal relations with
Faculty of Health Sciences. Regression models. Counts, Poisson regression, Lene Theil Skovgaard. Dept. of Biostatistics
 Faculty of Health Sciences Regression models Counts, Poisson regression, 27-5-2013 Lene Theil Skovgaard Dept. of Biostatistics 1 / 36 Count outcome PKA & LTS, Sect. 7.2 Poisson regression The Binomial
arxiv: v2 [math.st] 4 Mar 2013
![arxiv: v2 [math.st] 4 Mar 2013](/thumbs/88/117168523.jpg "arxiv: v2 [math.st] 4 Mar 2013") Running head:: LONGITUDINAL MEDIATION ANALYSIS 1 arxiv:1205.0241v2 [math.st] 4 Mar 2013 Counterfactual Graphical Models for Longitudinal Mediation Analysis with Unobserved Confounding Ilya Shpitser School
Running head:: LONGITUDINAL MEDIATION ANALYSIS 1 arxiv:1205.0241v2 [math.st] 4 Mar 2013 Counterfactual Graphical Models for Longitudinal Mediation Analysis with Unobserved Confounding Ilya Shpitser School
Simulating from Marginal Structural Models with Time-Dependent Confounding
 Research Article Received XXXX (www.interscience.wiley.com) DOI: 10.1002/sim.0000 Simulating from Marginal Structural Models with Time-Dependent Confounding W. G. Havercroft and V. Didelez We discuss why
GIS and Health Geography. What is epidemiology?
 GIS and Health Geography { What is epidemiology? TOC GIS and health geography Major applications for GIS Epidemiology What is health (and how location matters) What is a disease (and how to identify one)
CAUSALITY. Models, Reasoning, and Inference 1 CAMBRIDGE UNIVERSITY PRESS. Judea Pearl. University of California, Los Angeles
 CAUSALITY Models, Reasoning, and Inference Judea Pearl University of California, Los Angeles 1 CAMBRIDGE UNIVERSITY PRESS Preface page xiii 1 Introduction to Probabilities, Graphs, and Causal Models 1
Gov 2002: 4. Observational Studies and Confounding
 Gov 2002: 4. Observational Studies and Confounding Matthew Blackwell September 10, 2015 Where are we? Where are we going? Last two weeks: randomized experiments. From here on: observational studies. What
ANALYTIC COMPARISON. Pearl and Rubin CAUSAL FRAMEWORKS
 ANALYTIC COMPARISON of Pearl and Rubin CAUSAL FRAMEWORKS Content Page Part I. General Considerations Chapter 1. What is the question? 16 Introduction 16 1. Randomization 17 1.1 An Example of Randomization
Multistate Modelling Vertical Transmission and Determination of R 0 Using Transition Intensities
 Applied Mathematical Sciences, Vol. 9, 2015, no. 79, 3941-3956 HIKARI Ltd, www.m-hikari.com http://dx.doi.org/10.12988/ams.2015.52130 Multistate Modelling Vertical Transmission and Determination of R 0
Mendelian randomization as an instrumental variable approach to causal inference
 Statistical Methods in Medical Research 2007; 16: 309 330 Mendelian randomization as an instrumental variable approach to causal inference Vanessa Didelez Departments of Statistical Science, University
OF CAUSAL INFERENCE THE MATHEMATICS IN STATISTICS. Department of Computer Science. Judea Pearl UCLA
 THE MATHEMATICS OF CAUSAL INFERENCE IN STATISTICS Judea earl Department of Computer Science UCLA OUTLINE Statistical vs. Causal Modeling: distinction and mental barriers N-R vs. structural model: strengths
Can we believe the DAGs? A comment on the relationship between causal DAGs and mechanisms
 Article Can we believe the DAGs? A comment on the relationship between causal DAGs and mechanisms Statistical Methods in Medical Research 216, Vol. 25(5) 2294 2314! The Author(s) 214 Reprints and permissions:
Bayesian networks as causal models. Peter Antal
 Bayesian networks as causal models Peter Antal antal@mit.bme.hu A.I. 3/20/2018 1 Can we represent exactly (in)dependencies by a BN? From a causal model? Suff.&nec.? Can we interpret edges as causal relations
Clinical Trials. Olli Saarela. September 18, Dalla Lana School of Public Health University of Toronto.
 Introduction to Dalla Lana School of Public Health University of Toronto olli.saarela@utoronto.ca September 18, 2014 38-1 : a review 38-2 Evidence Ideal: to advance the knowledge-base of clinical medicine,
Probabilistic Causal Models
 Probabilistic Causal Models A Short Introduction Robin J. Evans www.stat.washington.edu/ rje42 ACMS Seminar, University of Washington 24th February 2011 1/26 Acknowledgements This work is joint with Thomas
Chapter 14. Statistical versus Deterministic Relationships. Distance versus Speed. Describing Relationships: Scatterplots and Correlation
 Chapter 14 Describing Relationships: Scatterplots and Correlation Chapter 14 1 Statistical versus Deterministic Relationships Distance versus Speed (when travel time is constant). Income (in millions of
Causal Inference. Prediction and causation are very different. Typical questions are:
 Causal Inference Prediction and causation are very different. Typical questions are: Prediction: Predict Y after observing X = x Causation: Predict Y after setting X = x. Causation involves predicting
Does Cox analysis of a randomized survival study yield a causal treatment effect?
 Published in final edited form as: Lifetime Data Analysis (2015), 21(4): 579 593 DOI: 10.1007/s10985-015-9335-y Does Cox analysis of a randomized survival study yield a causal treatment effect? Odd O.
Math 6330: Statistical Consulting Class 5
 Math 6330: Statistical Consulting Class 5 Tony Cox tcoxdenver@aol.com University of Colorado at Denver Course web site: http://cox-associates.com/6330/ What is a predictive model? The probability that
Biostatistics: Correlations
 Biostatistics: s One of the most common errors we find in the press is the confusion between correlation and causation in scientific and health-related studies. In theory, these are easy to distinguish
Multivariate Survival Data With Censoring.
 1 Multivariate Survival Data With Censoring. Shulamith Gross and Catherine Huber-Carol Baruch College of the City University of New York, Dept of Statistics and CIS, Box 11-220, 1 Baruch way, 10010 NY.
Approximation of Survival Function by Taylor Series for General Partly Interval Censored Data
 Malaysian Journal of Mathematical Sciences 11(3): 33 315 (217) MALAYSIAN JOURNAL OF MATHEMATICAL SCIENCES Journal homepage: http://einspem.upm.edu.my/journal Approximation of Survival Function by Taylor
Probability and Probability Distributions. Dr. Mohammed Alahmed
 Probability and Probability Distributions 1 Probability and Probability Distributions Usually we want to do more with data than just describing them! We might want to test certain specific inferences about
From Causality, Second edition, Contents
 From Causality, Second edition, 2009. Preface to the First Edition Preface to the Second Edition page xv xix 1 Introduction to Probabilities, Graphs, and Causal Models 1 1.1 Introduction to Probability
Dynamic analysis of binary longitudinal data
 Dynamic analysis of binary longitudinal data Ørnulf Borgan Department of Mathematics University of Oslo Based on joint work with Rosemeire L. Fiaccone, Robin Henderson and Mauricio L. Barreto 1 Outline:
Help! Statistics! Mediation Analysis
 Help! Statistics! Lunch time lectures Help! Statistics! Mediation Analysis What? Frequently used statistical methods and questions in a manageable timeframe for all researchers at the UMCG. No knowledge
Attributable Risk Function in the Proportional Hazards Model
 UW Biostatistics Working Paper Series 5-31-2005 Attributable Risk Function in the Proportional Hazards Model Ying Qing Chen Fred Hutchinson Cancer Research Center, yqchen@u.washington.edu Chengcheng Hu
On the Use of the Bross Formula for Prioritizing Covariates in the High-Dimensional Propensity Score Algorithm
 On the Use of the Bross Formula for Prioritizing Covariates in the High-Dimensional Propensity Score Algorithm Richard Wyss 1, Bruce Fireman 2, Jeremy A. Rassen 3, Sebastian Schneeweiss 1 Author Affiliations:
Bounds on Direct Effects in the Presence of Confounded Intermediate Variables
 Bounds on Direct Effects in the Presence of Confounded Intermediate Variables Zhihong Cai, 1, Manabu Kuroki, 2 Judea Pearl 3 and Jin Tian 4 1 Department of Biostatistics, Kyoto University Yoshida-Konoe-cho,
Online supplement. Absolute Value of Lung Function (FEV 1 or FVC) Explains the Sex Difference in. Breathlessness in the General Population
 Explains the Sex Difference in. Breathlessness in the General Population") Online supplement Absolute Value of Lung Function (FEV 1 or FVC) Explains the Sex Difference in Breathlessness in the General Population Table S1. Comparison between patients who were excluded or included
Online supplement Absolute Value of Lung Function (FEV 1 or FVC) Explains the Sex Difference in Breathlessness in the General Population Table S1. Comparison between patients who were excluded or included
Econometric Causality
 Econometric (2008) International Statistical Review, 76(1):1-27 James J. Heckman Spencer/INET Conference University of Chicago Econometric The econometric approach to causality develops explicit models
Year 9 Term 2: Body Systems and Responses
 Year 9 Term 2: Body Systems and Responses ASSUMED KNOWLEDGE STAGE 4 OUTCOMES SC4-14LW relates the structure and function of living things to their classification, survival and reproduction Check Date SC4-15LW
Longitudinal + Reliability = Joint Modeling
 Longitudinal + Reliability = Joint Modeling Carles Serrat Institute of Statistics and Mathematics Applied to Building CYTED-HAROSA International Workshop November 21-22, 2013 Barcelona Mainly from Rizopoulos,
Causal Bayesian networks. Peter Antal
 Causal Bayesian networks Peter Antal antal@mit.bme.hu A.I. 11/25/2015 1 Can we represent exactly (in)dependencies by a BN? From a causal model? Suff.&nec.? Can we interpret edges as causal relations with
Lecture 3: Measures of effect: Risk Difference Attributable Fraction Risk Ratio and Odds Ratio
 Lecture 3: Measures of effect: Risk Difference Attributable Fraction Risk Ratio and Odds Ratio Dankmar Böhning Southampton Statistical Sciences Research Institute University of Southampton, UK March 3-5,
Modeling Prediction of the Nosocomial Pneumonia with a Multistate model
 Modeling Prediction of the Nosocomial Pneumonia with a Multistate model M.Nguile Makao 1 PHD student Director: J.F. Timsit 2 Co-Directors: B Liquet 3 & J.F. Coeurjolly 4 1 Team 11 Inserm U823-Joseph Fourier
Data, Design, and Background Knowledge in Etiologic Inference
 Data, Design, and Background Knowledge in Etiologic Inference James M. Robins I use two examples to demonstrate that an appropriate etiologic analysis of an epidemiologic study depends as much on study
Mendelian randomization (MR)
") Mendelian randomization (MR) Use inherited genetic variants to infer causal relationship of an exposure and a disease outcome. 1 Concepts of MR and Instrumental variable (IV) methods motivation, assumptions,
Mendelian randomization (MR) Use inherited genetic variants to infer causal relationship of an exposure and a disease outcome. 1 Concepts of MR and Instrumental variable (IV) methods motivation, assumptions,
Multistate models in survival and event history analysis
 Multistate models in survival and event history analysis Dorota M. Dabrowska UCLA November 8, 2011 Research supported by the grant R01 AI067943 from NIAID. The content is solely the responsibility of the
Session 9: Introduction to Sieve Analysis of Pathogen Sequences, for Assessing How VE Depends on Pathogen Genomics Part I
 Session 9: Introduction to Sieve Analysis of Pathogen Sequences, for Assessing How VE Depends on Pathogen Genomics Part I Peter B Gilbert Vaccine and Infectious Disease Division, Fred Hutchinson Cancer
Computational Systems Biology: Biology X
 Bud Mishra Room 1002, 715 Broadway, Courant Institute, NYU, New York, USA L#7:(Mar-23-2010) Genome Wide Association Studies 1 The law of causality... is a relic of a bygone age, surviving, like the monarchy,
Previous lecture. P-value based combination. Fixed vs random effects models. Meta vs. pooled- analysis. New random effects testing.
 Previous lecture P-value based combination. Fixed vs random effects models. Meta vs. pooled- analysis. New random effects testing. Interaction Outline: Definition of interaction Additive versus multiplicative
Prentice Hall Conceptual Physics (Hewitt) 2006 Correlated to: Nebraska Science Standards and STAR Science Standards (Grades 9-12)
 2006 Correlated to: Nebraska Science Standards and STAR Science Standards (Grades 9-12)") Predict and evaluate how change within a system affects that system. 12.1 UNIFYING CONCEPTS AND PROCESSES 12.1.1 By the end of twelfth grade, students will develop an understanding of systems, order, and
Predict and evaluate how change within a system affects that system. 12.1 UNIFYING CONCEPTS AND PROCESSES 12.1.1 By the end of twelfth grade, students will develop an understanding of systems, order, and
UNIVERSITY OF CALIFORNIA, SAN DIEGO
 UNIVERSITY OF CALIFORNIA, SAN DIEGO Estimation of the primary hazard ratio in the presence of a secondary covariate with non-proportional hazards An undergraduate honors thesis submitted to the Department
A multi-state model for the prognosis of non-mild acute pancreatitis
 A multi-state model for the prognosis of non-mild acute pancreatitis Lore Zumeta Olaskoaga 1, Felix Zubia Olaskoaga 2, Guadalupe Gómez Melis 1 1 Universitat Politècnica de Catalunya 2 Intensive Care Unit,
PubH 7470: STATISTICS FOR TRANSLATIONAL & CLINICAL RESEARCH
 PubH 7470: STATISTICS FOR TRANSLATIONAL & CLINICAL RESEARCH The First Step: SAMPLE SIZE DETERMINATION THE ULTIMATE GOAL The most important, ultimate step of any of clinical research is to do draw inferences;
Unbiased estimation of exposure odds ratios in complete records logistic regression
 Unbiased estimation of exposure odds ratios in complete records logistic regression Jonathan Bartlett London School of Hygiene and Tropical Medicine www.missingdata.org.uk Centre for Statistical Methodology
An Introduction to Causal Mediation Analysis. Xu Qin University of Chicago Presented at the Central Iowa R User Group Meetup Aug 10, 2016
 An Introduction to Causal Mediation Analysis Xu Qin University of Chicago Presented at the Central Iowa R User Group Meetup Aug 10, 2016 1 Causality In the applications of statistics, many central questions
What Causality Is (stats for mathematicians)
") What Causality Is (stats for mathematicians) Andrew Critch UC Berkeley August 31, 2011 Introduction Foreword: The value of examples With any hard question, it helps to start with simple, concrete versions
What Causality Is (stats for mathematicians) Andrew Critch UC Berkeley August 31, 2011 Introduction Foreword: The value of examples With any hard question, it helps to start with simple, concrete versions
Mediation and Interaction Analysis
 Mediation and Interaction Analysis Andrea Bellavia abellavi@hsph.harvard.edu May 17, 2017 Andrea Bellavia Mediation and Interaction May 17, 2017 1 / 43 Epidemiology, public health, and clinical research
Local Likelihood Bayesian Cluster Modeling for small area health data. Andrew Lawson Arnold School of Public Health University of South Carolina
 Local Likelihood Bayesian Cluster Modeling for small area health data Andrew Lawson Arnold School of Public Health University of South Carolina Local Likelihood Bayesian Cluster Modelling for Small Area
Multistate Modeling and Applications
 Multistate Modeling and Applications Yang Yang Department of Statistics University of Michigan, Ann Arbor IBM Research Graduate Student Workshop: Statistics for a Smarter Planet Yang Yang (UM, Ann Arbor)
USING MARTINGALE RESIDUALS TO ASSESS GOODNESS-OF-FIT FOR SAMPLED RISK SET DATA
 USING MARTINGALE RESIDUALS TO ASSESS GOODNESS-OF-FIT FOR SAMPLED RISK SET DATA Ørnulf Borgan Bryan Langholz Abstract Standard use of Cox s regression model and other relative risk regression models for
Relative Risks (RR) and Odds Ratios (OR) 20
 and Odds Ratios (OR) 20") BSTT523: Pagano & Gavreau, Chapter 6 1 Chapter 6: Probability slide: Definitions (6.1 in P&G) 2 Experiments; trials; probabilities Event operations 4 Intersection; Union; Complement Venn diagrams Conditional
BSTT523: Pagano & Gavreau, Chapter 6 1 Chapter 6: Probability slide: Definitions (6.1 in P&G) 2 Experiments; trials; probabilities Event operations 4 Intersection; Union; Complement Venn diagrams Conditional
Survival Analysis for Case-Cohort Studies
 Survival Analysis for ase-ohort Studies Petr Klášterecký Dept. of Probability and Mathematical Statistics, Faculty of Mathematics and Physics, harles University, Prague, zech Republic e-mail: petr.klasterecky@matfyz.cz
A Bayesian Nonparametric Approach to Causal Inference for Semi-competing risks
 A Bayesian Nonparametric Approach to Causal Inference for Semi-competing risks Y. Xu, D. Scharfstein, P. Mueller, M. Daniels Johns Hopkins, Johns Hopkins, UT-Austin, UF JSM 2018, Vancouver 1 What are semi-competing
ST5212: Survival Analysis
 ST51: Survival Analysis 8/9: Semester II Tutorial 1. A model for lifetimes, with a bathtub-shaped hazard rate, is the exponential power distribution with survival fumction S(x) =exp{1 exp[(λx) α ]}. (a)
Survival Analysis I (CHL5209H)
") Survival Analysis Dalla Lana School of Public Health University of Toronto olli.saarela@utoronto.ca January 7, 2015 31-1 Literature Clayton D & Hills M (1993): Statistical Models in Epidemiology. Not really
Survival Analysis Dalla Lana School of Public Health University of Toronto olli.saarela@utoronto.ca January 7, 2015 31-1 Literature Clayton D & Hills M (1993): Statistical Models in Epidemiology. Not really
Person-Time Data. Incidence. Cumulative Incidence: Example. Cumulative Incidence. Person-Time Data. Person-Time Data
 Person-Time Data CF Jeff Lin, MD., PhD. Incidence 1. Cumulative incidence (incidence proportion) 2. Incidence density (incidence rate) December 14, 2005 c Jeff Lin, MD., PhD. c Jeff Lin, MD., PhD. Person-Time
Intermediate Differential Equations. John A. Burns
 Intermediate Differential Equations Delay Differential Equations John A. Burns jaburns@vt.edu Interdisciplinary Center for Applied Mathematics Virginia Polytechnic Institute and State University Blacksburg,
When Should We Use Linear Fixed Effects Regression Models for Causal Inference with Panel Data?
 When Should We Use Linear Fixed Effects Regression Models for Causal Inference with Panel Data? Kosuke Imai Department of Politics Center for Statistics and Machine Learning Princeton University Joint
Lecture 3. Truncation, length-bias and prevalence sampling
 Lecture 3. Truncation, length-bias and prevalence sampling 3.1 Prevalent sampling Statistical techniques for truncated data have been integrated into survival analysis in last two decades. Truncation in
An Overview of Methods for Applying Semi-Markov Processes in Biostatistics.
 An Overview of Methods for Applying Semi-Markov Processes in Biostatistics. Charles J. Mode Department of Mathematics and Computer Science Drexel University Philadelphia, PA 19104 Overview of Topics. I.
Semiparametric Mixed Effects Models with Flexible Random Effects Distribution
 Semiparametric Mixed Effects Models with Flexible Random Effects Distribution Marie Davidian North Carolina State University davidian@stat.ncsu.edu www.stat.ncsu.edu/ davidian Joint work with A. Tsiatis,
GROUPED SURVIVAL DATA. Florida State University and Medical College of Wisconsin
 FITTING COX'S PROPORTIONAL HAZARDS MODEL USING GROUPED SURVIVAL DATA Ian W. McKeague and Mei-Jie Zhang Florida State University and Medical College of Wisconsin Cox's proportional hazard model is often
Causal Modeling in Environmental Epidemiology. Joel Schwartz Harvard University
 Causal Modeling in Environmental Epidemiology Joel Schwartz Harvard University When I was Young What do I mean by Causal Modeling? What would have happened if the population had been exposed to a instead
Many natural processes can be fit to a Poisson distribution
 BE.104 Spring Biostatistics: Poisson Analyses and Power J. L. Sherley Outline 1) Poisson analyses 2) Power What is a Poisson process? Rare events Values are observational (yes or no) Random distributed
Hypothesis Testing, Power, Sample Size and Confidence Intervals (Part 2)
") Hypothesis Testing, Power, Sample Size and Confidence Intervals (Part 2) B.H. Robbins Scholars Series June 23, 2010 1 / 29 Outline Z-test χ 2 -test Confidence Interval Sample size and power Relative effect
Hypothesis Testing, Power, Sample Size and Confidence Intervals (Part 2) B.H. Robbins Scholars Series June 23, 2010 1 / 29 Outline Z-test χ 2 -test Confidence Interval Sample size and power Relative effect
DISCRETE PROBABILITY DISTRIBUTIONS
 DISCRETE PROBABILITY DISTRIBUTIONS REVIEW OF KEY CONCEPTS SECTION 41 Random Variable A random variable X is a numerically valued quantity that takes on specific values with different probabilities The
Downloaded from:
 Camacho, A; Kucharski, AJ; Funk, S; Breman, J; Piot, P; Edmunds, WJ (2014) Potential for large outbreaks of Ebola virus disease. Epidemics, 9. pp. 70-8. ISSN 1755-4365 DOI: https://doi.org/10.1016/j.epidem.2014.09.003
Counterfactual Reasoning in Algorithmic Fairness
 Counterfactual Reasoning in Algorithmic Fairness Ricardo Silva University College London and The Alan Turing Institute Joint work with Matt Kusner (Warwick/Turing), Chris Russell (Sussex/Turing), and Joshua