Solution to selected problems in midterm exam in principal of statistics PREPARED BY Dr. Nafez M. Barakat Islamic university of Gaza
|
|
|
- Warren Bryan
- 5 years ago
- Views:
Transcription

1 Solutio to selected problems i midterm exam i pricipal of statistics PREPARED BY Dr. Nafez M. Barakat Islamic uiversity of Gaza MIDTERM
2
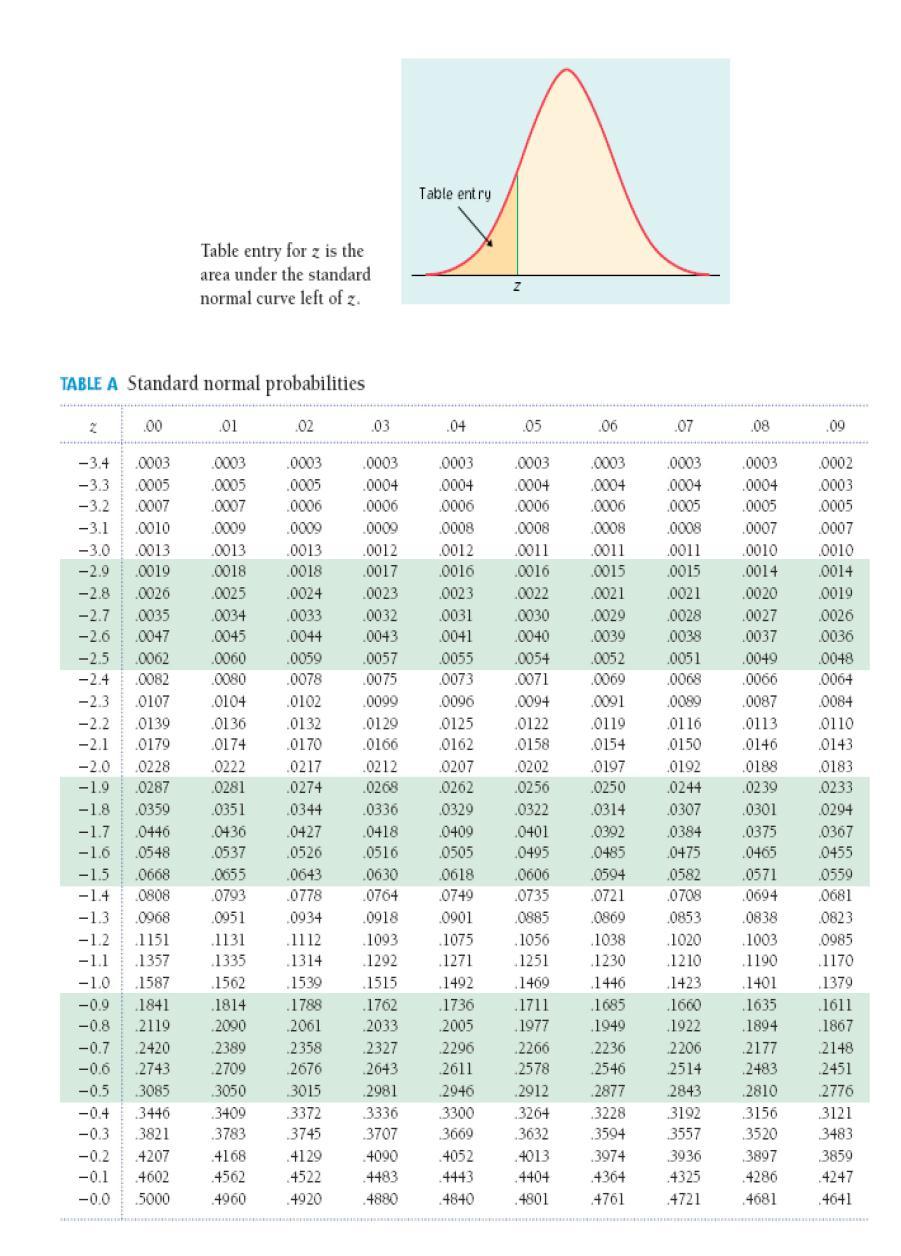
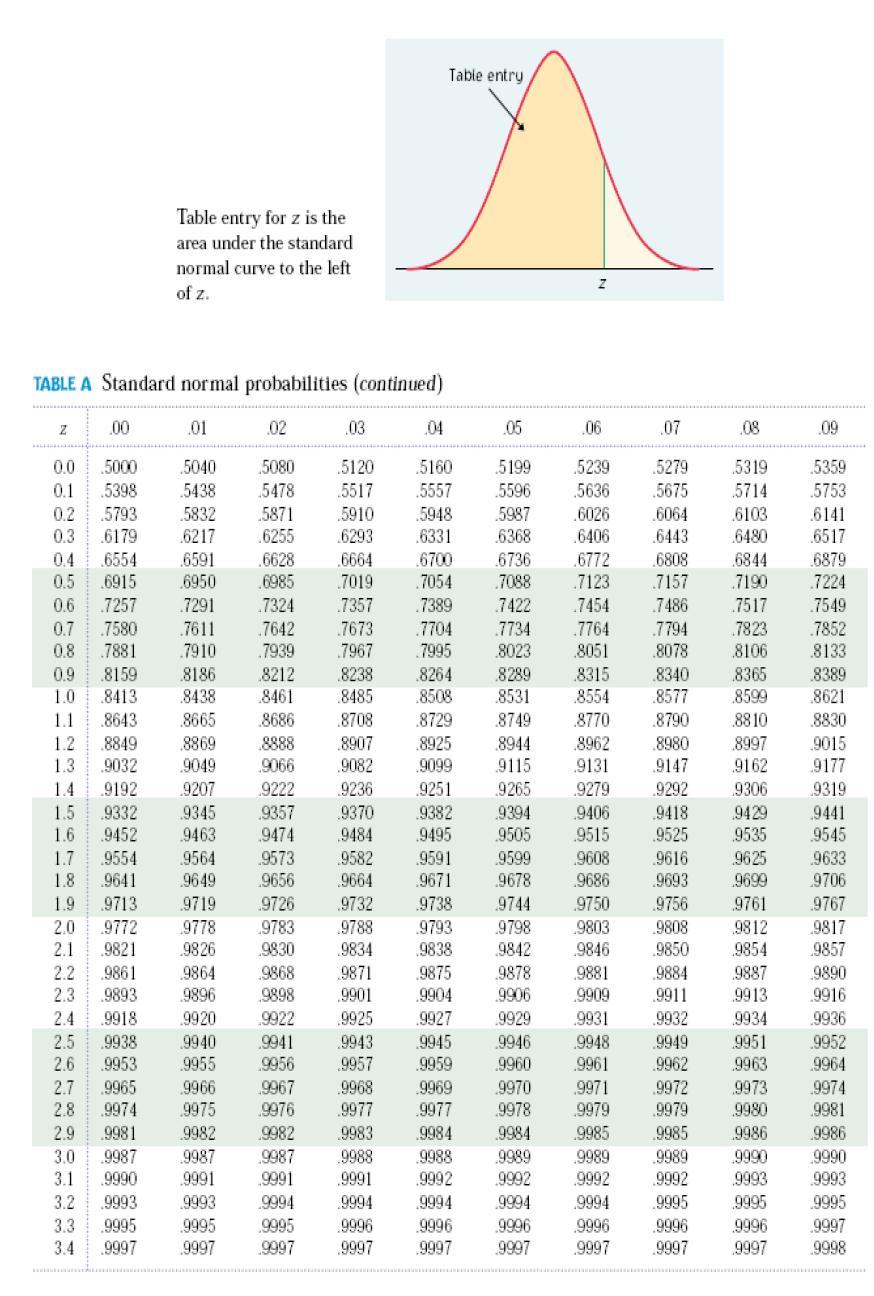
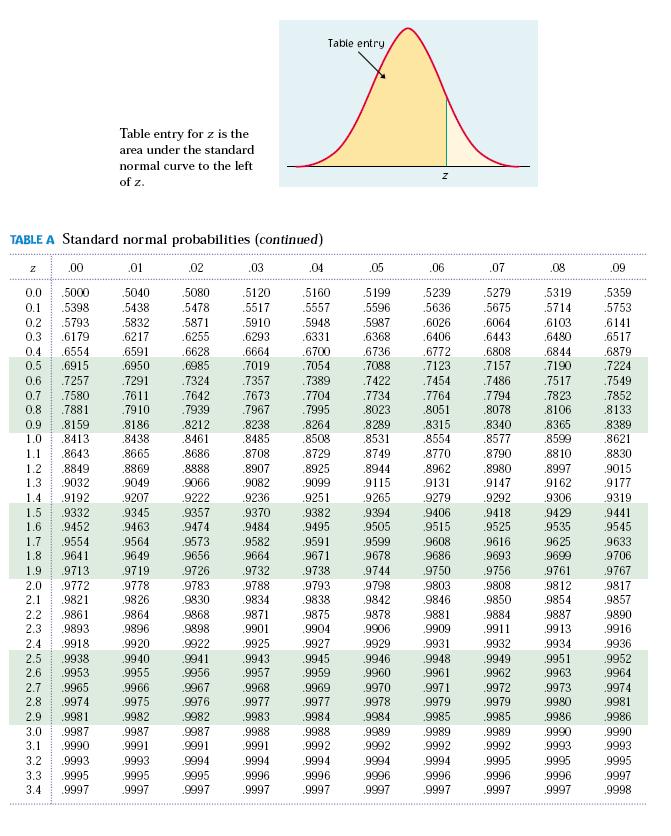
3 P(1.99 < x <.0) = p( < z < = p(z< 0) p (z< -1) = = ) = p(-1 < z < 0) P( X x1 )= 0.99, p(z >z 1 ) = 0.99, p(z < z 1 ) = = 0.01, z 1 = x1 z p(x > 90) = , p(z > z 1 ) = , p( z < z 1 ) = = Z 1 = 1.5, x z, 1.5, 10 P(x> 95) = p( z> (95-75)/10) = p(z>.0) = 1- p(z<.0) = =0.08.p(-z 1 < z < z 1 ) = , p( 0< z < z 1 ) = P(z< z 1 ) 0.5 = 0.433, z 1 = 1.5 3
/0.5745 < Z < ((0.5-0.45)/0.5745) = P(-.61 < Z < 0.87) = 0.8033 P(Z< Z 1 ) = 0.80, Z 1 = 0.84 (1 ) p Z 0.45 0.84* 0.45(1 0.45) 75 0.")
4 x z Lower iterval x L = *10 = 60 Upper iterval x u = *10 = 90 P (1 ) 0.45(1 0.45) P( 0.3 < p < 0.5) = P( ( )/ < Z < (( )/0.5745) = P(-.61 < Z < 0.87) = P(Z< Z 1 ) = 0.80, Z 1 = 0.84 (1 ) p Z * 0.45(1 0.45)
 *")
 1537")
5 z * e (1.96) * (1000) (50)
6 P( 0.67 P( 0.67 X 0.67 ) X 0.67) P( 0.67 Z 0.67) MIDTERM 18/4/011 SECTION I: MULTIPLE-CHOICE For each questio i this sectio, circle the correct aswer. Each problem is worth 1 poit. 6
7 1. The process of usig sample statistics to draw coclusios about true populatio parameters is called a) statistical iferece. b) the scietific method. c) samplig. d) descriptive statistics.. A summary measure that is computed to describe a characteristic from oly a sample of the populatio is called a) a parameter. b) a cesus. c) a statistic. d) the scietific method. 3. I a right-skewed distributio a) the media equals the arithmetic mea. b) the media is less tha the arithmetic mea. c) the media is larger tha the arithmetic mea. d) oe of the above. 1. Whe extreme values are preset i a set of data, which of the followig descriptive summary measures are most appropriate: a) CV ad rage. b) arithmetic mea ad stadard deviatio. c) iterquartile rage ad media. d) variace ad iterquartile rage.. I its stadardized form, the ormal distributio a) has a mea of 0 ad a stadard deviatio of 1. b) has a mea of 1 ad a variace of 0. c) has a area equal to 0.5. d) caot be used to approximate discrete probability distributios. 1. If a particular batch of data is approximately ormally distributed, we would fid that approximately a) of every 3 observatios would fall betwee 1 stadard deviatio aroud the mea. b) 4 of every 5 observatios would fall betwee 1.8 stadard deviatios aroud the mea. c) 19 of every 0 observatios would fall betwee stadard deviatios aroud the mea. d) All the above.. The Cetral Limit Theorem is importat i statistics because a) for a large, it says the populatio is approximately ormal. b) for ay populatio, it says the samplig distributio of the sample mea is approximately ormal, regardless of the sample size. c) for a large, it says the samplig distributio of the sample mea is approximately ormal, regardless of the shape of the populatio. d) for ay sized sample, it says the samplig distributio of the sample mea is approximately ormal. 7
8 1. Which of the followig statemets about the samplig distributio of the sample mea is icorrect? a) The samplig distributio of the sample mea is approximately ormal wheever the sample size is sufficietly large ( 30). b) The samplig distributio of the sample mea is geerated by repeatedly takig samples of size ad computig the sample meas. c) The mea of the samplig distributio of the sample mea is equal to. d) The stadard deviatio of the samplig distributio of the sample mea is equal to.. The width of a cofidece iterval estimate for a proportio will be a) arrower for 99% cofidece tha for 95% cofidece. b) wider for a sample size of 100 tha for a sample size of 50. c) arrower for 90% cofidece tha for 95% cofidece. d) arrower whe the sample proportio is 0.50 tha whe the sample proportio is A 99% cofidece iterval estimate ca be iterpreted to mea that a) if all possible samples are take ad cofidece iterval estimates are developed, 99% of them would iclude the true populatio mea somewhere withi their iterval. b) we have 99% cofidece that we have selected a sample whose iterval does iclude the populatio mea. c) Both of the above. d) Noe of the above. 8
9 SECTION II: TRUE OR FALSE For each questio i this sectio, idicate whether the setece is TRUE or False. Each problem is worth 1 poit. 1. ( F ) The possible resposes to the questio How may times i the past three moths have you visited a city park? are values from a discrete variable.. ( T ) Other thigs beig equal, as the cofidece level for a cofidece iterval icreases, the width of the iterval icreases. 3. ( F ) The t distributio is used to develop a cofidece iterval estimate of the populatio proportio whe the populatio stadard deviatio is ukow. 4. ( F ) The cofidece iterval obtaied will always correctly estimate the populatio parameter. 5. ( F ) I estimatig the populatio mea with the populatio stadard deviatio ukow, if the sample size is 1, there will be 6 degrees of freedom. 6. ( T ) As the sample size icreases, the effect of a extreme value o the sample mea becomes smaller. 7. ( T ) A samplig distributio is a distributio for a statistic. 8. ( F ) The probability that a stadard ormal radom variable, Z, is less tha 5.0 is approximately ( F ) The "middle spread," that is the middle 50% of the ormal distributio, is equal to oe stadard deviatio. 10. ( F ) I a set of umerical data, the value for Q is always halfway betwee Q1 ad Q ( F ) The stadard error of the sample mea is affected by the cofidece level 1. ( T )A poit estimator is a fuctio of the radom sample used to make ifereces about the value of a ukow populatio parameter SECTION III: FREE RESPONSE QUESTIONS (i) ( Poits) The assets i billios of dollars of the five largest bod fuds are 19.5, 16.8, 13.7, 1.8, ad Compute the stadard deviatio for this populatio of the five largest bod fuds. Descriptive Statistics N Mea Std. Deviatio VAR Valid N (listwise) 5 9
10 (ii) (4 Poits) You were told that the mea score o a statistics exam is 75 with the scores ormally distributed. I additio, you kow the probability of a score betwee 55 ad 60 is 4.41% ad that the probability of a score greater tha 90 is 6.68%. a. ( Poits) What is the probability of a score greater tha 95? p(x > 90) = , p(z > z 1 ) = , p( z < z 1 ) = = Z 1 = 1.5, x z, 1.5, 10 P(x> 95) = p( z> (95-75)/10) = p(z>.0) = 1- p(z<.0) = =0.08 b. ( Poits) The middle 86.64% of the studets will score betwee which two scores?.p(-z 1 < z < z 1 ) = , p( 0< z < z 1 ) = P(z< z 1 ) 0.5 = 0.433, z 1 = 1.5 x z Lower iterval x L = *10 = 60 Upper iterval x u = *10 = 90 (iii) ( Poits) The head of a computer sciece departmet is iterested i estimatig the proportio of studets eterig the departmet who will choose the ew computer egieerig optio. Suppose there is o iformatio about the proportio of studets who might choose the optio. What size sample should the departmet head take if she wats to be 95% cofidet that the estimate is withi 0.10 of the true proportio? e=0.1,.05, z / z 0 * (1 ) 1.96*1.96*0.5(1 0.5) e (0.1) 97 (iv) ( Poits) A hotel chai wats to estimate the average umber of rooms reted daily i each moth. The populatio of rooms reted daily is assumed to be ormally distributed for each moth with a stadard deviatio of 4 rooms. durig February, a sample of 5 days has a sample mea of 37 rooms. Use this iformatio to calculate a 9% cofidece iterval for the populatio mea. 4, 5, x 37, C I X Z *
*100%=98% Questios 5-6 refer to the followig iformatio: 5- A 95% cofidece iterval for the mea readig achievemet score for a populatio of third grades is (40, 50).")
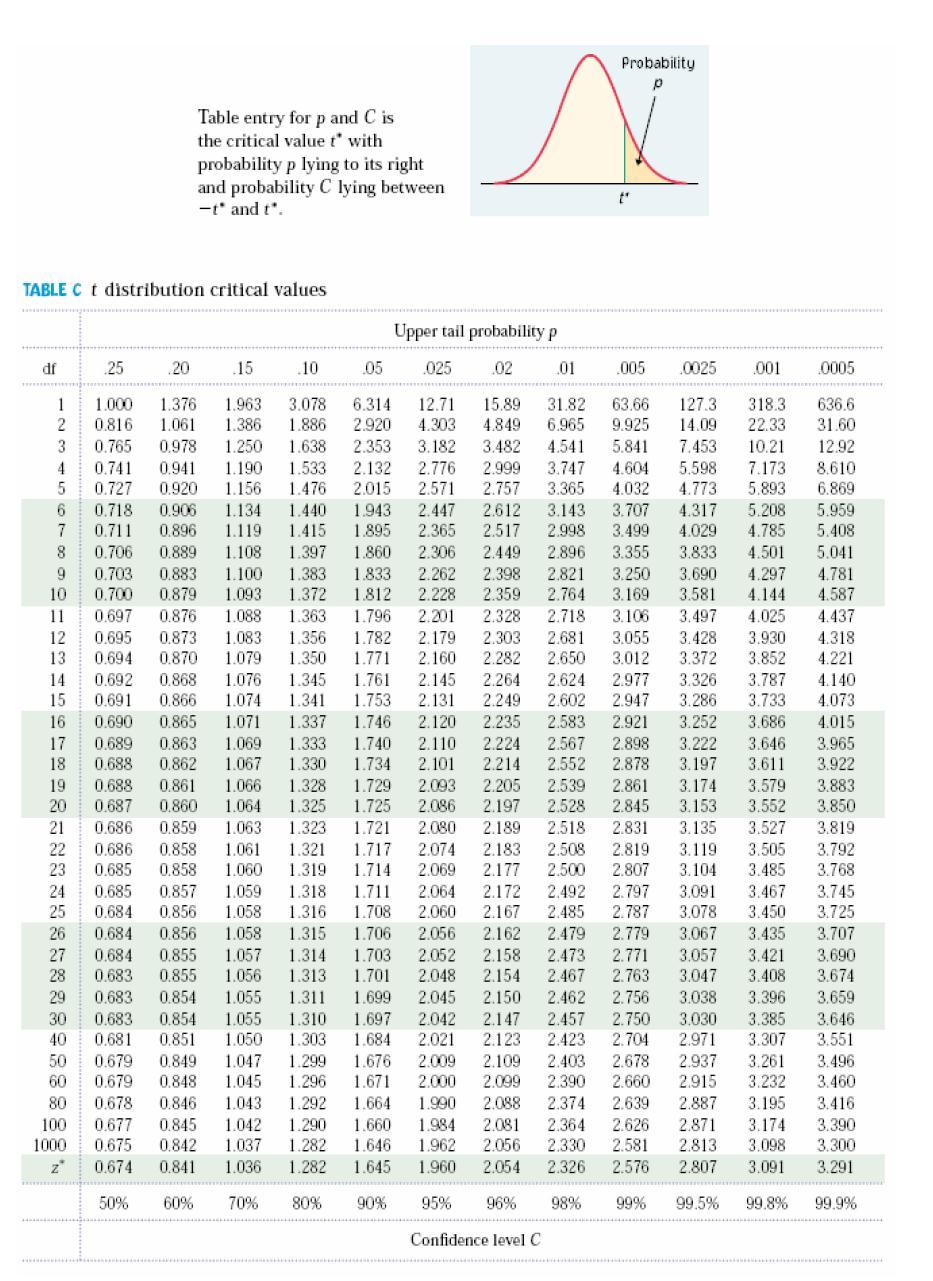
11 = 16, s=400 from iterval (4739.8, 560.) x 5000 e t s 400 / * 60. t / t /.60, df From table T 0.0, cofidece level = (1-0.0)*100%=98% Questios 5-6 refer to the followig iformatio: 5- A 95% cofidece iterval for the mea readig achievemet score for a populatio of third grades is (40, 50). The margi of error of this iterval is a) 95% b) 10 c) 5 d).5 11
12 e) The aswer caot be determied from the iformatio give 6- The sample mea is a) 0.95 b) 45 c) 4.5 d) 47.5 e) The aswer caot be determied from the iformatio give 1
13 7- Usig the same set of data, you compute a 95% cofidece iterval ad a 99% cofidece iterval. Which of the followig statemet is correct? a) The itervals have the same width b) The 99% iterval is wider c) The 95 % iterval is wider d) You caot be determied which iterval is wider uless you kow ad s 9 Suppose you take a simple radom sample from a populatio kow to be ormally distributed, but the value of is ukow. Your sample size is 10. Which formula below should be used to fid the 90% cofidece iterval for the mea? s S a) x b) x c) x d) x ANSWER C Questios refer to the followig iformatio: 13- The height of Palestiia me aged 18 to 4 are approximately ormally distributio with mea 170 cm ad stadard deviatio 6 cm. Half of all youg me are shorter tha a) 164 cm b) 170 cm c) 176 cm d) Ca't tell, because the media height is ot give. 14- Oly about 5% of youg me have heights outside the rage 0.95% C cm to 18cm a) 164 cm to 176 cm b) 158 cm to 18 cm c) 15 cm to 188 cm d) 146 cm to 194 cm 15- A airplae is oly allowed a gross passeger weight of 6,885 kg. If the weights of passegers travelig by air betwee two cities have a mea of 80 kg ad a stadard deviatio of 18 kg, the approximate probability that the combied weight of 81 passegers will exceed 6,885 kg is: a) b) c) d) Give a ormally distributed populatio with a mea of 80 ad a variace of l00, we kow that the distributio of sample meas computed from samples of size 5 from that populatio will have a mea of ad a stadard error of. a) 80, l0 b) 80, c) l00, 5 d) 80, l0 Questio #6: [0 Poits] (a) [10 Poits] A article reports that (4.0, 5.6) is a 95% cofidece iterval for the mea legth of stay, i days, of patiets i hospital for a particular operatio. Suppose the sample size is 50, fid the sample mea ad the stadard deviatio. 13
14 x From the iterval 4.8, e 0.8, 0.05, t / s s e t / * s.81, (b) [10 Poits] How large a sample size is eeded to estimate the mea aual icome of CCC compay to be withi $000 with probability 0.99? Suppose there is o prior iformatio about the stadard deviatio of aual icome of the CCC compay, but we guess that about 68% of their icomes are betwee $10000 ad $40,000 ad that this distributio of icomes is approximately bell shaped At.01, z.58, 15000, e / z * e (.58) * (15000) (000)
 For each questio i this sectio, circle the correct aswer. 4.")
15 The Islamic Uiversity of Gaza Faculty of Commerce Departmet of Ecoomics ad Political Scieces A Itroductio to Statistics Course (ECOE 130) Sprig Semester 014-8/4/014 Midterm Exam Name: ID: Istructors: Dr. Nafez Barakat Mr. Ibrahim Abed SECTION I: MULTIPLE-CHOICE (Each problem is worth 1 poit) For each questio i this sectio, circle the correct aswer. 4. A summary measure that is computed to describe a characteristic of a etire populatio is called a) a parameter. b) a cesus. c) a statistic. d) the scietific method. 5. Which descriptive summery measures are cosidered to be resistat statistics? a) The arithmetic mea ad stadard deviatio. b) The iterquartile rage ad rage. c) The mode ad variace. d) The media ad iterquartile rage. 6. Which of the followig is a cotiuous quatitative variable? a) The color of a studet s eyes b) The umber of employees of a isurace compay c) The amout of milk produced by a cow i oe 4-hour period d) The umber of gallos of milk sold at the local grocery store yesterday 7. The possible resposes to the questio "How would you rate the quality of your purchase experiece with 1 = excellet, = good, 3 = decet, 4 = poor, 5 = terrible?" are values from a a) discrete umerical radom variable. b) cotiuous umerical radom variable. 15
16 a) 100 b) 40 c) 10 d) 0 c) categorical radom variable. d) parameter 8.. I samplig from a large populatio with = 0, the stadard error of the mea is foud to be. The size of the sample used is: 9. The smaller the spread of scores aroud the arithmetic mea, a) the smaller the iterquartile rage. b) the smaller the stadard deviatio. c) the smaller the coefficiet of variatio. d) All the above 10. For sample size 16, the samplig distributio of the sample mea will be approximately ormally distributed e) regardless of the shape of the populatio. f) if the shape of the populatio is symmetrical. g) if the sample stadard deviatio is kow. h) if the sample is ormally distributed 13. I left-skewed distributios, which of the followig is the correct statemet? a) The distace from Q1 to Q is smaller tha the distace from Q to Q3. b) The distace from the smallest observatio to Q1 is larger tha the distace from Q3 to the largest observatio. c) The distace from the smallest observatio to Q is smaller tha the distace from Q to the largest observatio. d) The distace from Q1 to Q3 is twice the distace from the Q1 to Q. 1.Accordig to the Chebyshev rule, at least what percetage of the observatios i ay data set are cotaied withi a distace of 3 stadard deviatios aroud the mea? a) 67% b) 75% c) 88.89% d) 99.7% 13.For some positive value of Z, the probability that a stadard ormal variable is betwee 0 ad Z is The value of Z is a) 0.07 b) 0.37 c) 0.97 d) A cofidece iterval was used to estimate the proportio of statistics studets that are female. A radom sample of 7 statistics studets geerated the followig 90% cofidece iterval: (0.438, 0.64). Usig the iformatio above, what total size sample would be ecessary if we wated to estimate the true proportio to withi ±0.08 usig 95% cofidece? a) 105 b) 150 c) 40 d)
17 z p 1p e =( 1.96/0.08) * 0.54* (1-0.54) = Whe extreme values are preset i a set of data, which of the followig descriptive summary measures are most appropriate? a) CV ad rage b) arithmetic mea ad stadard deviatio c) iterquartile rage ad media d) variace ad iterquartile rags Sectio II: TRUE Or FALSE (Each problem is worth 1 poit). For each questio i this sectio, idicate whether the setece is TRUE or False.. ( F ) A statistic is usually used to provide a estimate for a usually uobserved parameter. 3. ( T ) As a geeral rule, a observatio is cosidered a extreme value if its absolute value of Z score is greater tha3. 4. ( F ) The aswer to the questio How do you rate the quality of your busiess statistics course is a example of a ordial scaled variable. 5. ( T ) The coefficiet of variatio is a measure of relative variatio. 6. ( F ) The t distributio is used to develop a cofidece iterval estimate of the populatio proportio whe the populatio stadard deviatio is ukow. 7. ( T ) The width of a cofidece iterval equals twice the samplig error 8. ( T ) A poit estimate cosists of a sigle sample statistic that is used to estimate the true populatio parameter 8. ( F ) The amout of bleach a machie pours ito bottles has a mea of 36 oz. with a stadard deviatio of 0.15 oz. Suppose we take a radom sample of 36 bottles filled by this machie. The samplig distributio of the sample mea has a stadard error of ( F ) A uiversity dea is iterested i determiig the proportio of studets who receive some sort of fiacial aid. Rather tha examie the records for all studets, the dea radomly selects 00 studets ad fids that 118 of them are receivig fiacial aid. Use a 90% cofidece iterval to estimate the true proportio of studets who receive fiacial aid. The aswer is P=118/00 = 0.59, P(1 P) P Z * 0.59*(1 0.59) ( F ) As a aid to the establishmet of persoel requiremets, the director of a hospital wishes to estimate the mea umber of people who are admitted to the 17
18 emergecy room durig a 4-hour period. The director radomly selects 64 differet 4-hour periods ad determies the umber of admissios for each. For this sample, X ad s = 5. The 95% cofidece iterval for the populatio mea is SECTION III: FREE RESPONSE QUESTIONS Questio #3: (5 Poits) The ower of a fish market determied that the average weight for a catfish is 3. pouds. He also kew that the probability of a radomly selected catfish that would weigh more tha 3.8 pouds is 0% ad the probability that a radomly selected catfish that would weigh less tha.8 pouds is 30%. a) Fid the probability that a radomly selected catfish will weigh less tha 3.6 pouds? p ( w 3.8) 0.0, p ( Z ) 0.0, P( Z ) , P ( w 3.6) P( Z ) P( Z 0.560) b) The middle 40% of the catfish will weigh betwee which two umbers? P ( Z Z1) 0.70, Z 1 =
19 X U Z * X L Z * Questio #4: (5 Poits) A study at a college i the west coast reveals that, historically, 45% of their studets are miority studets. If a radom sample of size 75 is selected e) Fid the probability that the sample proportio of miority studets lies betwee 30% ad 50%? 0.45, P(0.3 P 0.5) P( Z ) 0.45(1 0.45) 0.45(1 0.45) P(.611 Z 0.87) P( Z 0.87) P( Z.611) f) 95% of the samples proportios of miority studets will be greater tha 19
20 what value? P(Z>Z1) = 0.95, P(Z< Z 1 ) = 0.05 Z 1 = p Z (1 ) * 0.45(1 0.45) The Islamic Uiversity of Gaza Faculty of Commerce Departmet of Ecoomics ad Political Scieces A Itroductio to Statistics Course (ECOE 130) Sprig Semester 014 Fial Examiatio Date : 31/5/014 Name: ID: Time: Two hour s Istructor's: Mr. Ibrahim Abed ad D. Nafez Barakat DON'T WRITE ON THIS TABLE QUESTION #1 # #3 #4 #5 #6 #7 TOTAL POINTS Questio #1: [15 Poits] For each questio i this sectio, circle the correct aswer. Each problem is worth 1 poit. 1
21 1. A summary measure that is computed to describe a characteristic from oly a sample of the populatio is called a) a parameter b) a cesus. c) a statistic d) the scietific method. Which of the followig statemets about the media is ot true? a) It is more affected by extreme values tha the arithmetic mea b) It is a measure of cetral tedecy i bell-shaped "ormal" c) It is equal to Q. d) It is equal to the mode distributios 3. Accordig to the Chebyshev rule, at least what percetage of the observatios i ay data set are cotaied withi a distace of 3 stadard deviatios aroud the mea? a) 67% b) 75% c) 88.89% d) 99.7% 4. For some positive value of Z, the probability that a stadard ormal variable is betwee 0 ad Z is The value of Z is a) 0.18 b) 0.81 c) 1.47 d) If we kow that the legth of time it takes a college studet to fid a parkig spot i the library parkig lot follows a ormal distributio with a mea of 3.5 miutes ad a stadard deviatio of 1 miute, fid the poit i the distributio i which 75.8% of the college studets exceed whe tryig to fid a parkig spot i the library parkig lot. a) 4. miutes b) 3. miutes c) 3.4 miutes d).8 miutes 6. The stadard error of the mea a) is ever larger tha b) decreases as the the stadard deviatio sample size icreases of the populatio c) measures the variability of the mea from sample to sample. d) All of the above 7. The Dea of Studets mailed a survey to a total of 400 studets. The sample icluded 100 studets radomly selected from each of the freshma, sophomore, juior, ad seior classes o campus last term. What samplig method was used? a) Simple radom sample b) Systematic sample c) Stratified sample d) Cluster sample 8. I the costructio of cofidece itervals, if all other quatities are uchaged, a icrease i the sample size will lead to a iterval. a) arrower b) wider c) less sigificat d) Biased 9. A uiversity dea is iterested i determiig the proportio of studets who receive some sort of fiacial aid. Rather tha examie the records for all studets, the dea radomly selects 00 studets ad fids that 118 of them are receivig fiacial aid. If the dea wated to estimate the proportio of all studets receivig fiacial aid to withi 3% with 99% reliability.how may studets would eed to be sampled P=118/00 = 0.59 Z p(1 p).575*.575*0.59*(1 0.59) e 0.03* a) 1844 b) 1784 c) 1503 d) Which of the followig is most likely a parameter as opposed to a statistic? 1
22 a) The average score of the first five studets completig a assigmet b) The proportio of females registered to vote i a couty c) The average height of people radomly selected from a database. d) The proportio of trucks stopped yesterday that were cited for bad brakes 11. I aright _ skewed distributio a) The arithmetic mea equals the media. b) The arithmetic mea is less tha the media. c) The arithmetic mea is larger tha the media. d) Noe of the above 1.The width of a cofidece iterval estimate for a proportio will be A) arrower whe the sample proportio is 0.10 tha whe the sample proportio is B) wider for 90% cofidece tha for 95% cofidece. C) arrowest whe the sample proportio is 0.5. D) arrower for a sample size of 50 tha for a sample size of 100. E) wider whe the sample proportio is 0.95 tha whe the sample proportio is Questio #: [15 Poits] For each questio i this sectio, idicate whether the setece is true or false. Each problem is worth 1 poit. 1- ( T ) The possible resposes to the questio How log have you bee livig at your curret residece? are values from a cotiuous variable - ( F ) The aswer to the questio What is your favorite color? is a example of a ordial scaled variable 3- ( T ) I a sample of size 40, the sample mea is 15. I this case, the sum of all observatios i the sample is X i ( T ) The coefficiet of variatio measures variability i a data set relative to the size of the arithmetic mea 5- ( F ) The probability that a stadard ormal radom variable, Z, is betwee 1.00 ad 3.00 is ( T ) As the sample size icreases, the effect of a extreme value o the sample mea becomes smaller 7- ( F ) The stadard error of the samplig distributio of a sample proportio is p 1 p
23 8- ( T ) Other thigs beig equal, as the cofidece level for a cofidece iterval icreases, the width of the iterval icreases 9- ( T ) A poit estimate cosists of a sigle sample statistic that is used to estimate the true populatio parameter 10- ( F ) For a give level of sigificace, if the sample size is icreased, the probability of committig a Type I error will icrease 11- ( T ) For a give sample size, the probability of committig a Type II error will icrease whe the probability of committig a Type I error is reduced Bous Questio #7: [5 Poits] Suppose that the icomes i a populatio have mea $000 ad stadard deviatio $4000. A sample of size 40 is selected a) What is the probability that the sample mea will be withi $000 of the populatio mea? µ=000, 4000 =40 p( X 000) P( 3.16 Z P( Z ) P( P( Z 3.16) 4000 / ) P( Z 3.165) P( Z 3.16) b) Suppose that we wat the probability of X beig withi $000 of the populatio mea to be How large a sample do we eed? α=0.05 Z α/ = 1.96 e = 000 Zα/ e σ 1.96*1.96* 4000* *000 A Itroductio to Statistics Course (ECOE 130) Sprig Semester 01 Fial Examiatio Date : 8/5/01 3-Asummary measure that is computed to describe a characteristic of a etire populatio is called 3
24 a) a parameter b) a cesus c) a statistics d) The scietific method 4- Accordig to the chebyshev rule, at least 93.75% of all observatios i ay data set are cotaied withi a distace of how may stadard deviatios aroud the mea % (1 ) 100% 93.75% k 4 a) 1 b) c) 3 d) 4 5- The mea age of five people i a room is 30 years. Oe of the people whose age is 50 years leaves the room. the mea age of the remaiig four people i the room is a) 40 b) 30 c) 5 d) Not able to be determied from the iformatio give 6- For some value of Z, the probability that a stadard variable is below Z is The value of z is a) 0.81 b) c) 0.31 d) Samplig distributios describe the distributio of a) parameters b) Statistics c) Both a ad b d) Neither a or b 9- The symbol for the power of a statistical test is a) b) 1- c) d) A type II error is committed whe a) we reject H 0 that is true. b) we reject H 0 that is false. c) we do t reject H 0 that is true. d) we do t reject H 0 that is false 11- A uiversity dea is iterested i determiig the proportio of studets who receive some sort of fiacial aid. Rather tha examie the records for all studets, the dea radomly selects 00 studets ad fids that 118 of them are receivig fiacial aid. If the dea wated to estimate the proportio of all studets receivig fiacial aid to withi 3% with 99% reliability.how may studets would eed to be sampled sampled? P=118/00 = 0.59 Z p(1 p).575*.575*0.59*(1 0.59) e 0.03* a) 1844 b) 1784 c) 1503 d) ) I a survey of 300 T.V. viewers, 0% said they watch etwork ews programs. Fid stadard error for the sample proportio. A) B) C) D) E)
25 For each questio i this sectio, idicate whether the setece is true or false. Each problem is worth 1 poit. 1- ( F ) A statistic is usually uobservable while a parameter is usually observable - ( F ) As the sample size icreases, the stadard error of the mea icreases. S X S 3- ( T ) Other thigs beig equal, as the cofidece level for a cofidece iterval icreases, the width of the iterval icreases 4- ( T ) The t distributio is used to develop a cofidece iterval estimate of the populatio mea whe the populatio stadard deviatio is ukow 7- ( T ) The mea of the samplig distributio of a sample mea is the populatio mea 8- ( F ) The quality ("terrible", "poor", "fair", " acceptable", "very good", ad " excellet" ) of a day care ceter is a example of a umerical variable 9- ( T ) The coefficiet of variatio measures variability i a data set relative to the size of the arithmetic mea 10- ( T ) A box plot is a graphical represetatio of a 5 _ umber summary 11- ( F ) The probability that a stadard ormal radom variable Z is below 1.96 is ( T ) A 95% cofidece iterval for will be wider tha a 96% cofidece iterval for 15- ( T ) The a mout of water cosumed by a perso per week is a example of a cotiuous variable A Itroductio to Statistics Course (ECOE 130) Sprig Semester 015-8/4/015 Midterm Exam Name: ID: Istructors: Dr. Nafez Barakat Mr. Ibrahim Abed SECTION I: MULTIPLE-CHOICE (Each problem is worth 1 poit) For each questio i this sectio, circle the correct aswer. 9. The collectio ad summarizatio of the socioecoomic ad physical characteristics of the employees of a particular firm is a example of a) iferetial statistics. b) descriptive statistics. c) a parameter. d) a statistic. 10. Researchers are cocered that the weight of the average America school child is icreasig implyig, amog other thigs, that childre s clothig should be maufactured ad marketed i larger sizes. If X is the weight of school childre sampled i a atiowide study, the X is a example of a) a categorical radom variable. b) a discrete radom variable. 5
26 c) a cotiuous radom variable. d) a parameter. 3.Which of the followig is the easiest to compute? a) The arithmetic mea. b) The media. c) The mode. d) The stadard deviatio. 4.Accordig to the Chebyshev rule, at least 93.75% of all observatios i ay data set are cotaied withi a distace of how may stadard deviatios aroud the mea? a) 1 b) c) d) % (1 ) 100% 93.75% k 4 5. For some positive value of X, the probability that a stadard ormal variable is betwee 0 ad +1.5X is The value of X is e) 0.10 f) 0.50 g) 1.00 h) I its stadardized form, the ormal distributio a) has a mea of 0 ad a variace of 1. b) has a mea of 1 ad a variace of 0. c) has a area equal to 0.5. d) caot be used to approximate discrete probability distributios. 7. At a computer maufacturig compay, the actual size of computer chips is ormally distributed with a mea of 1 cetimeter ad a stadard deviatio of 0.1 cetimeter. A radom sample of 1 computer chips is take. What is the stadard error for the sample mea? a b c d If you were costructig a 99% cofidece iterval of the populatio mea based o a sample of =5 where the stadard deviatio of the sample s = 0.05, the critical value of t will be a b c..49 d I the costructio of cofidece itervals, if all other quatities are uchaged, a icrease i the sample size will lead to a iterval. a. arrower b. wider c. less sigificat 6
27 d. biased 10. For sample size 16, the samplig distributio of the mea will be approximately ormally distributed a. regardless of the shape of the populatio. b. if the shape of the populatio is symmetrical. c. if the sample stadard deviatio is kow. d. if the sample is ormally distributed. Sectio II: TRUE Or FALSE (Each problem is worth 1 poit).for each questio i this sectio, idicate whether the setece is TRUE or False. 1.( F ) A statistic is usually uobservable while a parameter is usually observable.. ( F ) Marital status is a example of a ordial scaled variable. 3. ( F ) The lie draw withi the box of the boxplot always represets the arithmetic mea. 4. ( T ) The Z score of a observatio measures how may stadard deviatios is the value from the mea 5. ( T ) The probability that a stadard ormal radom variable, Z, is betwee 1.50 ad.10 is the same as the probability Z is betwee.10 ad ( T ) If the populatio distributio is skewed, i most cases the samplig distributio of the mea ca be approximated by the ormal distributio if the samples cotai at least 30 observatios 7.( F ) I formig a 90% cofidece iterval for a populatio mea from a sample size of, the umber of degrees of freedom from the t distributio equals 8.( T ) Other thigs beig equal, as the cofidece level for a cofidece iterval icreases, the width of the iterval icreases. 9. ( T ) The sample mea is a poit estimate of the populatio mea. 10. ( F ) The cofidece iterval obtaied will always correctly estimate the populatio parameter SECTION III: FREE RESPONSE QUESTIONS Questio #3: (5 Poits) A uiversity dea is iterested i determiig the proportio of studets who receive some sort of fiacial aid. Rather tha examie the records for all studets, the dea radomly selects 00 studets ad fids that 118 of them are receivig fiacial aid. a) Use a 90% cofidece iterval to estimate the true proportio of studets who receive fiacial aid? 7
28 90%C.I PZ α/ p(1 p) ( , ) b) A ecoomist is iterested i studyig the icomes of cosumers i a particular regio. The populatio stadard deviatio is kow to be $1,000. A radom sample of 50 idividuals resulted i a average icome of $15,000. What total sample size would the ecoomist eed to use for a 95% cofidece iterval if the width of the iterval should ot be more tha $100? Z σ 1.96*1.96*1000*1000 α/ e 50*50 Questio #4: (5 Poits) The amout of time required for a oil ad filter chage o a automobile is ormally distributed with a mea of 45 miutes ad a stadard deviatio of 10 miutes. A radom sample of 16 cars is selected. 1. Fid the probability that the sample mea is betwee 45 ad 5 miutes? p (45 x 5) p( z ) 10 / / 16 p ( 0 z.8) p( z.8) p( z 0) % of all sample meas will fall betwee what two values? p ( z z z1) p ( 0 z z1) p z z ) z x u x l z z ( 1 1 You may use the followig formulae: x 1 1 i i1 x, S x x, x x Z x i1 i, xi i1 N N X i 1 N N i1 1 x, x, p, p, 8
29 9 s x t, x z p(1 p) p z, Z e, z p 1 p e, z m
30 31
31 31
32 3
Final Examination Solutions 17/6/2010
 The Islamic Uiversity of Gaza Faculty of Commerce epartmet of Ecoomics ad Political Scieces A Itroductio to Statistics Course (ECOE 30) Sprig Semester 009-00 Fial Eamiatio Solutios 7/6/00 Name: I: Istructor:
7-1. Chapter 4. Part I. Sampling Distributions and Confidence Intervals
 7-1 Chapter 4 Part I. Samplig Distributios ad Cofidece Itervals 1 7- Sectio 1. Samplig Distributio 7-3 Usig Statistics Statistical Iferece: Predict ad forecast values of populatio parameters... Test hypotheses
Inferential Statistics. Inference Process. Inferential Statistics and Probability a Holistic Approach. Inference Process.
 Iferetial Statistics ad Probability a Holistic Approach Iferece Process Chapter 8 Poit Estimatio ad Cofidece Itervals This Course Material by Maurice Geraghty is licesed uder a Creative Commos Attributio-ShareAlike
BIOS 4110: Introduction to Biostatistics. Breheny. Lab #9
 BIOS 4110: Itroductio to Biostatistics Brehey Lab #9 The Cetral Limit Theorem is very importat i the realm of statistics, ad today's lab will explore the applicatio of it i both categorical ad cotiuous
Lecture 5. Materials Covered: Chapter 6 Suggested Exercises: 6.7, 6.9, 6.17, 6.20, 6.21, 6.41, 6.49, 6.52, 6.53, 6.62, 6.63.
 STT 315, Summer 006 Lecture 5 Materials Covered: Chapter 6 Suggested Exercises: 67, 69, 617, 60, 61, 641, 649, 65, 653, 66, 663 1 Defiitios Cofidece Iterval: A cofidece iterval is a iterval believed to
Statistics 511 Additional Materials
 Cofidece Itervals o mu Statistics 511 Additioal Materials This topic officially moves us from probability to statistics. We begi to discuss makig ifereces about the populatio. Oe way to differetiate probability
Parameter, Statistic and Random Samples
 Parameter, Statistic ad Radom Samples A parameter is a umber that describes the populatio. It is a fixed umber, but i practice we do ot kow its value. A statistic is a fuctio of the sample data, i.e.,
Continuous Data that can take on any real number (time/length) based on sample data. Categorical data can only be named or categorised
 based on sample data. Categorical data can only be named or categorised") Questio 1. (Topics 1-3) A populatio cosists of all the members of a group about which you wat to draw a coclusio (Greek letters (μ, σ, Ν) are used) A sample is the portio of the populatio selected for
Questio 1. (Topics 1-3) A populatio cosists of all the members of a group about which you wat to draw a coclusio (Greek letters (μ, σ, Ν) are used) A sample is the portio of the populatio selected for
Lecture 1. Statistics: A science of information. Population: The population is the collection of all subjects we re interested in studying.
 Lecture Mai Topics: Defiitios: Statistics, Populatio, Sample, Radom Sample, Statistical Iferece Type of Data Scales of Measuremet Describig Data with Numbers Describig Data Graphically. Defiitios. Example
AP Statistics Review Ch. 8
 AP Statistics Review Ch. 8 Name 1. Each figure below displays the samplig distributio of a statistic used to estimate a parameter. The true value of the populatio parameter is marked o each samplig distributio.
5. A formulae page and two tables are provided at the end of Part A of the examination PART A
 Istructios: 1. You have bee provided with: (a) this questio paper (Part A ad Part B) (b) a multiple choice aswer sheet (for Part A) (c) Log Aswer Sheet(s) (for Part B) (d) a booklet of tables. (a) I PART
- E < p. ˆ p q ˆ E = q ˆ = 1 - p ˆ = sample proportion of x failures in a sample size of n. where. x n sample proportion. population proportion
 1 Chapter 7 ad 8 Review for Exam Chapter 7 Estimates ad Sample Sizes 2 Defiitio Cofidece Iterval (or Iterval Estimate) a rage (or a iterval) of values used to estimate the true value of the populatio parameter
Chapter 1 (Definitions)
") FINAL EXAM REVIEW Chapter 1 (Defiitios) Qualitative: Nomial: Ordial: Quatitative: Ordial: Iterval: Ratio: Observatioal Study: Desiged Experimet: Samplig: Cluster: Stratified: Systematic: Coveiece: Simple
FINAL EXAM REVIEW Chapter 1 (Defiitios) Qualitative: Nomial: Ordial: Quatitative: Ordial: Iterval: Ratio: Observatioal Study: Desiged Experimet: Samplig: Cluster: Stratified: Systematic: Coveiece: Simple
Data Analysis and Statistical Methods Statistics 651
 Data Aalysis ad Statistical Methods Statistics 651 http://www.stat.tamu.edu/~suhasii/teachig.html Suhasii Subba Rao Review of testig: Example The admistrator of a ursig home wats to do a time ad motio
Statistical Inference (Chapter 10) Statistical inference = learn about a population based on the information provided by a sample.
 Statistical inference = learn about a population based on the information provided by a sample.") Statistical Iferece (Chapter 10) Statistical iferece = lear about a populatio based o the iformatio provided by a sample. Populatio: The set of all values of a radom variable X of iterest. Characterized
Statistical Iferece (Chapter 10) Statistical iferece = lear about a populatio based o the iformatio provided by a sample. Populatio: The set of all values of a radom variable X of iterest. Characterized
MBACATÓLICA. Quantitative Methods. Faculdade de Ciências Económicas e Empresariais UNIVERSIDADE CATÓLICA PORTUGUESA 9. SAMPLING DISTRIBUTIONS
 MBACATÓLICA Quatitative Methods Miguel Gouveia Mauel Leite Moteiro Faculdade de Ciêcias Ecoómicas e Empresariais UNIVERSIDADE CATÓLICA PORTUGUESA 9. SAMPLING DISTRIBUTIONS MBACatólica 006/07 Métodos Quatitativos
Instructor: Judith Canner Spring 2010 CONFIDENCE INTERVALS How do we make inferences about the population parameters?
 CONFIDENCE INTERVALS How do we make ifereces about the populatio parameters? The samplig distributio allows us to quatify the variability i sample statistics icludig how they differ from the parameter
Confidence Intervals รศ.ดร. อน นต ผลเพ ม Assoc.Prof. Anan Phonphoem, Ph.D. Intelligent Wireless Network Group (IWING Lab)
") Cofidece Itervals รศ.ดร. อน นต ผลเพ ม Assoc.Prof. Aa Phophoem, Ph.D. aa.p@ku.ac.th Itelliget Wireless Network Group (IWING Lab) http://iwig.cpe.ku.ac.th Computer Egieerig Departmet Kasetsart Uiversity,
Cofidece Itervals รศ.ดร. อน นต ผลเพ ม Assoc.Prof. Aa Phophoem, Ph.D. aa.p@ku.ac.th Itelliget Wireless Network Group (IWING Lab) http://iwig.cpe.ku.ac.th Computer Egieerig Departmet Kasetsart Uiversity,
Mathacle. PSet Stats, Concepts In Statistics Level Number Name: Date:
 PSet ----- Stats, Cocepts I Statistics 7.3. Cofidece Iterval for a Mea i Oe Sample [MATH] The Cetral Limit Theorem. Let...,,, be idepedet, idetically distributed (i.i.d.) radom variables havig mea µ ad
1 Inferential Methods for Correlation and Regression Analysis
 1 Iferetial Methods for Correlatio ad Regressio Aalysis I the chapter o Correlatio ad Regressio Aalysis tools for describig bivariate cotiuous data were itroduced. The sample Pearso Correlatio Coefficiet
Chapter 8: Estimating with Confidence
 Chapter 8: Estimatig with Cofidece Sectio 8.2 The Practice of Statistics, 4 th editio For AP* STARNES, YATES, MOORE Chapter 8 Estimatig with Cofidece 8.1 Cofidece Itervals: The Basics 8.2 8.3 Estimatig
Confidence Intervals QMET103
 Cofidece Itervals QMET103 Library, Teachig ad Learig CONFIDENCE INTERVALS provide a iterval estimate of the ukow populatio parameter. What is a cofidece iterval? Statisticias have a habit of hedgig their
STAT 350 Handout 19 Sampling Distribution, Central Limit Theorem (6.6)
") STAT 350 Hadout 9 Samplig Distributio, Cetral Limit Theorem (6.6) A radom sample is a sequece of radom variables X, X 2,, X that are idepedet ad idetically distributed. o This property is ofte abbreviated
STAT 350 Hadout 9 Samplig Distributio, Cetral Limit Theorem (6.6) A radom sample is a sequece of radom variables X, X 2,, X that are idepedet ad idetically distributed. o This property is ofte abbreviated
KLMED8004 Medical statistics. Part I, autumn Estimation. We have previously learned: Population and sample. New questions
 We have previously leared: KLMED8004 Medical statistics Part I, autum 00 How kow probability distributios (e.g. biomial distributio, ormal distributio) with kow populatio parameters (mea, variace) ca give
(6) Fundamental Sampling Distribution and Data Discription
 Fundamental Sampling Distribution and Data Discription") 34 Stat Lecture Notes (6) Fudametal Samplig Distributio ad Data Discriptio ( Book*: Chapter 8,pg5) Probability& Statistics for Egieers & Scietists By Walpole, Myers, Myers, Ye 8.1 Radom Samplig: Populatio:
34 Stat Lecture Notes (6) Fudametal Samplig Distributio ad Data Discriptio ( Book*: Chapter 8,pg5) Probability& Statistics for Egieers & Scietists By Walpole, Myers, Myers, Ye 8.1 Radom Samplig: Populatio:
Read through these prior to coming to the test and follow them when you take your test.
 Math 143 Sprig 2012 Test 2 Iformatio 1 Test 2 will be give i class o Thursday April 5. Material Covered The test is cummulative, but will emphasize the recet material (Chapters 6 8, 10 11, ad Sectios 12.1
Interval Estimation (Confidence Interval = C.I.): An interval estimate of some population parameter is an interval of the form (, ),
: An interval estimate of some population parameter is an interval of the form (, ),") Cofidece Iterval Estimatio Problems Suppose we have a populatio with some ukow parameter(s). Example: Normal(,) ad are parameters. We eed to draw coclusios (make ifereces) about the ukow parameters. We
Cofidece Iterval Estimatio Problems Suppose we have a populatio with some ukow parameter(s). Example: Normal(,) ad are parameters. We eed to draw coclusios (make ifereces) about the ukow parameters. We
Exam 2 Instructions not multiple versions
 Exam 2 Istructios Remove this sheet of istructios from your exam. You may use the back of this sheet for scratch work. This is a closed book, closed otes exam. You are ot allowed to use ay materials other
Class 23. Daniel B. Rowe, Ph.D. Department of Mathematics, Statistics, and Computer Science. Marquette University MATH 1700
 Class 23 Daiel B. Rowe, Ph.D. Departmet of Mathematics, Statistics, ad Computer Sciece Copyright 2017 by D.B. Rowe 1 Ageda: Recap Chapter 9.1 Lecture Chapter 9.2 Review Exam 6 Problem Solvig Sessio. 2
Overview. p 2. Chapter 9. Pooled Estimate of. q = 1 p. Notation for Two Proportions. Inferences about Two Proportions. Assumptions
 Chapter 9 Slide Ifereces from Two Samples 9- Overview 9- Ifereces about Two Proportios 9- Ifereces about Two Meas: Idepedet Samples 9-4 Ifereces about Matched Pairs 9-5 Comparig Variatio i Two Samples
Understanding Dissimilarity Among Samples
 Aoucemets: Midterm is Wed. Review sheet is o class webpage (i the list of lectures) ad will be covered i discussio o Moday. Two sheets of otes are allowed, same rules as for the oe sheet last time. Office
Estimation of a population proportion March 23,
 1 Social Studies 201 Notes for March 23, 2005 Estimatio of a populatio proportio Sectio 8.5, p. 521. For the most part, we have dealt with meas ad stadard deviatios this semester. This sectio of the otes
Stat 225 Lecture Notes Week 7, Chapter 8 and 11
 Normal Distributio Stat 5 Lecture Notes Week 7, Chapter 8 ad Please also prit out the ormal radom variable table from the Stat 5 homepage. The ormal distributio is by far the most importat distributio
Exam II Covers. STA 291 Lecture 19. Exam II Next Tuesday 5-7pm Memorial Hall (Same place as exam I) Makeup Exam 7:15pm 9:15pm Location CB 234
 Makeup Exam 7:15pm 9:15pm Location CB 234") STA 291 Lecture 19 Exam II Next Tuesday 5-7pm Memorial Hall (Same place as exam I) Makeup Exam 7:15pm 9:15pm Locatio CB 234 STA 291 - Lecture 19 1 Exam II Covers Chapter 9 10.1; 10.2; 10.3; 10.4; 10.6
STA 291 Lecture 19 Exam II Next Tuesday 5-7pm Memorial Hall (Same place as exam I) Makeup Exam 7:15pm 9:15pm Locatio CB 234 STA 291 - Lecture 19 1 Exam II Covers Chapter 9 10.1; 10.2; 10.3; 10.4; 10.6
STAT 155 Introductory Statistics Chapter 6: Introduction to Inference. Lecture 18: Estimation with Confidence
 The UNIVERSITY of NORTH CAROLINA at CHAPEL HILL STAT 155 Itroductory Statistics Chapter 6: Itroductio to Iferece Lecture 18: Estimatio with Cofidece 11/14/06 Lecture 18 1 Itroductio Statistical Iferece
MOST PEOPLE WOULD RATHER LIVE WITH A PROBLEM THEY CAN'T SOLVE, THAN ACCEPT A SOLUTION THEY CAN'T UNDERSTAND.
 XI-1 (1074) MOST PEOPLE WOULD RATHER LIVE WITH A PROBLEM THEY CAN'T SOLVE, THAN ACCEPT A SOLUTION THEY CAN'T UNDERSTAND. R. E. D. WOOLSEY AND H. S. SWANSON XI-2 (1075) STATISTICAL DECISION MAKING Advaced
ENGI 4421 Confidence Intervals (Two Samples) Page 12-01
 Page 12-01") ENGI 44 Cofidece Itervals (Two Samples) Page -0 Two Sample Cofidece Iterval for a Differece i Populatio Meas [Navidi sectios 5.4-5.7; Devore chapter 9] From the cetral limit theorem, we kow that, for sufficietly
ENGI 44 Cofidece Itervals (Two Samples) Page -0 Two Sample Cofidece Iterval for a Differece i Populatio Meas [Navidi sectios 5.4-5.7; Devore chapter 9] From the cetral limit theorem, we kow that, for sufficietly
Chapter 8: STATISTICAL INTERVALS FOR A SINGLE SAMPLE. Part 3: Summary of CI for µ Confidence Interval for a Population Proportion p
 Chapter 8: STATISTICAL INTERVALS FOR A SINGLE SAMPLE Part 3: Summary of CI for µ Cofidece Iterval for a Populatio Proportio p Sectio 8-4 Summary for creatig a 100(1-α)% CI for µ: Whe σ 2 is kow ad paret
Chapter If n is odd, the median is the exact middle number If n is even, the median is the average of the two middle numbers
 Chapter 4 4-1 orth Seattle Commuity College BUS10 Busiess Statistics Chapter 4 Descriptive Statistics Summary Defiitios Cetral tedecy: The extet to which the data values group aroud a cetral value. Variatio:
Economics Spring 2015
 1 Ecoomics 400 -- Sprig 015 /17/015 pp. 30-38; Ch. 7.1.4-7. New Stata Assigmet ad ew MyStatlab assigmet, both due Feb 4th Midterm Exam Thursday Feb 6th, Chapters 1-7 of Groeber text ad all relevat lectures
Common Large/Small Sample Tests 1/55
 Commo Large/Small Sample Tests 1/55 Test of Hypothesis for the Mea (σ Kow) Covert sample result ( x) to a z value Hypothesis Tests for µ Cosider the test H :μ = μ H 1 :μ > μ σ Kow (Assume the populatio
University of California, Los Angeles Department of Statistics. Hypothesis testing
 Uiversity of Califoria, Los Ageles Departmet of Statistics Statistics 100B Elemets of a hypothesis test: Hypothesis testig Istructor: Nicolas Christou 1. Null hypothesis, H 0 (claim about µ, p, σ 2, µ
Comparing Two Populations. Topic 15 - Two Sample Inference I. Comparing Two Means. Comparing Two Pop Means. Background Reading
 Topic 15 - Two Sample Iferece I STAT 511 Professor Bruce Craig Comparig Two Populatios Research ofte ivolves the compariso of two or more samples from differet populatios Graphical summaries provide visual
Estimating the Population Mean - when a sample average is calculated we can create an interval centered on this average
 6. Cofidece Iterval for the Populatio Mea p58 Estimatig the Populatio Mea - whe a sample average is calculated we ca create a iterval cetered o this average x-bar - at a predetermied level of cofidece
ST 305: Exam 3 ( ) = P(A)P(B A) ( ) = P(A) + P(B) ( ) = 1 P( A) ( ) = P(A) P(B) σ X 2 = σ a+bx. σ ˆp. σ X +Y. σ X Y. σ X. σ Y. σ n.
 = P(A)P(B A) ( ) = P(A) + P(B) ( ) = 1 P( A) ( ) = P(A) P(B) σ X 2 = σ a+bx. σ ˆp. σ X +Y. σ X Y. σ X. σ Y. σ n.") ST 305: Exam 3 By hadig i this completed exam, I state that I have either give or received assistace from aother perso durig the exam period. I have used o resources other tha the exam itself ad the basic
ST 305: Exam 3 By hadig i this completed exam, I state that I have either give or received assistace from aother perso durig the exam period. I have used o resources other tha the exam itself ad the basic
April 18, 2017 CONFIDENCE INTERVALS AND HYPOTHESIS TESTING, UNDERGRADUATE MATH 526 STYLE
 April 18, 2017 CONFIDENCE INTERVALS AND HYPOTHESIS TESTING, UNDERGRADUATE MATH 526 STYLE TERRY SOO Abstract These otes are adapted from whe I taught Math 526 ad meat to give a quick itroductio to cofidece
Discrete Mathematics for CS Spring 2008 David Wagner Note 22
 CS 70 Discrete Mathematics for CS Sprig 2008 David Wager Note 22 I.I.D. Radom Variables Estimatig the bias of a coi Questio: We wat to estimate the proportio p of Democrats i the US populatio, by takig
IE 230 Probability & Statistics in Engineering I. Closed book and notes. No calculators. 120 minutes.
 Closed book ad otes. No calculators. 120 miutes. Cover page, five pages of exam, ad tables for discrete ad cotiuous distributios. Score X i =1 X i / S X 2 i =1 (X i X ) 2 / ( 1) = [i =1 X i 2 X 2 ] / (
A quick activity - Central Limit Theorem and Proportions. Lecture 21: Testing Proportions. Results from the GSS. Statistics and the General Population
 A quick activity - Cetral Limit Theorem ad Proportios Lecture 21: Testig Proportios Statistics 10 Coli Rudel Flip a coi 30 times this is goig to get loud! Record the umber of heads you obtaied ad calculate
(7 One- and Two-Sample Estimation Problem )
") 34 Stat Lecture Notes (7 Oe- ad Two-Sample Estimatio Problem ) ( Book*: Chapter 8,pg65) Probability& Statistics for Egieers & Scietists By Walpole, Myers, Myers, Ye Estimatio 1 ) ( ˆ S P i i Poit estimate:
34 Stat Lecture Notes (7 Oe- ad Two-Sample Estimatio Problem ) ( Book*: Chapter 8,pg65) Probability& Statistics for Egieers & Scietists By Walpole, Myers, Myers, Ye Estimatio 1 ) ( ˆ S P i i Poit estimate:
Expectation and Variance of a random variable
 Chapter 11 Expectatio ad Variace of a radom variable The aim of this lecture is to defie ad itroduce mathematical Expectatio ad variace of a fuctio of discrete & cotiuous radom variables ad the distributio
Chapter 6 Sampling Distributions
 Chapter 6 Samplig Distributios 1 I most experimets, we have more tha oe measuremet for ay give variable, each measuremet beig associated with oe radomly selected a member of a populatio. Hece we eed to
STP 226 EXAMPLE EXAM #1
 STP 226 EXAMPLE EXAM #1 Istructor: Hoor Statemet: I have either give or received iformatio regardig this exam, ad I will ot do so util all exams have bee graded ad retured. PRINTED NAME: Siged Date: DIRECTIONS:
Topic 10: Introduction to Estimation
 Topic 0: Itroductio to Estimatio Jue, 0 Itroductio I the simplest possible terms, the goal of estimatio theory is to aswer the questio: What is that umber? What is the legth, the reactio rate, the fractio
24.1 Confidence Intervals and Margins of Error
 24.1 Cofidece Itervals ad Margis of Error Essetial Questio: How do you calculate a cofidece iterval ad a margi of error for a populatio proportio or populatio mea? Resource Locker Explore Idetifyig Likely
Mathacle. PSet Stats, Concepts In Statistics Level Number Name: Date: Confidence Interval Guesswork with Confidence
 PSet ----- Stats, Cocepts I Statistics Cofidece Iterval Guesswork with Cofidece VII. CONFIDENCE INTERVAL 7.1. Sigificace Level ad Cofidece Iterval (CI) The Sigificace Level The sigificace level, ofte deoted
Statistical Intervals for a Single Sample
 3/5/06 Applied Statistics ad Probability for Egieers Sixth Editio Douglas C. Motgomery George C. Ruger Chapter 8 Statistical Itervals for a Sigle Sample 8 CHAPTER OUTLINE 8- Cofidece Iterval o the Mea
UNIVERSITY OF TORONTO Faculty of Arts and Science APRIL/MAY 2009 EXAMINATIONS ECO220Y1Y PART 1 OF 2 SOLUTIONS
 PART of UNIVERSITY OF TORONTO Faculty of Arts ad Sciece APRIL/MAY 009 EAMINATIONS ECO0YY PART OF () The sample media is greater tha the sample mea whe there is. (B) () A radom variable is ormally distributed
Class 27. Daniel B. Rowe, Ph.D. Department of Mathematics, Statistics, and Computer Science. Marquette University MATH 1700
 Class 7 Daiel B. Rowe, Ph.D. Departmet of Mathematics, Statistics, ad Computer Sciece Copyright 013 by D.B. Rowe 1 Ageda: Skip Recap Chapter 10.5 ad 10.6 Lecture Chapter 11.1-11. Review Chapters 9 ad 10
STAT 203 Chapter 18 Sampling Distribution Models
 STAT 203 Chapter 18 Samplig Distributio Models Populatio vs. sample, parameter vs. statistic Recall that a populatio cotais the etire collectio of idividuals that oe wats to study, ad a sample is a subset
Properties and Hypothesis Testing
 Chapter 3 Properties ad Hypothesis Testig 3.1 Types of data The regressio techiques developed i previous chapters ca be applied to three differet kids of data. 1. Cross-sectioal data. 2. Time series data.
CHAPTER 2. Mean This is the usual arithmetic mean or average and is equal to the sum of the measurements divided by number of measurements.
 CHAPTER 2 umerical Measures Graphical method may ot always be sufficiet for describig data. You ca use the data to calculate a set of umbers that will covey a good metal picture of the frequecy distributio.
Statistical inference: example 1. Inferential Statistics
 Statistical iferece: example 1 Iferetial Statistics POPULATION SAMPLE A clothig store chai regularly buys from a supplier large quatities of a certai piece of clothig. Each item ca be classified either
Sample Size Determination (Two or More Samples)
") Sample Sie Determiatio (Two or More Samples) STATGRAPHICS Rev. 963 Summary... Data Iput... Aalysis Summary... 5 Power Curve... 5 Calculatios... 6 Summary This procedure determies a suitable sample sie
Sample Sie Determiatio (Two or More Samples) STATGRAPHICS Rev. 963 Summary... Data Iput... Aalysis Summary... 5 Power Curve... 5 Calculatios... 6 Summary This procedure determies a suitable sample sie
Eco411 Lab: Central Limit Theorem, Normal Distribution, and Journey to Girl State
 Eco411 Lab: Cetral Limit Theorem, Normal Distributio, ad Jourey to Girl State 1. Some studets may woder why the magic umber 1.96 or 2 (called critical values) is so importat i statistics. Where do they
Agreement of CI and HT. Lecture 13 - Tests of Proportions. Example - Waiting Times
 Sigificace level vs. cofidece level Agreemet of CI ad HT Lecture 13 - Tests of Proportios Sta102 / BME102 Coli Rudel October 15, 2014 Cofidece itervals ad hypothesis tests (almost) always agree, as log
Section 9.2. Tests About a Population Proportion 12/17/2014. Carrying Out a Significance Test H A N T. Parameters & Hypothesis
 Sectio 9.2 Tests About a Populatio Proportio P H A N T O M S Parameters Hypothesis Assess Coditios Name the Test Test Statistic (Calculate) Obtai P value Make a decisio State coclusio Sectio 9.2 Tests
1036: Probability & Statistics
 036: Probability & Statistics Lecture 0 Oe- ad Two-Sample Tests of Hypotheses 0- Statistical Hypotheses Decisio based o experimetal evidece whether Coffee drikig icreases the risk of cacer i humas. A perso
Computing Confidence Intervals for Sample Data
 Computig Cofidece Itervals for Sample Data Topics Use of Statistics Sources of errors Accuracy, precisio, resolutio A mathematical model of errors Cofidece itervals For meas For variaces For proportios
DAWSON COLLEGE DEPARTMENT OF MATHEMATICS 201-BZS-05 PROBABILITY AND STATISTICS FALL 2015 FINAL EXAM
 DAWSON COLLEGE DEPARTMENT OF MATHEMATICS 201-BZS-05 PROBABILITY AND STATISTICS FALL 2015 FINAL EXAM Name: Date: December 24th, 2015 Studet Number: Time: 9:30 12:30 Grade: / 116 Examier: Matthew MARCHANT
Confidence Intervals for the Population Proportion p
 Cofidece Itervals for the Populatio Proportio p The cocept of cofidece itervals for the populatio proportio p is the same as the oe for, the samplig distributio of the mea, x. The structure is idetical:
HYPOTHESIS TESTS FOR ONE POPULATION MEAN WORKSHEET MTH 1210, FALL 2018
 HYPOTHESIS TESTS FOR ONE POPULATION MEAN WORKSHEET MTH 1210, FALL 2018 We are resposible for 2 types of hypothesis tests that produce ifereces about the ukow populatio mea, µ, each of which has 3 possible
Simulation. Two Rule For Inverting A Distribution Function
 Simulatio Two Rule For Ivertig A Distributio Fuctio Rule 1. If F(x) = u is costat o a iterval [x 1, x 2 ), the the uiform value u is mapped oto x 2 through the iversio process. Rule 2. If there is a jump
Stat 421-SP2012 Interval Estimation Section
 Stat 41-SP01 Iterval Estimatio Sectio 11.1-11. We ow uderstad (Chapter 10) how to fid poit estimators of a ukow parameter. o However, a poit estimate does ot provide ay iformatio about the ucertaity (possible
MEASURES OF DISPERSION (VARIABILITY)
") POLI 300 Hadout #7 N. R. Miller MEASURES OF DISPERSION (VARIABILITY) While measures of cetral tedecy idicate what value of a variable is (i oe sese or other, e.g., mode, media, mea), average or cetral
POLI 300 Hadout #7 N. R. Miller MEASURES OF DISPERSION (VARIABILITY) While measures of cetral tedecy idicate what value of a variable is (i oe sese or other, e.g., mode, media, mea), average or cetral
CHAPTER 8 FUNDAMENTAL SAMPLING DISTRIBUTIONS AND DATA DESCRIPTIONS. 8.1 Random Sampling. 8.2 Some Important Statistics
 CHAPTER 8 FUNDAMENTAL SAMPLING DISTRIBUTIONS AND DATA DESCRIPTIONS 8.1 Radom Samplig The basic idea of the statistical iferece is that we are allowed to draw ifereces or coclusios about a populatio based
Frequentist Inference
 Frequetist Iferece The topics of the ext three sectios are useful applicatios of the Cetral Limit Theorem. Without kowig aythig about the uderlyig distributio of a sequece of radom variables {X i }, for
Statisticians use the word population to refer the total number of (potential) observations under consideration
 observations under consideration") 6 Samplig Distributios Statisticias use the word populatio to refer the total umber of (potetial) observatios uder cosideratio The populatio is just the set of all possible outcomes i our sample space
6 Samplig Distributios Statisticias use the word populatio to refer the total umber of (potetial) observatios uder cosideratio The populatio is just the set of all possible outcomes i our sample space
Chapter 13, Part A Analysis of Variance and Experimental Design
 Slides Prepared by JOHN S. LOUCKS St. Edward s Uiversity Slide 1 Chapter 13, Part A Aalysis of Variace ad Eperimetal Desig Itroductio to Aalysis of Variace Aalysis of Variace: Testig for the Equality of
STA Learning Objectives. Population Proportions. Module 10 Comparing Two Proportions. Upon completing this module, you should be able to:
 STA 2023 Module 10 Comparig Two Proportios Learig Objectives Upo completig this module, you should be able to: 1. Perform large-sample ifereces (hypothesis test ad cofidece itervals) to compare two populatio
Chapter 2 Descriptive Statistics
 Chapter 2 Descriptive Statistics Statistics Most commoly, statistics refers to umerical data. Statistics may also refer to the process of collectig, orgaizig, presetig, aalyzig ad iterpretig umerical data
Chapter 23: Inferences About Means
 Chapter 23: Ifereces About Meas Eough Proportios! We ve spet the last two uits workig with proportios (or qualitative variables, at least) ow it s time to tur our attetios to quatitative variables. For
Data Description. Measure of Central Tendency. Data Description. Chapter x i
 Data Descriptio Describe Distributio with Numbers Example: Birth weights (i lb) of 5 babies bor from two groups of wome uder differet care programs. Group : 7, 6, 8, 7, 7 Group : 3, 4, 8, 9, Chapter 3
BIOSTATISTICS. Lecture 5 Interval Estimations for Mean and Proportion. dr. Petr Nazarov
 Microarray Ceter BIOSTATISTICS Lecture 5 Iterval Estimatios for Mea ad Proportio dr. Petr Nazarov 15-03-013 petr.azarov@crp-sate.lu Lecture 5. Iterval estimatio for mea ad proportio OUTLINE Iterval estimatios
MIT : Quantitative Reasoning and Statistical Methods for Planning I
 MIT 11.220 Sprig 06 Recitatio 4 March 16, 2006 MIT - 11.220: Quatitative Reasoig ad Statistical Methods for Plaig I Recitatio #4: Sprig 2006 Cofidece Itervals ad Hypothesis Testig I. Cofidece Iterval 1.
multiplies all measures of center and the standard deviation and range by k, while the variance is multiplied by k 2.
 Lesso 3- Lesso 3- Scale Chages of Data Vocabulary scale chage of a data set scale factor scale image BIG IDEA Multiplyig every umber i a data set by k multiplies all measures of ceter ad the stadard deviatio
6.041/6.431 Spring 2009 Final Exam Thursday, May 21, 1:30-4:30 PM.
 6.041/6.431 Sprig 2009 Fial Exam Thursday, May 21, 1:30-4:30 PM. Name: Recitatio Istructor: Questio Part Score Out of 0 2 1 all 18 2 all 24 3 a 4 b 4 c 4 4 a 6 b 6 c 6 5 a 6 b 6 6 a 4 b 4 c 4 d 5 e 5 7
INTRODUCTORY MATHEMATICS AND STATISTICS FOR ECONOMISTS
 UNIVERSITY OF EAST ANGLIA School of Ecoomics Mai Series UG Examiatio 04-5 INTRODUCTORY MATHEMATICS AND STATISTICS FOR ECONOMISTS ECO-400Y Time allowed: 3 hours Aswer ALL questios. Show all workig icludig
FACULTY OF MATHEMATICAL STUDIES MATHEMATICS FOR PART I ENGINEERING. Lectures
 FACULTY OF MATHEMATICAL STUDIES MATHEMATICS FOR PART I ENGINEERING Lectures MODULE 5 STATISTICS II. Mea ad stadard error of sample data. Biomial distributio. Normal distributio 4. Samplig 5. Cofidece itervals
October 25, 2018 BIM 105 Probability and Statistics for Biomedical Engineers 1
 October 25, 2018 BIM 105 Probability ad Statistics for Biomedical Egieers 1 Populatio parameters ad Sample Statistics October 25, 2018 BIM 105 Probability ad Statistics for Biomedical Egieers 2 Ifereces
Chapter 20. Comparing Two Proportions. BPS - 5th Ed. Chapter 20 1
 Chapter 0 Comparig Two Proportios BPS - 5th Ed. Chapter 0 Case Study Machie Reliability A study is performed to test of the reliability of products produced by two machies. Machie A produced 8 defective
The Hong Kong University of Science & Technology ISOM551 Introductory Statistics for Business Assignment 3 Suggested Solution
 The Hog Kog Uiversity of ciece & Techology IOM55 Itroductory tatistics for Busiess Assigmet 3 uggested olutio Note All values of statistics i Q ad Q4 are obtaied by Excel. Qa. Let be the robability that
a.) If random samples of size n=16 are selected, can we say anything about the x~ distribution of sample means?
 If random samples of size n=16 are selected, can we say anything about the x~ distribution of sample means?") Sectio 7.5 4.) Suppose that x has a distributio with u=72 ad r=8. a.) If radom samples of size =16 are selected, ca we say aythig about the x~ distributio of sample meas? 8 X N 72, N 72, 2 16 b.) If the
Sectio 7.5 4.) Suppose that x has a distributio with u=72 ad r=8. a.) If radom samples of size =16 are selected, ca we say aythig about the x~ distributio of sample meas? 8 X N 72, N 72, 2 16 b.) If the
MATH/STAT 352: Lecture 15
 MATH/STAT 352: Lecture 15 Sectios 5.2 ad 5.3. Large sample CI for a proportio ad small sample CI for a mea. 1 5.2: Cofidece Iterval for a Proportio Estimatig proportio of successes i a biomial experimet
Census. Mean. µ = x 1 + x x n n
 MATH 183 Basic Statistics Dr. Neal, WKU Let! be a populatio uder cosideratio ad let X be a specific measuremet that we are aalyzig. For example,! = All U.S. households ad X = Number of childre (uder age
This is an introductory course in Analysis of Variance and Design of Experiments.
 1 Notes for M 384E, Wedesday, Jauary 21, 2009 (Please ote: I will ot pass out hard-copy class otes i future classes. If there are writte class otes, they will be posted o the web by the ight before class
Economics 250 Assignment 1 Suggested Answers. 1. We have the following data set on the lengths (in minutes) of a sample of long-distance phone calls
 of a sample of long-distance phone calls") Ecoomics 250 Assigmet 1 Suggested Aswers 1. We have the followig data set o the legths (i miutes) of a sample of log-distace phoe calls 1 20 10 20 13 23 3 7 18 7 4 5 15 7 29 10 18 10 10 23 4 12 8 6 (1)
Ecoomics 250 Assigmet 1 Suggested Aswers 1. We have the followig data set o the legths (i miutes) of a sample of log-distace phoe calls 1 20 10 20 13 23 3 7 18 7 4 5 15 7 29 10 18 10 10 23 4 12 8 6 (1)
Chapter 6. Sampling and Estimation
 Samplig ad Estimatio - 34 Chapter 6. Samplig ad Estimatio 6.. Itroductio Frequetly the egieer is uable to completely characterize the etire populatio. She/he must be satisfied with examiig some subset
If, for instance, we were required to test whether the population mean μ could be equal to a certain value μ
 STATISTICAL INFERENCE INTRODUCTION Statistical iferece is that brach of Statistics i which oe typically makes a statemet about a populatio based upo the results of a sample. I oesample testig, we essetially
Econ 325/327 Notes on Sample Mean, Sample Proportion, Central Limit Theorem, Chi-square Distribution, Student s t distribution 1.
 Eco 325/327 Notes o Sample Mea, Sample Proportio, Cetral Limit Theorem, Chi-square Distributio, Studet s t distributio 1 Sample Mea By Hiro Kasahara We cosider a radom sample from a populatio. Defiitio