Space, time and cities. Analysis of the concentration and dynamics of the Chilean urban system.
|
|
|
- Christopher Ryan
- 5 years ago
- Views:
Transcription
1 Space, time and cities. Analysis of the concentration and dynamics of the Chilean urban system. Andres Vallone PhD Student 2016
2 Contents Motivation and objectives Data Concentration analysis Dynamics analysis Conclusion
3 Introduction The process of urbanization have not being homogeneous across space, each country faces particular circumstances. Spatial proximity among human settlements affects the evolution of urban systems (Le Gallo and Chasco, 2008; Favaro and Pumain, 2011; Xu and Harriss, 2009). The evolution of an urban system highly depends of the development of its corresponding country history (Jedwab et al, 2013). There is consensus about the fact that an increase in agglomeration during the industrialization periods is followed by a dispersion process in the post industrialization period (Willianson, 1965; Parr, 1985; Brackman et al, 1999; Fujita et al., 2001). The hierarchy of cities tends to an increase in stability between the industrialization and post industrialization period (Vallone and Atienza, 2012)
4 Objective The aim of this paper is analysing the concentration and dynamics of the Chilean urban system during the period , considering the effect that space have over them.
.")
5 Why Chile? Chile has a particular geography. The Chilean urban system has its origin in the Colonial cities, with a low level of spatial concentration (Geisse, 1978). Concentration of the population and economic activities in the Metropolitan Region increase during the industrialization period (Geisse 1977; 1978; De Mattos, 1999). However, after 1975 in the midst of the post industrialization period and despite the growth of some intermediate cities, the primacy of the Metropolitan Region increase.
6 The shape of the Chilean cities distribution I Full System Whitout MR Full System Whitout MR N = 184 Bandwidth = N = 184 Bandwidth = (a) 1930 (b) 2002
7 The shape of the Chilean cities distribution II Full System Metropolitan Region N = 184 Bandwidth = N = 22 Bandwidth = (c) Full system (d) Metropolitan Region
8 Data The source of data is National Statistics Institute of Chile City are urban entities of more than 5000 inhabitants Since 184 cities in 2002 a balanced panel data was build min max 698, ,946 1,401,558 1,922,807 median 2,408 2,933 3,506 4,708 mean 11, , , , std.dev 53, , , , coef.var min 35 1,132 1,999 5,113 max 2,233,143 3,654,760 4,295,593 5,428,590 median mean 32, , , , std.dev 166, , , , coef.var
9 Concentration Index We use the Zipf s coefficient as concentration index. Like in LeGallo and Chasco (2008), we estimate the Zipf s coefficient for the Chilean cities with an spatial cross-regressive SUR model log R = α + β log P + θw log P + ɛ The W matrix is inverse distance matrix As robustness analysis 2 different sample of cites and 4 types of spatial weight matrix was use.
10 Estimation Result Complete city group Without MR cities OLS SUR SXLSUR OLS SUR LP *** *** *** *** *** LP *** *** *** *** *** LP *** *** *** *** *** LP *** *** *** *** *** LP *** *** *** *** *** LP *** *** *** *** *** LP *** *** *** *** *** LP *** *** *** *** *** W L P W L P W L P W L P W L P W L P W L P W L P Goodness of fit LIK Homogeneity across equations Wald on LP variable *** *** Diagonality of error covariance matrix LM test *** 2394 *** Model comparison Log-likelihood Ratio (LR) test SUR versus OLS *** *** SDSUR versus SAR * SXSUR versus SUR *** SDSUR versus SXSUR Spatial dependence on the residuals (inverse distance spatial weights matrix) LM, spatial error model LM, spatial lag model * p < 0.01; p < 0.05; p < 0.1
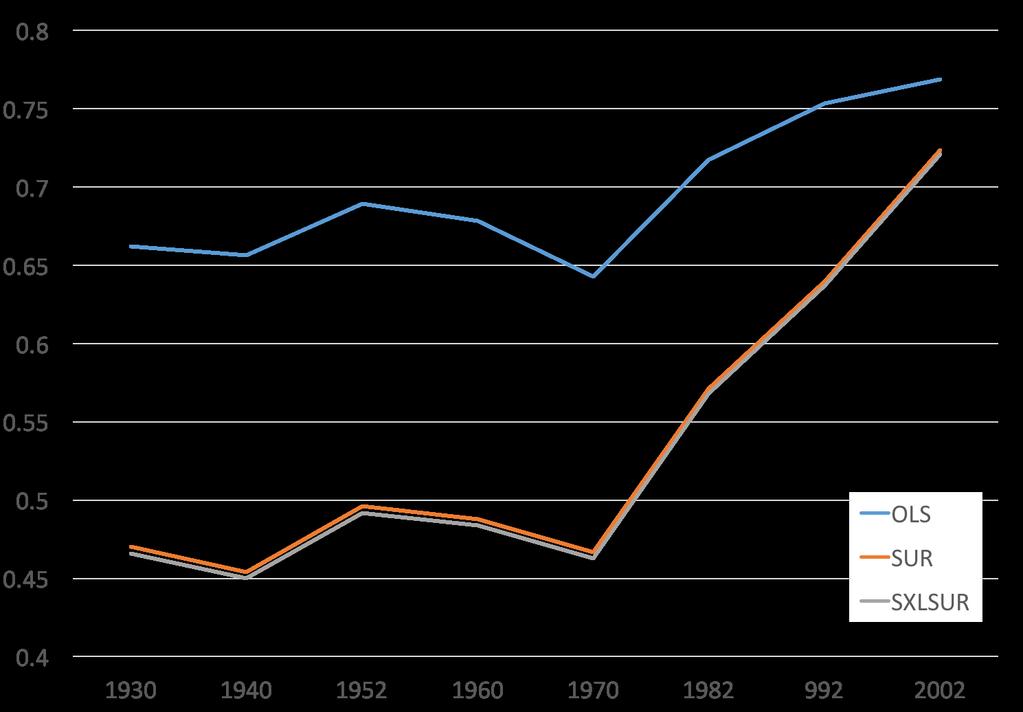
11 Estimation Result

12 Concentration evolution
13 Dynamic of the ranking To analyze the dynamic of the system we use two methods: Markov s transition matrix: estimate the spatial transition matrix (Rey, 2001) and LISA transition Matrix (Rey and Janikas 2006) Ranking dynamics analysis: estimate the Spatial Tau and his decomposition Rey (2004) As robustness analysis the spatial transition matrix was make with 3 different weight matrix and 4 different spatial regime was use in the estimation of the spatial tau.
14 Markov s transition matrix Spatial Markov The data are pooled over space and time in quintiles calculated for the pooled data. The Spatial Markov allows us to compare the global transition dynamics to those conditioned on regional context. More specifically, the transition dynamics are split across economies who have spatial lags in different quintiles at the beginning of the period LISA transition Matrix Consider the joint transitions of an observation and its spatial lag in the distribution The states of the chain are defined as the four quadrants in the Moran scatter plot Example
15 Markov transition matrix 2002 State Q1 Q2 Q3 Q4 Q5 Q Q Q Q Q
16 Spatial Markov Matrix Q1 Q2 Q3 Q4 Q5 Q1 Q2 Q3 Q4 Q5 Q Q Q Q L 1 Q L 4 Q Q Q Q Q Q Q Q Q L 2 Q L 5 Q Q Q Q Q Q Q L 3 Q Q Q The Chi-square test and the Likelihood ratio statistic of homogeneity across lag classes (Bickenbach and Bode, 2003) are Q= LR= with d.f=44 (pvalue=(0.000; 0.000))
17 LISA Markov probability matrix HH LH LL HL HH LH LL HL The Chi Square test under the null hypothesis of the dynamics of a city are independent of dynamics of the neighbours is with dof=9 (pvalue=0.0)
18 Spatial Tau Kendall s Tau is based on a comparison of the number of pairs of n observations that have concordant ranks between two variables. τ (f, g) = n 2 i=1 n 1 j=i+1 sgn ( ) ( ) f i f j sgn gi g j n (n 1) 2 = c d n (n 1) 2 Any pair (f i, g i ) and (f j, g j ), where i j, are said to be concordant if the ranks for both elements agree: that is, if both f i > f j and g i > g j or if both f i < f j and g i < g j. The spatial Tau decomposes these pairs into those that are spatial neighbours and those that are not, and examines whether the rank correlation is different between the two sets relative to what would be expected under spatial randomness. Example

19 Rank Dynamics Period M τ τ p-value M W τ W τ W p-value
20 Rank Decomposition For a sequence of time periods, θ measures the extent to which rank changes for a variable measured over n locations are in the same direction within mutually exclusive and exhaustive partitions (regimes) of the n locations R i R i,t θ 1 i,t 0 Θ t1 t 0 = i,t1 θ i,t0 Theta is defined as the sum of the absolute sum of rank changes within the regimes over the sum of all absolute rank changes. If all regime move in the same direction the index assume a value of 1, the absence of cohesion mean a index equal to 0. i
21 Rank Decomposition Period θ Right p-value Left p-value
22 Conclusion Zipf s coefficient show a high level of spatial concentration activity across all analysis period The sprawl of the MR is decremented by the growth of the intermediate cities. The path dependence play an important role in the dynamic of the system. The dynamics of the urban system is spatial no homogeneous Extras
23 Thank your for your attention, comments are welcome
24 Ranking Movility Return
25 Example using block weight based in Rey(2015) Period t Period t pairs 114 concordant pairs τ = discordant pairs are all in the same regime τ W = 0.50 = (18 6)/24, p value = 0.001, τ W = 1.00 Return
26 Example LISA Markov Period 0 Wx Wx F C B E A D x Period 1 D F C E A B t 0 t 0 Point Own Lag Own Lag A L L L L B L H L L C H H H H D L L H H E H L L L F L H H H HH LH LL HL HH LH LL HL Return x
27 Directional LISA Wx t0 t1 Wx t0 t x x Wx x
28 Directional LISA Wx RM norm Wx RM norm x x Wx RM norm Wx RM norm x x Return
SPACE Workshop NSF NCGIA CSISS UCGIS SDSU. Aldstadt, Getis, Jankowski, Rey, Weeks SDSU F. Goodchild, M. Goodchild, Janelle, Rebich UCSB
 SPACE Workshop NSF NCGIA CSISS UCGIS SDSU Aldstadt, Getis, Jankowski, Rey, Weeks SDSU F. Goodchild, M. Goodchild, Janelle, Rebich UCSB August 2-8, 2004 San Diego State University Some Examples of Spatial
Knowledge Spillovers, Spatial Dependence, and Regional Economic Growth in U.S. Metropolitan Areas. Up Lim, B.A., M.C.P.
 Knowledge Spillovers, Spatial Dependence, and Regional Economic Growth in U.S. Metropolitan Areas by Up Lim, B.A., M.C.P. DISSERTATION Presented to the Faculty of the Graduate School of The University
Lecture 6: Hypothesis Testing
 Lecture 6: Hypothesis Testing Mauricio Sarrias Universidad Católica del Norte November 6, 2017 1 Moran s I Statistic Mandatory Reading Moran s I based on Cliff and Ord (1972) Kelijan and Prucha (2001)
Measures of Spatial Dependence
 Measures of Spatial Dependence Carlos Hurtado Department of Economics University of Illinois at Urbana-Champaign hrtdmrt2@illinois.edu Junel 30th, 2016 C. Hurtado (UIUC - Economics) Spatial Econometrics
Economics 582 Random Effects Estimation
 Economics 582 Random Effects Estimation Eric Zivot May 29, 2013 Random Effects Model Hence, the model can be re-written as = x 0 β + + [x ] = 0 (no endogeneity) [ x ] = = + x 0 β + + [x ] = 0 [ x ] = 0
Spatial Regression. 10. Specification Tests (2) Luc Anselin. Copyright 2017 by Luc Anselin, All Rights Reserved
 Luc Anselin. Copyright 2017 by Luc Anselin, All Rights Reserved") Spatial Regression 10. Specification Tests (2) Luc Anselin http://spatial.uchicago.edu 1 robust LM tests higher order tests 2SLS residuals specification search 2 Robust LM Tests 3 Recap and Notation LM-Error
Spatial Regression 10. Specification Tests (2) Luc Anselin http://spatial.uchicago.edu 1 robust LM tests higher order tests 2SLS residuals specification search 2 Robust LM Tests 3 Recap and Notation LM-Error
A Meta-Analysis of the Urban Wage Premium
 A Meta-Analysis of the Urban Wage Premium Ayoung Kim Dept. of Agricultural Economics, Purdue University kim1426@purdue.edu November 21, 2014 SHaPE seminar 2014 November 21, 2014 1 / 16 Urban Wage Premium
Spatial Regression. 15. Spatial Panels (3) Luc Anselin. Copyright 2017 by Luc Anselin, All Rights Reserved
 Luc Anselin. Copyright 2017 by Luc Anselin, All Rights Reserved") Spatial Regression 15. Spatial Panels (3) Luc Anselin http://spatial.uchicago.edu 1 spatial SUR spatial lag SUR spatial error SUR 2 Spatial SUR 3 Specification 4 Classic Seemingly Unrelated Regressions
Spatial Regression 15. Spatial Panels (3) Luc Anselin http://spatial.uchicago.edu 1 spatial SUR spatial lag SUR spatial error SUR 2 Spatial SUR 3 Specification 4 Classic Seemingly Unrelated Regressions
Efficient estimation of a semiparametric dynamic copula model
 Efficient estimation of a semiparametric dynamic copula model Christian Hafner Olga Reznikova Institute of Statistics Université catholique de Louvain Louvain-la-Neuve, Blgium 30 January 2009 Young Researchers
Urbanisation Dynamics in West Africa AFRICAPOLIS I, 2015 UPDATE
 Public Disclosure Authorized Public Disclosure Authorized Urbanisation Dynamics in West Africa 1950 2010 AFRICAPOLIS I, 2015 UPDATE uy François Moriconi-Ebrard, Dominique Harre, Philipp Heinrigs Washington
UNIVERSITY OF MASSACHUSETTS. Department of Mathematics and Statistics. Basic Exam - Applied Statistics. Tuesday, January 17, 2017
 UNIVERSITY OF MASSACHUSETTS Department of Mathematics and Statistics Basic Exam - Applied Statistics Tuesday, January 17, 2017 Work all problems 60 points are needed to pass at the Masters Level and 75
Nonstationary Panels
 Nonstationary Panels Based on chapters 12.4, 12.5, and 12.6 of Baltagi, B. (2005): Econometric Analysis of Panel Data, 3rd edition. Chichester, John Wiley & Sons. June 3, 2009 Agenda 1 Spurious Regressions
Dependence. MFM Practitioner Module: Risk & Asset Allocation. John Dodson. September 11, Dependence. John Dodson. Outline.
 MFM Practitioner Module: Risk & Asset Allocation September 11, 2013 Before we define dependence, it is useful to define Random variables X and Y are independent iff For all x, y. In particular, F (X,Y
Testing for Regime Switching in Singaporean Business Cycles
 Testing for Regime Switching in Singaporean Business Cycles Robert Breunig School of Economics Faculty of Economics and Commerce Australian National University and Alison Stegman Research School of Pacific
Dependence. Practitioner Course: Portfolio Optimization. John Dodson. September 10, Dependence. John Dodson. Outline.
 Practitioner Course: Portfolio Optimization September 10, 2008 Before we define dependence, it is useful to define Random variables X and Y are independent iff For all x, y. In particular, F (X,Y ) (x,
Outline. Overview of Issues. Spatial Regression. Luc Anselin
 Spatial Regression Luc Anselin University of Illinois, Urbana-Champaign http://www.spacestat.com Outline Overview of Issues Spatial Regression Specifications Space-Time Models Spatial Latent Variable Models
Title. Description. var intro Introduction to vector autoregressive models
 Title var intro Introduction to vector autoregressive models Description Stata has a suite of commands for fitting, forecasting, interpreting, and performing inference on vector autoregressive (VAR) models
Financial Development and Economic Growth in Henan Province Based on Spatial Econometric Model
 International Journal of Contemporary Mathematical Sciences Vol. 12, 2017, no. 5, 209-216 HIKARI Ltd, www.m-hikari.com https://doi.org/10.12988/ijcms.2017.7727 Financial Development and Economic Growth
Departamento de Economía Universidad de Chile
 Departamento de Economía Universidad de Chile GRADUATE COURSE SPATIAL ECONOMETRICS November 14, 16, 17, 20 and 21, 2017 Prof. Henk Folmer University of Groningen Objectives The main objective of the course
Spatial Stochastic frontier models: Instructions for use
 Spatial Stochastic frontier models: Instructions for use Elisa Fusco & Francesco Vidoli June 9, 2015 In the last decade stochastic frontiers traditional models (see Kumbhakar and Lovell, 2000 for a detailed
Forecasting Regional Employment in Germany: A Review of Neural Network Approaches. Objectives:
 Forecasting Regional Employment in Germany: A Review of Neural Network Approaches Peter Nijkamp, Aura Reggiani, Roberto Patuelli Objectives: To develop and apply Neural Network (NN) models in order to
Review of Classical Least Squares. James L. Powell Department of Economics University of California, Berkeley
 Review of Classical Least Squares James L. Powell Department of Economics University of California, Berkeley The Classical Linear Model The object of least squares regression methods is to model and estimate
Markov-Switching Models with Endogenous Explanatory Variables. Chang-Jin Kim 1
 Markov-Switching Models with Endogenous Explanatory Variables by Chang-Jin Kim 1 Dept. of Economics, Korea University and Dept. of Economics, University of Washington First draft: August, 2002 This version:
y it = α i + β 0 ix it + ε it (0.1) The panel data estimators for the linear model are all standard, either the application of OLS or GLS.
 The panel data estimators for the linear model are all standard, either the application of OLS or GLS.") 0.1. Panel Data. Suppose we have a panel of data for groups (e.g. people, countries or regions) i =1, 2,..., N over time periods t =1, 2,..., T on a dependent variable y it and a kx1 vector of independent
0.1. Panel Data. Suppose we have a panel of data for groups (e.g. people, countries or regions) i =1, 2,..., N over time periods t =1, 2,..., T on a dependent variable y it and a kx1 vector of independent
Lecture 1: Linear Models and Applications
 Lecture 1: Linear Models and Applications Claudia Czado TU München c (Claudia Czado, TU Munich) ZFS/IMS Göttingen 2004 0 Overview Introduction to linear models Exploratory data analysis (EDA) Estimation
Wald s theorem and the Asimov data set
 Wald s theorem and the Asimov data set Eilam Gross & Ofer Vitells ATLAS statistics forum, Dec. 009 1 Outline We have previously guessed that the median significance of many toy MC experiments could be
Experimental Design and Data Analysis for Biologists
 Experimental Design and Data Analysis for Biologists Gerry P. Quinn Monash University Michael J. Keough University of Melbourne CAMBRIDGE UNIVERSITY PRESS Contents Preface page xv I I Introduction 1 1.1
8. Hypothesis Testing
 FE661 - Statistical Methods for Financial Engineering 8. Hypothesis Testing Jitkomut Songsiri introduction Wald test likelihood-based tests significance test for linear regression 8-1 Introduction elements
Introduction and Background to Multilevel Analysis
 Introduction and Background to Multilevel Analysis Dr. J. Kyle Roberts Southern Methodist University Simmons School of Education and Human Development Department of Teaching and Learning Background and
Linear Regression. In this problem sheet, we consider the problem of linear regression with p predictors and one intercept,
 Linear Regression In this problem sheet, we consider the problem of linear regression with p predictors and one intercept, y = Xβ + ɛ, where y t = (y 1,..., y n ) is the column vector of target values,
Spatial Modeling, Regional Science, Arthur Getis Emeritus, San Diego State University March 1, 2016
 Spatial Modeling, Regional Science, and UCSB Arthur Getis Emeritus, San Diego State University March 1, 2016 My Link to UCSB The 1980s at UCSB (summers and sabbatical) Problems within Geography: The Quantitative
Discrete Markov Chain. Theory and use
 Discrete Markov Chain. Theory and use Andres Vallone PhD Student andres.vallone@predoc.uam.es 2016 Contents 1 Introduction 2 Concept and definition Examples Transitions Matrix Chains Classification 3 Empirical
Decomposition of Parsimonious Independence Model Using Pearson, Kendall and Spearman s Correlations for Two-Way Contingency Tables
 International Journal of Statistics and Probability; Vol. 7 No. 3; May 208 ISSN 927-7032 E-ISSN 927-7040 Published by Canadian Center of Science and Education Decomposition of Parsimonious Independence
UNIT 4 RANK CORRELATION (Rho AND KENDALL RANK CORRELATION
 UNIT 4 RANK CORRELATION (Rho AND KENDALL RANK CORRELATION Structure 4.0 Introduction 4.1 Objectives 4. Rank-Order s 4..1 Rank-order data 4.. Assumptions Underlying Pearson s r are Not Satisfied 4.3 Spearman
Granger Causality in Mixed Frequency Vector Autoregressive Models
 .. Granger Causality in Mixed Frequency Vector Autoregressive Models Eric Ghysels, Jonathan B. Hill, & Kaiji Motegi University of North Carolina at Chapel Hill June 4, 23 Ghysels, Hill, & Motegi (UNC)
Introduction to Spatial Statistics and Modeling for Regional Analysis
 Introduction to Spatial Statistics and Modeling for Regional Analysis Dr. Xinyue Ye, Assistant Professor Center for Regional Development (Department of Commerce EDA University Center) & School of Earth,
CHAPTER 1: BINARY LOGIT MODEL
 CHAPTER 1: BINARY LOGIT MODEL Prof. Alan Wan 1 / 44 Table of contents 1. Introduction 1.1 Dichotomous dependent variables 1.2 Problems with OLS 3.3.1 SAS codes and basic outputs 3.3.2 Wald test for individual
Spatial Regression. 9. Specification Tests (1) Luc Anselin. Copyright 2017 by Luc Anselin, All Rights Reserved
 Luc Anselin. Copyright 2017 by Luc Anselin, All Rights Reserved") Spatial Regression 9. Specification Tests (1) Luc Anselin http://spatial.uchicago.edu 1 basic concepts types of tests Moran s I classic ML-based tests LM tests 2 Basic Concepts 3 The Logic of Specification
Spatial Regression 9. Specification Tests (1) Luc Anselin http://spatial.uchicago.edu 1 basic concepts types of tests Moran s I classic ML-based tests LM tests 2 Basic Concepts 3 The Logic of Specification
DATA IN SERIES AND TIME I. Several different techniques depending on data and what one wants to do
 DATA IN SERIES AND TIME I Several different techniques depending on data and what one wants to do Data can be a series of events scaled to time or not scaled to time (scaled to space or just occurrence)
Instrumental Variables, Simultaneous and Systems of Equations
 Chapter 6 Instrumental Variables, Simultaneous and Systems of Equations 61 Instrumental variables In the linear regression model y i = x iβ + ε i (61) we have been assuming that bf x i and ε i are uncorrelated
Confirmatory Factor Analysis: Model comparison, respecification, and more. Psychology 588: Covariance structure and factor models
 Confirmatory Factor Analysis: Model comparison, respecification, and more Psychology 588: Covariance structure and factor models Model comparison 2 Essentially all goodness of fit indices are descriptive,
EC821: Time Series Econometrics, Spring 2003 Notes Section 9 Panel Unit Root Tests Avariety of procedures for the analysis of unit roots in a panel
 EC821: Time Series Econometrics, Spring 2003 Notes Section 9 Panel Unit Root Tests Avariety of procedures for the analysis of unit roots in a panel context have been developed. The emphasis in this development
Ch 3: Multiple Linear Regression
 Ch 3: Multiple Linear Regression 1. Multiple Linear Regression Model Multiple regression model has more than one regressor. For example, we have one response variable and two regressor variables: 1. delivery
Repeated observations on the same cross-section of individual units. Important advantages relative to pure cross-section data
 Panel data Repeated observations on the same cross-section of individual units. Important advantages relative to pure cross-section data - possible to control for some unobserved heterogeneity - possible
Non-Stationary Time Series and Unit Root Testing
 Econometrics II Non-Stationary Time Series and Unit Root Testing Morten Nyboe Tabor Course Outline: Non-Stationary Time Series and Unit Root Testing 1 Stationarity and Deviation from Stationarity Trend-Stationarity
DESIGN AND ANALYSIS OF EXPERIMENTS Third Edition
 DESIGN AND ANALYSIS OF EXPERIMENTS Third Edition Douglas C. Montgomery ARIZONA STATE UNIVERSITY JOHN WILEY & SONS New York Chichester Brisbane Toronto Singapore Contents Chapter 1. Introduction 1-1 What
Maximum Likelihood (ML) Estimation
 Estimation") Econometrics 2 Fall 2004 Maximum Likelihood (ML) Estimation Heino Bohn Nielsen 1of32 Outline of the Lecture (1) Introduction. (2) ML estimation defined. (3) ExampleI:Binomialtrials. (4) Example II: Linear
Econometrics 2 Fall 2004 Maximum Likelihood (ML) Estimation Heino Bohn Nielsen 1of32 Outline of the Lecture (1) Introduction. (2) ML estimation defined. (3) ExampleI:Binomialtrials. (4) Example II: Linear
Hypothesis Testing for Var-Cov Components
 Hypothesis Testing for Var-Cov Components When the specification of coefficients as fixed, random or non-randomly varying is considered, a null hypothesis of the form is considered, where Additional output
Multiple Regression Analysis: Inference ECONOMETRICS (ECON 360) BEN VAN KAMMEN, PHD
 BEN VAN KAMMEN, PHD") Multiple Regression Analysis: Inference ECONOMETRICS (ECON 360) BEN VAN KAMMEN, PHD Introduction When you perform statistical inference, you are primarily doing one of two things: Estimating the boundaries
Multiple Regression Analysis: Inference ECONOMETRICS (ECON 360) BEN VAN KAMMEN, PHD Introduction When you perform statistical inference, you are primarily doing one of two things: Estimating the boundaries
Spatial Dependence in the Evolution of Regional Income Distributions 1
 Spatial Dependence in the Evolution of Regional Income Distributions 1 SERGIO J. REY 2 REAL 01-T-03 March, 2001 1 The Regional Economics Applications Laboratory (REAL) is a cooperative venture between
PhD/MA Econometrics Examination. January, 2015 PART A. (Answer any TWO from Part A)
") PhD/MA Econometrics Examination January, 2015 Total Time: 8 hours MA students are required to answer from A and B. PhD students are required to answer from A, B, and C. PART A (Answer any TWO from Part
PhD/MA Econometrics Examination January, 2015 Total Time: 8 hours MA students are required to answer from A and B. PhD students are required to answer from A, B, and C. PART A (Answer any TWO from Part
G. S. Maddala Kajal Lahiri. WILEY A John Wiley and Sons, Ltd., Publication
 G. S. Maddala Kajal Lahiri WILEY A John Wiley and Sons, Ltd., Publication TEMT Foreword Preface to the Fourth Edition xvii xix Part I Introduction and the Linear Regression Model 1 CHAPTER 1 What is Econometrics?
M A N O V A. Multivariate ANOVA. Data
 M A N O V A Multivariate ANOVA V. Čekanavičius, G. Murauskas 1 Data k groups; Each respondent has m measurements; Observations are from the multivariate normal distribution. No outliers. Covariance matrices
Summary of Chapters 7-9
 Summary of Chapters 7-9 Chapter 7. Interval Estimation 7.2. Confidence Intervals for Difference of Two Means Let X 1,, X n and Y 1, Y 2,, Y m be two independent random samples of sizes n and m from two
Non-Stationary Time Series and Unit Root Testing
 Econometrics II Non-Stationary Time Series and Unit Root Testing Morten Nyboe Tabor Course Outline: Non-Stationary Time Series and Unit Root Testing 1 Stationarity and Deviation from Stationarity Trend-Stationarity
WORKING PAPER SERIES
 ISSN 1503-299X WORKING PAPER SERIES No. 2/2011 MIGRATION AND DYNAMIC AGGLOMERATION ECONOMIES: REGIONAL INCOME GROWTH IN NORWAY Jørn Rattsø and Hildegunn E. Stokke Department of Economics N-7491 Trondheim,
Economic Growth in European City Regions A New Turn for Peripheral Regions in CEE Member States After the EU Enlargements of 2004/2007?
 Economic Growth in European City Regions A New Turn for Peripheral Regions in CEE Member States After the EU Enlargements of /2007? SCORUS Conference A new urban agenda? Uwe Neumann, Rüdiger Budde, Christoph
Parametric Modelling of Over-dispersed Count Data. Part III / MMath (Applied Statistics) 1
 1") Parametric Modelling of Over-dispersed Count Data Part III / MMath (Applied Statistics) 1 Introduction Poisson regression is the de facto approach for handling count data What happens then when Poisson
Parametric Modelling of Over-dispersed Count Data Part III / MMath (Applied Statistics) 1 Introduction Poisson regression is the de facto approach for handling count data What happens then when Poisson
Correlation: Relationships between Variables
 Correlation Correlation: Relationships between Variables So far, nearly all of our discussion of inferential statistics has focused on testing for differences between group means However, researchers are
Economics 308: Econometrics Professor Moody
 Economics 308: Econometrics Professor Moody References on reserve: Text Moody, Basic Econometrics with Stata (BES) Pindyck and Rubinfeld, Econometric Models and Economic Forecasts (PR) Wooldridge, Jeffrey
Measuring relationships among multiple responses
 Measuring relationships among multiple responses Linear association (correlation, relatedness, shared information) between pair-wise responses is an important property used in almost all multivariate analyses.
9.1 Orthogonal factor model.
 36 Chapter 9 Factor Analysis Factor analysis may be viewed as a refinement of the principal component analysis The objective is, like the PC analysis, to describe the relevant variables in study in terms
Areal data models. Spatial smoothers. Brook s Lemma and Gibbs distribution. CAR models Gaussian case Non-Gaussian case
 Areal data models Spatial smoothers Brook s Lemma and Gibbs distribution CAR models Gaussian case Non-Gaussian case SAR models Gaussian case Non-Gaussian case CAR vs. SAR STAR models Inference for areal
Exploratory Spatial Data Analysis (ESDA)
") Exploratory Spatial Data Analysis (ESDA) VANGHR s method of ESDA follows a typical geospatial framework of selecting variables, exploring spatial patterns, and regression analysis. The primary software
Exploratory Spatial Data Analysis (ESDA) VANGHR s method of ESDA follows a typical geospatial framework of selecting variables, exploring spatial patterns, and regression analysis. The primary software
DETAILED CONTENTS PART I INTRODUCTION AND DESCRIPTIVE STATISTICS. 1. Introduction to Statistics
 DETAILED CONTENTS About the Author Preface to the Instructor To the Student How to Use SPSS With This Book PART I INTRODUCTION AND DESCRIPTIVE STATISTICS 1. Introduction to Statistics 1.1 Descriptive and
HUMAN CAPITAL CATEGORY INTERACTION PATTERN TO ECONOMIC GROWTH OF ASEAN MEMBER COUNTRIES IN 2015 BY USING GEODA GEO-INFORMATION TECHNOLOGY DATA
 International Journal of Civil Engineering and Technology (IJCIET) Volume 8, Issue 11, November 2017, pp. 889 900, Article ID: IJCIET_08_11_089 Available online at http://http://www.iaeme.com/ijciet/issues.asp?jtype=ijciet&vtype=8&itype=11
Question 1 carries a weight of 25%; question 2 carries 25%; question 3 carries 20%; and question 4 carries 30%.
 UNIVERSITY OF EAST ANGLIA School of Economics Main Series PGT Examination 2017-18 FINANCIAL ECONOMETRIC THEORY ECO-7024A Time allowed: 2 HOURS Answer ALL FOUR questions. Question 1 carries a weight of
UNIVERSITY OF TORONTO Faculty of Arts and Science
 UNIVERSITY OF TORONTO Faculty of Arts and Science December 2013 Final Examination STA442H1F/2101HF Methods of Applied Statistics Jerry Brunner Duration - 3 hours Aids: Calculator Model(s): Any calculator
Non-Stationary Time Series and Unit Root Testing
 Econometrics II Non-Stationary Time Series and Unit Root Testing Morten Nyboe Tabor Course Outline: Non-Stationary Time Series and Unit Root Testing 1 Stationarity and Deviation from Stationarity Trend-Stationarity
Structural Vector Autoregressions with Markov Switching. Markku Lanne University of Helsinki. Helmut Lütkepohl European University Institute, Florence
 Structural Vector Autoregressions with Markov Switching Markku Lanne University of Helsinki Helmut Lütkepohl European University Institute, Florence Katarzyna Maciejowska European University Institute,
Lecture 9: Structural Breaks and Threshold Model
 Lecture 9: Structural Breaks and Threshold Model 1 Structural Breaks Consider the modified AR(1) model b 0 + b 1 y t 1 + e t, (t = 1, 2,..., T b ) y t = a 0 + a 1 y t 1 + e t, (t = T b + 1, T b + 2,...,
Stat/F&W Ecol/Hort 572 Review Points Ané, Spring 2010
 1 Linear models Y = Xβ + ɛ with ɛ N (0, σ 2 e) or Y N (Xβ, σ 2 e) where the model matrix X contains the information on predictors and β includes all coefficients (intercept, slope(s) etc.). 1. Number of
Generalized Linear Model under the Extended Negative Multinomial Model and Cancer Incidence
 Generalized Linear Model under the Extended Negative Multinomial Model and Cancer Incidence Sunil Kumar Dhar Center for Applied Mathematics and Statistics, Department of Mathematical Sciences, New Jersey
Gravitation and dispersion - a disaggregate view on urban agglomeration and sprawl in
 Gravitation and dispersion - a disaggregate view on urban agglomeration and sprawl in Germany SCORUS 2016 Rüdiger Budde and Uwe Neumann Lisbon, 30 June 2016 Contents 1. Issues/Literature Review 2. Data/Analysis
Poisson Regression. The Training Data
 The Training Data Poisson Regression Office workers at a large insurance company are randomly assigned to one of 3 computer use training programmes, and their number of calls to IT support during the following
Maximum Likelihood Tests and Quasi-Maximum-Likelihood
 Maximum Likelihood Tests and Quasi-Maximum-Likelihood Wendelin Schnedler Department of Economics University of Heidelberg 10. Dezember 2007 Wendelin Schnedler (AWI) Maximum Likelihood Tests and Quasi-Maximum-Likelihood10.
Heteroskedasticity. We now consider the implications of relaxing the assumption that the conditional
 Heteroskedasticity We now consider the implications of relaxing the assumption that the conditional variance V (u i x i ) = σ 2 is common to all observations i = 1,..., In many applications, we may suspect
ECON 5350 Class Notes Functional Form and Structural Change
 ECON 5350 Class Notes Functional Form and Structural Change 1 Introduction Although OLS is considered a linear estimator, it does not mean that the relationship between Y and X needs to be linear. In this
Problem Selected Scores
 Statistics Ph.D. Qualifying Exam: Part II November 20, 2010 Student Name: 1. Answer 8 out of 12 problems. Mark the problems you selected in the following table. Problem 1 2 3 4 5 6 7 8 9 10 11 12 Selected
ECON 4551 Econometrics II Memorial University of Newfoundland. Panel Data Models. Adapted from Vera Tabakova s notes
 ECON 4551 Econometrics II Memorial University of Newfoundland Panel Data Models Adapted from Vera Tabakova s notes 15.1 Grunfeld s Investment Data 15.2 Sets of Regression Equations 15.3 Seemingly Unrelated
Least Absolute Value vs. Least Squares Estimation and Inference Procedures in Regression Models with Asymmetric Error Distributions
 Journal of Modern Applied Statistical Methods Volume 8 Issue 1 Article 13 5-1-2009 Least Absolute Value vs. Least Squares Estimation and Inference Procedures in Regression Models with Asymmetric Error
Income Distribution Dynamics in The European Union: Exploring (In)Stability Measures within Geographical Clusters
Stability Measures within Geographical Clusters") Income Distribution Dynamics in The European Union: Exploring (In)Stability Measures within Geographical Clusters António Manuel Rodrigues 1 Introduction The study of regional inequalities between and
Income Distribution Dynamics in The European Union: Exploring (In)Stability Measures within Geographical Clusters António Manuel Rodrigues 1 Introduction The study of regional inequalities between and
Spatial Regression. 14. Spatial Panels (2) Luc Anselin. Copyright 2017 by Luc Anselin, All Rights Reserved
 Luc Anselin. Copyright 2017 by Luc Anselin, All Rights Reserved") Spatial Regression 14. Spatial Panels (2) Luc Anselin http://spatial.uchicago.edu 1 fixed effects models random effects models ML estimation IV/2SLS estimation GM estimation specification tests 2 Fixed
Spatial Regression 14. Spatial Panels (2) Luc Anselin http://spatial.uchicago.edu 1 fixed effects models random effects models ML estimation IV/2SLS estimation GM estimation specification tests 2 Fixed
News Shocks: Different Effects in Boom and Recession?
 News Shocks: Different Effects in Boom and Recession? Maria Bolboaca, Sarah Fischer University of Bern Study Center Gerzensee June 7, 5 / Introduction News are defined in the literature as exogenous changes
Define characteristic function. State its properties. State and prove inversion theorem.
 ASSIGNMENT - 1, MAY 013. Paper I PROBABILITY AND DISTRIBUTION THEORY (DMSTT 01) 1. (a) Give the Kolmogorov definition of probability. State and prove Borel cantelli lemma. Define : (i) distribution function
Count data page 1. Count data. 1. Estimating, testing proportions
 Count data page 1 Count data 1. Estimating, testing proportions 100 seeds, 45 germinate. We estimate probability p that a plant will germinate to be 0.45 for this population. Is a 50% germination rate
LECTURE ON HAC COVARIANCE MATRIX ESTIMATION AND THE KVB APPROACH
 LECURE ON HAC COVARIANCE MARIX ESIMAION AND HE KVB APPROACH CHUNG-MING KUAN Institute of Economics Academia Sinica October 20, 2006 ckuan@econ.sinica.edu.tw www.sinica.edu.tw/ ckuan Outline C.-M. Kuan,
Spatial Dimensions of Growth and Urbanization: Facts, Theories and Polices for Development
 Spatial Dimensions of Growth and Urbanization: Facts, Theories and Polices for Development Sukkoo Kim Washington University in St. Louis and NBER March 2007 Growth and Spatial Inequality Does growth cause
SPATIAL ECONOMETRICS: METHODS AND MODELS
 SPATIAL ECONOMETRICS: METHODS AND MODELS STUDIES IN OPERATIONAL REGIONAL SCIENCE Folmer, H., Regional Economic Policy. 1986. ISBN 90-247-3308-1. Brouwer, F., Integrated Environmental Modelling: Design
Geography Department. Summer transition work
 Geography Department Summer transition work An essential part of studying Geography post-16 is becoming familiar with statistical testing for fieldwork. Please complete the following activities over summer
Growth in a Cross-Section of Cities: Location, Increasing Returns or Random Growth?
 Growth in a Cross-Section of Cities: Location, Increasing Returns or Random Growth? Rafael González-Val a Jose Olmo b a Universidad de Zaragoza & Institut d'economia de Barcelona (IEB) b University of
Answers to Problem Set #4
 Answers to Problem Set #4 Problems. Suppose that, from a sample of 63 observations, the least squares estimates and the corresponding estimated variance covariance matrix are given by: bβ bβ 2 bβ 3 = 2
Identifying Megaregions in the US: Implications for Infrastructure Investment
 7. 10. 2 0 08 Identifying Megaregions in the US: Implications for Infrastructure Investment Dr. Myungje Woo Dr. Catherine L. Ross Jason Barringer Harry West Jessica Lynn Harbour Doyle Center for Quality
Introduction Large Sample Testing Composite Hypotheses. Hypothesis Testing. Daniel Schmierer Econ 312. March 30, 2007
 Hypothesis Testing Daniel Schmierer Econ 312 March 30, 2007 Basics Parameter of interest: θ Θ Structure of the test: H 0 : θ Θ 0 H 1 : θ Θ 1 for some sets Θ 0, Θ 1 Θ where Θ 0 Θ 1 = (often Θ 1 = Θ Θ 0
Statistics: A review. Why statistics?
 Statistics: A review Why statistics? What statistical concepts should we know? Why statistics? To summarize, to explore, to look for relations, to predict What kinds of data exist? Nominal, Ordinal, Interval
Spatial Effects in Convergence of Portuguese Product
 Spatial Effects in Convergence of Portuguese Product Vitor João Pereira Domingues Martinho Unidade de I&D do Instituto Politécnico de Viseu Av. Cor. José Maria Vale de Andrade Campus Politécnico 354-51
Textbook Examples of. SPSS Procedure
 Textbook s of IBM SPSS Procedures Each SPSS procedure listed below has its own section in the textbook. These sections include a purpose statement that describes the statistical test, identification of
Econometric Analysis of Panel Data Assignment 4 Parameter Heterogeneity in Linear Models: RPM and HLM
 Department of Economics Econometric Analysis of Panel Data Assignment 4 Parameter Heterogeneity in Linear Models: RPM and HLM The estimation parts of this assignment will be based on the Baltagi and Griffin
Introduction to Econometrics
 Introduction to Econometrics T H I R D E D I T I O N Global Edition James H. Stock Harvard University Mark W. Watson Princeton University Boston Columbus Indianapolis New York San Francisco Upper Saddle
Final Exam. Question 1 (20 points) 2 (25 points) 3 (30 points) 4 (25 points) 5 (10 points) 6 (40 points) Total (150 points) Bonus question (10)
 2 (25 points) 3 (30 points) 4 (25 points) 5 (10 points) 6 (40 points) Total (150 points) Bonus question (10)") Name Economics 170 Spring 2004 Honor pledge: I have neither given nor received aid on this exam including the preparation of my one page formula list and the preparation of the Stata assignment for the
Name Economics 170 Spring 2004 Honor pledge: I have neither given nor received aid on this exam including the preparation of my one page formula list and the preparation of the Stata assignment for the