Tests about a population mean
|
|
|
- Ralph Strickland
- 5 years ago
- Views:
Transcription
1 October 2 nd, 2017
2 Overview Week 1 Week 2 Week 4 Week 7 Week 10 Week 12 Chapter 1: Descriptive statistics Chapter 6: Statistics and Sampling Distributions Chapter 7: Point Estimation Chapter 8: Confidence Intervals Chapter 9: Tests of Hypotheses Two-sample inference, ANOVA, regression
3 Overview 9.1 Hypotheses and test procedures test procedures errors in hypothesis testing significance level 9.2 normal population with known σ large-sample tests a normal population with unknown σ 9.4 P-values 9.3 Tests concerning a population proportion 9.5 Selecting a test procedure
4 Hypothesis testing
5 Hypothesis testing In any hypothesis-testing problem, there are two contradictory hypotheses under consideration The null hypothesis, denoted by H 0, is the claim that is initially assumed to be true The alternative hypothesis, denoted by H a, is the assertion that is contradictory to H 0.
6 Implicit rules (of this chapter) H 0 will always be stated as an equality claim. If θ denotes the parameter of interest, the null hypothesis will have the form H 0 : θ = θ 0 θ 0 is a specified number called the null value The alternative hypothesis will be either: H a : θ > θ 0 H a : θ < θ 0 H a : θ θ 0
7 Test procedures A test procedure is specified by the following: A test statistic T : a function of the sample data on which the decision (reject H 0 or do not reject H 0 ) is to be based A rejection region R: the set of all test statistic values for which H 0 will be rejected The null hypothesis will then be rejected if and only if the observed or computed test statistic value falls in the rejection region, i.e., T R
8 Example Test of hypotheses: H 0 : µ = 75 H a : µ < 75 Test procedure: Compute X If X 72, reject H 0.
9 Type I and Type II errors A type I error consists of rejecting the null hypothesis H 0 when it is true A type II error involves not rejecting H 0 when H 0 is false.
10 Type I error Test of hypotheses: H 0 : µ = 75 H a : µ < 75 n = 25, σ = 9. Rule: If x 72, reject H 0. Question: What is the probability of type I error? α = P[Type I error] = P[H 0 is rejected while it is true] = P[ X 72 while µ = 75] = P[ X 72 while X N (75, )] =
11 Type II error Test of hypotheses: H 0 : µ = 75 H a : µ < 75 n = 25. New rule: If x 72, reject H 0. β(70) = P[Type II error when µ = 70] = P[H 0 is not rejected while it is false because µ = 70] = P[ X > 72 while µ = 70] = P[ X > 72 while X N (70, )] =
12 α β compromise Proposition Suppose an experiment and a sample size are fixed and a test statistic is chosen. Then decreasing the size of the rejection region to obtain a smaller value of α results in a larger value of β for any particular parameter value consistent with H a.
13 Significance level The approach adhered to by most statistical practitioners is specify the largest value of α that can be tolerated find a rejection region having that value of α rather than anything smaller α: the significance level of the test the corresponding test procedure is called a level α test
14 Significance level: example Test of hypotheses: H 0 : µ = 75 H a : µ < 75 n = 25, σ = 9. Rule: If x c, reject H 0. Find the value of c to make this a level α test α = P[Type I error] = P[H 0 is rejected while it is true] = P[ X c while X N (75, )] [ X 75 = P c 75 ]
15 Hypothesis testing for one parameter 1 Identify the parameter of interest 2 Determine the null value and state the null hypothesis 3 State the appropriate alternative hypothesis 4 Give the formula for the test statistic 5 State the rejection region for the selected significance level α 6 Compute statistic value from data 7 Decide whether H 0 should be rejected and state this conclusion in the problem context
16 Normal population with known σ
17 Test about a population mean Null hypothesis H 0 : µ = µ 0 The alternative hypothesis will be either: H a : µ > µ 0 H a : µ < µ 0 H a : µ µ 0
18 Rejection region α = P[Type I error] = P[H 0 is rejected while it is true] = P[ X c while X N (75, )] [ X 75 = P c 75 ] Rejection rule: x z α To make it simpler, define z = ( x 75)/(1.8), then the rule is z z α
19 Normal population with known σ Null hypothesis: µ = µ 0 Test statistic: Z = X µ 0 σ/ n
20 General rule
21 Example Problem A manufacturer of sprinkler systems used for fire protection in office buildings claims that the true average system-activation temperature is 130 F. A sample of n = 9 systems, when tested, yields a sample average activation temperature of F. If the distribution of activation times is normal with standard deviation 1.5 F, does the data contradict the manufacturers claim at significance level α = 0.01?
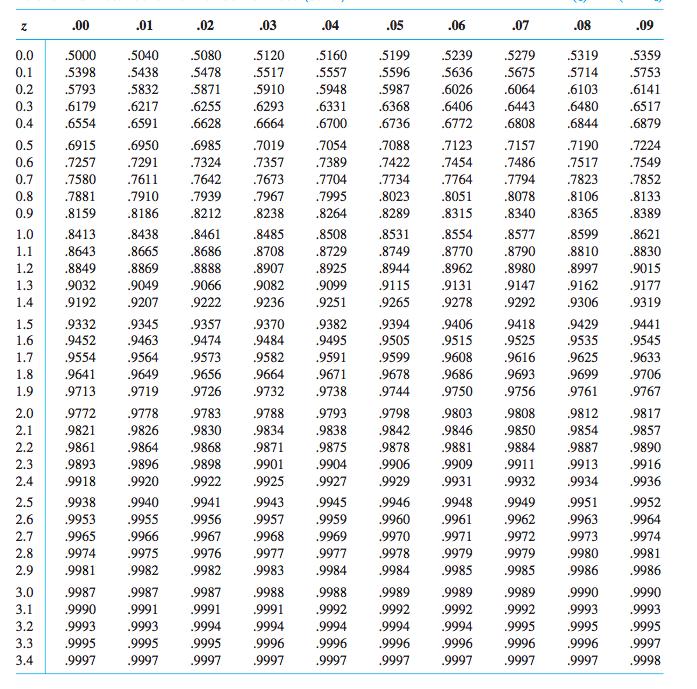
22 Φ(z)
23 Solution Parameter of interest: µ = true average activation temperature Hypotheses Test statistic: H 0 : µ = 130 H a : µ 130 z = x / n Rejection region: either z z or z z = 2.58 Substituting x = , n = 25 z = Note that 2.58 < 2.16 < We fail to reject H 0 at significance level The data does not give strong support to the claim that the true average differs from the design value.
24 Large-sample tests
25 Large-sample tests Null hypothesis: µ = µ 0 Test statistic: Z = X µ 0 S/ n [Does not need the normal assumption]
26 Test about a normal population with unknown σ
27 t-test [Require normal assumption]
28 Example Problem The amount of shaft wear (.0001 in.) after a fixed mileage was determined for each of n = 8 internal combustion engines having copper lead as a bearing material, resulting in x = 3.72 and s = Assuming that the distribution of shaft wear is normal with mean µ, use the t-test at level 0.05 to test H 0 : µ = 3.5 versus H a : µ > 3.5.
29 t-table
Mathematical statistics
 November 1 st, 2018 Lecture 18: Tests about a population mean Overview 9.1 Hypotheses and test procedures test procedures errors in hypothesis testing significance level 9.2 Tests about a population mean
Mathematical statistics
 October 20 th, 2018 Lecture 17: Tests of Hypotheses Overview Week 1 Week 2 Week 4 Week 7 Week 10 Week 14 Probability reviews Chapter 6: Statistics and Sampling Distributions Chapter 7: Point Estimation
CHAPTER 8. Test Procedures is a rule, based on sample data, for deciding whether to reject H 0 and contains:
 CHAPTER 8 Test of Hypotheses Based on a Single Sample Hypothesis testing is the method that decide which of two contradictory claims about the parameter is correct. Here the parameters of interest are
Review. December 4 th, Review
 December 4 th, 2017 Att. Final exam: Course evaluation Friday, 12/14/2018, 10:30am 12:30pm Gore Hall 115 Overview Week 2 Week 4 Week 7 Week 10 Week 12 Chapter 6: Statistics and Sampling Distributions Chapter
8.1-4 Test of Hypotheses Based on a Single Sample
 8.1-4 Test of Hypotheses Based on a Single Sample Example 1 (Example 8.6, p. 312) A manufacturer of sprinkler systems used for fire protection in office buildings claims that the true average system-activation
Statistics 251: Statistical Methods
 Statistics 251: Statistical Methods 1-sample Hypothesis Tests Module 9 2018 Introduction We have learned about estimating parameters by point estimation and interval estimation (specifically confidence
Hypotheses Test Procedures. Is the claim wrong?
 Hypotheses Test Procedures MATH 2300 Sections 9.1 and 9.2 Is the claim wrong? An oil company representative claims that the average price for gasoline in Lubbock is $2.30 per gallon. You think the average
Introductory Econometrics. Review of statistics (Part II: Inference)
") Introductory Econometrics Review of statistics (Part II: Inference) Jun Ma School of Economics Renmin University of China October 1, 2018 1/16 Null and alternative hypotheses Usually, we have two competing
Introductory Econometrics Review of statistics (Part II: Inference) Jun Ma School of Economics Renmin University of China October 1, 2018 1/16 Null and alternative hypotheses Usually, we have two competing
Business Statistics: Lecture 8: Introduction to Estimation & Hypothesis Testing
 Business Statistics: Lecture 8: Introduction to Estimation & Hypothesis Testing Agenda Introduction to Estimation Point estimation Interval estimation Introduction to Hypothesis Testing Concepts en terminology
example: An observation X comes from a normal distribution with
 Hypothesis test A statistical hypothesis is a statement about the population parameter(s) or distribution. null hypothesis H 0 : prior belief statement. alternative hypothesis H a : a statement that contradicts
Statistics 301: Probability and Statistics 1-sample Hypothesis Tests Module
 Statistics 301: Probability and Statistics 1-sample Hypothesis Tests Module 9 2018 Student s t graphs For the heck of it: x
Section 5.4: Hypothesis testing for μ
 Section 5.4: Hypothesis testing for μ Possible claims or hypotheses: Ball bearings have μ = 1 cm Medicine decreases blood pressure For testing hypotheses, we set up a null (H 0 ) and alternative (H a )
STAT 515 fa 2016 Lec Statistical inference - hypothesis testing
 STAT 515 fa 2016 Lec 20-21 Statistical inference - hypothesis testing Karl B. Gregory Wednesday, Oct 12th Contents 1 Statistical inference 1 1.1 Forms of the null and alternate hypothesis for µ and p....................
Chapter 7: Hypothesis Testing - Solutions
 Chapter 7: Hypothesis Testing - Solutions 7.1 Introduction to Hypothesis Testing The problem with applying the techniques learned in Chapter 5 is that typically, the population mean (µ) and standard deviation
Statistical Inference. Hypothesis Testing
 Statistical Inference Hypothesis Testing Previously, we introduced the point and interval estimation of an unknown parameter(s), say µ and σ 2. However, in practice, the problem confronting the scientist
Section 10.1 (Part 2 of 2) Significance Tests: Power of a Test
 Significance Tests: Power of a Test") 1 Section 10.1 (Part 2 of 2) Significance Tests: Power of a Test Learning Objectives After this section, you should be able to DESCRIBE the relationship between the significance level of a test, P(Type
1 Section 10.1 (Part 2 of 2) Significance Tests: Power of a Test Learning Objectives After this section, you should be able to DESCRIBE the relationship between the significance level of a test, P(Type
Hypothesis Testing and Confidence Intervals (Part 2): Cohen s d, Logic of Testing, and Confidence Intervals
: Cohen s d, Logic of Testing, and Confidence Intervals") Hypothesis Testing and Confidence Intervals (Part 2): Cohen s d, Logic of Testing, and Confidence Intervals Lecture 9 Justin Kern April 9, 2018 Measuring Effect Size: Cohen s d Simply finding whether a
Hypothesis Testing and Confidence Intervals (Part 2): Cohen s d, Logic of Testing, and Confidence Intervals Lecture 9 Justin Kern April 9, 2018 Measuring Effect Size: Cohen s d Simply finding whether a
INTERVAL ESTIMATION AND HYPOTHESES TESTING
 INTERVAL ESTIMATION AND HYPOTHESES TESTING 1. IDEA An interval rather than a point estimate is often of interest. Confidence intervals are thus important in empirical work. To construct interval estimates,
CH.9 Tests of Hypotheses for a Single Sample
 CH.9 Tests of Hypotheses for a Single Sample Hypotheses testing Tests on the mean of a normal distributionvariance known Tests on the mean of a normal distributionvariance unknown Tests on the variance
Statistical Process Control (contd... )
") Statistical Process Control (contd... ) ME522: Quality Engineering Vivek Kumar Mehta November 11, 2016 Note: This lecture is prepared with the help of material available online at https://onlinecourses.science.psu.edu/
Statistical Process Control (contd... ) ME522: Quality Engineering Vivek Kumar Mehta November 11, 2016 Note: This lecture is prepared with the help of material available online at https://onlinecourses.science.psu.edu/
Visual interpretation with normal approximation
 Visual interpretation with normal approximation H 0 is true: H 1 is true: p =0.06 25 33 Reject H 0 α =0.05 (Type I error rate) Fail to reject H 0 β =0.6468 (Type II error rate) 30 Accept H 1 Visual interpretation
STAT Chapter 8: Hypothesis Tests
 STAT 515 -- Chapter 8: Hypothesis Tests CIs are possibly the most useful forms of inference because they give a range of reasonable values for a parameter. But sometimes we want to know whether one particular
Partitioning the Parameter Space. Topic 18 Composite Hypotheses
 Topic 18 Composite Hypotheses Partitioning the Parameter Space 1 / 10 Outline Partitioning the Parameter Space 2 / 10 Partitioning the Parameter Space Simple hypotheses limit us to a decision between one
MTMS Mathematical Statistics
 MTMS.01.099 Mathematical Statistics Lecture 12. Hypothesis testing. Power function. Approximation of Normal distribution and application to Binomial distribution Tõnu Kollo Fall 2016 Hypothesis Testing
SMAM 314 Exam 3 Name. F A. A null hypothesis that is rejected at α =.05 will always be rejected at α =.01.
 SMAM 314 Exam 3 Name 1. Indicate whether the following statements are true (T) or false (F) (6 points) F A. A null hypothesis that is rejected at α =.05 will always be rejected at α =.01. T B. A course
Statistical Inference
 Statistical Inference Classical and Bayesian Methods Class 6 AMS-UCSC Thu 26, 2012 Winter 2012. Session 1 (Class 6) AMS-132/206 Thu 26, 2012 1 / 15 Topics Topics We will talk about... 1 Hypothesis testing
In any hypothesis testing problem, there are two contradictory hypotheses under consideration.
 8.1 Hypotheses and Test Procedures: A hypothesis One example of a hypothesis is p =.5, if we are testing if a new formula for a soda is preferred to the old formula (p=.5 assumes that they are preferred
Introduction to Statistical Data Analysis III
 Introduction to Statistical Data Analysis III JULY 2011 Afsaneh Yazdani Preface Major branches of Statistics: - Descriptive Statistics - Inferential Statistics Preface What is Inferential Statistics? The
Design of Engineering Experiments Part 2 Basic Statistical Concepts Simple comparative experiments
 Design of Engineering Experiments Part 2 Basic Statistical Concepts Simple comparative experiments The hypothesis testing framework The two-sample t-test Checking assumptions, validity Comparing more that
Hypothesis for Means and Proportions
 November 14, 2012 Hypothesis Tests - Basic Ideas Often we are interested not in estimating an unknown parameter but in testing some claim or hypothesis concerning a population. For example we may wish
AMS7: WEEK 7. CLASS 1. More on Hypothesis Testing Monday May 11th, 2015
 AMS7: WEEK 7. CLASS 1 More on Hypothesis Testing Monday May 11th, 2015 Testing a Claim about a Standard Deviation or a Variance We want to test claims about or 2 Example: Newborn babies from mothers taking
Lecture Testing Hypotheses: The Neyman-Pearson Paradigm
 Math 408 - Mathematical Statistics Lecture 29-30. Testing Hypotheses: The Neyman-Pearson Paradigm April 12-15, 2013 Konstantin Zuev (USC) Math 408, Lecture 29-30 April 12-15, 2013 1 / 12 Agenda Example:
Design of Engineering Experiments
 Design of Engineering Experiments Hussam Alshraideh Chapter 2: Some Basic Statistical Concepts October 4, 2015 Hussam Alshraideh (JUST) Basic Stats October 4, 2015 1 / 29 Overview 1 Introduction Basic
Econometrics. 4) Statistical inference
 Statistical inference") 30C00200 Econometrics 4) Statistical inference Timo Kuosmanen Professor, Ph.D. http://nomepre.net/index.php/timokuosmanen Today s topics Confidence intervals of parameter estimates Student s t-distribution
30C00200 Econometrics 4) Statistical inference Timo Kuosmanen Professor, Ph.D. http://nomepre.net/index.php/timokuosmanen Today s topics Confidence intervals of parameter estimates Student s t-distribution
ECO220Y Hypothesis Testing: Type I and Type II Errors and Power Readings: Chapter 12,
 ECO220Y Hypothesis Testing: Type I and Type II Errors and Power Readings: Chapter 12, 12.7-12.9 Winter 2012 Lecture 15 (Winter 2011) Estimation Lecture 15 1 / 25 Linking Two Approaches to Hypothesis Testing
Announcements. Unit 3: Foundations for inference Lecture 3: Decision errors, significance levels, sample size, and power.
 Announcements Announcements Unit 3: Foundations for inference Lecture 3:, significance levels, sample size, and power Statistics 101 Mine Çetinkaya-Rundel October 1, 2013 Project proposal due 5pm on Friday,
LECTURE 5. Introduction to Econometrics. Hypothesis testing
 LECTURE 5 Introduction to Econometrics Hypothesis testing October 18, 2016 1 / 26 ON TODAY S LECTURE We are going to discuss how hypotheses about coefficients can be tested in regression models We will
280 CHAPTER 9 TESTS OF HYPOTHESES FOR A SINGLE SAMPLE Tests of Statistical Hypotheses
 280 CHAPTER 9 TESTS OF HYPOTHESES FOR A SINGLE SAMPLE 9-1.2 Tests of Statistical Hypotheses To illustrate the general concepts, consider the propellant burning rate problem introduced earlier. The null
ME3620. Theory of Engineering Experimentation. Spring Chapter IV. Decision Making for a Single Sample. Chapter IV
 Theory of Engineering Experimentation Chapter IV. Decision Making for a Single Sample Chapter IV 1 4 1 Statistical Inference The field of statistical inference consists of those methods used to make decisions
Analysis of Variance: Part 1
 Analysis of Variance: Part 1 Oneway ANOVA When there are more than two means Each time two means are compared the probability (Type I error) =α. When there are more than two means Each time two means are
T.I.H.E. IT 233 Statistics and Probability: Sem. 1: 2013 ESTIMATION AND HYPOTHESIS TESTING OF TWO POPULATIONS
 ESTIMATION AND HYPOTHESIS TESTING OF TWO POPULATIONS In our work on hypothesis testing, we used the value of a sample statistic to challenge an accepted value of a population parameter. We focused only
Review: General Approach to Hypothesis Testing. 1. Define the research question and formulate the appropriate null and alternative hypotheses.
 1 Review: Let X 1, X,..., X n denote n independent random variables sampled from some distribution might not be normal!) with mean µ) and standard deviation σ). Then X µ σ n In other words, X is approximately
 http://www.math.uah.edu/stat/hypothesis/.xhtml 1 of 5 7/29/2009 3:14 PM Virtual Laboratories > 9. Hy pothesis Testing > 1 2 3 4 5 6 7 1. The Basic Statistical Model As usual, our starting point is a random
LECTURE 5 HYPOTHESIS TESTING
 October 25, 2016 LECTURE 5 HYPOTHESIS TESTING Basic concepts In this lecture we continue to discuss the normal classical linear regression defined by Assumptions A1-A5. Let θ Θ R d be a parameter of interest.
Section 9.1 (Part 2) (pp ) Type I and Type II Errors
 (pp ) Type I and Type II Errors") Section 9.1 (Part 2) (pp. 547-551) Type I and Type II Errors Because we are basing our conclusion in a significance test on sample data, there is always a chance that our conclusions will be in error.
Section 9.1 (Part 2) (pp. 547-551) Type I and Type II Errors Because we are basing our conclusion in a significance test on sample data, there is always a chance that our conclusions will be in error.
Solution: First note that the power function of the test is given as follows,
 Problem 4.5.8: Assume the life of a tire given by X is distributed N(θ, 5000 ) Past experience indicates that θ = 30000. The manufacturere claims the tires made by a new process have mean θ > 30000. Is
Inferences About Two Proportions
 Inferences About Two Proportions Quantitative Methods II Plan for Today Sampling two populations Confidence intervals for differences of two proportions Testing the difference of proportions Examples 1
Chapter 5: HYPOTHESIS TESTING
 MATH411: Applied Statistics Dr. YU, Chi Wai Chapter 5: HYPOTHESIS TESTING 1 WHAT IS HYPOTHESIS TESTING? As its name indicates, it is about a test of hypothesis. To be more precise, we would first translate
MATH 728 Homework 3. Oleksandr Pavlenko
 MATH 78 Homewor 3 Olesandr Pavleno 4.5.8 Let us say the life of a tire in miles, say X, is normally distributed with mean θ and standard deviation 5000. Past experience indicates that θ = 30000. The manufacturer
Introductory Econometrics
 Session 4 - Testing hypotheses Roland Sciences Po July 2011 Motivation After estimation, delivering information involves testing hypotheses Did this drug had any effect on the survival rate? Is this drug
Sampling, Confidence Interval and Hypothesis Testing
 Sampling, Confidence Interval and Hypothesis Testing Christopher Grigoriou Executive MBA HEC Lausanne 2007-2008 1 Sampling : Careful with convenience samples! World War II: A statistical study to decide
Political Science 236 Hypothesis Testing: Review and Bootstrapping
 Political Science 236 Hypothesis Testing: Review and Bootstrapping Rocío Titiunik Fall 2007 1 Hypothesis Testing Definition 1.1 Hypothesis. A hypothesis is a statement about a population parameter The
Study Ch. 9.3, #47 53 (45 51), 55 61, (55 59)
, 55 61, (55 59)") GOALS: 1. Understand that 2 approaches of hypothesis testing exist: classical or critical value, and p value. We will use the p value approach. 2. Understand the critical value for the classical approach
GOALS: 1. Understand that 2 approaches of hypothesis testing exist: classical or critical value, and p value. We will use the p value approach. 2. Understand the critical value for the classical approach
The problem of base rates
 Psychology 205: Research Methods in Psychology William Revelle Department of Psychology Northwestern University Evanston, Illinois USA October, 2015 1 / 14 Outline Inferential statistics 2 / 14 Hypothesis
The Purpose of Hypothesis Testing
 Section 8 1A:! An Introduction to Hypothesis Testing The Purpose of Hypothesis Testing See s Candy states that a box of it s candy weighs 16 oz. They do not mean that every single box weights exactly 16
First we look at some terms to be used in this section.
 8 Hypothesis Testing 8.1 Introduction MATH1015 Biostatistics Week 8 In Chapter 7, we ve studied the estimation of parameters, point or interval estimates. The construction of CI relies on the sampling
SMAM 314 Exam 3d Name
 SMAM 314 Exam 3d Name 1. Mark the following statements True T or False F. (6 points -2 each) T A. A process is out of control if at a particular point in time the reading is more than 3 standard deviations
Week 12 Hypothesis Testing, Part II Comparing Two Populations
 Week 12 Hypothesis Testing, Part II Week 12 Hypothesis Testing, Part II Week 12 Objectives 1 The principle of Analysis of Variance is introduced and used to derive the F-test for testing the model utility
Sociology 6Z03 Review II
 Sociology 6Z03 Review II John Fox McMaster University Fall 2016 John Fox (McMaster University) Sociology 6Z03 Review II Fall 2016 1 / 35 Outline: Review II Probability Part I Sampling Distributions Probability
Introduction to Statistics
 MTH4106 Introduction to Statistics Notes 15 Spring 2013 Testing hypotheses about the mean Earlier, we saw how to test hypotheses about a proportion, using properties of the Binomial distribution It is
Class 19. Daniel B. Rowe, Ph.D. Department of Mathematics, Statistics, and Computer Science. Marquette University MATH 1700
 Class 19 Daniel B. Rowe, Ph.D. Department of Mathematics, Statistics, and Computer Science Copyright 2017 by D.B. Rowe 1 Agenda: Recap Chapter 8.3-8.4 Lecture Chapter 8.5 Go over Exam. Problem Solving
Chapter 9. Hypothesis testing. 9.1 Introduction
 Chapter 9 Hypothesis testing 9.1 Introduction Confidence intervals are one of the two most common types of statistical inference. Use them when our goal is to estimate a population parameter. The second
Inference for Regression Inference about the Regression Model and Using the Regression Line, with Details. Section 10.1, 2, 3
 Inference for Regression Inference about the Regression Model and Using the Regression Line, with Details Section 10.1, 2, 3 Basic components of regression setup Target of inference: linear dependency
Hypothesis Testing. ECE 3530 Spring Antonio Paiva
 Hypothesis Testing ECE 3530 Spring 2010 Antonio Paiva What is hypothesis testing? A statistical hypothesis is an assertion or conjecture concerning one or more populations. To prove that a hypothesis is
Math 494: Mathematical Statistics
 Math 494: Mathematical Statistics Instructor: Jimin Ding jmding@wustl.edu Department of Mathematics Washington University in St. Louis Class materials are available on course website (www.math.wustl.edu/
EXAM 3 Math 1342 Elementary Statistics 6-7
 EXAM 3 Math 1342 Elementary Statistics 6-7 Name Date ********************************************************************************************************************************************** MULTIPLE
Sampling distribution of t. 2. Sampling distribution of t. 3. Example: Gas mileage investigation. II. Inferential Statistics (8) t =
 t =") 2. The distribution of t values that would be obtained if a value of t were calculated for each sample mean for all possible random of a given size from a population _ t ratio: (X - µ hyp ) t s x The result
2. The distribution of t values that would be obtained if a value of t were calculated for each sample mean for all possible random of a given size from a population _ t ratio: (X - µ hyp ) t s x The result
For use only in [the name of your school] 2014 S4 Note. S4 Notes (Edexcel)
![For use only in [the name of your school] 2014 S4 Note. S4 Notes (Edexcel)](/thumbs/74/71394955.jpg "For use only in [the name of your school] 2014 S4 Note. S4 Notes (Edexcel)") s (Edexcel) Copyright www.pgmaths.co.uk - For AS, A2 notes and IGCSE / GCSE worksheets 1 Copyright www.pgmaths.co.uk - For AS, A2 notes and IGCSE / GCSE worksheets 2 Copyright www.pgmaths.co.uk - For AS,
s (Edexcel) Copyright www.pgmaths.co.uk - For AS, A2 notes and IGCSE / GCSE worksheets 1 Copyright www.pgmaths.co.uk - For AS, A2 notes and IGCSE / GCSE worksheets 2 Copyright www.pgmaths.co.uk - For AS,
Hypothesis Testing: One Sample
 Hypothesis Testing: One Sample ELEC 412 PROF. SIRIPONG POTISUK General Procedure Although the exact value of a parameter may be unknown, there is often some idea(s) or hypothesi(e)s about its true value
hypothesis a claim about the value of some parameter (like p)
") Testing hypotheses hypothesis a claim about the value of some parameter (like p) significance test procedure to assess the strength of evidence provided by a sample of data against the claim of a hypothesized
Testing hypotheses hypothesis a claim about the value of some parameter (like p) significance test procedure to assess the strength of evidence provided by a sample of data against the claim of a hypothesized
Basic Statistics. 1. Gross error analyst makes a gross mistake (misread balance or entered wrong value into calculation).
.") Basic Statistics There are three types of error: 1. Gross error analyst makes a gross mistake (misread balance or entered wrong value into calculation). 2. Systematic error - always too high or too low
Basic Statistics There are three types of error: 1. Gross error analyst makes a gross mistake (misread balance or entered wrong value into calculation). 2. Systematic error - always too high or too low
What is a Hypothesis?
 What is a Hypothesis? A hypothesis is a claim (assumption) about a population parameter: population mean Example: The mean monthly cell phone bill in this city is μ = $42 population proportion Example:
Sleep data, two drugs Ch13.xls
 Model Based Statistics in Biology. Part IV. The General Linear Mixed Model.. Chapter 13.3 Fixed*Random Effects (Paired t-test) ReCap. Part I (Chapters 1,2,3,4), Part II (Ch 5, 6, 7) ReCap Part III (Ch
Statistical Inference. Why Use Statistical Inference. Point Estimates. Point Estimates. Greg C Elvers
 Statistical Inference Greg C Elvers 1 Why Use Statistical Inference Whenever we collect data, we want our results to be true for the entire population and not just the sample that we used But our sample
Introduction to Statistics
 MTH4106 Introduction to Statistics Notes 6 Spring 2013 Testing Hypotheses about a Proportion Example Pete s Pizza Palace offers a choice of three toppings. Pete has noticed that rather few customers ask
Hypothesis Testing. Hypothesis: conjecture, proposition or statement based on published literature, data, or a theory that may or may not be true
 Hypothesis esting Hypothesis: conjecture, proposition or statement based on published literature, data, or a theory that may or may not be true Statistical Hypothesis: conjecture about a population parameter
The t-test: A z-score for a sample mean tells us where in the distribution the particular mean lies
 The t-test: So Far: Sampling distribution benefit is that even if the original population is not normal, a sampling distribution based on this population will be normal (for sample size > 30). Benefit
CHAPTER 9: HYPOTHESIS TESTING
 CHAPTER 9: HYPOTHESIS TESTING THE SECOND LAST EXAMPLE CLEARLY ILLUSTRATES THAT THERE IS ONE IMPORTANT ISSUE WE NEED TO EXPLORE: IS THERE (IN OUR TWO SAMPLES) SUFFICIENT STATISTICAL EVIDENCE TO CONCLUDE
Quantitative Methods for Economics, Finance and Management (A86050 F86050)
") Quantitative Methods for Economics, Finance and Management (A86050 F86050) Matteo Manera matteo.manera@unimib.it Marzio Galeotti marzio.galeotti@unimi.it 1 This material is taken and adapted from Guy Judge
Quantitative Methods for Economics, Finance and Management (A86050 F86050) Matteo Manera matteo.manera@unimib.it Marzio Galeotti marzio.galeotti@unimi.it 1 This material is taken and adapted from Guy Judge
9-7: THE POWER OF A TEST
 CD9-1 9-7: THE POWER OF A TEST In the initial discussion of statistical hypothesis testing the two types of risks that are taken when decisions are made about population parameters based only on sample
Chapter 10: Inferences based on two samples
 November 16 th, 2017 Overview Week 1 Week 2 Week 4 Week 7 Week 10 Week 12 Chapter 1: Descriptive statistics Chapter 6: Statistics and Sampling Distributions Chapter 7: Point Estimation Chapter 8: Confidence
Mathematical statistics
 November 15 th, 2018 Lecture 21: The two-sample t-test Overview Week 1 Week 2 Week 4 Week 7 Week 10 Week 14 Probability reviews Chapter 6: Statistics and Sampling Distributions Chapter 7: Point Estimation
Basic Concepts of Inference
 Basic Concepts of Inference Corresponds to Chapter 6 of Tamhane and Dunlop Slides prepared by Elizabeth Newton (MIT) with some slides by Jacqueline Telford (Johns Hopkins University) and Roy Welsch (MIT).
While you wait: Enter the following in your calculator. Find the mean and sample variation of each group. Bluman, Chapter 12 1
 While you wait: Enter the following in your calculator. Find the mean and sample variation of each group. Bluman, Chapter 12 1 Chapter 12 Analysis of Variance McGraw-Hill, Bluman, 7th ed., Chapter 12 2
y ˆ i = ˆ " T u i ( i th fitted value or i th fit)
") 1 2 INFERENCE FOR MULTIPLE LINEAR REGRESSION Recall Terminology: p predictors x 1, x 2,, x p Some might be indicator variables for categorical variables) k-1 non-constant terms u 1, u 2,, u k-1 Each u
1 2 INFERENCE FOR MULTIPLE LINEAR REGRESSION Recall Terminology: p predictors x 1, x 2,, x p Some might be indicator variables for categorical variables) k-1 non-constant terms u 1, u 2,, u k-1 Each u
Chapter 12: Inference about One Population
 Chapter 1: Inference about One Population 1.1 Introduction In this chapter, we presented the statistical inference methods used when the problem objective is to describe a single population. Sections 1.
An Analysis of College Algebra Exam Scores December 14, James D Jones Math Section 01
 An Analysis of College Algebra Exam s December, 000 James D Jones Math - Section 0 An Analysis of College Algebra Exam s Introduction Students often complain about a test being too difficult. Are there
Statistics: CI, Tolerance Intervals, Exceedance, and Hypothesis Testing. Confidence intervals on mean. CL = x ± t * CL1- = exp
 Statistics: CI, Tolerance Intervals, Exceedance, and Hypothesis Lecture Notes 1 Confidence intervals on mean Normal Distribution CL = x ± t * 1-α 1- α,n-1 s n Log-Normal Distribution CL = exp 1-α CL1-
BIO5312 Biostatistics Lecture 6: Statistical hypothesis testings
 BIO5312 Biostatistics Lecture 6: Statistical hypothesis testings Yujin Chung October 4th, 2016 Fall 2016 Yujin Chung Lec6: Statistical hypothesis testings Fall 2016 1/30 Previous Two types of statistical
Definition 3.1 A statistical hypothesis is a statement about the unknown values of the parameters of the population distribution.
 Hypothesis Testing Definition 3.1 A statistical hypothesis is a statement about the unknown values of the parameters of the population distribution. Suppose the family of population distributions is indexed
7.2 One-Sample Correlation ( = a) Introduction. Correlation analysis measures the strength and direction of association between
 Introduction. Correlation analysis measures the strength and direction of association between") 7.2 One-Sample Correlation ( = a) Introduction Correlation analysis measures the strength and direction of association between variables. In this chapter we will test whether the population correlation
7.2 One-Sample Correlation ( = a) Introduction Correlation analysis measures the strength and direction of association between variables. In this chapter we will test whether the population correlation
Finansiell Statistik, GN, 15 hp, VT2008 Lecture 10-11: Statistical Inference: Hypothesis Testing
 Finansiell Statistik, GN, 15 hp, VT008 Lecture 10-11: Statistical Inference: Hypothesis Testing Gebrenegus Ghilagaber, PhD, Associate Professor April 1, 008 1 1 Statistical Inferences: Introduction Recall:
CBA4 is live in practice mode this week exam mode from Saturday!
 Announcements CBA4 is live in practice mode this week exam mode from Saturday! Material covered: Confidence intervals (both cases) 1 sample hypothesis tests (both cases) Hypothesis tests for 2 means as
ECO220Y Review and Introduction to Hypothesis Testing Readings: Chapter 12
 ECO220Y Review and Introduction to Hypothesis Testing Readings: Chapter 12 Winter 2012 Lecture 13 (Winter 2011) Estimation Lecture 13 1 / 33 Review of Main Concepts Sampling Distribution of Sample Mean
Introduction to Probability and Statistics
 Introduction to Probability and Statistics Chater 8 Ammar M. Sarhan, asarhan@mathstat.dal.ca Deartment of Mathematics and Statistics, Dalhousie University Fall Semester 28 Chater 8 Tests of Hyotheses Based
Inferences for Regression
 Inferences for Regression An Example: Body Fat and Waist Size Looking at the relationship between % body fat and waist size (in inches). Here is a scatterplot of our data set: Remembering Regression In
Dover- Sherborn High School Mathematics Curriculum Probability and Statistics
 Mathematics Curriculum A. DESCRIPTION This is a full year courses designed to introduce students to the basic elements of statistics and probability. Emphasis is placed on understanding terminology and
Chapter 7 Comparison of two independent samples
 Chapter 7 Comparison of two independent samples 7.1 Introduction Population 1 µ σ 1 1 N 1 Sample 1 y s 1 1 n 1 Population µ σ N Sample y s n 1, : population means 1, : population standard deviations N
STAT 135 Lab 5 Bootstrapping and Hypothesis Testing
 STAT 135 Lab 5 Bootstrapping and Hypothesis Testing Rebecca Barter March 2, 2015 The Bootstrap Bootstrap Suppose that we are interested in estimating a parameter θ from some population with members x 1,...,
Statistics Boot Camp. Dr. Stephanie Lane Institute for Defense Analyses DATAWorks 2018
 Statistics Boot Camp Dr. Stephanie Lane Institute for Defense Analyses DATAWorks 2018 March 21, 2018 Outline of boot camp Summarizing and simplifying data Point and interval estimation Foundations of statistical