COMPARISONS INVOLVING TWO SAMPLE MEANS. Two-tail tests have these types of hypotheses: H A : 1 2
|
|
|
- Roy Boone
- 5 years ago
- Views:
Transcription
1 Tetig Hypothee COMPARISONS INVOLVING TWO SAMPLE MEANS Two type of hypothee:. H o : Null Hypothei - hypothei of o differece. or 0. H A : Alterate Hypothei hypothei of differece. or 0 Two-tail v. Oe-tail Tet Two-tail tet have thee type of hypothee: H o : H A : Note the preece of the equal ig. If you reject H o :, you do t care which mea i greater. ca be either greater tha or le tha. Oe-tail tet my have oe of the followig type of hypothee: H o : H o : H A : H A : t-ditributio Note the preece of greater tha or le tha ig. If you reject Ho:, you are beig pecific that ca oly be o oe ide of. / / Two-tail tet Oe-tail tet Size of the rejectio regio = / Size of the rejectio regio =
2 Type of Error. Type I Error: To reject the ull hypothei whe it i actually true. The probability of committig a Type I Error i. The probability of committig a Type I Error ca be reduced by the ivetigator chooig a maller. typical ize of are 0.05 ad 0.0. The probability of committig a Type I Error alo ca be expreed a a percetage (i.e. *00 %) If =0.05, The probability of committig a Type I Error i 5%. If =0.05, we are tetig the hypothei at the 95% level of cofidece.. Type II Error: The failure to reject the ull hypothei whe it i fale. The probability of committig a Type II Error i. ca be decreaed by: a. Icreaig (i.e. the umber of obervatio per treatmet). b. Decreaig. Icreae Chooe a more appropriate experimetal deig Improve experimetal techique. Power of the Tet Power of the tet i equal to: -. Defied a the probability of acceptig the alterate hypothei whe it i true. We wat the Power of the Tet to be a large a poible. Summary of Type I ad Type II Error True Situatio Deciio Null hypothei i true Null hypothei if fale Reject the ull hypothei Type I Error No error Fail to reject the ull hypothei No error Type II Error
3 Hypothei Tetig Summary of Tetig a Hypothei.. Formulate a meaigful ull ad alterate hypothei.. Chooe a level of. 3. Compute the value for the tet tatitic (i.e. t-tatitic of F-tatitic). 4. Look up the appropriate table value for the tet tatitic. 5. Formulate cocluio. a. If the tabular tatitic > calculated tatitic, the you fail to reject H o. b. If the tabular tatitic < calculated tatitic, the you reject H o. Compario of Two Sample Mea (t-tet) Suppoe we have two populatio mea of ad we wat to tet the hypothei: H o : H A : Thi ca be doe uig a t-tet where: Y Y t Y Y Where: Y = mea of treatmet Y = mea of treatmet Y Y = tadard deviatio of the differece betwee two mea. Calculatio of Y deped o three thig. Y. Do the populatio have a commo variace (i.e.. Are the two ample of equal ize (i.e. = )? 3. Are the obervatio meaigfully paired? *Compario of Two Sample Mea ( = ) ad Give the followig data: )? Y i Y i Treatmet Treatmet Determie if the treatmet mea are igificatly differet at the 95% level of cofidece. Step. Write the hypothei to be teted:
4 H o : H A : Step. Calculate & Step. Tet to ee if the two variace are homogeeou (i.e. H o : ). The method of calculatig H o :. Y will deped o whether you reject or fail to reject Y If you fail to reject H o :, the formula for Y i: Y Y Y p where: p = the pooled variace ad = the umber of obervatio i a treatmet total. If you reject H o :, the formula for Y i: Y Y Y where: = variace of Treatmet = variace of Treatmet = umber of obervatio for treatmet = umber of obervatio for treatmet
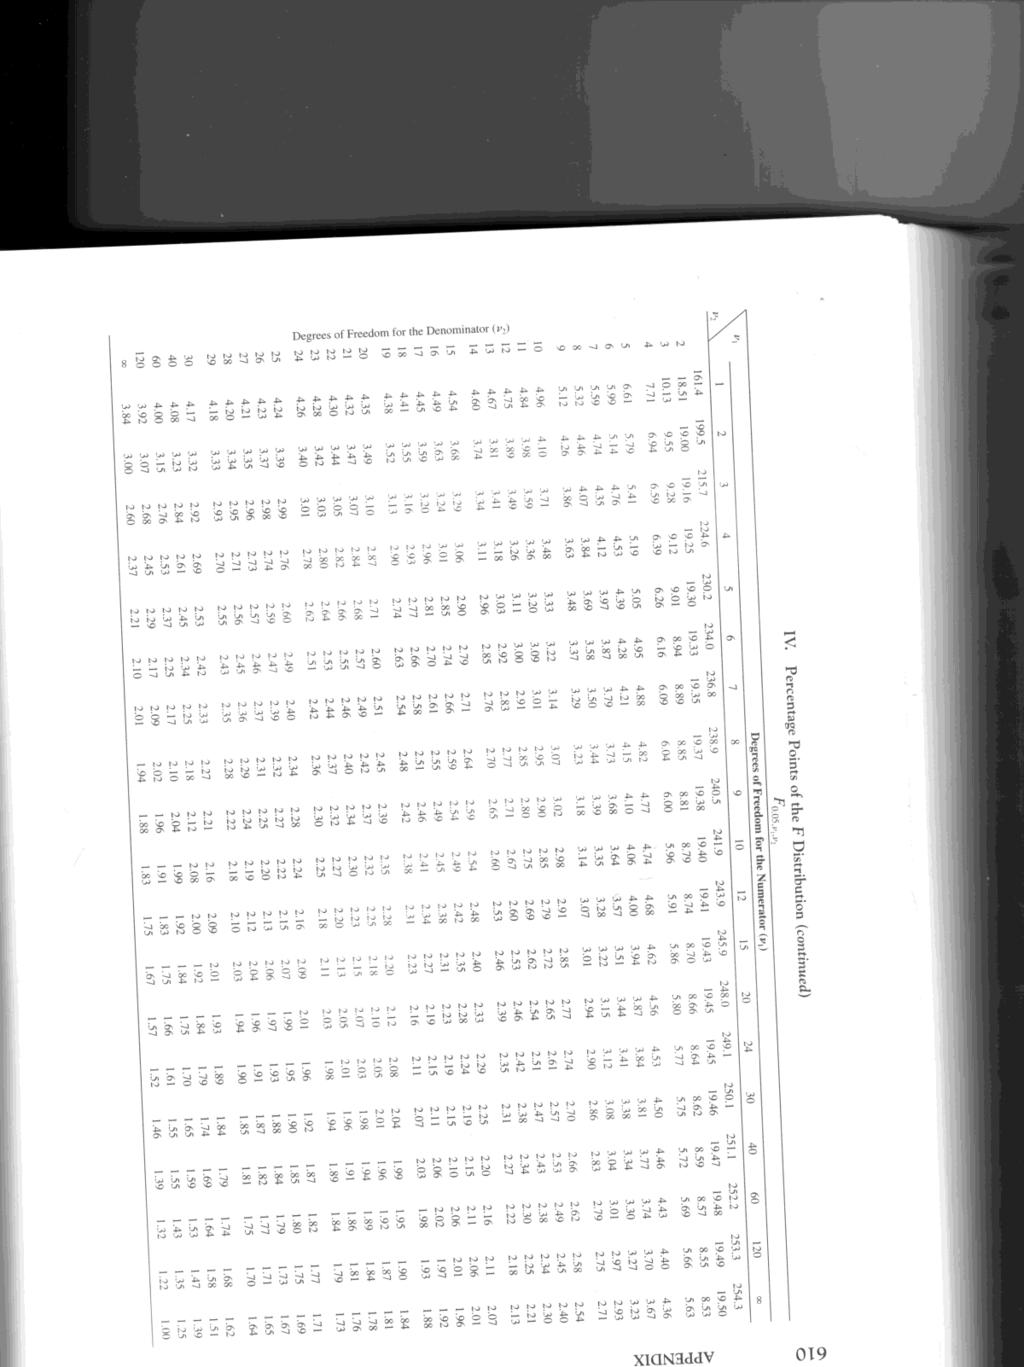
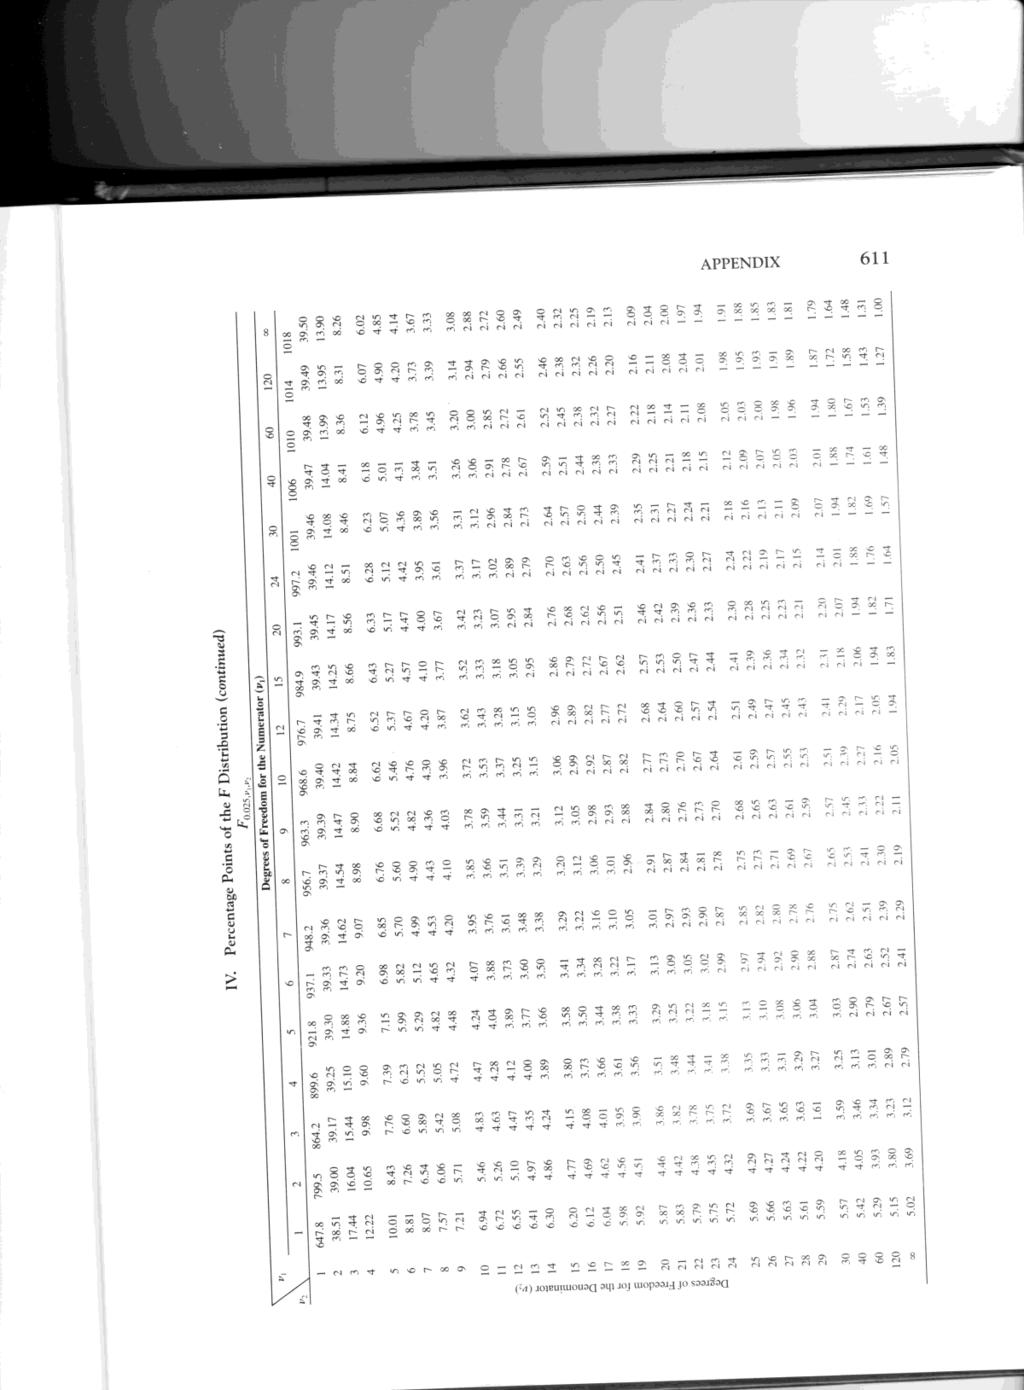
5 Tet H o : uig a F-tet where: Larg er F Smaller If there are large differece betwee &, F will become large ad reult i the rejectio of H o :. We will be tetig the hypothei H o : at the 95% level of cofidece. Thi F-tet i a two-tail tet becaue we are ot pecifyig which variace i expected to be larger. Thu, if you are tetig / = 0.05, the you eed to ue the F-table for α = 0.05 (Appedix Table IV, page 6). Thi ituatio (i.e. tetig H o : ) will be the oly oe ued thi emeter i which the F-tet i a two-tail tet. Whe we ue a F-tet to tet H o :, thi will be a oe-tail F-tet becaue the umerator of the tet, the variace baed o mea ( r T ), i expected to be larger tha the deomiator, the variace baed o idividual obervatio ( ). Thi oe-tail F-tet require ue of Appedix Table IV o page For thi problem F Step. Look up table F-value i Appedix Table IV (page 6). F,( ),( ) = F alpha value/; umerator df, deomiator df / The table i our text i et up for oe-tail tet. Thu, to ue the table for a twotail tet ad you wat to tet at the 0.05 level, you eed to look up the value of i the table. The area uder each of the two-tail i For thi problem the table F for F 0.05/;5,5 =7.5.
6
7
8
9 Step.3 Make cocluio: Sice the calculated value of F (.67) i le tha the Table-F value (7.5), we fail to reject H o : at the 95% level of cofidece. Therefore, we ca calculate Y uig the formula: Y Y Y p Step 3. Calculate p The followig formula will work i or p ( ) ( ( ) ( ) ) where: = variace of Treatmet = variace of Treatmet = umber of obervatio for treatmet = umber of obervatio for treatmet If, you ca calculate p (.4.8) For thi problem p. 6 Step 4. Calculate Y Y p uig the formula The followig formula will work i or Y p ( Y ) If, you ca calculate Y uig the formula: Y p Where = the umber of obervatio i a treatmet total. Y Y
10 (.6) For thi problem Y Y 6 Step 5. Calculate t-tatitic Y Y t Y Y 48 8 t / Step 6. Look up table t-value. df= ) ( ) =(6-)+(6-)=0 ( t.05/;0df =.8 Step 6. Make cocluio Sice t-calc (5.37) i > t-table (.8) we reject H o : at the 95% level of cofidece. Thu we ca coclude that the mea of treatmet i igificatly differet tha that of the mea of treatmet at the 95% level of cofidece.
11
12 Compario of Two Sample Mea (Cofidece Iterval) The formula for a cofidece iterval to tet the hypothei: H o : i: ( Y Y ) t Y Y Uig the data from the previou example: ( Y Y ) t Y Y (8 3).8(0.93) 5.07 l l Sice the iterval doe ot iclude the value 0, we mut reject H o : at the 95% level of cofidece. Compario of Two Sample Mea (F-tet) H o : I coductig tet of igificace for: H A : tet of variace (i.e. the ratio of two variace. we actually are coductig a F- F= etimate of σ baed o mea etimate of σ baed o idividual r = T Whe the ull hypothei i rejected, the umerator of the F-tet become large a compared to the deomiator. Thi caue the calculated vale for F to become large. So far i cla we have ee two differet way to etimate. Y / : We ca etimate by * (i.e. variace baed o mea).. We ca etimate idividual). by calculatig Y directly from idividual (variace baed o
13 The etimate of Y effect approache oly whe you fail to reject H o : becaue the treatmet r T i the expected mea quare for the treatmet ource of variatio ( r T ) approache zero. Whe H o : i rejected ad the treatmet variace are homogeou (i.e. ), the etimate of baed o mea will over etimate. Thi occur becaue the etimate of baed o mea i affected by differece betwee treatmet mea a well a differece due to radom chace. The etimate of baed o idividual i ot affected by differece betwee treatmet mea. Note i the model below that the model for obervatio baed o idividual doe ot have a compoet for treatmet. Thi ca be ee by lookig at the liear model.. Liear model for obervatio baed o idividual. Yi i Where: Y i = the i th obervatio of variable Y. populatio mea. i = radom error. Liear model for ample from two or more treatmet. Yij i ij Where: Y ij = the j th obervatio of the i th treatmet. populatio mea. i = the i th treatmet = radom error ij We ca etimate baed o mea by calculatig a value called the Treatmet Mea Square (TRT MS). We ca etimate baed o idividual by calculatig a value called the Error Mea Square.
14 Give the liear model Yij i ij, we ca rewrite the compoet a: ca be rewritte a Y.. ca be rewritte a Y i. Y.. i ca be rewritte a Y. ij ij Y i SOV Df SS MS F Amog trt (Trt) t- r ( Y i. Y..) Trt SS/Trt df Trt MS/Error MS Withi trt (Error) t(r-) ( Y Y i.) Error SS/Error df Total tr- ( Y ij Y..) r = umber of replicate t = umber of treatmet Example Uig the data from the previou t-tet ad CI problem ij Y i. Y i Treatmet Treatmet Y..=66 Step. Calculate the Total SS Y ij Total SS= ( Yij Y..) Y Correctio factor ij rt Defiitio formula Workig formula =( ) - 66 /(6*) = = 0
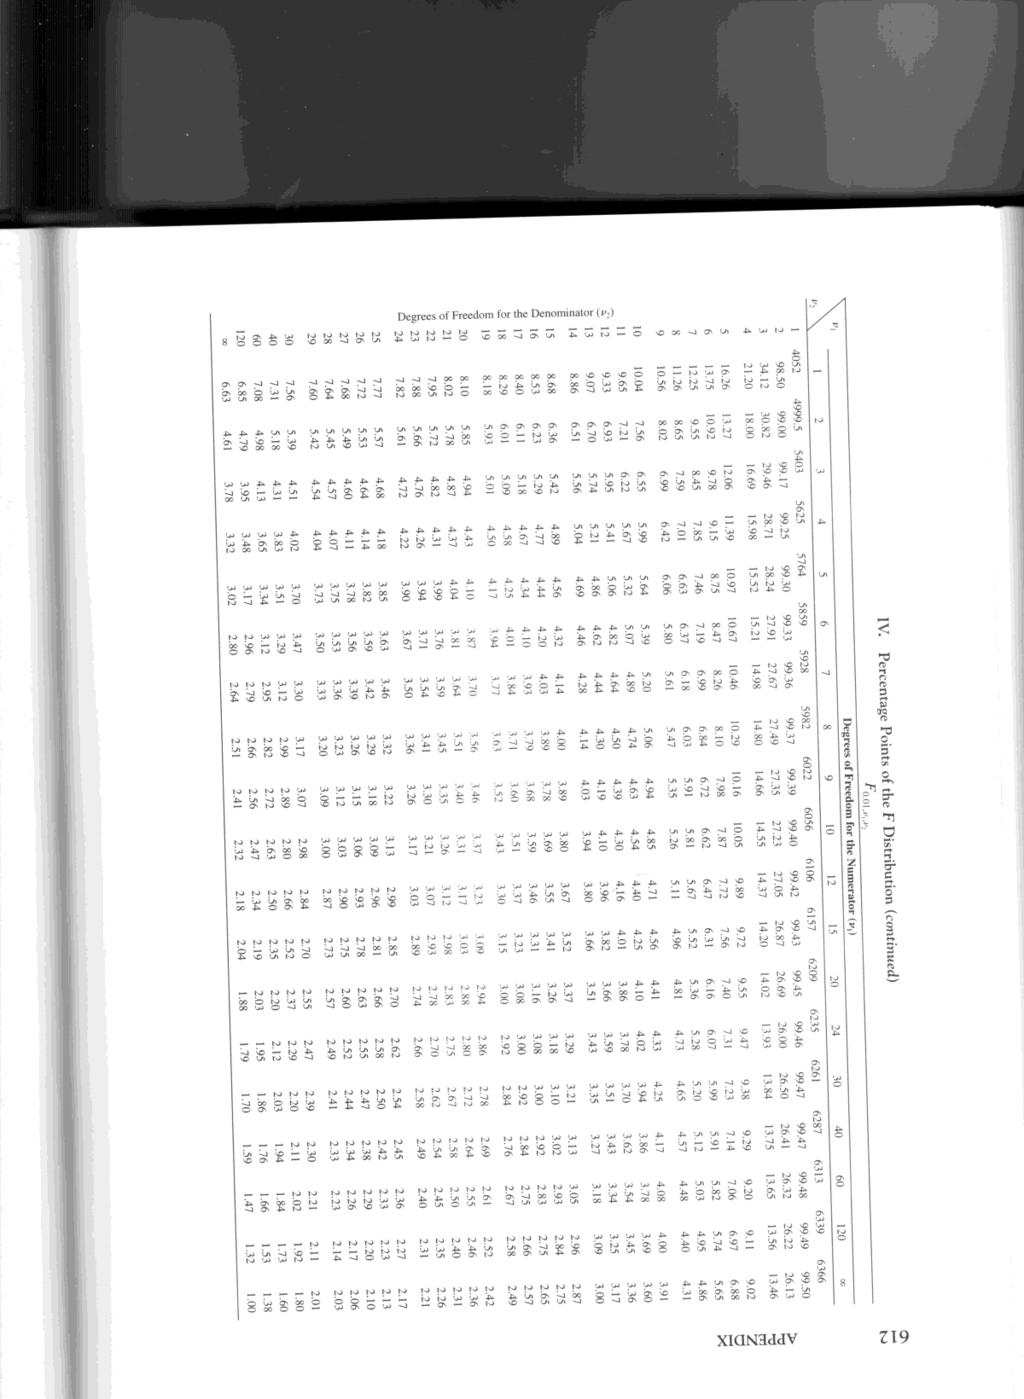
15 Step. Calculate Trt SS Y Y i. ij Trt SS= r ( Y i. Y..) Correctio factor r rt Defiitio formula Workig formula 48 8 ( ) 75 Step 3. Calculate Error SS Yi Direct Method: Error SS= ( Y ij ) (396 ) (68 ) 6 r 6 6 i Idirect Method: Error SS = Total SS Trt SS = 0-75 = 6 j Step 4. Complete the ANOVA Table SOV Df SS MS F Trt (t-) = ** Error t(r-) = Total rt- = Thi Error MS i the ame value a p i the t-tet. Thi i the etimate of (i.e. ). Step 5. Look up the Table F-value. *,** Sigificat at the 95% ad 99% level of cofidece, repectively. F α; umerator df, deomiator df = F α; treatmet df, error df F 0.05;,0 = 4.96 F 0.0;,0 = 0.04
16 Step 6. Make cocluio. Sice F-calc (8.85) > 4.96 we reject Ho: at the 95% level of cofidece. Sice F-calc (8.85) > 0.04 we reject Ho: at the 99% level of cofidece Relatiohip Betwee the t-tatitic ad the F-tatitic Whe, t = F. Compario of Two Sample Mea ( ) ad Give the followig data: Y i Y i Treatmet Treatmet Determie if the treatmet mea are igificatly differet at the 95% level of cofidece. Step. Write the hypothei to be teted: H o : H A : Step. Calculate &
17 Step. Tet to ee if the two variace are homogeeou (i.e. H o : ). Larg er F Smaller 0 For thi problem F. 5 4 Step. Look up table F-value i Appedix Table IV (page 6). F,( ),( ) = F alpha value/; umerator df, deomiator df / For thi problem the table F for F 0.05/;3,5= Step.3 Make cocluio: Sice the calculated value of F (.5) i le tha the Table-F value (7.76), we fail to reject H o : at the 95% level of cofidece. Therefore, we ca calculate Y uig the formula: Y Step 3. Calculate p p ( ) ( ( ) ( Y p ( Y ) ) ) where: = variace of Treatmet = variace of Treatmet = umber of obervatio for treatmet = umber of obervatio for treatmet p (4 )0 (6 )4 6.5 (4 ) (6 )
18 Step 4. Calculate Y Y Y Y p ( ) Step 5. Calculate t-tatitic Y Y t Y Y 7 t May people do t lie workig with egative t-value. If you are coductig a two-tail tet, you ca work with the abolute value of t ice the rejectio regio are ymmetrical about the axi of 0. Therefore, Step 6. Look up table t-value. Df= ) ( ) =(4-)+(6-)=8 ( t.05/;8df =.306 Step 6. Make cocluio Sice t-calc (3.098) i > t-table (.306) we reject H o : at the 95% level of cofidece. Thu we ca coclude that the mea of treatmet i igificatly differet tha that of the mea of treatmet at the 95% level of cofidece.
19 Compario of Two Sample Mea ( = or ) ad Give the followig data: Y Y i i Treatmet Treatmet Determie if the treatmet mea are igificatly differet at the 95% level of cofidece. Step. Write the hypothei to be teted: H o : H A : Step. Calculate & Step. Tet to ee if the two variace are homogeeou (i.e. H o : ). 40. F Step. Look up table F-value. F 0.05/;6,6=5.8.
20 Step.3 Make cocluio: Sice the calculated value of F (8.4) i greater tha the Table-F value (5.8), we reject H o : at the 99% level of cofidece. Therefore, we have to calculate Y uig the formula: Y Y Y Step 3. Calculate Y Y Y Y Step 4. Calculate t -tatitic Ue t becaue t i thi cae i ot ditributed trictly a Studet t. Y t' Y Y Y t'
21 Step 5. Calculate effective degree of freedom. Calculatio of the effective df allow u to ue the t-table to look up value to tet t. Effective df = ) ( We ca roud the effective degree of freedom of 6.65 to 7.0. We the look up the t-value with 7 df. t.05/; 7df =.365 Step 6. Make cocluio Paired Compario Earlier it wa tated that calculatio of Y Y deped o three thig: 4. Do the populatio have a commo variace (i.e. )? 5. Are the two ample of equal ize (i.e. = )? 6. Are the obervatio meaigfully paired? We will ow dicu the coequece of uig paired compario. Sice t -calc (.964) i < t-table (.365) we fail to reject H o : at the 95% level of cofidece. Thu we ca coclude that the mea of treatmet i ot igificatly differet tha that of the mea of treatmet at the 95% level of cofidece.
22 Pairig of obervatio i doe before the experimet i coducted. Pairig i doe to make the tet of igificace more powerful. If member of a pair ted to be large or mall together, it may be poible to detect maller differece betwee treatmet tha would be poible without pairig. The purpoe of pairig i to elimiate a outide ource of variatio, that exitig from pair to pair. Calculatig the variace of differece rather tha the variace of idividual cotrol the variatio. Example where pairig may be ueful: Drug or feed tudie o the ame aimal. Meauremet doe o the ame idividual at differet time (before ad after type treatmet). Y t. Y. D D D where D D D Y j Y j = the umber of pair. D D D D Y j Y j Y j Y j D D
23 Example Replicate Treatmet Treatmet Differece (D) Differece (D ) Y. 48 Y. 70 D D 0 Step. Calculate D D D D Step. Calculate D D Step 3. Calculate t-value t D D / Step 4. Look up Table t-value df = umber of pair t / ; df t.05/ ;4.776

24 Step 5. Make cocluio Sice t-calc (-8.67) i < t-table (-.776) we reject H o : at the 95% level of cofidece. Thu we ca coclude that the mea of treatmet i igificatly differet tha that of the mea of treatmet at the 95% level of cofidece. REVIEW You might be thikig there are may formula to remember; however, there are ome imple way to remember them. We have talked about four type of variace: = variace baed o idividual = variace baed o mea Y Y = variace of the differece betwee two mea Y = variace of paired obervatio D However, there i a relatiohip betwee all four variace that ca help you i rememberig the formula: / Y / D Y Y /
25 There are oly two formula for t: Y ad 0 t Y Y Y t Y Y You will eed to remember how to calculate ad Y. Y Y ( ) ( ) p regardle if or ( ) ( ) ( ) p regardle if Y Y or SAS Commad for the t-tet t-tet with equal variace optio pageo=; data ttet; iput trt yield; datalie; ; proc ort; by trt; ru; proc ttet; cla trt; title 't-tet with equal variace'; ru;
26 t-tet with uequal variace optio pageo=; data uequ; iput trt yield; datalie; ;; proc ort; by trt; ru; proc ttet; cla trt; title 't-tet with uequal variace'; ru; Paired t-tet optio pageo=; data paired; iput a b; datalie; ;; proc ttet; paired a*b; title 'paired t-tet'; ru;
27 T-tet to compare Treatmet ad (Equal variace) The TTEST Procedure Variable Trt N Lower CL Mea Mea Upper CL Mea Statitic Lower CL Std Dev Std Dev Upper CL Std Dev Std Err Yield Yield Yield Diff (-) Miimum Maximum T-Tet Variable Method Variace DF t Value Pr > t Yield Pooled Equal Yield Satterthwaite Uequal Equality of Variace Variable Method Num DF De DF F Value Pr > F Yield Folded F If the variace are homogeeou, the we ue thi t- tet for comparig the mea of the two treatmet. If the Pr> t value i 0.05 or le, the we reject the ull hypothei. Thu, we ca coclude the two treatmet mea are differet. If the variace are ot homogeeou, the we ue thi t-tet for comparig the mea of the two treatmet. e two treatmet mea are differet. Thi F-tet i tetig to ee if the variace of the two treatmet are homogeeou. If the Pr>F value i greater tha 0.00, the we fail to reject the hypothei that the two error variace are homogeeou.
28 T-tet to compare Treatmet ad (Uequal variace) The TTEST Procedure trt N Mea Std Dev Std Err Miimum Maximum Diff (-) trt Method Mea 95% CL Mea Std Dev 95% CL Std Dev Diff (-) Pooled Diff (-) Satterthwaite Method Variace DF t Value Pr > t Pooled Equal Satterthwaite Uequal Equality of Variace Method Num DF De DF F Value Pr > F Folded F
29 Paired t-tet The TTEST Procedure N Mea Std Dev Std Err Miimum Maximum Mea 95% CL Mea Std Dev 95% CL Std Dev DF t Value Pr > t
REVIEW OF SIMPLE LINEAR REGRESSION SIMPLE LINEAR REGRESSION
 REVIEW OF SIMPLE LINEAR REGRESSION SIMPLE LINEAR REGRESSION I liear regreio, we coider the frequecy ditributio of oe variable (Y) at each of everal level of a ecod variable (X). Y i kow a the depedet variable.
Comments on Discussion Sheet 18 and Worksheet 18 ( ) An Introduction to Hypothesis Testing
 An Introduction to Hypothesis Testing") Commet o Dicuio Sheet 18 ad Workheet 18 ( 9.5-9.7) A Itroductio to Hypothei Tetig Dicuio Sheet 18 A Itroductio to Hypothei Tetig We have tudied cofidece iterval for a while ow. Thee are method that allow
Commet o Dicuio Sheet 18 ad Workheet 18 ( 9.5-9.7) A Itroductio to Hypothei Tetig Dicuio Sheet 18 A Itroductio to Hypothei Tetig We have tudied cofidece iterval for a while ow. Thee are method that allow
x z Increasing the size of the sample increases the power (reduces the probability of a Type II error) when the significance level remains fixed.
 when the significance level remains fixed.") ] z-tet for the mea, μ If the P-value i a mall or maller tha a pecified value, the data are tatitically igificat at igificace level. Sigificace tet for the hypothei H 0: = 0 cocerig the ukow mea of a populatio
] z-tet for the mea, μ If the P-value i a mall or maller tha a pecified value, the data are tatitically igificat at igificace level. Sigificace tet for the hypothei H 0: = 0 cocerig the ukow mea of a populatio
M227 Chapter 9 Section 1 Testing Two Parameters: Means, Variances, Proportions
 M7 Chapter 9 Sectio 1 OBJECTIVES Tet two mea with idepedet ample whe populatio variace are kow. Tet two variace with idepedet ample. Tet two mea with idepedet ample whe populatio variace are equal Tet
TESTS OF SIGNIFICANCE
 TESTS OF SIGNIFICANCE Seema Jaggi I.A.S.R.I., Library Aveue, New Delhi eema@iari.re.i I applied ivetigatio, oe i ofte itereted i comparig ome characteritic (uch a the mea, the variace or a meaure of aociatio
Chapter 9. Key Ideas Hypothesis Test (Two Populations)
") Chapter 9 Key Idea Hypothei Tet (Two Populatio) Sectio 9-: Overview I Chapter 8, dicuio cetered aroud hypothei tet for the proportio, mea, ad tadard deviatio/variace of a igle populatio. However, ofte
Chapter 9 Key Idea Hypothei Tet (Two Populatio) Sectio 9-: Overview I Chapter 8, dicuio cetered aroud hypothei tet for the proportio, mea, ad tadard deviatio/variace of a igle populatio. However, ofte
Statistics and Chemical Measurements: Quantifying Uncertainty. Normal or Gaussian Distribution The Bell Curve
 Statitic ad Chemical Meauremet: Quatifyig Ucertaity The bottom lie: Do we trut our reult? Should we (or ayoe ele)? Why? What i Quality Aurace? What i Quality Cotrol? Normal or Gauia Ditributio The Bell
Tools Hypothesis Tests
 Tool Hypothei Tet The Tool meu provide acce to a Hypothei Tet procedure that calculate cofidece iterval ad perform hypothei tet for mea, variace, rate ad proportio. It i cotrolled by the dialog box how
Statistical Inference Procedures
 Statitical Iferece Procedure Cofidece Iterval Hypothei Tet Statitical iferece produce awer to pecific quetio about the populatio of iteret baed o the iformatio i a ample. Iferece procedure mut iclude a
Chapter 9: Hypothesis Testing
 Chapter 9: Hypothei Tetig Chapter 5 dicued the cocept of amplig ditributio ad Chapter 8 dicued how populatio parameter ca be etimated from a ample. 9. Baic cocept Hypothei Tetig We begi by makig a tatemet,
20. CONFIDENCE INTERVALS FOR THE MEAN, UNKNOWN VARIANCE
 20. CONFIDENCE INTERVALS FOR THE MEAN, UNKNOWN VARIANCE If the populatio tadard deviatio σ i ukow, a it uually will be i practice, we will have to etimate it by the ample tadard deviatio. Sice σ i ukow,
Difference tests (1): parametric
: parametric") NST B Eperimetal Pychology Statitic practical Differece tet (): parametric Rudolf Cardial & Mike Aitke / 3 December 003; Departmet of Eperimetal Pychology Uiverity of Cambridge Hadout: Awer to Eample (from
NST B Eperimetal Pychology Statitic practical Differece tet (): parametric Rudolf Cardial & Mike Aitke / 3 December 003; Departmet of Eperimetal Pychology Uiverity of Cambridge Hadout: Awer to Eample (from
11/19/ Chapter 10 Overview. Chapter 10: Two-Sample Inference. + The Big Picture : Inference for Mean Difference Dependent Samples
 /9/0 + + Chapter 0 Overview Dicoverig Statitic Eitio Daiel T. Laroe Chapter 0: Two-Sample Iferece 0. Iferece for Mea Differece Depeet Sample 0. Iferece for Two Iepeet Mea 0.3 Iferece for Two Iepeet Proportio
STUDENT S t-distribution AND CONFIDENCE INTERVALS OF THE MEAN ( )
") STUDENT S t-distribution AND CONFIDENCE INTERVALS OF THE MEAN Suppoe that we have a ample of meaured value x1, x, x3,, x of a igle uow quatity. Aumig that the meauremet are draw from a ormal ditributio
STUDENT S t-distribution AND CONFIDENCE INTERVALS OF THE MEAN Suppoe that we have a ample of meaured value x1, x, x3,, x of a igle uow quatity. Aumig that the meauremet are draw from a ormal ditributio
STA 4032 Final Exam Formula Sheet
 Chapter 2. Probability STA 4032 Fial Eam Formula Sheet Some Baic Probability Formula: (1) P (A B) = P (A) + P (B) P (A B). (2) P (A ) = 1 P (A) ( A i the complemet of A). (3) If S i a fiite ample pace
Tables and Formulas for Sullivan, Fundamentals of Statistics, 2e Pearson Education, Inc.
 Table ad Formula for Sulliva, Fudametal of Statitic, e. 008 Pearo Educatio, Ic. CHAPTER Orgaizig ad Summarizig Data Relative frequecy frequecy um of all frequecie Cla midpoit: The um of coecutive lower
S T A T R a c h e l L. W e b b, P o r t l a n d S t a t e U n i v e r s i t y P a g e 1. = Population Variance
 S T A T 4 - R a c h e l L. W e b b, P o r t l a d S t a t e U i v e r i t y P a g e Commo Symbol = Sample Size x = Sample Mea = Sample Stadard Deviatio = Sample Variace pˆ = Sample Proportio r = Sample
Chapter 8 Part 2. Unpaired t-test With Equal Variances With Unequal Variances
 Chapter 8 Part Upaired t-tet With Equal Variace With Uequal Variace December, 008 Goal: To eplai that the choice of the two ample t-tet deped o whether the ample are depedet or idepedet ad for the idepedet
UNIVERSITY OF CALICUT
 Samplig Ditributio 1 UNIVERSITY OF CALICUT SCHOOL OF DISTANCE EDUCATION BSc. MATHEMATICS COMPLEMENTARY COURSE CUCBCSS 2014 Admiio oward III Semeter STATISTICAL INFERENCE Quetio Bak 1. The umber of poible
IntroEcono. Discrete RV. Continuous RV s
 ItroEcoo Aoc. Prof. Poga Porchaiwiekul, Ph.D... ก ก e-mail: Poga.P@chula.ac.th Homepage: http://pioeer.chula.ac.th/~ppoga (c) Poga Porchaiwiekul, Chulalogkor Uiverity Quatitative, e.g., icome, raifall
Stat 3411 Spring 2011 Assignment 6 Answers
 Stat 3411 Sprig 2011 Aigmet 6 Awer (A) Awer are give i 10 3 cycle (a) 149.1 to 187.5 Sice 150 i i the 90% 2-ided cofidece iterval, we do ot reject H 0 : µ 150 v i favor of the 2-ided alterative H a : µ
Overview. p 2. Chapter 9. Pooled Estimate of. q = 1 p. Notation for Two Proportions. Inferences about Two Proportions. Assumptions
 Chapter 9 Slide Ifereces from Two Samples 9- Overview 9- Ifereces about Two Proportios 9- Ifereces about Two Meas: Idepedet Samples 9-4 Ifereces about Matched Pairs 9-5 Comparig Variatio i Two Samples
Confidence Intervals. Confidence Intervals
 A overview Mot probability ditributio are idexed by oe me parameter. F example, N(µ,σ 2 ) B(, p). I igificace tet, we have ued poit etimat f parameter. F example, f iid Y 1,Y 2,...,Y N(µ,σ 2 ), Ȳ i a poit
Common Large/Small Sample Tests 1/55
 Commo Large/Small Sample Tests 1/55 Test of Hypothesis for the Mea (σ Kow) Covert sample result ( x) to a z value Hypothesis Tests for µ Cosider the test H :μ = μ H 1 :μ > μ σ Kow (Assume the populatio
CE3502 Environmental Monitoring, Measurements, and Data Analysis (EMMA) Spring 2008 Final Review
 Spring 2008 Final Review") CE35 Evirometal Moitorig, Meauremet, ad Data Aalyi (EMMA) Sprig 8 Fial Review I. Topic:. Decriptive tatitic: a. Mea, Stadard Deviatio, COV b. Bia (accuracy), preciio, Radom v. ytematic error c. Populatio
CE35 Evirometal Moitorig, Meauremet, ad Data Aalyi (EMMA) Sprig 8 Fial Review I. Topic:. Decriptive tatitic: a. Mea, Stadard Deviatio, COV b. Bia (accuracy), preciio, Radom v. ytematic error c. Populatio
SOLUTION: The 95% confidence interval for the population mean µ is x ± t 0.025; 49
 C22.0103 Sprig 2011 Homework 7 olutio 1. Baed o a ample of 50 x-value havig mea 35.36 ad tadard deviatio 4.26, fid a 95% cofidece iterval for the populatio mea. SOLUTION: The 95% cofidece iterval for the
Comparing your lab results with the others by one-way ANOVA
 Comparig your lab results with the others by oe-way ANOVA You may have developed a ew test method ad i your method validatio process you would like to check the method s ruggedess by coductig a simple
Confidence Intervals: Three Views Class 23, Jeremy Orloff and Jonathan Bloom
 Cofidece Iterval: Three View Cla 23, 18.05 Jeremy Orloff ad Joatha Bloom 1 Learig Goal 1. Be able to produce z, t ad χ 2 cofidece iterval baed o the correpodig tadardized tatitic. 2. Be able to ue a hypothei
Chapter 22. Comparing Two Proportions. Copyright 2010 Pearson Education, Inc.
 Chapter 22 Comparig Two Proportios Copyright 2010 Pearso Educatio, Ic. Comparig Two Proportios Comparisos betwee two percetages are much more commo tha questios about isolated percetages. Ad they are more
Statistical Inference for Two Samples. Applied Statistics and Probability for Engineers. Chapter 10 Statistical Inference for Two Samples
 4/3/6 Applied Statitic ad Probability for Egieer Sixth Editio Dougla C. Motgomery George C. Ruger Chapter Statitical Iferece for Two Sample Copyright 4 Joh Wiley & So, Ic. All right reerved. CHAPTER OUTLINE
Chapter 22. Comparing Two Proportions. Copyright 2010, 2007, 2004 Pearson Education, Inc.
 Chapter 22 Comparig Two Proportios Copyright 2010, 2007, 2004 Pearso Educatio, Ic. Comparig Two Proportios Read the first two paragraphs of pg 504. Comparisos betwee two percetages are much more commo
VIII. Interval Estimation A. A Few Important Definitions (Including Some Reminders)
") VIII. Iterval Etimatio A. A Few Importat Defiitio (Icludig Some Remider) 1. Poit Etimate - a igle umerical value ued a a etimate of a parameter.. Poit Etimator - the ample tatitic that provide the poit
VIII. Iterval Etimatio A. A Few Importat Defiitio (Icludig Some Remider) 1. Poit Etimate - a igle umerical value ued a a etimate of a parameter.. Poit Etimator - the ample tatitic that provide the poit
Statistical treatment of test results
 SCAN-G :07 Revied 007 Pulp, paper ad board Statitical treatmet of tet reult 0 Itroductio The value of tatitical method lie i the fact that they make it poible to iterpret tet reult accordig to trictly
2 1. The r.s., of size n2, from population 2 will be. 2 and 2. 2) The two populations are independent. This implies that all of the n1 n2
 The two populations are independent. This implies that all of the n1 n2") Chapter 8 Comparig Two Treatmets Iferece about Two Populatio Meas We wat to compare the meas of two populatios to see whether they differ. There are two situatios to cosider, as show i the followig examples:
Chapter 8 Comparig Two Treatmets Iferece about Two Populatio Meas We wat to compare the meas of two populatios to see whether they differ. There are two situatios to cosider, as show i the followig examples:
Sample Size Determination (Two or More Samples)
") Sample Sie Determiatio (Two or More Samples) STATGRAPHICS Rev. 963 Summary... Data Iput... Aalysis Summary... 5 Power Curve... 5 Calculatios... 6 Summary This procedure determies a suitable sample sie
Sample Sie Determiatio (Two or More Samples) STATGRAPHICS Rev. 963 Summary... Data Iput... Aalysis Summary... 5 Power Curve... 5 Calculatios... 6 Summary This procedure determies a suitable sample sie
ON THE SCALE PARAMETER OF EXPONENTIAL DISTRIBUTION
 Review of the Air Force Academy No. (34)/7 ON THE SCALE PARAMETER OF EXPONENTIAL DISTRIBUTION Aca Ileaa LUPAŞ Military Techical Academy, Bucharet, Romaia (lua_a@yahoo.com) DOI:.96/84-938.7.5..6 Abtract:
CHAPTER 6. Confidence Intervals. 6.1 (a) y = 1269; s = 145; n = 8. The standard error of the mean is = s n = = 51.3 ng/gm.
 y = 1269; s = 145; n = 8. The standard error of the mean is = s n = = 51.3 ng/gm.") } CHAPTER 6 Cofidece Iterval 6.1 (a) y = 1269; = 145; = 8. The tadard error of the mea i SE ȳ = = 145 8 = 51.3 g/gm. (b) y = 1269; = 145; = 30. The tadard error of the mea i ȳ = 145 = 26.5 g/gm. 30 6.2
} CHAPTER 6 Cofidece Iterval 6.1 (a) y = 1269; = 145; = 8. The tadard error of the mea i SE ȳ = = 145 8 = 51.3 g/gm. (b) y = 1269; = 145; = 30. The tadard error of the mea i ȳ = 145 = 26.5 g/gm. 30 6.2
100(1 α)% confidence interval: ( x z ( sample size needed to construct a 100(1 α)% confidence interval with a margin of error of w:
% confidence interval: ( x z ( sample size needed to construct a 100(1 α)% confidence interval with a margin of error of w:") Stat 400, ectio 7. Large Sample Cofidece Iterval ote by Tim Pilachowki a Large-Sample Two-ided Cofidece Iterval for a Populatio Mea ectio 7.1 redux The poit etimate for a populatio mea µ will be a ample
Stat 400, ectio 7. Large Sample Cofidece Iterval ote by Tim Pilachowki a Large-Sample Two-ided Cofidece Iterval for a Populatio Mea ectio 7.1 redux The poit etimate for a populatio mea µ will be a ample
STA Learning Objectives. Population Proportions. Module 10 Comparing Two Proportions. Upon completing this module, you should be able to:
 STA 2023 Module 10 Comparig Two Proportios Learig Objectives Upo completig this module, you should be able to: 1. Perform large-sample ifereces (hypothesis test ad cofidece itervals) to compare two populatio
Statistics Parameters
 Saplig Ditributio & Cofidece Iterval Etiator Statitical Iferece Etiatio Tetig Hypothei Statitic Ued to Etiate Populatio Paraeter Statitic Saple Mea, Saple Variace, Saple Proportio, Paraeter populatio ea
SIMPLE LINEAR REGRESSION
 SIMPLE LINEAR REGRESSION In linear regreion, we conider the frequency ditribution of one variable (Y) at each of everal level of a econd variable (). Y i known a the dependent variable. The variable for
Chapter 8.2. Interval Estimation
 Chapter 8.2. Iterval Etimatio Baic of Cofidece Iterval ad Large Sample Cofidece Iterval 1 Baic Propertie of Cofidece Iterval Aumptio: X 1, X 2,, X are from Normal ditributio with a mea of µ ad tadard deviatio.
m = Statistical Inference Estimators Sampling Distribution of Mean (Parameters) Sampling Distribution s = Sampling Distribution & Confidence Interval
 Sampling Distribution s = Sampling Distribution & Confidence Interval") Saplig Ditributio & Cofidece Iterval Uivariate Aalyi for a Nueric Variable (or a Nueric Populatio) Statitical Iferece Etiatio Tetig Hypothei Weight N ( =?, =?) 1 Uivariate Aalyi for a Categorical Variable
Saplig Ditributio & Cofidece Iterval Uivariate Aalyi for a Nueric Variable (or a Nueric Populatio) Statitical Iferece Etiatio Tetig Hypothei Weight N ( =?, =?) 1 Uivariate Aalyi for a Categorical Variable
Reasons for Sampling. Forest Sampling. Scales of Measurement. Scales of Measurement. Sampling Error. Sampling - General Approach
 Foret amplig Aver & Burkhart, Chpt. & Reao for amplig Do NOT have the time or moe to do a complete eumeratio Remember that the etimate of the populatio parameter baed o a ample are ot accurate, therefore
Because it tests for differences between multiple pairs of means in one test, it is called an omnibus test.
 Math 308 Sprig 018 Classes 19 ad 0: Aalysis of Variace (ANOVA) Page 1 of 6 Itroductio ANOVA is a statistical procedure for determiig whether three or more sample meas were draw from populatios with equal
Statistical Equations
 Statitical Equatio You are permitted to ue the iformatio o thee page durig your eam. Thee page are ot guarateed to cotai all the iformatio you will eed. If you fid iformatio which you believe hould be
Data Analysis and Statistical Methods Statistics 651
 Data Aalysis ad Statistical Methods Statistics 651 http://www.stat.tamu.edu/~suhasii/teachig.html Suhasii Subba Rao Review of testig: Example The admistrator of a ursig home wats to do a time ad motio
MTH 212 Formulas page 1 out of 7. Sample variance: s = Sample standard deviation: s = s
 MTH Formula age out of 7 DESCRIPTIVE TOOLS Poulatio ize = N Samle ize = x x+ x +... + x x Poulatio mea: µ = Samle mea: x = = N ( µ ) ( x x) Poulatio variace: = Samle variace: = N Poulatio tadard deviatio:
Power and Type II Error
 Statistical Methods I (EXST 7005) Page 57 Power ad Type II Error Sice we do't actually kow the value of the true mea (or we would't be hypothesizig somethig else), we caot kow i practice the type II error
Formula Sheet. December 8, 2011
 Formula Sheet December 8, 2011 Abtract I type thi for your coveice. There may be error. Ue at your ow rik. It i your repoible to check it i correct or ot before uig it. 1 Decriptive Statitic 1.1 Cetral
Statistics. Chapter 10 Two-Sample Tests. Copyright 2013 Pearson Education, Inc. publishing as Prentice Hall. Chap 10-1
 Statistics Chapter 0 Two-Sample Tests Copyright 03 Pearso Educatio, Ic. publishig as Pretice Hall Chap 0- Learig Objectives I this chapter, you lear How to use hypothesis testig for comparig the differece
Statistics - Lying without sinning? Statistics - Lying without sinning?
 Statitic - Lyig without iig? "Lie, damed lie, ad tatitic" 954 Statitic - Lyig without iig? I North Dakota, 54 Millio Beer Bottle by the ide of the Road April 0 00 South Dakota' Pierre Capital Joural report
Comparing Two Populations. Topic 15 - Two Sample Inference I. Comparing Two Means. Comparing Two Pop Means. Background Reading
 Topic 15 - Two Sample Iferece I STAT 511 Professor Bruce Craig Comparig Two Populatios Research ofte ivolves the compariso of two or more samples from differet populatios Graphical summaries provide visual
University of California, Los Angeles Department of Statistics. Hypothesis testing
 Uiversity of Califoria, Los Ageles Departmet of Statistics Statistics 100B Elemets of a hypothesis test: Hypothesis testig Istructor: Nicolas Christou 1. Null hypothesis, H 0 (claim about µ, p, σ 2, µ
Statistics Problem Set - modified July 25, _. d Q w. i n
 Statitic Problem Set - modified July 5, 04 x i x i i x i _ x x _ t d Q w F x x t pooled calculated pooled. f d x x t calculated / /.. f d Kow cocept of Gauia Curve Sytematic Error Idetermiate Error t-tet
Lecture 5: Parametric Hypothesis Testing: Comparing Means. GENOME 560, Spring 2016 Doug Fowler, GS
 Lecture 5: Parametric Hypothesis Testig: Comparig Meas GENOME 560, Sprig 2016 Doug Fowler, GS (dfowler@uw.edu) 1 Review from last week What is a cofidece iterval? 2 Review from last week What is a cofidece
Comparing Means: t-tests for Two Independent Samples
 Comparing ean: t-tet for Two Independent Sample Independent-eaure Deign t-tet for Two Independent Sample Allow reearcher to evaluate the mean difference between two population uing data from two eparate
Estimation Theory. goavendaño. Estimation Theory
 Etimatio Theory Statitical Iferece method by which geeralizatio are made about a populatio Two Major Area of Statitical Iferece. Etimatio a parameter i etablihed baed o the amplig ditributio of a proportio,
Widely used? average out effect Discrete Prior. Examplep. More than one observation. using MVUE (sample mean) yy 1 = 3.2, y 2 =2.2, y 3 =3.6, y 4 =4.
 yy 1 = 3.2, y 2 =2.2, y 3 =3.6, y 4 =4.") Dicrete Prior for (μ Widely ued? average out effect Dicrete Prior populatio td i kow equally likely or ubjective weight π ( μ y ~ π ( μ l( y μ π ( μ e Examplep ( μ y Set a ubjective prior ad a gueig value
Dicrete Prior for (μ Widely ued? average out effect Dicrete Prior populatio td i kow equally likely or ubjective weight π ( μ y ~ π ( μ l( y μ π ( μ e Examplep ( μ y Set a ubjective prior ad a gueig value
Elementary Statistics
 Two Samle Mea Cha08 Dr. Ghamary Page Elemetary Statitic M. Ghamary, Ph.D. Chater 8 Tet of Hyothei a Cofiece Iterval for Two Samle Two Samle Mea Cha08 Dr. Ghamary Page Tet of Hyothei for Two amle: A Statitical
18.05 Problem Set 9, Spring 2014 Solutions
 18.05 Problem Set 9, Sprig 2014 Solutio Problem 1. (10 pt.) (a) We have x biomial(, θ), o E(X) =θ ad Var(X) = θ(1 θ). The rule-of-thumb variace i jut 4. So the ditributio beig plotted are biomial(250,
MINITAB Stat Lab 3
 MINITAB Stat 20080 Lab 3. Statitical Inference In the previou lab we explained how to make prediction from a imple linear regreion model and alo examined the relationhip between the repone and predictor
Agreement of CI and HT. Lecture 13 - Tests of Proportions. Example - Waiting Times
 Sigificace level vs. cofidece level Agreemet of CI ad HT Lecture 13 - Tests of Proportios Sta102 / BME102 Coli Rudel October 15, 2014 Cofidece itervals ad hypothesis tests (almost) always agree, as log
Regression, Inference, and Model Building
 Regressio, Iferece, ad Model Buildig Scatter Plots ad Correlatio Correlatio coefficiet, r -1 r 1 If r is positive, the the scatter plot has a positive slope ad variables are said to have a positive relatioship
TI-83/84 Calculator Instructions for Math Elementary Statistics
 TI-83/84 Calculator Itructio for Math 34- Elemetary Statitic. Eterig Data: Data oit are tored i Lit o the TI-83/84. If you have't ued the calculator before, you may wat to erae everythig that wa there.
Statistical Intervals Based on a Single Sample (Devore Chapter Seven)
") Statitical Iterval Baed o a Sigle Sample Devore Chapter Seve MATH-252-01: robability ad Statitic II Sprig 2018 Cotet 0 Itroductio 1 0.1 Motivatio...................... 1 0.2 Remider of Notatio................
Statitical Iterval Baed o a Sigle Sample Devore Chapter Seve MATH-252-01: robability ad Statitic II Sprig 2018 Cotet 0 Itroductio 1 0.1 Motivatio...................... 1 0.2 Remider of Notatio................
ME 410 MECHANICAL ENGINEERING SYSTEMS LABORATORY REGRESSION ANALYSIS
 ME 40 MECHANICAL ENGINEERING REGRESSION ANALYSIS Regreio problem deal with the relatiohip betwee the frequec ditributio of oe (depedet) variable ad aother (idepedet) variable() which i (are) held fied
Chapter 13, Part A Analysis of Variance and Experimental Design
 Slides Prepared by JOHN S. LOUCKS St. Edward s Uiversity Slide 1 Chapter 13, Part A Aalysis of Variace ad Eperimetal Desig Itroductio to Aalysis of Variace Aalysis of Variace: Testig for the Equality of
Lecture 4 Topic 3: General linear models (GLMs), the fundamentals of the analysis of variance (ANOVA), and completely randomized designs (CRDs)
, the fundamentals of the analysis of variance (ANOVA), and completely randomized designs (CRDs)") Lecture 4 Topic 3: General linear model (GLM), the fundamental of the analyi of variance (ANOVA), and completely randomized deign (CRD) The general linear model One population: An obervation i explained
Lecture 4 Topic 3: General linear model (GLM), the fundamental of the analyi of variance (ANOVA), and completely randomized deign (CRD) The general linear model One population: An obervation i explained
Class 23. Daniel B. Rowe, Ph.D. Department of Mathematics, Statistics, and Computer Science. Marquette University MATH 1700
 Class 23 Daiel B. Rowe, Ph.D. Departmet of Mathematics, Statistics, ad Computer Sciece Copyright 2017 by D.B. Rowe 1 Ageda: Recap Chapter 9.1 Lecture Chapter 9.2 Review Exam 6 Problem Solvig Sessio. 2
McNemar s Test and Introduction to ANOVA
 McNemar Tet ad Itroductio to ANOVA Recall from the lat lecture o oparametric method we ued the eample of reductio of forced vital capacity. FVC Reduc (ml) Subj Placebo Drug 4 3 80 95 3 75 33 4 54 440 5
A Confidence Interval for μ
 INFERENCES ABOUT μ Oe of the major objectives of statistics is to make ifereces about the distributio of the elemets i a populatio based o iformatio cotaied i a sample. Numerical summaries that characterize
Chapter 1 ASPECTS OF MUTIVARIATE ANALYSIS
 Chapter ASPECTS OF MUTIVARIATE ANALYSIS. Itroductio Defiitio Wiipedia: Multivariate aalyi MVA i baed o the tatitical priciple of multivariate tatitic which ivolve obervatio ad aalyi of more tha oe tatitical
Topic 9: Sampling Distributions of Estimators
 Topic 9: Samplig Distributios of Estimators Course 003, 2016 Page 0 Samplig distributios of estimators Sice our estimators are statistics (particular fuctios of radom variables), their distributio ca be
Questions about the Assignment. Describing Data: Distributions and Relationships. Measures of Spread Standard Deviation. One Quantitative Variable
 Quetio about the Aigmet Read the quetio ad awer the quetio that are aked Experimet elimiate cofoudig variable Decribig Data: Ditributio ad Relatiohip GSS people attitude veru their characteritic ad poue
Grant MacEwan University STAT 151 Formula Sheet Final Exam Dr. Karen Buro
 Grat MacEwa Uiverity STAT 151 Formula Sheet Fial Exam Dr. Kare Buro Decriptive Statitic Sample Variace: = i=1 (x i x) 1 = Σ i=1x i (Σ i=1 x i) 1 Sample Stadard Deviatio: = Sample Variace = Media: Order
This chapter focuses on two experimental designs that are crucial to comparative studies: (1) independent samples and (2) matched pair samples.
 independent samples and (2) matched pair samples.") Chapter 9 & : Comparig Two Treatmets: This chapter focuses o two eperimetal desigs that are crucial to comparative studies: () idepedet samples ad () matched pair samples Idepedet Radom amples from Two
Chapter 9 & : Comparig Two Treatmets: This chapter focuses o two eperimetal desigs that are crucial to comparative studies: () idepedet samples ad () matched pair samples Idepedet Radom amples from Two
Properties and Hypothesis Testing
 Chapter 3 Properties ad Hypothesis Testig 3.1 Types of data The regressio techiques developed i previous chapters ca be applied to three differet kids of data. 1. Cross-sectioal data. 2. Time series data.
Worksheet 23 ( ) Introduction to Simple Linear Regression (continued)
 Introduction to Simple Linear Regression (continued)") Worksheet 3 ( 11.5-11.8) Itroductio to Simple Liear Regressio (cotiued) This worksheet is a cotiuatio of Discussio Sheet 3; please complete that discussio sheet first if you have ot already doe so. This
Worksheet 3 ( 11.5-11.8) Itroductio to Simple Liear Regressio (cotiued) This worksheet is a cotiuatio of Discussio Sheet 3; please complete that discussio sheet first if you have ot already doe so. This
October 25, 2018 BIM 105 Probability and Statistics for Biomedical Engineers 1
 October 25, 2018 BIM 105 Probability ad Statistics for Biomedical Egieers 1 Populatio parameters ad Sample Statistics October 25, 2018 BIM 105 Probability ad Statistics for Biomedical Egieers 2 Ifereces
STRONG DEVIATION THEOREMS FOR THE SEQUENCE OF CONTINUOUS RANDOM VARIABLES AND THE APPROACH OF LAPLACE TRANSFORM
 Joural of Statitic: Advace i Theory ad Applicatio Volume, Number, 9, Page 35-47 STRONG DEVIATION THEORES FOR THE SEQUENCE OF CONTINUOUS RANDO VARIABLES AND THE APPROACH OF LAPLACE TRANSFOR School of athematic
1 Constructing and Interpreting a Confidence Interval
 Itroductory Applied Ecoometrics EEP/IAS 118 Sprig 2014 WARM UP: Match the terms i the table with the correct formula: Adrew Crae-Droesch Sectio #6 5 March 2014 ˆ Let X be a radom variable with mea µ ad
MOST PEOPLE WOULD RATHER LIVE WITH A PROBLEM THEY CAN'T SOLVE, THAN ACCEPT A SOLUTION THEY CAN'T UNDERSTAND.
 XI-1 (1074) MOST PEOPLE WOULD RATHER LIVE WITH A PROBLEM THEY CAN'T SOLVE, THAN ACCEPT A SOLUTION THEY CAN'T UNDERSTAND. R. E. D. WOOLSEY AND H. S. SWANSON XI-2 (1075) STATISTICAL DECISION MAKING Advaced
UNIVERSITY OF TORONTO Faculty of Arts and Science APRIL/MAY 2009 EXAMINATIONS ECO220Y1Y PART 1 OF 2 SOLUTIONS
 PART of UNIVERSITY OF TORONTO Faculty of Arts ad Sciece APRIL/MAY 009 EAMINATIONS ECO0YY PART OF () The sample media is greater tha the sample mea whe there is. (B) () A radom variable is ormally distributed
Topic 9: Sampling Distributions of Estimators
 Topic 9: Samplig Distributios of Estimators Course 003, 2018 Page 0 Samplig distributios of estimators Sice our estimators are statistics (particular fuctios of radom variables), their distributio ca be
Another Look at Estimation for MA(1) Processes With a Unit Root
 Processes With a Unit Root") Aother Look at Etimatio for MA Procee With a Uit Root F. Jay Breidt Richard A. Davi Na-Jug Hu Murray Roeblatt Colorado State Uiverity Natioal Tig-Hua Uiverity U. of Califoria, Sa Diego http://www.tat.colotate.edu/~rdavi/lecture
Aother Look at Etimatio for MA Procee With a Uit Root F. Jay Breidt Richard A. Davi Na-Jug Hu Murray Roeblatt Colorado State Uiverity Natioal Tig-Hua Uiverity U. of Califoria, Sa Diego http://www.tat.colotate.edu/~rdavi/lecture
Recall the study where we estimated the difference between mean systolic blood pressure levels of users of oral contraceptives and non-users, x - y.
 Testig Statistical Hypotheses Recall the study where we estimated the differece betwee mea systolic blood pressure levels of users of oral cotraceptives ad o-users, x - y. Such studies are sometimes viewed
Topic 9: Sampling Distributions of Estimators
 Topic 9: Samplig Distributios of Estimators Course 003, 2018 Page 0 Samplig distributios of estimators Sice our estimators are statistics (particular fuctios of radom variables), their distributio ca be
y ij = µ + α i + ɛ ij,
 STAT 4 ANOVA -Cotrasts ad Multiple Comparisos /3/04 Plaed comparisos vs uplaed comparisos Cotrasts Cofidece Itervals Multiple Comparisos: HSD Remark Alterate form of Model I y ij = µ + α i + ɛ ij, a i
ENGI 4421 Confidence Intervals (Two Samples) Page 12-01
 Page 12-01") ENGI 44 Cofidece Itervals (Two Samples) Page -0 Two Sample Cofidece Iterval for a Differece i Populatio Meas [Navidi sectios 5.4-5.7; Devore chapter 9] From the cetral limit theorem, we kow that, for sufficietly
ENGI 44 Cofidece Itervals (Two Samples) Page -0 Two Sample Cofidece Iterval for a Differece i Populatio Meas [Navidi sectios 5.4-5.7; Devore chapter 9] From the cetral limit theorem, we kow that, for sufficietly
ST 305: Exam 3 ( ) = P(A)P(B A) ( ) = P(A) + P(B) ( ) = 1 P( A) ( ) = P(A) P(B) σ X 2 = σ a+bx. σ ˆp. σ X +Y. σ X Y. σ X. σ Y. σ n.
 = P(A)P(B A) ( ) = P(A) + P(B) ( ) = 1 P( A) ( ) = P(A) P(B) σ X 2 = σ a+bx. σ ˆp. σ X +Y. σ X Y. σ X. σ Y. σ n.") ST 305: Exam 3 By hadig i this completed exam, I state that I have either give or received assistace from aother perso durig the exam period. I have used o resources other tha the exam itself ad the basic
ST 305: Exam 3 By hadig i this completed exam, I state that I have either give or received assistace from aother perso durig the exam period. I have used o resources other tha the exam itself ad the basic
10-716: Advanced Machine Learning Spring Lecture 13: March 5
 10-716: Advaced Machie Learig Sprig 019 Lecture 13: March 5 Lecturer: Pradeep Ravikumar Scribe: Charvi Ratogi, Hele Zhou, Nicholay opi Note: Lae template courtey of UC Berkeley EECS dept. Diclaimer: hee
Chapter 20. Comparing Two Proportions. BPS - 5th Ed. Chapter 20 1
 Chapter 0 Comparig Two Proportios BPS - 5th Ed. Chapter 0 Case Study Machie Reliability A study is performed to test of the reliability of products produced by two machies. Machie A produced 8 defective
- E < p. ˆ p q ˆ E = q ˆ = 1 - p ˆ = sample proportion of x failures in a sample size of n. where. x n sample proportion. population proportion
 1 Chapter 7 ad 8 Review for Exam Chapter 7 Estimates ad Sample Sizes 2 Defiitio Cofidece Iterval (or Iterval Estimate) a rage (or a iterval) of values used to estimate the true value of the populatio parameter
HYPOTHESIS TESTS FOR ONE POPULATION MEAN WORKSHEET MTH 1210, FALL 2018
 HYPOTHESIS TESTS FOR ONE POPULATION MEAN WORKSHEET MTH 1210, FALL 2018 We are resposible for 2 types of hypothesis tests that produce ifereces about the ukow populatio mea, µ, each of which has 3 possible
If Y is normally Distributed, then and 2 Y Y 10. σ σ
 ull Hypothei Significance Teting V. APS 50 Lecture ote. B. Dudek. ot for General Ditribution. Cla Member Uage Only. Chi-Square and F-Ditribution, and Diperion Tet Recall from Chapter 4 material on: ( )
t distribution [34] : used to test a mean against an hypothesized value (H 0 : µ = µ 0 ) or the difference
![t distribution [34] : used to test a mean against an hypothesized value (H 0 : µ = µ 0 ) or the difference](/thumbs/95/125833971.jpg "t distribution [34] : used to test a mean against an hypothesized value (H 0 : µ = µ 0 ) or the difference") EXST30 Backgroud material Page From the textbook The Statistical Sleuth Mea [0]: I your text the word mea deotes a populatio mea (µ) while the work average deotes a sample average ( ). Variace [0]: The
EXST30 Backgroud material Page From the textbook The Statistical Sleuth Mea [0]: I your text the word mea deotes a populatio mea (µ) while the work average deotes a sample average ( ). Variace [0]: The
Chem Exam 1-9/14/16. Frequency. Grade Average = 72, Median = 72, s = 20
 0 4 8 6 0 4 8 3 36 40 44 48 5 56 60 64 68 7 76 80 84 88 9 96 00 Chem 53 - Exam - 9/4/6 8 7 6 5 4 3 Frequecy 0 Grade Average = 7, Media = 7, = 0 Exam Chem 53 September 4, 065 Quetio, 7 poit each for quetio
GG313 GEOLOGICAL DATA ANALYSIS
 GG313 GEOLOGICAL DATA ANALYSIS 1 Testig Hypothesis GG313 GEOLOGICAL DATA ANALYSIS LECTURE NOTES PAUL WESSEL SECTION TESTING OF HYPOTHESES Much of statistics is cocered with testig hypothesis agaist data
Issues in Study Design
 Power ad Sample Size: Issues i Study Desig Joh McGready Departmet of Biostatistics, Bloomberg School Lecture Topics Re-visit cocept of statistical power Factors ifluecig power Sample size determiatio whe