Chapter 5-7 Errors, Random Errors, and Statistical Data in Chemical Analyses
|
|
|
- Laurel Helena Fletcher
- 5 years ago
- Views:
Transcription

1 Chapter 5-7 Errors, Random Errors, and Statistical Data in Chemical Analyses Impossible: The analytical results are free of errors or uncertainties. Possible: Minimize these errors and estimate their size with acceptable accuracy. Statistical calculations for use to judge the quality of experimental measurements are many. Error ( 偏差, 誤差 ): 1) The difference between a measured value and the true or known value. 2) the estimated uncertainty in a measurement or experiment
2 Figure 5-1 Results from six replicate determinations for iron in aqueous samples of a standard solution containing ppm of iron(iii). 3 3 Measurements are always accompanied by uncertainty. The true value always falls within a range due to uncertainty. The true value for any quantity is always unknown. The probable magnitude of the error can be evaluated. We can then defines the limit within which the true value of a measured quantity lies at a given level of probability. Data of unknown quality are worthless. (reliability of data) The true value of a measurement is never known exactly
3 Standards of known composition can be analyzed and the results compared with the known composition. Consult the literature. Calibrating equipment enhances the quality of data. Finally, statistical tests can be applied to the data. 3 5 Questions to answer before beginning an analysis: What is the maximum error that I can tolerate in the result? No one can afford to waste time generating data that are more reliable than is needed
4 Mean ( 均值 ), arithmetic mean, and average (x) are synonyms. (5-1) where x i represents the individual values of x making up a set of N replicate measurements. The symbol Σx i means to add all the values x i for the replicates. 3 7 The median ( 中值 ) is the middle result when replicate data are arranged in order of size. Equal numbers of results are larger and smaller than the median. For an odd number of data points, the median can be evaluated directly. For an even number, the mean of the middle pair is used
5 The mean of two or more measurements is their average value. The median is used advantageously when a set of data contains an outlier ( 離群值, 異常值 ), a result that differs significantly from others in the set. 3 9 Calculate the mean and the median for the data shown in Figure 5-1. Because the set contains an even number of measurements, the median is the average of the central pair:
6 Precision ( 精確度, 精密度 ) describes the reproducibility of measurements; the closeness of results to each other. Precision is determined by repeating the measurement on replicate samples. Three terms to describe the precision of a set of replicate data: standard deviation variance ( 2 ), and coefficient of variation (CV) Precision is a function of the deviation from the mean d i, or just the deviation, which is defined as (5-2) Precision is the closeness of results to others that have been obtained in exactly the same way

7 Accuracy ( 準確度 ) indicates the closeness of the measurement to its true or accepted value and is expressed by the error. Accuracy measures agreement between a result and its true value. Precision describes the agreement among several results that have been obtained in the same way Figure 5-2 Illustration of accuracy and precision using the pattern of darts on a dartboard
8 Absolute Error The absolute error E in the measurement of a quantity x i is given by the equation (5-3) where x t is the true, or accepted, value of the quantity. Note that we retain the sign in stating the error. Relative error Often, the relative error E r is a more useful quantity than the absolute error. The percent relative error is given by the expression (5-4) 3 15 Relative error Relative error is also expressed in parts per thousand (ppt). e.g
9 To determine accuracy, we have to know the true value, and this value is exactly what we are seeking in the analysis. Results can be precise without being accurate and accurate without being precise. The danger of assuming that precise results are also accurate is illustrated in Figure 5-3, which summarizes the results for the determination of nitrogen in two pure compounds: benzyl isothiourea hydrochloride ( 苄異硫脲鹽酸鹽 ) and nicotinic acid ( 菸鹼酸 ) NH S NH3 Cl O OH N benzyl isothiourea hydrochloride nicotinic acid Figure 5 3 Absolute error in the micro Kjeldahl determination of nitrogen ( 凱氏定氮法 ). Each dot represents the error associated with a single determination. Each vertical line labeled (x i x t ) is the absolute average deviation of the set from the true value. (Data from C. O. Willits and C. L. Ogg, J. Assoc. Anal. Chem., 1949, 32, 561. With permission.)
10 Figure 5-1 Results from six replicate determinations for iron in aqueous samples of a standard solution containing ppm of iron(iii) Figures 5-1 and 5-3 suggest that chemical analyses are affected by at least two types of errors. One type, called random (or indeterminate 不確定 ) error ( 隨機誤差 ), causes data to be scattered more or less symmetrically around a mean value. Refer to Figure 5-3: Notice that the scatter in the data, and thus the random error, for analysts 1 and 3 is significantly less than that for analysts 2 and
11 A second type of error, called systematic (or determinate) error ( 系統誤差 ), causes the mean of a set of data to differ from the true or accepted value. The results of analysts 1 and 2 in Figure 5-3 have little systematic error, but the data of analysts 3 and 4 show systematic errors of about 0.7 and 1.2% nitrogen Random (indeterminate) errors are errors that affect the precision of measurement. Systematic (determinate) errors affect the accuracy of results
12 A third type of error is gross error ( 過失誤差 ). Gross errors differ from indeterminate and determinate errors. They usually occur only occasionally, are often large, and may cause a result to be either high or low. Gross errors lead to outliers ( 離群值, 異常值 ), results that appear to differ markedly from all other data in a set of replicate measurements. (often the product of human errors) Various statistical tests can be done to determine if a data point is an outlier Systematic errors have a definite value, an assignable cause, and are of about the same magnitude for replicate measurements made in the same way. Systematic errors lead to bias ( 偏誤, 偏差 ) in measurement results. Note that bias affects all the data in a set in approximately the same way and that it bears a sign
13 Three types of systematic errors: (1) Instrument errors are caused by imperfections in measuring devices and instabilities in their components. (2) Method errors arise from non-ideal chemical or physical behavior of analytical systems. (3) Personal errors result from the carelessness, inattention, or personal limitations of the experimenter Instrument errors All measuring devices are sources of systematic errors. For example, pipets, burets, and volumetric flasks may hold or deliver volumes slightly different from those indicated by their graduations. These differences arise from using glassware at a temperature that differs significantly from the calibration temperature, from distortions in container walls due to heating while drying, from errors in the original calibration, or from contaminants or scratches on the inner surfaces of the containers. Calibration eliminates most systematic errors of this type
14 Instrument Errors Electronic instruments are subject to instrumental systematic errors. These uncertainties have many sources. For example, errors emerge as the voltage of a battery-operated power supply decreases with use. Instrument errors are detectable and correctable Method Errors The non-ideal chemical or physical behavior of the reagents and reactions upon which an analysis is based often introduce systematic method errors. Such sources of non-ideality include the slowness and incompleteness of reactions, the instability of species, non-specificity of most reagents, and possible interference
15 Method Errors In Figure 5-3, the results by analysts 3 and 4 show a negative bias that can be traced to the chemical nature of the sample, nicotinic acid. The compounds containing a pyridine ring are incompletely decomposed by the sulfuric acid; hence, the negative errors in Figure 5-3 are likely systematic errors from incomplete decomposition of the samples. Errors inherent in a method are often difficult to detect and are thus the most serious of the three types of systematic error NH S NH3 Cl O OH N benzyl isothiourea hydrochloride nicotinic acid Figure 3 3 Absolute error in the micro Kjeldahl determination of nitrogen ( 凱氏定氮法 ). Each dot represents the error associated with a single determination. Each vertical line labeled (x i x t ) is the absolute average deviation of the set from the true value. (Data from C. O. Willits and C. L. Ogg, J. Assoc. Anal. Chem., 1949, 32, 561. With permission.)
16 Kjeldahl method The Kjeldahl method or Kjeldahl digestion is a method for the quantitative determination of nitrogen in chemical substances. Degradation: Sample + H 2 SO 4 (NH 4 ) 2 SO 4 (aq) + CO 2 (g) + SO 2 (g) + H 2 O(g) Liberation of ammonia: (NH 4 ) 2 SO 4 (aq) + 2NaOH Na 2 SO 4 (aq) + 2H 2 O(l) + 2NH 3 (g) Capture of ammonia: B(OH) 3 + H 2 O + NH 3 NH 4+ + B(OH) 4 Back-titration: B(OH) 3 + H 2 O + Na 2 CO 3 NaHCO 3 (aq) + NaB(OH) 4 (aq) + CO 2 (g) + H 2 O NH S NH3 Cl O OH benzyl isothiourea hydrochloride N nicotinic acid 1-31 Personal Errors Measurements requiring personal judgments. Judgments of this type are often subject to systematic, unidirectional errors. An analyst who is insensitive to color changes tends to use excess reagent in a volumetric analysis. Physical disabilities are often sources of personal determinate errors. A universal source of personal error is prejudice
17 Personal Errors Number bias is another source of personal error that varies considerably from person to person. The most common number bias encountered in estimating the position of a needle on a scale involves a preference for the digits 0 and 5. Also prevalent is a prejudice favoring small digits over large and even numbers over odd. Color blindness amplifies personal errors in a volumetric analysis Systematic errors may be either constant or proportional. The magnitude of a constant error does not depend on the size of the quantity measured. Absolute error is constant, but relative error varies with sample size. (ex. solubility loss) Proportional errors increase or decrease in proportion to the size of the sample taken for analysis. Absolute error varies with sample size, but relative error stays constant. (interfering contaminants)
18 Systematic instrument errors are usually corrected by periodic calibration of equipment. The response of most instruments changes with time. Most personal errors can be minimized by care and selfdiscipline Bias ( 偏誤, 偏差 ) in an analytical method is particularly difficult to detect. One or more of the following steps can recognize and adjust for a systematic error in an analytical method
19 Analysis of Standard Samples Analyzing standard reference materials, SRM, is the best way to estimate the bias of an analytical method. The SRM Materials contain one or more analytes at wellknown or certified concentration levels. Standard materials can sometimes be prepared by synthesis. Standard reference material can be purchased from a number of governmental and industrial sources The concentration of one or more of the components in these materials has been determined in one of three ways: (1) by analysis with a previously validated reference method; (2) by analysis by two or more independent, reliable measurement methods; (3) by analysis by a network of cooperating laboratories that are technically competent and thoroughly knowledgeable with the material being tested
 3 39 Independent Analysis If standard samples are not available, a second independent and reliable analytical method can be used in parallel with the method being evaluated.")
20 Standard reference materials from NIST. (Photo courtesy of the National Institute of Standards and Technology.) 3 39 Independent Analysis If standard samples are not available, a second independent and reliable analytical method can be used in parallel with the method being evaluated. A statistical test must be used to determine whether any difference is a result of random errors in the two methods or due to bias in the method under study
21 Performing Blank Determinations Blank determinations are useful for detecting certain types of constant errors. In a blank determination, or blank, all steps of the analysis are performed in the absence of a sample. The results from the blank are then applied as a correction to the sample measurements. Blank determinations reveal errors and correct data. Variation in Sample Size Constant errors can often be detected by varying the sample size All measurements contain random errors. Random, or indeterminate, errors occur whenever a measurement is made. Caused by many small but uncontrollable variables. The errors are accumulative
22 Analysts 2 & 4: larger random error. Figure 6-1 A three-dimensional plot showing absolute error in Kjeldahl nitrogen determinations for four different analysts Imagine a situation in which just four small random errors combine to give an overall error. We will assume that each error has an equal probability of occurring and that each can cause the final result to be high or low by a fixed amount ±U. Table 6-1 shows all the possible ways the four errors can combine to give the indicated deviations from the mean value
 ten random uncertainties, and (c) a very large number of random")
23 3 45 Figure 6-2 Frequency distribution for measurements containing (a) four random uncertainties, (b) ten random uncertainties, and (c) a very large number of random uncertainties
 or a normal error curve ( 正態誤差曲線 ).")
24 (c) For a very large number of individual errors, a bell-shaped curve like that shown in Figure 6-2c results. Such a plot is called a Gaussian curve ( 高斯曲線 ) or a normal error curve ( 正態誤差曲線 )

25 This ml spread of data, from a low of ml to a high of ml, results directly from an accumulation of all the random uncertainties in the experiment. Rearrange Table 6-2 into frequency distribution groups, as in Table % of the data reside in the cell containing the mean and median value of ml and that more than half the results are within ± ml of this mean
. As the number of measurements increases, the histogram approaches the shape of the continuous curve shown as plot B in")
 showing distribution of the 50 results in Table 6-3 and a Gaussian curve (B) for data having")
26 The frequency distribution data in Table 6-3 are plotted as a bar graph ( 條形圖 ), or histogram ( 直方圖 )(labeled A in Figure 6-5). As the number of measurements increases, the histogram approaches the shape of the continuous curve shown as plot B in Figure 6-5 (a Gaussian curve, or normal error curve) Figure 6-3 A histogram (A) showing distribution of the 50 results in Table 6-3 and a Gaussian curve (B) for data having the same mean and standard deviation as the data in the histogram
27 Many small and uncontrollable variables affect even the simple process of calibrating a pipet. The cumulative effect of random uncertainties is responsible for the scatter of data points around the mean. Statistics only reveal information that is already present in a data set (1) visual judgments, such as the level of the water with respect to the marking on the pipet and the mercury level in the thermometer (2) variations in the drainage time and in the angle of the pipet as it drains (3) temperature fluctuations, which affect the volume of the pipet, the viscosity of the liquid, and the performance of the balance (4) vibrations and drafts that cause small variations in the balance readings
28 The random, or indeterminate, errors in the results of an analysis can be evaluated by the methods of statistics. Ordinarily, statistical analysis of analytical data is based on the assumption that random errors follow a Gaussian, or normal, distribution. Sometimes analytical data depart seriously from Gaussian behavior, but the normal distribution is the most common. We base this discussion entirely on normally distributed random errors In statistics, a finite number of experimental observations is called a sample of data ( 數據樣本 ); this is different from the term used in chemical analysis. A population ( 母體 ) (or a universe): the collection of all measurements of interest to the experimenter [finite and real, or conceptual and infinite]. A sample is a subset of measurements selected from the population. Statistical laws must be modified when applied to a small sample because a few data points may not be representative of the population
29 Figure 6-4a shows two Gaussian curves in which the relative frequency y of occurrence of various deviations from the mean is plotted as a function of the deviation from the mean. The equation for a Gaussian curve has the form The equation contains just two parameters, the population mean μ and the population standard deviation σ Figure 6-4 Normal error curves. The standard deviation for curve B is twice that for curve A; that is, σ B = 2σ A. (a) The abscissa is the deviation from the mean in the units of measurement

30 (b) The abscissa is the deviation from the mean in units of σ. Thus, the two curves A and B are identical here The Population Mean μ and the Sample Mean x Sample mean = when N is small x, where Population mean = μ, where when N The difference between x and μ decreases rapidly as N reaches over 20 to 30. In the absence of systematic error, the population mean ( ) is also the true value (x t ) for the measured quantity
31 The Population Standard Deviation (σ) σ is a measure of the precision or scatter of a population of data, which is given by the equation (6-1) where N is the number of data points making up the population The Population Standard Deviation (σ) The two curves in Figure 6-4a are for two populations of data that differ only in their standard deviations. The standard deviation for the data set yielding the broader but lower curve B is twice that for the measurements yielding curve A. The precision of the data leading to curve A is twice as good as that of the data that are represented by curve B
32 The Population Standard Deviation (σ) Figure 6-4b shows another type of normal error curve in which the abscissa is now a new variable z, which is defined as (6 2) z is the deviation of a data point from the mean relative to one standard deviation. That is, when x μ = σ, z is equal to one; when x μ = 2σ, z is equal to two. y 2/2 x ) 2 e ( 2 /2 2 e z The Population Standard Deviation (σ) A plot of relative frequency versus this parameter (z) yields a single Gaussian curve that describes all populations of data regardless of standard deviation
 The mean occurs at the central point of maximum frequency, (2) there is a symmetrical distribution of positive and negative deviations about")
33 The Population Standard Deviation (σ) Variance ( 變異數 ): The square of the standard deviation σ 2. A normal error curve has several general properties: (1) The mean occurs at the central point of maximum frequency, (2) there is a symmetrical distribution of positive and negative deviations about the maximum, (3) there is an exponential decrease in frequency as the magnitude of the deviations increases. Small random uncertainties are more common Areas under a Gaussian Curve Regardless of its width, 68.3% of the data making up the population will lie within the bounds bracketed by ±1σ. Approximately 95.4% of all data points are within ±2σ of the mean and 99.7% within ±3σ. Because of such area relationships, the standard deviation of a population of data is a useful predictive tool. (p. 101)
34 Equation 6-1 must be modified for a small sample of data. Thus, the sample standard deviation s is given by the equation (6 4) The quantity N - 1 is called the number of degrees of freedom (the number of independent results that enter into the computation of the s). Population standard deviation: 3 67 An Alternative Expression for Sample Standard Deviation (6 5)
35 The following results were obtained in the replicate determination of the lead content of a blood sample: 0.752, 0.756, 0.752, 0.751, and ppm Pb. Calculate the mean and the standard deviation of this set of data. To apply Equation 6-5, we calculate 2 xi and 2 ( )/ N xi 3 69 Substituting into Equation 6-5 leads to
36 Note in Example 6-1 that the difference between Σx 2 i and (Σx i ) 2 /N is very small. If we had rounded these numbers before subtracting them, a serious error would have appeared in the computed value of s. To avoid this source of error, never round a standard deviation calculation until the very end Standard Error of the Mean For replicate samples, each containing N measurements, are taken randomly from a population of data, the mean of each set will show less and less scatter as N increases. The standard deviation of each mean is known as the standard error of the mean (SEM, 平均值標準誤差 ) and is given the symbol s m. (6 6)
37 The rapid improvement in the reliability of s with increases in N makes it feasible to obtain a good approximation of σ when the method of measurement is not excessively time consuming and when an adequate supply of sample is available. When N is greater than about 20, s and can be assumed to be identical Pooled data ( 合併數據, 綜合數據 ) from a series of similar samples accumulated over time provide an estimate of s that is superior to the value for any individual subset. Assume the same sources of random error in all the measurements. To obtain a pooled estimate of the standard deviation, s pooled, deviations from the mean for each subset are squared; the squares of all subsets are then summed and divided by an appropriate number of degrees of freedom


38 The equation for computing a pooled standard deviation from several sets of data takes the form where N 1 is the number of results in set 1, N 2 is the number in set 2, and so forth. The term N t is the number of data sets that are pooled
 is (6 8) People who do scientific work tend to use standard deviation rather than variance as a measure of")
39 3 77 Other than sample standard deviation, three other terms are often employ in reporting the precision. 1. The variance (s 2 ) is (6 8) People who do scientific work tend to use standard deviation rather than variance as a measure of precision
40 2. Relative standard deviation: RSD s r s x s RSDinppt 1000 ppt x 3. Coefficient of variation (CV) CV RSDinpercent s 100% x (6-9) 3 79 Spread or Range (w) Another term to describe the precision of a set of replicate results. It is the difference between the largest value in the set and the smallest. Example: The spread of the data is ( ) = 0.9 ppm Fe. Figure 3-1 Results from six replicate determinations for iron in aqueous samples of a standard solution containing ppm of iron(iii)
 the coefficient of variation, and (d) the spread.")
41 For the set of data in Example 6-3, calculate (a) the variance, (b) the relative standard deviation in parts per thousand, (c) the coefficient of variation, and (d) the spread
42 Consider the summation Absolute standard deviations 3 83 The summation could be as large as = +0.10, or as small as = -0.10, or any value lies between these two extremes, or even = 0, = 0 The variance of a sum or difference is equal to the sum of the individual variances. If y = a + b c For the computation The variance of y, s y2 is given by s y = ± ±

43 3 85 As shown in Table 6-4, the relative standard deviation of a product or quotient is determined by the relative standard deviations of the numbers forming the computed result
44 Applying this equation to the numerical example gives we can write the answer and its uncertainty as (±0.0003) One of the best ways of indicating reliability ( 信度 ) is to give a confidence interval at the 90% or 95% confidence level. Another method is to report the absolute standard deviation or the coefficient of variation (CV) of the data. A less satisfactory but more common indicator of the quality of data is the significant figure ( 有效數字 ) convention. 信度 (reliability) 是指測量結果的一致性 穩定性及可靠性
45 A simple way of indicating the probable uncertainty associated with an experimental measurement is to round the result so that it contains only significant figures ( 有效數字 ). The significant figures in a number are all the certain digits plus the first uncertain digit. A zero may or may not be significant depending on its location in a number. A zero that is surrounded by other digits is always significant (such as in ml). Zeros that only locate the decimal point for us are not Sums and Differences For addition and subtraction, the number of significant figures can be found by visual inspection. the second and third decimal places in the answer cannot be significant because 3.4 is uncertain in the first decimal place
46 Products and Quotients A rule of thumb sometimes suggested for multiplication and division is that the answer should be rounded so that it contains the same number of significant digits as the original number with the smallest number of significant digits. Ex The first answer would be rounded to 1.1 and the second to If we assume a unit uncertainty in the last digit of each number in the first quotient, however, the relative uncertainties associated with each of these numbers are 1/24, 1/452, and 1/
47 Because the first relative uncertainty is much larger than the other two, the relative uncertainty in the result is also the absolute uncertainty is then Therefore, the first result should be rounded to three significant figures or 1.08, but the second should be rounded to only two; that is Logarithms and Antilogarithms 1. In a logarithm of a number, keep as many digits to the right of the decimal point as there are significant figures in the original number. 2. In an antilogarithm of a number, keep as many digits as there are digits to the right of the decimal point in the original number
48 Round the following answers so that only significant digits are retained: (a) log = and (b) antilog 12.5 = (a) Following rule 1, we retain 4 digits to the right of the decimal point (b) Following rule 2, we may retain only 1 digit 3 95 A good guide to follow when rounding a 5 is always to round to the nearest even number. For example, rounds to 0.64 and rounds to We should note that it is seldom justifiable to keep more than one significant figure in the standard deviation because the standard deviation contains error as well
49 The uncertainty of the result is estimated using the techniques presented in Section 3E. Finally, the result is rounded so that it contains only significant digits. It is especially important to postpone rounding until the calculation is completed. At least one extra digit beyond the significant digits should be carried through all the computations to avoid a rounding error. This extra digit is sometimes called a guard digit Defining a numerical interval around the mean (x) of a set of replicate results within which the population mean ( ) can be expected to lie with a certain probability. This interval is called the confidence interval. 2. Determining the number of replicate measurements required to ensure at a given probability that an experimental mean falls within a certain confidence interval. 3. Using the least-squares method for constructing calibration curves
 is the numerical magnitude of the confidence limit.")
/ For a single measurement: CI for = x ± z For the mean of N measurements: CI for = x ± (z / N) 3 99 Confidence")
50 Confidence limits (CL, 信賴界限 ): define a numerical interval around a determined mean (x) that contains μ with a certain probability. A confidence interval (CI: 信賴區間 ) is the numerical magnitude of the confidence limit. The confidence level ( 信心水準 ) fixes the odds that the true mean ( ) will be within the defined limits. z = (x - )/ For a single measurement: CI for = x ± z For the mean of N measurements: CI for = x ± (z / N) 3 99 Confidence Interval (CI) CI for = x ± (z / N)

51 z = (x - )/ Table 3-6 CI for = x ± (ts/ N) A statistical technique called regression analysis provides the means for objectively obtaining such a line and also for specifying the uncertainties associated with its subsequent use. 迴歸分析 (Regression Analysis) 是一種統計學上分析數據的方法, 目的在於了解兩個或多個變數間是否相關 相關方向與強度, 並建立數學模型以便觀察特定變數來預測研究者感興趣的變數
52 Figure 8-9 Calibration curve of absorbance versus analyte concentration for a series of standards the method of least squares is used to generate a calibration curve (working curve), two assumptions are required. The first is that there is actually a linear relationship between the measured variable (y) and the analyte concentration (x). The mathematical relationship that describes this assumption is called the regression model, which may be represented as where b is the y intercept (the value of y when x is zero) and m is the slope of the line
53 The second assumption: any deviation of the individual points from the straight line arises from error in the measurement. That is: no error in x values of the points (concentration). The least-squares method finds the sum of the squares of the residuals SS resid and minimizes the sum using calculus. SS resid N 2 yi ( b mxi ) i the vertical deviation of each point from the straight line is called a residual ( 殘差 ). (8-10) (8-11) (8-12)
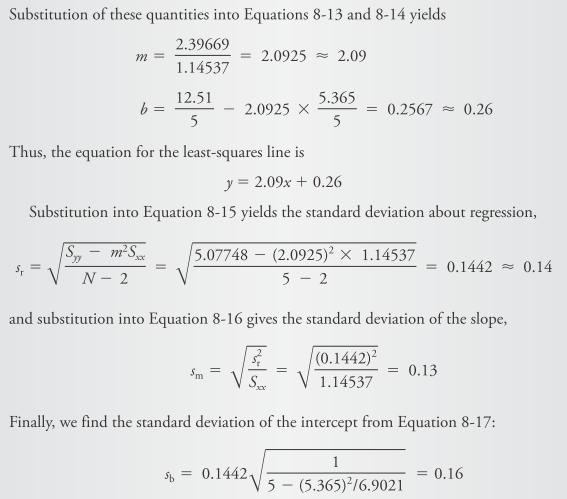
54 1. The slope of the line m: (8-13) 2. The intercept b: (8-14) 3. The standard deviation about regression s r : (3-24) (8-15) The standard deviation of the slope s m : (8-16) 5. The standard deviation of the intercept s b : (8-17) 6. The standard deviation for results obtained from the calibration curve s c : y c : mean of a set of M replicate analysis. y: mean for the N calibration points (8-18)


55 The standard deviation about regression s r (Equation 8-15) is the standard deviation for y when the deviations are measured not from the mean of y (as is usually the case) but from the straight line that results from the least-squares analysis: The standard deviation about regression is often called the standard error of the estimate or the standard error in y
56 56
Source: Chapter 5: Errors in Chemical Analyses
 Source: Chapter 5: Errors in Chemical Analyses Measurements invariably involve errors and uncertainties. it is impossible to perform a chemical analysis that is totally free of errors or uncertainties
Harris: Quantitative Chemical Analysis, Eight Edition CHAPTER 03: EXPERIMENTAL ERROR
 Harris: Quantitative Chemical Analysis, Eight Edition CHAPTER 03: EXPERIMENTAL ERROR Chapter 3. Experimental Error -There is error associated with every measurement. -There is no way to measure the true
Linear Regression. Applied Linear Regression Models (Kutner, Nachtsheim, Neter, Li) hsuhl (NUK) SDA Regression 1 / 34
 hsuhl (NUK) SDA Regression 1 / 34") Linear Regression 許湘伶 Applied Linear Regression Models (Kutner, Nachtsheim, Neter, Li) hsuhl (NUK) SDA Regression 1 / 34 Regression analysis is a statistical methodology that utilizes the relation between
Linear Regression 許湘伶 Applied Linear Regression Models (Kutner, Nachtsheim, Neter, Li) hsuhl (NUK) SDA Regression 1 / 34 Regression analysis is a statistical methodology that utilizes the relation between
Harris: Quantitative Chemical Analysis, Eight Edition CHAPTER 03: EXPERIMENTAL ERROR
 Harris: Quantitative Chemical Analysis, Eight Edition CHAPTER 03: EXPERIMENTAL ERROR Chapter 3. Experimental Error -There is error associated with every measurement. -There is no way to measure the true
Chapter 1 Linear Regression with One Predictor Variable
 Chapter 1 Linear Regression with One Predictor Variable 許湘伶 Applied Linear Regression Models (Kutner, Nachtsheim, Neter, Li) hsuhl (NUK) LR Chap 1 1 / 41 Regression analysis is a statistical methodology
Statistics: Error (Chpt. 5)
") Statistics: Error (Chpt. 5) Always some amount of error in every analysis (How much can you tolerate?) We examine error in our measurements to know reliably that a given amount of analyte is in the sample
Statistics: Error (Chpt. 5) Always some amount of error in every analysis (How much can you tolerate?) We examine error in our measurements to know reliably that a given amount of analyte is in the sample
03.1 Experimental Error
 03.1 Experimental Error Problems: 15, 18, 20 Dr. Fred Omega Garces Chemistry 251 Miramar College 1 Making a measurement In general, the uncertainty of a measurement is determined by the precision of the
生物統計教育訓練 - 課程. Introduction to equivalence, superior, inferior studies in RCT 謝宗成副教授慈濟大學醫學科學研究所. TEL: ext 2015
 生物統計教育訓練 - 課程 Introduction to equivalence, superior, inferior studies in RCT 謝宗成副教授慈濟大學醫學科學研究所 tchsieh@mail.tcu.edu.tw TEL: 03-8565301 ext 2015 1 Randomized controlled trial Two arms trial Test treatment
Chapter 5. Errors in Chemical Analysis 熊同銘.
 Chapter 5 Errors in Chemical Analysis 熊同銘 tmhsiung@gmail.com http://www.chem.ntou.edu.tw/ Slide 1 of 19 Contents in Chapter 5 5.1 Accuracy, Precision and Bias 5.2 Types of Errors in Experimental Data 5.3
Statistical Intervals and the Applications. Hsiuying Wang Institute of Statistics National Chiao Tung University Hsinchu, Taiwan
 and the Applications Institute of Statistics National Chiao Tung University Hsinchu, Taiwan 1. Confidence Interval (CI) 2. Tolerance Interval (TI) 3. Prediction Interval (PI) Example A manufacturer wanted
Chem 321 Lecture 4 - Experimental Errors and Statistics 9/5/13
 Chem 321 Lecture 4 - Experimental Errors and Statistics 9/5/13 Student Learning Objectives Experimental Errors and Statistics The tolerances noted for volumetric glassware represent the accuracy associated
Topic 2 Measurement and Calculations in Chemistry
 Topic Measurement and Calculations in Chemistry Nature of Measurement Quantitative observation consisting of two parts. number scale (unit) Examples 0 grams 6.63 10 34 joule seconds The Fundamental SI
= lim(x + 1) lim x 1 x 1 (x 2 + 1) 2 (for the latter let y = x2 + 1) lim
 lim x 1 x 1 (x 2 + 1) 2 (for the latter let y = x2 + 1) lim") 1061 微乙 01-05 班期中考解答和評分標準 1. (10%) (x + 1)( (a) 求 x+1 9). x 1 x 1 tan (π(x )) (b) 求. x (x ) x (a) (5 points) Method without L Hospital rule: (x + 1)( x+1 9) = (x + 1) x+1 x 1 x 1 x 1 x 1 (x + 1) (for the
1061 微乙 01-05 班期中考解答和評分標準 1. (10%) (x + 1)( (a) 求 x+1 9). x 1 x 1 tan (π(x )) (b) 求. x (x ) x (a) (5 points) Method without L Hospital rule: (x + 1)( x+1 9) = (x + 1) x+1 x 1 x 1 x 1 x 1 (x + 1) (for the
Chapter 22 Lecture. Essential University Physics Richard Wolfson 2 nd Edition. Electric Potential 電位 Pearson Education, Inc.
 Chapter 22 Lecture Essential University Physics Richard Wolfson 2 nd Edition Electric Potential 電位 Slide 22-1 In this lecture you ll learn 簡介 The concept of electric potential difference 電位差 Including
國立中正大學八十一學年度應用數學研究所 碩士班研究生招生考試試題
 國立中正大學八十一學年度應用數學研究所 碩士班研究生招生考試試題 基礎數學 I.(2%) Test for convergence or divergence of the following infinite series cos( π (a) ) sin( π n (b) ) n n=1 n n=1 n 1 1 (c) (p > 1) (d) n=2 n(log n) p n,m=1 n 2 +
相關分析. Scatter Diagram. Ch 13 線性迴歸與相關分析. Correlation Analysis. Correlation Analysis. Linear Regression And Correlation Analysis
 Ch 3 線性迴歸與相關分析 相關分析 Lear Regresso Ad Correlato Aalyss Correlato Aalyss Correlato Aalyss Correlato Aalyss s the study of the relatoshp betwee two varables. Scatter Dagram A Scatter Dagram s a chart that
Chapter 1 Linear Regression with One Predictor Variable
 Chapter 1 Linear Regression with One Predictor Variable 許湘伶 Applied Linear Regression Models (Kutner, Nachtsheim, Neter, Li) hsuhl (NUK) LR Chap 1 1 / 52 迴歸分析 Regression analysis is a statistical methodology
Data Analysis I. CU- Boulder CHEM-4181 Instrumental Analysis Laboratory. Prof. Jose-Luis Jimenez Spring 2007
 Data Analysis I CU- Boulder CHEM-4181 Instrumental Analysis Laboratory Prof. Jose-Luis Jimenez Spring 2007 Presentation will be posted on course web page based on lab manual, Skoog, web links 5 Objective
Numbers and Fundamental Arithmetic
 1 Numbers and Fundamental Arithmetic Hey! Let s order some pizzas for a party! How many pizzas should we order? There will be 1 people in the party. Each people will enjoy 3 slices of pizza. Each pizza
ADVANCED ANALYTICAL LAB TECH (Lecture) CHM
 CHM") ADVANCED ANALYTICAL LAB TECH (Lecture) CHM 4130-0001 Spring 2013 Professor Andres D. Campiglia Textbook: Principles of Instrumental Analysis Skoog, Holler and Crouch, 5 th Edition, 6 th Edition or newest
ADVANCED ANALYTICAL LAB TECH (Lecture) CHM 4130-0001 Spring 2013 Professor Andres D. Campiglia Textbook: Principles of Instrumental Analysis Skoog, Holler and Crouch, 5 th Edition, 6 th Edition or newest
Chapter 20 Cell Division Summary
 Chapter 20 Cell Division Summary Bk3 Ch20 Cell Division/1 Table 1: The concept of cell (Section 20.1) A repeated process in which a cell divides many times to make new cells Cell Responsible for growth,
Assessing and Presenting Experimental Data
 Assessing and Presenting Eperimental Data Common Types of error Uncertainty and Precision Uncertainty Theory Based on the Population Theory Based on the Sample Introduction How good are the data? Actual
Why the fuss about measurements and precision?
 Introduction In this tutorial you will learn the definitions, rules and techniques needed to record measurements in the laboratory to the proper precision (significant figures). You should also develop
Source slideplayer.com/fundamentals of Analytical Chemistry, F.J. Holler, S.R.Crouch. Chapter 6: Random Errors in Chemical Analysis
 Source lideplayer.com/fundamental of Analytical Chemitry, F.J. Holler, S.R.Crouch Chapter 6: Random Error in Chemical Analyi Random error are preent in every meaurement no matter how careful the experimenter.
Ch 3. EXPERIMENTAL ERROR
 Ch 3. EXPERIMENTAL ERROR 3.1 Measurement data how accurate? TRUE VALUE? No way to obtain the only way is approaching toward the true value. (how reliable?) How ACCURATE How REPRODUCIBLE accuracy precision
期中考前回顧 助教 : 王珊彗. Copyright 2009 Cengage Learning
 期中考前回顧 助教 : 王珊彗 考前提醒 考試時間 :11/17( 四 )9:10~12:10 考試地點 : 管二 104 ( 上課教室 ) 考試範圍 :C1-C9, 選擇 + 計算 注意事項 : 考試請務必帶工程計算機 可帶 A4 參考紙 ( 單面 不能浮貼 ) 計算過程到第四位, 結果寫到小數點第二位 不接受沒有公式, 也不接受沒算出最後答案 考試只會附上 standard normal distribution
Lecture 3. - all digits that are certain plus one which contains some uncertainty are said to be significant figures
 Lecture 3 SIGNIFICANT FIGURES e.g. - all digits that are certain plus one which contains some uncertainty are said to be significant figures 10.07 ml 0.1007 L 4 significant figures 0.10070 L 5 significant
Ch.9 Liquids and Solids
 Ch.9 Liquids and Solids 9.1. Liquid-Vapor Equilibrium 1. Vapor Pressure. Vapor Pressure versus Temperature 3. Boiling Temperature. Critical Temperature and Pressure 9.. Phase Diagram 1. Sublimation. Melting
Chapter 13. Titrations in Analytical Chemistry
 Chapter 13 Titrations in Analytical Chemistry Titrations are based on a reaction between the analyte ( 分析物 ) and a standard reagent known as titrant ( 滴定液 ). 1 Titration methods (titrimetric methods) are
1 Measurement Uncertainties
 1 Measurement Uncertainties (Adapted stolen, really from work by Amin Jaziri) 1.1 Introduction No measurement can be perfectly certain. No measuring device is infinitely sensitive or infinitely precise.
統計學 ( 一 ) 第七章信賴區間估計 (Estimation Using Confidence Intervals) 授課教師 : 唐麗英教授 國立交通大學工業工程與管理學系聯絡電話 :(03)
 第七章信賴區間估計 (Estimation Using Confidence Intervals) 授課教師 : 唐麗英教授 國立交通大學工業工程與管理學系聯絡電話 :(03)") 統計學 ( 一 ) 第七章信賴區間估計 (Estimation Using Confidence Intervals) 授課教師 : 唐麗英教授 國立交通大學工業工程與管理學系聯絡電話 :(03)573896 e-mail:litong@cc.nctu.edu.tw 03 本講義未經同意請勿自行翻印 本課程內容參考書目 教科書 Mendenhall, W., & Sincich, T. (007).
統計學 ( 一 ) 第七章信賴區間估計 (Estimation Using Confidence Intervals) 授課教師 : 唐麗英教授 國立交通大學工業工程與管理學系聯絡電話 :(03)573896 e-mail:litong@cc.nctu.edu.tw 03 本講義未經同意請勿自行翻印 本課程內容參考書目 教科書 Mendenhall, W., & Sincich, T. (007).
Measurements and Data Analysis
 Measurements and Data Analysis 1 Introduction The central point in experimental physical science is the measurement of physical quantities. Experience has shown that all measurements, no matter how carefully
-However, this definition can be expanded to include: biology (biometrics), environmental science (environmetrics), economics (econometrics).
, environmental science (environmetrics), economics (econometrics).") Chemometrics Application of mathematical, statistical, graphical or symbolic methods to maximize chemical information. -However, this definition can be expanded to include: biology (biometrics), environmental
Chemometrics Application of mathematical, statistical, graphical or symbolic methods to maximize chemical information. -However, this definition can be expanded to include: biology (biometrics), environmental
Basic Statistics. 1. Gross error analyst makes a gross mistake (misread balance or entered wrong value into calculation).
.") Basic Statistics There are three types of error: 1. Gross error analyst makes a gross mistake (misread balance or entered wrong value into calculation). 2. Systematic error - always too high or too low
Basic Statistics There are three types of error: 1. Gross error analyst makes a gross mistake (misread balance or entered wrong value into calculation). 2. Systematic error - always too high or too low
ANALYTICAL CHEMISTRY 1 LECTURE NOTES
 ANALYTICAL CHEMISTRY 1 LECTURE NOTES FUNDAMENTALS OF PRE ANALYSES TOPIC 1: Theory of Errors 1.0 Introduction Analytical chemistry is a specialised aspect of chemistry that deals with both qualitative analysis
Uncertainty, Error, and Precision in Quantitative Measurements an Introduction 4.4 cm Experimental error
 Uncertainty, Error, and Precision in Quantitative Measurements an Introduction Much of the work in any chemistry laboratory involves the measurement of numerical quantities. A quantitative measurement
MEASUREMENT AND STATISTICAL TREATMENT OF EMPERICAL DATA
 MEASUREMENT AND STATISTICAL TREATMENT OF EMPERICAL DATA PRECISION, ACCURACY, and ERROR. Precision refers to the variability among replicate measurements of the same quantity. Consider three determinations
Error Analysis. Table 1. Tolerances of Class A Pipets and Volumetric Flasks
 Error Analysis Significant Figures in Calculations Most lab report must have an error analysis. For many experiments, significant figure rules are sufficient. Remember to carry at least one extra significant
0 0 = 1 0 = 0 1 = = 1 1 = 0 0 = 1
 0 0 = 1 0 = 0 1 = 0 1 1 = 1 1 = 0 0 = 1 : = {0, 1} : 3 (,, ) = + (,, ) = + + (, ) = + (,,, ) = ( + )( + ) + ( + )( + ) + = + = = + + = + = ( + ) + = + ( + ) () = () ( + ) = + + = ( + )( + ) + = = + 0
Measurements Chapter 3
 Measurements Chapter 3 Analytical Chemistry is the science of chemical measurement. Its object is the generation, treatment and evaluation of signals from which information is obtained on the composition
1 dx (5%) andˆ x dx converges. x2 +1 a
 andˆ x dx converges. x2 +1 a") 微甲 - 班期末考解答和評分標準. (%) (a) (7%) Find the indefinite integrals of secθ dθ.) d (5%) and + d (%). (You may use the integral formula + (b) (%) Find the value of the constant a for which the improper integral
微甲 - 班期末考解答和評分標準. (%) (a) (7%) Find the indefinite integrals of secθ dθ.) d (5%) and + d (%). (You may use the integral formula + (b) (%) Find the value of the constant a for which the improper integral
Chapter 8 Lecture. Essential University Physics Richard Wolfson 2 nd Edition. Gravity 重力 Pearson Education, Inc. Slide 8-1
 Chapter 8 Lecture Essential University Physics Richard Wolfson 2 nd Edition Gravity 重力 Slide 8-1 In this lecture you ll learn 簡介 Newton s law of universal gravitation 萬有引力 About motion in circular and
Experiment 1 - Mass, Volume and Graphing
 Experiment 1 - Mass, Volume and Graphing In chemistry, as in many other sciences, a major part of the laboratory experience involves taking measurements and then calculating quantities from the results
Chapter 3 Experimental Error
 Chapter 3 Experimental Error Homework Due Friday January 27 Problems: 3-2, 3-5, 3-9, 3-10, 3-11, 3-12, 3-14, 3-19 Chapter 3 Experimental Error Uncertainties They are everywhere!! We need to learn to understand
Candidates Performance in Paper I (Q1-4, )
") HKDSE 2016 Candidates Performance in Paper I (Q1-4, 10-14 ) 7, 17 November 2016 General Comments General and Common Weaknesses Weak in calculations Unable to give the appropriate units for numerical answers
HKDSE 2016 Candidates Performance in Paper I (Q1-4, 10-14 ) 7, 17 November 2016 General Comments General and Common Weaknesses Weak in calculations Unable to give the appropriate units for numerical answers
台灣大學開放式課程 有機化學乙 蔡蘊明教授 本著作除另有註明, 作者皆為蔡蘊明教授, 所有內容皆採用創用 CC 姓名標示 - 非商業使用 - 相同方式分享 3.0 台灣授權條款釋出
 台灣大學開放式課程 有機化學乙 蔡蘊明教授 本著作除另有註明, 作者皆為蔡蘊明教授, 所有內容皆採用創用 姓名標示 - 非商業使用 - 相同方式分享 3.0 台灣授權條款釋出 hapter S Stereochemistry ( 立體化學 ): chiral molecules ( 掌性分子 ) Isomerism constitutional isomers butane isobutane 分子式相同但鍵結方式不同
CHEM 334 Quantitative Analysis Laboratory
 Calibration of Volumetric Glassware Introduction Volumetric glassware is a class of glass vessels that are calibrated to contain or deliver certain volumes of substances. Graduated cylinders, pipettes
EXPERIMENT 30A1: MEASUREMENTS. Learning Outcomes. Introduction. Experimental Value - True Value. 100 True Value
 1 Learning Outcomes EXPERIMENT 30A1: MEASUREMENTS Upon completion of this lab, the student will be able to: 1) Use various common laboratory measurement tools such as graduated cylinders, volumetric flask,
CHAPTER6 LINEAR REGRESSION
 CHAPTER6 LINEAR REGRESSION YI-TING HWANG DEPARTMENT OF STATISTICS NATIONAL TAIPEI UNIVERSITY EXAMPLE 1 Suppose that a real-estate developer is interested in determining the relationship between family
Chemistry II Midterm Exam 20 April, 2012
 Chemistry II Midterm Exam 0 April, 01 Constants R = 8.314 J/mol K = 0.08314 L bar/k mol = 0.081 L atm/k mol = 8.314 L kpa/k mol 1 bar = 750.06 torr = 0.9869 atm F = 9.6485 10 4 C/mol 1. A 0.5-g sample
Measurements, Sig Figs and Graphing
 Measurements, Sig Figs and Graphing Chem 1A Laboratory #1 Chemists as Control Freaks Precision: How close together Accuracy: How close to the true value Accurate Measurements g Knowledge Knowledge g Power
Candidates Performance in Paper I (Q1-4, )
") HKDSE 2018 Candidates Performance in Paper I (Q1-4, 10-14 ) 8, 9 November 2018 General and Common Weaknesses Weak in calculations Weak in conversion of units in calculations (e.g. cm 3 to dm 3 ) Weak in
HKDSE 2018 Candidates Performance in Paper I (Q1-4, 10-14 ) 8, 9 November 2018 General and Common Weaknesses Weak in calculations Weak in conversion of units in calculations (e.g. cm 3 to dm 3 ) Weak in
HKDSE Chemistry Paper 2 Q.1 & Q.3
 HKDSE 2017 Chemistry Paper 2 Q.1 & Q.3 Focus areas Basic chemical knowledge Question requirement Experimental work Calculations Others Basic Chemical Knowledge Question 1(a)(i) (1) Chemical equation for
Experimental Uncertainty (Error) and Data Analysis
 and Data Analysis") Experimental Uncertainty (Error) and Data Analysis Advance Study Assignment Please contact Dr. Reuven at yreuven@mhrd.org if you have any questions Read the Theory part of the experiment (pages 2-14) and
Experimental Uncertainty (Error) and Data Analysis Advance Study Assignment Please contact Dr. Reuven at yreuven@mhrd.org if you have any questions Read the Theory part of the experiment (pages 2-14) and
Statistical Analysis of Chemical Data Chapter 4
 Statistical Analysis of Chemical Data Chapter 4 Random errors arise from limitations on our ability to make physical measurements and on natural fluctuations Random errors arise from limitations on our
Advanced Engineering Mathematics 長榮大學科工系 105 級
 工程數學 Advanced Engineering Mathematics 長榮大學科工系 5 級 姓名 : 學號 : 工程數學 I 目錄 Part I: Ordinary Differential Equations (ODE / 常微分方程式 ) Chapter First-Order Differential Equations ( 一階 ODE) 3 Chapter Second-Order
Chapter 9 Time-Weighted Control Charts. Statistical Quality Control (D. C. Montgomery)
") Chapter 9 Time-Weighted Control Charts 許湘伶 Statistical Quality Control (D. C. Montgomery) Introduction I Shewhart control chart: Chap. 5 7: basic SPC methods Useful in phase I implementation( 完成 ) of SPC
Chapter 9 Time-Weighted Control Charts 許湘伶 Statistical Quality Control (D. C. Montgomery) Introduction I Shewhart control chart: Chap. 5 7: basic SPC methods Useful in phase I implementation( 完成 ) of SPC
Chapter 13 Introduction to Nonlinear Regression( 非線性迴歸 )
") Chapter 13 Introduction to Nonlinear Regression( 非線性迴歸 ) and Neural Networks( 類神經網路 ) 許湘伶 Applied Linear Regression Models (Kutner, Nachtsheim, Neter, Li) hsuhl (NUK) LR Chap 10 1 / 35 13 Examples of nonlinear
Chapter 13 Introduction to Nonlinear Regression( 非線性迴歸 ) and Neural Networks( 類神經網路 ) 許湘伶 Applied Linear Regression Models (Kutner, Nachtsheim, Neter, Li) hsuhl (NUK) LR Chap 10 1 / 35 13 Examples of nonlinear
NaOH (aq) + HCl (aq) NaCl (aq) + H 2 O (l)
 + HCl (aq) NaCl (aq) + H 2 O (l)") EXPERIMENT 21 Molarity of a Hydrochloric Acid Solution by Titration INTRODUCTION Volumetric analysis is a general term meaning any method in which a volume measurement is the critical operation; however,
EXPERIMENT 21 Molarity of a Hydrochloric Acid Solution by Titration INTRODUCTION Volumetric analysis is a general term meaning any method in which a volume measurement is the critical operation; however,
Chapter 6. Series-Parallel Circuits ISU EE. C.Y. Lee
 Chapter 6 Series-Parallel Circuits Objectives Identify series-parallel relationships Analyze series-parallel circuits Determine the loading effect of a voltmeter on a circuit Analyze a Wheatstone bridge
MECHANICS OF MATERIALS
 CHAPTER 2 MECHANICS OF MATERIALS Ferdinand P. Beer E. Russell Johnston, Jr. John T. DeWolf David F. Mazurek Lecture Notes: J. Walt Oler Texas Tech University Stress and Strain Axial Loading 2.1 An Introduction
pseudo-code-2012.docx 2013/5/9
 Pseudo-code 偽代碼 & Flow charts 流程圖 : Sum Bubble sort 1 Prime factors of Magic square Total & Average Bubble sort 2 Factors of Zodiac (simple) Quadratic equation Train fare 1+2+...+n
Permutation Tests for Difference between Two Multivariate Allometric Patterns
 Zoological Studies 38(1): 10-18 (1999) Permutation Tests for Difference between Two Multivariate Allometric Patterns Tzong-Der Tzeng and Shean-Ya Yeh* Institute of Oceanography, National Taiwan University,
1 Measurement Uncertainties
 1 Measurement Uncertainties (Adapted stolen, really from work by Amin Jaziri) 1.1 Introduction No measurement can be perfectly certain. No measuring device is infinitely sensitive or infinitely precise.
Accuracy and Precision of Laboratory Glassware: Determining the Density of Water
 Accuracy and Precision of Laboratory Glassware: Determining the Density of Water During the semester in the general chemistry lab, you will come into contact with various pieces of laboratory glassware.
tan θ(t) = 5 [3 points] And, we are given that d [1 points] Therefore, the velocity of the plane is dx [4 points] (km/min.) [2 points] (The other way)
![tan θ(t) = 5 [3 points] And, we are given that d [1 points] Therefore, the velocity of the plane is dx [4 points] (km/min.) [2 points] (The other way)](/thumbs/74/69694342.jpg "tan θ(t) = 5 [3 points] And, we are given that d [1 points] Therefore, the velocity of the plane is dx [4 points] (km/min.) [2 points] (The other way)") 1051 微甲 06-10 班期中考解答和評分標準 1. (10%) A plane flies horizontally at an altitude of 5 km and passes directly over a tracking telescope on the ground. When the angle of elevation is π/3, this angle is decreasing
1051 微甲 06-10 班期中考解答和評分標準 1. (10%) A plane flies horizontally at an altitude of 5 km and passes directly over a tracking telescope on the ground. When the angle of elevation is π/3, this angle is decreasing
Spectrophotometric Determination of Ferrocyanide in Effluents
 Spectrophotometric Determination of Ferrocyanide in Effluents ECN-0025-1 INTRODUCTION This method is used to determine the concentration of ferrocyanide ion in photoprocessing solution effluents. The ion
原子模型 Atomic Model 有了正確的原子模型, 才會發明了雷射
 原子模型 Atomic Model 有了正確的原子模型, 才會發明了雷射 原子結構中的電子是如何被發現的? ( 1856 1940 ) 可以參考美國物理學會 ( American Institute of Physics ) 網站 For in-depth information, check out the American Institute of Physics' History Center
Frequency Response (Bode Plot) with MATLAB
 with MATLAB") Frequency Response (Bode Plot) with MATLAB 黃馨儀 216/6/15 適應性光子實驗室 常用功能選單 File 選單上第一個指令 New 有三個選項 : M-file Figure Model 開啟一個新的檔案 (*.m) 用以編輯 MATLAB 程式 開始一個新的圖檔 開啟一個新的 simulink 檔案 Help MATLAB Help 查詢相關函式 MATLAB
Frequency Response (Bode Plot) with MATLAB 黃馨儀 216/6/15 適應性光子實驗室 常用功能選單 File 選單上第一個指令 New 有三個選項 : M-file Figure Model 開啟一個新的檔案 (*.m) 用以編輯 MATLAB 程式 開始一個新的圖檔 開啟一個新的 simulink 檔案 Help MATLAB Help 查詢相關函式 MATLAB
What is measurement uncertainty?
 What is measurement uncertainty? What is measurement uncertainty? Introduction Whenever a measurement is made, the result obtained is only an estimate of the true value of the property being measured.
Measurement: The Basics
 I. Introduction Measurement: The Basics Physics is first and foremost an experimental science, meaning that its accumulated body of knowledge is due to the meticulous experiments performed by teams of
第二章 : Hydrostatics and Atmospheric Stability. Ben Jong-Dao Jou Autumn 2010
 第二章 : Hydrostatics and Atmospheric Stability Ben Jong-Dao Jou Autumn 2010 Part I: Hydrostatics 1. Gravity 2. Geopotential: The concept of geopotential is used in measurement of heights in the atmosphere
CHAPTER 4. Thermochemistry ( 熱化學是熱力學的一支, 在化學反應或相變化過程中發生的能量吸收或釋出, 若以吸放熱的形式表現, 即為熱化學研究的對象 ) Chap. 4 Thermochemistry
 Chap. 4 Thermochemistry") CHAPTER 4 Thermochemistry ( 熱化學是熱力學的一支, 在化學反應或相變化過程中發生的能量吸收或釋出, 若以吸放熱的形式表現, 即為熱化學研究的對象 ) 1 2 4.1 Energy Stored in Chemical Bonds Is Released or Taken Up in Chemical Reactions 3 I 2.2 Food and Energy reserves
CHAPTER 4 Thermochemistry ( 熱化學是熱力學的一支, 在化學反應或相變化過程中發生的能量吸收或釋出, 若以吸放熱的形式表現, 即為熱化學研究的對象 ) 1 2 4.1 Energy Stored in Chemical Bonds Is Released or Taken Up in Chemical Reactions 3 I 2.2 Food and Energy reserves
Making measurements and manipulating experimental results
 Making measurements and manipulating experimental results Much of science, including the chemical sciences, is about making measurements and then manipulating them using them to calculate another quantity
11.1 Uncertainty and error in measurement (1 Hour) 11.2 Uncertainties in calculated results (0.5 Hour) 11.3 Graphical techniques (0.
 11.2 Uncertainties in calculated results (0.5 Hour) 11.3 Graphical techniques (0.") Chapter 11 Measurement and Data Processing Page 1 Students are to read and complete any part that requires answers and will submit this assignment on the first day of class. You may use internet sources
Chapter 11 Measurement and Data Processing Page 1 Students are to read and complete any part that requires answers and will submit this assignment on the first day of class. You may use internet sources
Cooling rate of water
 Cooling rate of water Group 5: Xihui Yuan, Wenjing Song, Ming Zhong, Kaiyue Chen, Yue Zhao, Xiangxie Li 目录. Abstract:... 2. Introduction:... 2 2.. Statement of the problem:... 2 2.2 objectives:... 2 2.3.
統計學 Spring 2011 授課教師 : 統計系余清祥日期 :2011 年 3 月 22 日第十三章 : 變異數分析與實驗設計
 統計學 Spring 2011 授課教師 : 統計系余清祥日期 :2011 年 3 月 22 日第十三章 : 變異數分析與實驗設計 Chapter 13, Part A Analysis of Variance and Experimental Design Introduction to Analysis of Variance Analysis of Variance and the Completely
Ch2. Atoms, Molecules and Ions
 Ch2. Atoms, Molecules and Ions The structure of matter includes: (1)Atoms: Composed of electrons, protons and neutrons.(2.2) (2)Molecules: Two or more atoms may combine with one another to form an uncharged
Ch 13 Acids and Bases
 Ch 13 Acids and Bases 13-1 BrФnsted-Lowry acid-base model 13- The ion product of water [H ][OH ] = K w 13-3 ph and poh ph =log[h ] 13-4 Weak acid and their equilibrium constants 13-5 Weak base and their
Multiple sequence alignment (MSA)
") Multiple sequence alignment (MSA) From pairwise to multiple A T _ A T C A... A _ C A T _ A... A T _ G C G _... A _ C G T _ A... A T C A C _ A... _ T C G A G A... Relationship of sequences (Tree) NODE
Multiple sequence alignment (MSA) From pairwise to multiple A T _ A T C A... A _ C A T _ A... A T _ G C G _... A _ C G T _ A... A T C A C _ A... _ T C G A G A... Relationship of sequences (Tree) NODE
Method Validation. Role of Validation. Two levels. Flow of method validation. Method selection
 Role of Validation Method Validation An overview Confirms the fitness for purpose of a particular analytical method. ISO definition: Conformation by examination and provision of objective evidence that
壓差式迴路式均熱片之研製 Fabrication of Pressure-Difference Loop Heat Spreader
 壓差式迴路式均熱片之研製 Fabrication of Pressure-Difference Loop Heat Spreader 1 2* 3 4 4 Yu-Tang Chen Shei Hung-Jung Sheng-Hong Tsai Shung-Wen Kang Chin-Chun Hsu 1 2* 3! "# $ % 4& '! " ( )* +, -. 95-2622-E-237-001-CC3
Using Bootstrap in Capture-Recapture Model
 Using Bootstrap in Capture-Recapture Model YUNG WUN NA A Thesis Submitted in Partial Fulfillment of the Requirements for the Degree of Master of Philosophy in Statistics The Chinese University of Hong
Lecture Notes on Propensity Score Matching
 Lecture Notes on Propensity Score Matching Jin-Lung Lin This lecture note is intended solely for teaching. Some parts of the notes are taken from various sources listed below and no originality is claimed.
第 3 章有機化學反應種類及酸鹼有機反應. 一 ) 有機化反應的種類及有機反應機制 (organic reactions and their mechanism)
 有機化反應的種類及有機反應機制 (organic reactions and their mechanism)") 第 3 章有機化學反應種類及酸鹼有機反應 一 ) 有機化反應的種類及有機反應機制 (organic reactions and their mechanism) 1) a) Substitution reaction: (Saturated compound such as alkanes or alkyl halides, aromatic compounds) ne group replace
第 3 章有機化學反應種類及酸鹼有機反應 一 ) 有機化反應的種類及有機反應機制 (organic reactions and their mechanism) 1) a) Substitution reaction: (Saturated compound such as alkanes or alkyl halides, aromatic compounds) ne group replace
ents & Uncertainties Significant Figures 1.005, Round best to the experimental want to meters and use 300 m 2. significant figures because of
 Introduction to Measureme ents & Uncertainties Significant Figures A measurement and its experimental uncertainty should have significance. All numerical results and/or measurements are expressed with
Fundamentals of data, graphical, and error analysis
 Fundamentals of data, graphical, and error analysis. Data measurement and Significant Figures UTC - Physics 030L/040L Whenever we take a measurement, there are limitations to the data and how well we can
Comparing Relative Predictive Power through Squared Multiple Correlations in. Within-Sample Regression Analysis. CHEUNG, Yu Hin Ray
 Comparing Relative Predictive Power through Squared Multiple Correlations in Within-Sample Regression Analysis CHEUNG, Yu Hin Ray,,- - A Thesis submitted in Partial Fulfillment of the Requirements for
Introduction to Measurements & Error Analysis
 Introduction to Measurements & Error Analysis The Uncertainty of Measurements Some numerical statements are exact: Mary has 3 brothers, and 2 + 2 = 4. However, all measurements have some degree of uncertainty
Measurement And Uncertainty
 Measurement And Uncertainty Based on Guidelines for Evaluating and Expressing the Uncertainty of NIST Measurement Results, NIST Technical Note 1297, 1994 Edition PHYS 407 1 Measurement approximates or
Objectives To prepare a dilute solution of a weak acid. To prepare a buffer of a specific ph value.
 E x p e r i m e n t Chemistry Is phun! Objectives To prepare a dilute solution of a weak acid. To prepare a buffer of a specific ph value. To observe the effects of adding acid and base to a buffer solution.
Chapter 2. Theory of Errors and Basic Adjustment Principles
 Chapter 2 Theory of Errors and Basic Adjustment Principles 2.1. Introduction Measurement is an observation carried out to determine the values of quantities (distances, angles, directions, temperature
Algorithms and Complexity
 Algorithms and Complexity 2.1 ALGORITHMS( 演算法 ) Def: An algorithm is a finite set of precise instructions for performing a computation or for solving a problem The word algorithm algorithm comes from the
Chapter 8: Sampling, Standardization, and Calibration
 Chapter 8: Sampling, Standardization, and Calibration A chemical analysis uses only a small fraction of the available sample, the process of sampling is a very important operation. Knowing how much sample
Chapter 1 Introduction: Matter and Measurement
 Chapter 1 Introduction: and, Inc. Introduction: and 1.1 The Study of Chemistry 1.2 Classifications of 1.3 Properties of 1.4 Units of 1.5 Uncertainty in 1.6 Dimensional Analysis Chemistry is the study of
EXPERMENT 9. To determination of Quinine by fluorescence spectroscopy. Introduction
 EXPERMENT 9 To determination of Quinine by fluorescence spectroscopy Introduction Many chemical compounds can be excited by electromagnetic radication from normally a singlet ground state S o to upper
Chemistry Lab: Introduction to Measurement
 Name Hour Chemistry Lab: Introduction to Measurement (adapted from Flinn ChemTopic Labs) Introduction Much of what we know about the physical world has been obtained from measurements made in the laboratory.
Density of Aqueous Sodium Chloride Solutions
 Experiment 3 Density of Aqueous Sodium Chloride Solutions Prepared by Ross S. Nord and Stephen E. Schullery, Eastern Michigan University PURPOSE Determine the concentration of an unknown sodium chloride
Uncertainty and Graphical Analysis
 Uncertainty and Graphical Analysis Introduction Two measures of the quality of an experimental result are its accuracy and its precision. An accurate result is consistent with some ideal, true value, perhaps
Uncertainties in Measurement
 Uncertainties in Measurement Laboratory investigations involve taking measurements of physical quantities. All measurements will involve some degree of experimental uncertainty. QUESTIONS 1. How does one