Source slideplayer.com/fundamentals of Analytical Chemistry, F.J. Holler, S.R.Crouch. Chapter 6: Random Errors in Chemical Analysis
|
|
|
- Jean Griffith
- 5 years ago
- Views:
Transcription
1 Source lideplayer.com/fundamental of Analytical Chemitry, F.J. Holler, S.R.Crouch Chapter 6: Random Error in Chemical Analyi
2 Random error are preent in every meaurement no matter how careful the experimenter. Random, or indeterminate, error can never be totally eliminated and are often the major ource of uncertainty in a determination. Random error are caued by the many uncontrollable variable that accompany every meaurement. The accumulated effect of the individual uncertaintie caue replicate reult to fluctuate randomly around the mean of the et. In thi chapter, we conider the ource of random error, the determination of their magnitude, and their effect on computed reult of chemical analye. We alo introduce the ignificant figure convention and illutrate it ue in reporting analytical reult.
3 6A The nature of random error - random error in the reult of analyt and 4 i much larger than that een in the reult of analyt 1 and 3. - The reult of analyt 3 how outtanding preciion but poor accuracy. The reult of analyt 1 how excellent preciion and good accuracy. Figure 6-1 A three-dimenional plot howing abolute error in Kjeldahl nitrogen determination for four different analyt.

4 Random Error Source - Small undetectable uncertaintie produce a detectable random error in the following way. - Imagine a ituation in which jut four mall random error combine to give an overall error. We will aume that each error ha an equal probability of occurring and that each can caue the final reult to be high or low by a fixed amount ±U. - Table 6.1 give all the poible way in which four error can combine to give the indicated deviation from the mean value. * Note that only 1 combination lead to a deviation of +4 U, 4 combination give a deviation of + U, and 6 give a deviation of 0 U. * Thi ratio of 1:4:6:4:1 i a meaure of the probability for a deviation of each magnitude


5 If we make a ufficiently large number of meaurement, we can expect a frequency ditribution like that hown in Figure below. Figure 6- Frequency ditribution for meaurement containing (a) Four random uncertaintie, (b) ten random uncertaintie, The mot frequent occurrence i zero deviation from the mean. At the other extreme, a maximum deviation of 10 U occur only about once in 500 reult.

6 When the ame procedure i applied to a very large number of random uncertaintie, a bell-haped curve reult. Such a plot i called a Gauian curve or a normal error curve. Figure 6--c Frequency ditribution for meaurement containing a very large number of random uncertaintie,
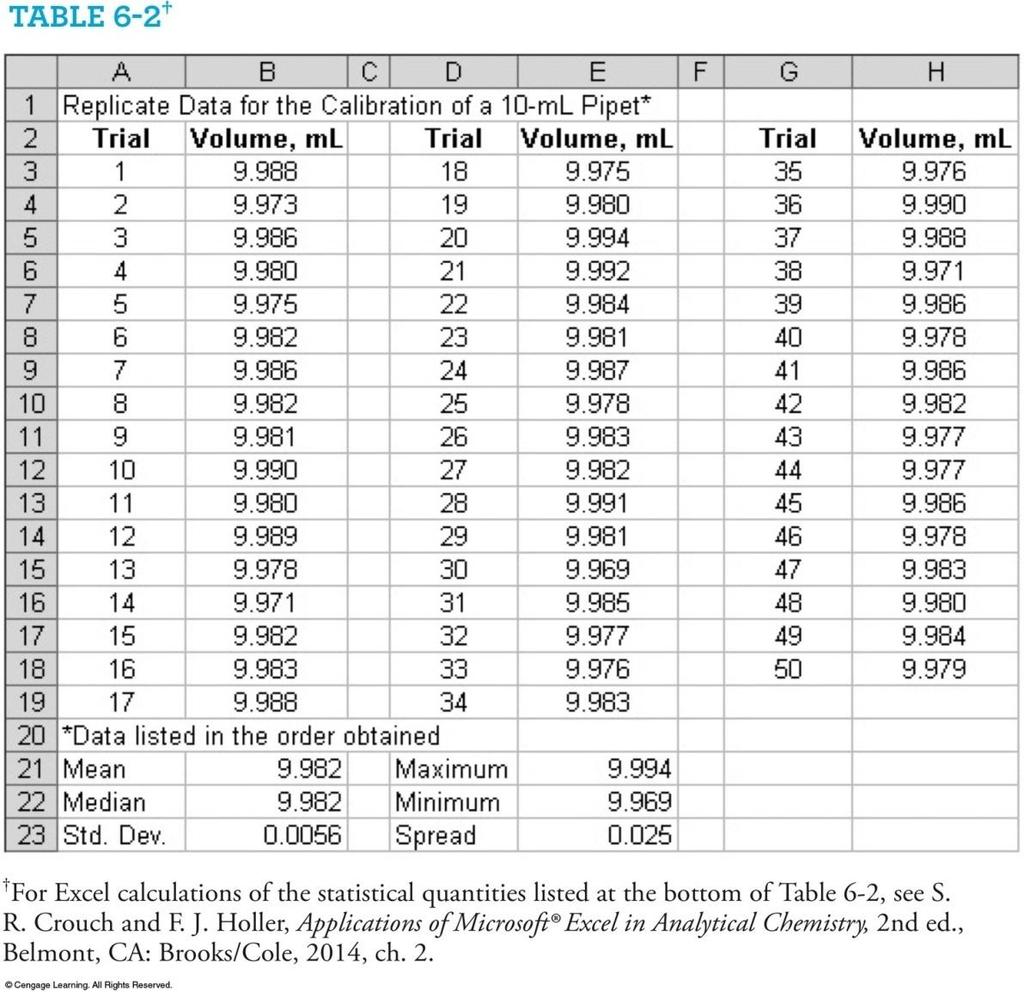
7 Ditribution of Experimental Reult The ditribution of replicate data from mot quantitative analytical experiment approache that of the Gauian curve. Exp: Calibration of a 10-mL pipet. In thi experiment a mall flak and topper were weighed. Ten milliliter of water were tranferred to the flak with the pipet, and the flak wa toppered. The flak, the topper, and the water were then weighed again. The temperature of the water wa alo meaured to determine it denity. The ma of the water wa then calculated by taking the difference between the two mae. The ma of water divided by it denity i the volume delivered by the pipet. The experiment wa repeated 50 time.
8

9 Conider the data in the table for the calibration of a 10-mL pipet. The reult vary from a low of ml to a high of ml. Thi 0.05-mL pread of data reult directly from an accumulation of all random uncertaintie in the experiment. The pread in a et of replicate meaurement can be defined a the difference between the highet and lowet reult. The frequency ditribution data i hown in the table.
 howing ditribution of the 50 reult in Table 6-3 and a Gauian curve (B) for data having the ame mean and tandard deviation a the data in the")
10 The frequency ditribution data are plotted a a bar graph, or hitogram. A the number of meaurement increae, the hitogram approache the hape of the continuou Gauian curve. Figure 6-3 A hitogram (A) howing ditribution of the 50 reult in Table 6-3 and a Gauian curve (B) for data having the ame mean and tandard deviation a the data in the hitogram.
11 6B Statitical treatment of random error - Statitical analyi only reveal information that i already preent in a data et. -Statitical method, do allow u to categorize and characterize data and to make objective and intelligent deciion about data quality and interpretation. -Sample and Population A population i the collection of all meaurement of interet to the experimenter, while a ample i a ubet of meaurement elected from the population. Statitical ample i different from the analytical ample.
12 Propertie of Gauian Curve Gauian curve can be decribed by an equation that contain two parameter, the population mean µ and the population tandard deviation. The term parameter refer to quantitie uch a µ and that define a population or ditribution. Data value uch a x are variable. The term tatitic refer to an etimate of a parameter that i made from a ample of data. Figure 6-4 Normal error curve.
13 The equation for a normalized Gauian curve i a follow: ( x ) The Population Mean µ and the Sample Mean Ẍ y The ample mean x i the arithmetic average of a limited ample drawn from a population of data. The ample mean i defined a the um of the meaurement value divided by the number of meaurement. N i the i the no. of meaurement in the ample et e / x N N x 1 i 1 The population mean i expreed a: where N i the total number of meaurement in the population. N i 1 N x i
14 The Population Standard Deviation It i a meaure of the preciion of the population and i expreed a: N i1 ( x ) i N Where N i the no. of data point making up the population. The two curve are for two population of data that differ only in their tandard deviation.
15 Another type of normal error curve in which the x axi i a new variable z, the quantity z repreent the deviation of a reult from the population mean relative to the tandard deviation. It i commonly given a a variable in tatitical table ince it i a dimenionle quantity. z i defined a z ( ) x A plot of relative frequency veru z yield a ingle Gauian curve that decribe all population of data regardle of tandard deviation.
16 The equation for the Gauian error curve i: y e ( x) / e z / Thi curve ha everal general propertie: (a) The mean occur at the central point of maximum frequency, (b) there i a ymmetrical ditribution of poitive and negative deviation about the maximum, and (c) there i an exponential decreae in frequency a the magnitude of the deviation increae.
 of the mean m.")
17 Area under a Gauian Curve Regardle of it width, 68.3% of the area beneath a Gauian curve for a population lie within one tandard deviation (1) of the mean m. Approximately 95.4% of all data point are within of the mean and 99.7% within 3.
18 The Sample Standard Deviation: A Meaure of Preciion The ample tandard deviation i expreed a: N i1 ( x i x) N 1 N i1 N d i 1 - Thi equation applie to mall et of data. -The number of degree of freedom indicate the number of independent reult that enter into the computation of the tandard deviation. - When number of degree of freedom, (N - 1) i ued intead of N, i aid to be an unbiaed etimator of the population tandard deviation. - The ample variance i an etimate of the population variance.
19 An Alternative Expreion for Sample Standard Deviation N i1 x i N ( N i1 x N 1 i ) - Any time you ubtract two large, approximately equal number, the difference will uually have a relatively large uncertainty. - Hence, you hould never round a tandard deviation calculation until the end. - Becaue of the uncertainty in x, a ample tandard deviation may differ ignificantly from the population tandard deviation. - A N become larger, x and become better etimator of µ, and.
20
21 Standard Error of the Mean - If a erie of replicate reult, each containing N meaurement, are taken randomly from a population of reult, the mean of each et will how le and le catter a N increae. - The tandard deviation of each mean i known a the tandard error of the mean, m, i expreed a: m N - When N i greater than about 0, i uually a good etimator of, and thee quantitie can be aumed to be identical for mot purpoe.
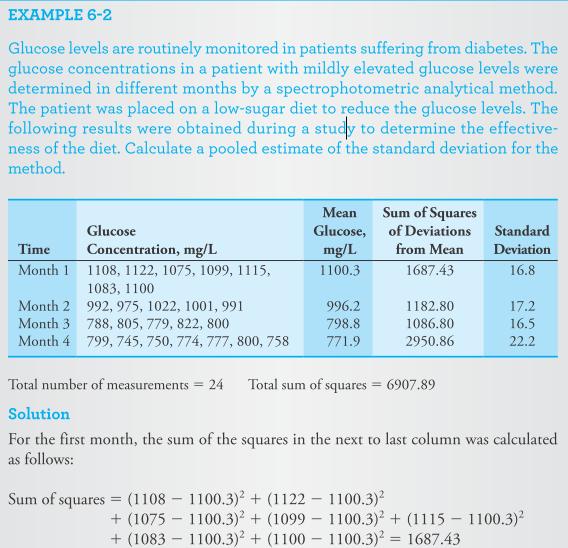
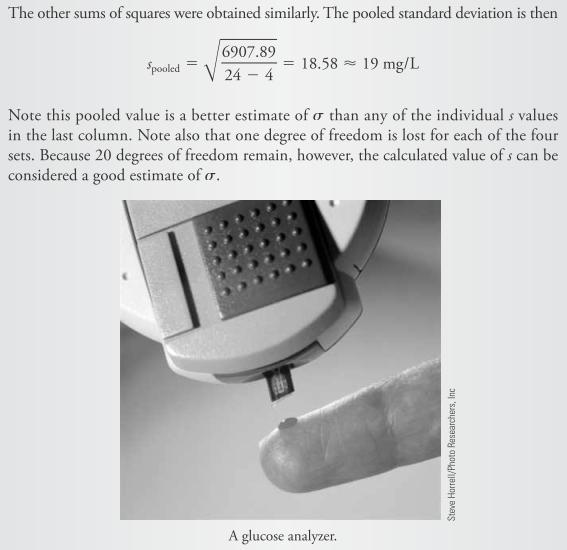
22 Pooling Data to Improve the Reliability of - If we have everal ubet of data, a better etimate of the population tandard deviation can be obtained by pooling (combining) the data, auming that the ample have imilar compoition and have been analyzed the ame way. - The pooled etimate of pooled, i a weighted average of the individual etimate. - To calculate pooled, deviation from the mean for each ubet are quared; the quare of the deviation of all ubet are then ummed and divided by the appropriate number of degree of freedom. pooled N1 N ( xi xi ) ( x j x ) i1 j1 k1 N 1 N N 3... ( x N t k x 3 )...
23
24
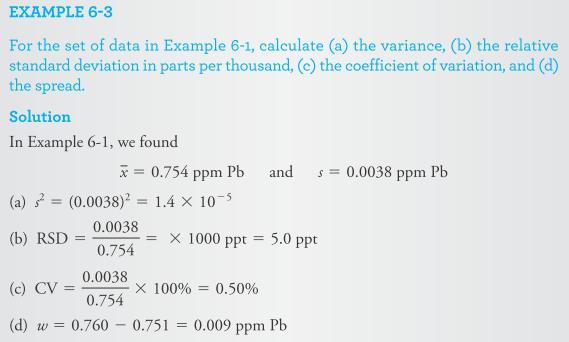
25 Variance and Other Meaure of Preciion Preciion of analytical data may be expreed a: Variance ( ) i the quare of the tandard deviation. The ample variance i an etimate of the population variance and i given by: N i1 ( x x) Relative Standard Deviation (RSD) and Coefficient of Variation (CV) IUPAC recommend that the ymbol r be ued for relative ample tandard deviation and r for relative population tandard deviation. In equation where it i cumberome to ue RSD, ue r and r. i N 1 N i1 ( d i ) N 1 RSD r x
26 RSD inppt 1000ppt ( ) x The relative tandard deviation multiplied by 100% i called the coefficient of variation (CV). CV RSDinpercent x 100% - Spread or Range (w) i ued to decribe the preciion of a et of replicate reult. It i the difference between the larget value in the et and the mallet.
27

28 6C Standard deviation of calculated reult We mut etimate the tandard deviation of a reult that ha been calculated from two or more experimental data point, each of which ha a known ample tandard deviation.
29 Standard Deviation of a Sum or Difference - The variance of a um or difference i equal to the um of the variance of the number making up that um or difference. - The mot probable value for a tandard deviation of a um or difference can be found by taking the quare root of the um of the quare of the individual abolute tandard deviation. y a( a ) b( b ) c( c ) y a b c - Hence, the tandard deviation of the reult y i y a b c - For a um or a difference, the tandard deviation of the anwer i the quare root of the um of the quare of the tandard deviation of the number ued in the calculation.
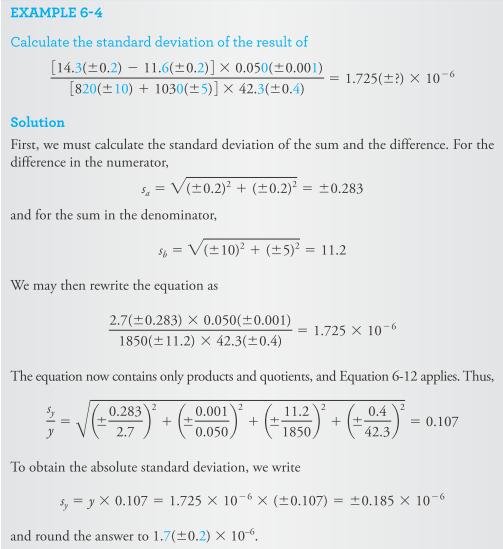
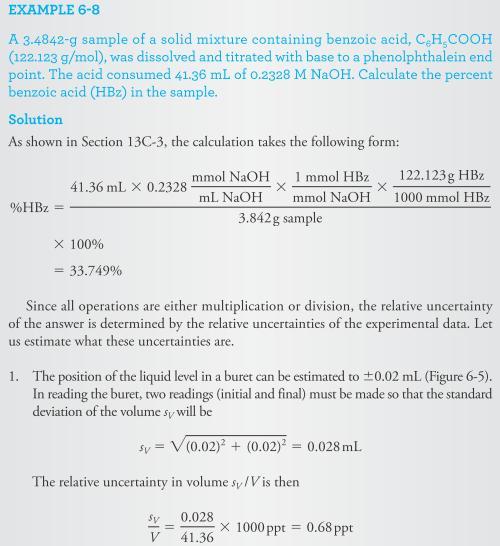
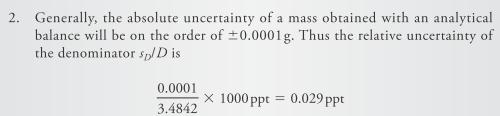
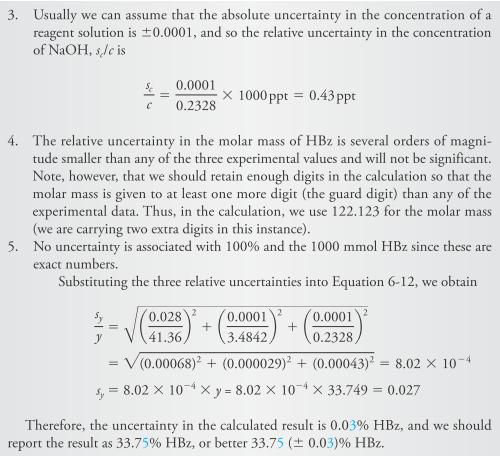
30 Standard Deviation of a Product or Quotient The relative tandard deviation of a product or quotient i determined by the relative tandard deviation of the number forming the computed reult. In cae of, y a b c The relative tandard deviation y /y of the reult by umming the quare of the relative tandard deviation of a, b, and c and then calculating the quare root of the um: y y a ( a To find the abolute tandard deviation in a product or a quotient, firt find the relative tandard deviation in the reult and then multiply it by the reult. ) b ( ) b c ( c )
31
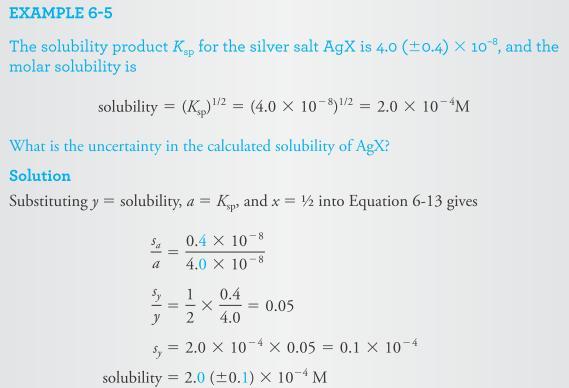
32 Standard Deviation in Exponential Calculation - Conider the relationhip: y = a x where the exponent x can be conidered free of uncertainty. -The relative tandard deviation in y reulting from the uncertainty in a i y y x( a - The relative tandard deviation of the quare of a number i twice the relative tandard deviation of the number, the relative tandard deviation of the cube root of a number i one third that of the number, and o forth. - The relative tandard deviation of y = a 3 i not the ame a the relative tandard deviation of the product of three independent meaurement y = abc, where a = b = c. a )
33
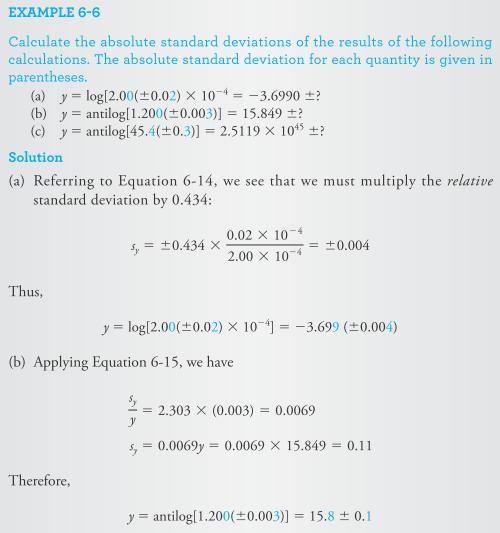
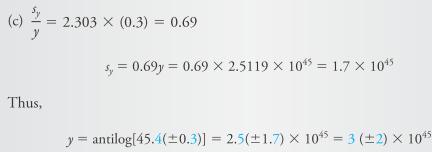
34 Standard Deviation of Logarithm and Antilogarithm For y = log a y a a And for y = antilog a y y.303 a The abolute tandard deviation of the logarithm of a number i determined by the relative tandard deviation of the number; converely, the relative tandard deviation of the antilogarithm of a number i determined by the abolute tandard deviation of the number.
35
36 6D Reporting computed data One of the bet way of indicating reliability i to give a confidence interval at the 90% or 95% confidence level. Another method i to report the abolute tandard deviation or the coefficient of variation of the data. A much le atifactory but more common indicator of the quality of data i the ignificant figure convention. Significant Figure The ignificant figure in a number are all of the certain digit plu the firt uncertain digit. Rule for determining the number of ignificant figure: 1. Diregard all initial zero.. Diregard all final zero unle they follow a decimal point. 3. All remaining digit including zero between nonzero digit are ignificant.

37 Significant Figure in Numerical Computation Determining the appropriate number of ignificant figure in the reult of an arithmetic combination of two or more number require great care. Sum and Difference - For addition and ubtraction, the reult hould have the ame number of decimal place a the number with the mallet number of decimal place. Note that the reult contain three ignificant digit even though two of the number involved have only two ignificant figure.
38 Product and Quotient For multiplication and diviion, the anwer hould be rounded o that it contain the ame number of ignificant digit a the original number with the mallet number of ignificant digit. Thi procedure ometime lead to incorrect rounding. When adding and ubtracting number in cientific notation, expre the number to the ame power of ten. The weak link for multiplication and diviion i the number of ignificant figure in the number with the mallet number of ignificant figure. Ue thi rule of thumb with caution.
39 Logarithm and Antilogarithm The following rule apply to the reult of calculation involving logarithm: 1. In a logarithm of a number, keep a many digit to the right of the decimal point a there are ignificant figure in the original number.. In an antilogarithm of a number, keep a many digit a there are digit to the right of the decimal point in the original number. The number of ignificant figure in the mantia, or the digit to the right of the decimal point of a logarithm, i the ame a the number of ignificant figure in the original number. Thu, log ( ) = Since 9.57 ha 3 ignificant figure, there are 3 digit to the right of the decimal point in the reult.

40 Rounding Data In rounding a number ending in 5, alway round o that the reult end with an even number. Thu, round to 0.64 and 0.65 round to 0.6. It i eldom jutifiable to keep more than one ignificant figure in the tandard deviation becaue the tandard deviation contain error a well.
41 Expreing Reult of Chemical Calculation - If the tandard deviation of the value making up the final calculation are known, apply the propagation of error method. - However, if calculation have to be performed where the preciion i indicated only by the ignificant figure convention, the reult i rounded o that it contain only ignificant digit. - It i epecially important to potpone rounding until the calculation i completed. - At leat one extra digit beyond the ignificant digit hould be carried through all of the computation in order to avoid a rounding error. Thi extra digit i ometime called a guard digit.
42
43
44 Suggeted Problem 6.1, 6., 6.5, 6.7, 6.8, 6.10(odd), 6.1, 6.15, 6.18
( ) y = Properties of Gaussian curves: Can also be written as: where
 y = Properties of Gaussian curves: Can also be written as: where") Propertie of Gauian curve: Can alo be written a: e ( x μ ) σ σ π e z σ π where z ( ) x μ σ z repreent the deviation of a reult from the population mean relative to the population tandard deviation. z i
Propertie of Gauian curve: Can alo be written a: e ( x μ ) σ σ π e z σ π where z ( ) x μ σ z repreent the deviation of a reult from the population mean relative to the population tandard deviation. z i
Social Studies 201 Notes for November 14, 2003
 1 Social Studie 201 Note for November 14, 2003 Etimation of a mean, mall ample ize Section 8.4, p. 501. When a reearcher ha only a mall ample ize available, the central limit theorem doe not apply to the
Comparing Means: t-tests for Two Independent Samples
 Comparing ean: t-tet for Two Independent Sample Independent-eaure Deign t-tet for Two Independent Sample Allow reearcher to evaluate the mean difference between two population uing data from two eparate
Suggested Answers To Exercises. estimates variability in a sampling distribution of random means. About 68% of means fall
 Beyond Significance Teting ( nd Edition), Rex B. Kline Suggeted Anwer To Exercie Chapter. The tatitic meaure variability among core at the cae level. In a normal ditribution, about 68% of the core fall
Social Studies 201 Notes for March 18, 2005
 1 Social Studie 201 Note for March 18, 2005 Etimation of a mean, mall ample ize Section 8.4, p. 501. When a reearcher ha only a mall ample ize available, the central limit theorem doe not apply to the
CHAPTER 6. Estimation
 CHAPTER 6 Etimation Definition. Statitical inference i the procedure by which we reach a concluion about a population on the bai of information contained in a ample drawn from that population. Definition.
Math Skills. Scientific Notation. Uncertainty in Measurements. Appendix A5 SKILLS HANDBOOK
 ppendix 5 Scientific Notation It i difficult to work with very large or very mall number when they are written in common decimal notation. Uually it i poible to accommodate uch number by changing the SI
μ + = σ = D 4 σ = D 3 σ = σ = All units in parts (a) and (b) are in V. (1) x chart: Center = μ = 0.75 UCL =
 and (b) are in V. (1) x chart: Center = μ = 0.75 UCL =") Our online Tutor are available 4*7 to provide Help with Proce control ytem Homework/Aignment or a long term Graduate/Undergraduate Proce control ytem Project. Our Tutor being experienced and proficient
Our online Tutor are available 4*7 to provide Help with Proce control ytem Homework/Aignment or a long term Graduate/Undergraduate Proce control ytem Project. Our Tutor being experienced and proficient
If Y is normally Distributed, then and 2 Y Y 10. σ σ
 ull Hypothei Significance Teting V. APS 50 Lecture ote. B. Dudek. ot for General Ditribution. Cla Member Uage Only. Chi-Square and F-Ditribution, and Diperion Tet Recall from Chapter 4 material on: ( )
Chapter 12 Simple Linear Regression
 Chapter 1 Simple Linear Regreion Introduction Exam Score v. Hour Studied Scenario Regreion Analyi ued to quantify the relation between (or more) variable o you can predict the value of one variable baed
Chapter 2 Sampling and Quantization. In order to investigate sampling and quantization, the difference between analog
 Chapter Sampling and Quantization.1 Analog and Digital Signal In order to invetigate ampling and quantization, the difference between analog and digital ignal mut be undertood. Analog ignal conit of continuou
Alternate Dispersion Measures in Replicated Factorial Experiments
 Alternate Diperion Meaure in Replicated Factorial Experiment Neal A. Mackertich The Raytheon Company, Sudbury MA 02421 Jame C. Benneyan Northeatern Univerity, Boton MA 02115 Peter D. Krau The Raytheon
Lecture 4 Topic 3: General linear models (GLMs), the fundamentals of the analysis of variance (ANOVA), and completely randomized designs (CRDs)
, the fundamentals of the analysis of variance (ANOVA), and completely randomized designs (CRDs)") Lecture 4 Topic 3: General linear model (GLM), the fundamental of the analyi of variance (ANOVA), and completely randomized deign (CRD) The general linear model One population: An obervation i explained
Lecture 4 Topic 3: General linear model (GLM), the fundamental of the analyi of variance (ANOVA), and completely randomized deign (CRD) The general linear model One population: An obervation i explained
SIMPLE LINEAR REGRESSION
 SIMPLE LINEAR REGRESSION In linear regreion, we conider the frequency ditribution of one variable (Y) at each of everal level of a econd variable (). Y i known a the dependent variable. The variable for
EC381/MN308 Probability and Some Statistics. Lecture 7 - Outline. Chapter Cumulative Distribution Function (CDF) Continuous Random Variables
 Continuous Random Variables") EC38/MN38 Probability and Some Statitic Yanni Pachalidi yannip@bu.edu, http://ionia.bu.edu/ Lecture 7 - Outline. Continuou Random Variable Dept. of Manufacturing Engineering Dept. of Electrical and Computer
EC38/MN38 Probability and Some Statitic Yanni Pachalidi yannip@bu.edu, http://ionia.bu.edu/ Lecture 7 - Outline. Continuou Random Variable Dept. of Manufacturing Engineering Dept. of Electrical and Computer
FUNDAMENTALS OF POWER SYSTEMS
 1 FUNDAMENTALS OF POWER SYSTEMS 1 Chapter FUNDAMENTALS OF POWER SYSTEMS INTRODUCTION The three baic element of electrical engineering are reitor, inductor and capacitor. The reitor conume ohmic or diipative
Jan Purczyński, Kamila Bednarz-Okrzyńska Estimation of the shape parameter of GED distribution for a small sample size
 Jan Purczyńki, Kamila Bednarz-Okrzyńka Etimation of the hape parameter of GED ditribution for a mall ample ize Folia Oeconomica Stetinenia 4()/, 35-46 04 Folia Oeconomica Stetinenia DOI: 0.478/foli-04-003
ON THE APPROXIMATION ERROR IN HIGH DIMENSIONAL MODEL REPRESENTATION. Xiaoqun Wang
 Proceeding of the 2008 Winter Simulation Conference S. J. Maon, R. R. Hill, L. Mönch, O. Roe, T. Jefferon, J. W. Fowler ed. ON THE APPROXIMATION ERROR IN HIGH DIMENSIONAL MODEL REPRESENTATION Xiaoqun Wang
PhysicsAndMathsTutor.com
 1. A teacher wihe to tet whether playing background muic enable tudent to complete a tak more quickly. The ame tak wa completed by 15 tudent, divided at random into two group. The firt group had background
1. The F-test for Equality of Two Variances
 . The F-tet for Equality of Two Variance Previouly we've learned how to tet whether two population mean are equal, uing data from two independent ample. We can alo tet whether two population variance are
Z a>2 s 1n = X L - m. X L = m + Z a>2 s 1n X L = The decision rule for this one-tail test is
 M09_BERE8380_12_OM_C09.QD 2/21/11 3:44 PM Page 1 9.6 The Power of a Tet 9.6 The Power of a Tet 1 Section 9.1 defined Type I and Type II error and their aociated rik. Recall that a repreent the probability
Clustering Methods without Given Number of Clusters
 Clutering Method without Given Number of Cluter Peng Xu, Fei Liu Introduction A we now, mean method i a very effective algorithm of clutering. It mot powerful feature i the calability and implicity. However,
Random vs. Deterministic Deployment of Sensors in the Presence of Failures and Placement Errors
 Random v. Determinitic Deployment of Senor in the Preence of Failure and Placement Error Paul Baliter Univerity of Memphi pbalitr@memphi.edu Santoh Kumar Univerity of Memphi antoh.kumar@memphi.edu Abtract
Fair Game Review. Chapter 7 A B C D E Name Date. Complete the number sentence with <, >, or =
 Name Date Chapter 7 Fair Game Review Complete the number entence with , or =. 1. 3.4 3.45 2. 6.01 6.1 3. 3.50 3.5 4. 0.84 0.91 Find three decimal that make the number entence true. 5. 5.2 6. 2.65 >
After the invention of the steam engine in the late 1700s by the Scottish engineer
 Introduction to Statitic 22 After the invention of the team engine in the late 1700 by the Scottih engineer Jame Watt, the production of machine-made good became widepread during the 1800. However, it
Pikeville Independent Schools [ALGEBRA 1 CURRICULUM MAP ]
![Pikeville Independent Schools [ALGEBRA 1 CURRICULUM MAP ]](/thumbs/86/93792363.jpg "Pikeville Independent Schools [ALGEBRA 1 CURRICULUM MAP ]") Pikeville Independent School [ALGEBRA 1 CURRICULUM MAP 20162017] Augut X X X 11 12 15 16 17 18 19 22 23 24 25 26 12 37 8 12 29 30 31 13 15 September 1 2 X 6 7 8 9 16 17 18 21 PreAlgebra Review Algebra
Pikeville Independent School [ALGEBRA 1 CURRICULUM MAP 20162017] Augut X X X 11 12 15 16 17 18 19 22 23 24 25 26 12 37 8 12 29 30 31 13 15 September 1 2 X 6 7 8 9 16 17 18 21 PreAlgebra Review Algebra
PARAMETERS OF DISPERSION FOR ON-TIME PERFORMANCE OF POSTAL ITEMS WITHIN TRANSIT TIMES MEASUREMENT SYSTEM FOR POSTAL SERVICES
 PARAMETERS OF DISPERSION FOR ON-TIME PERFORMANCE OF POSTAL ITEMS WITHIN TRANSIT TIMES MEASUREMENT SYSTEM FOR POSTAL SERVICES Daniel Salava Kateřina Pojkarová Libor Švadlenka Abtract The paper i focued
Determination of Flow Resistance Coefficients Due to Shrubs and Woody Vegetation
 ERDC/CL CETN-VIII-3 December 000 Determination of Flow Reitance Coefficient Due to hrub and Woody Vegetation by Ronald R. Copeland PURPOE: The purpoe of thi Technical Note i to tranmit reult of an experimental
NON-GAUSSIAN ERROR DISTRIBUTIONS OF LMC DISTANCE MODULI MEASUREMENTS
 The Atrophyical Journal, 85:87 (0pp), 05 December 0 05. The American Atronomical Society. All right reerved. doi:0.088/0004-637x/85//87 NON-GAUSSIAN ERROR DISTRIBUTIONS OF LMC DISTANCE MODULI MEASUREMENTS
HSC PHYSICS ONLINE KINEMATICS EXPERIMENT
 HSC PHYSICS ONLINE KINEMATICS EXPERIMENT RECTILINEAR MOTION WITH UNIFORM ACCELERATION Ball rolling down a ramp Aim To perform an experiment and do a detailed analyi of the numerical reult for the rectilinear
Midterm Review - Part 1
 Honor Phyic Fall, 2016 Midterm Review - Part 1 Name: Mr. Leonard Intruction: Complete the following workheet. SHOW ALL OF YOUR WORK. 1. Determine whether each tatement i True or Fale. If the tatement i
Dimensional Analysis A Tool for Guiding Mathematical Calculations
 Dimenional Analyi A Tool for Guiding Mathematical Calculation Dougla A. Kerr Iue 1 February 6, 2010 ABSTRACT AND INTRODUCTION In converting quantitie from one unit to another, we may know the applicable
Regression. What is regression? Linear Regression. Cal State Northridge Ψ320 Andrew Ainsworth PhD
 Regreion Cal State Northridge Ψ30 Andrew Ainworth PhD What i regreion? How do we predict one variable from another? How doe one variable change a the other change? Caue and effect Linear Regreion A technique
EE 508 Lecture 16. Filter Transformations. Lowpass to Bandpass Lowpass to Highpass Lowpass to Band-reject
 EE 508 Lecture 6 Filter Tranformation Lowpa to Bandpa Lowpa to Highpa Lowpa to Band-reject Review from Lat Time Theorem: If the perimeter variation and contact reitance are neglected, the tandard deviation
Design spacecraft external surfaces to ensure 95 percent probability of no mission-critical failures from particle impact.
 PREFERRED RELIABILITY PAGE 1 OF 6 PRACTICES METEOROIDS & SPACE DEBRIS Practice: Deign pacecraft external urface to enure 95 percent probability of no miion-critical failure from particle impact. Benefit:
Bio 112 Lecture Notes; Scientific Method
 Bio Lecture ote; Scientific Method What Scientit Do: Scientit collect data and develop theorie, model, and law about how nature work. Science earche for natural caue to eplain natural phenomenon Purpoe
Unified Correlation between SPT-N and Shear Wave Velocity for all Soil Types
 6 th International Conference on Earthquake Geotechnical Engineering 1-4 ovember 15 Chritchurch, ew Zealand Unified Correlation between SPT- and Shear Wave Velocity for all Soil Type C.-C. Tai 1 and T.
III.9. THE HYSTERESIS CYCLE OF FERROELECTRIC SUBSTANCES
 III.9. THE HYSTERESIS CYCLE OF FERROELECTRIC SBSTANCES. Work purpoe The analyi of the behaviour of a ferroelectric ubtance placed in an eternal electric field; the dependence of the electrical polariation
Control Systems Analysis and Design by the Root-Locus Method
 6 Control Sytem Analyi and Deign by the Root-Locu Method 6 1 INTRODUCTION The baic characteritic of the tranient repone of a cloed-loop ytem i cloely related to the location of the cloed-loop pole. If
NCAAPMT Calculus Challenge Challenge #3 Due: October 26, 2011
 NCAAPMT Calculu Challenge 011 01 Challenge #3 Due: October 6, 011 A Model of Traffic Flow Everyone ha at ome time been on a multi-lane highway and encountered road contruction that required the traffic
DYNAMIC MODELS FOR CONTROLLER DESIGN
 DYNAMIC MODELS FOR CONTROLLER DESIGN M.T. Tham (996,999) Dept. of Chemical and Proce Engineering Newcatle upon Tyne, NE 7RU, UK.. INTRODUCTION The problem of deigning a good control ytem i baically that
Standard Guide for Conducting Ruggedness Tests 1
 Deignation: E 69 89 (Reapproved 996) Standard Guide for Conducting Ruggedne Tet AMERICA SOCIETY FOR TESTIG AD MATERIALS 00 Barr Harbor Dr., Wet Conhohocken, PA 948 Reprinted from the Annual Book of ASTM
Lecture 8: Period Finding: Simon s Problem over Z N
 Quantum Computation (CMU 8-859BB, Fall 205) Lecture 8: Period Finding: Simon Problem over Z October 5, 205 Lecturer: John Wright Scribe: icola Rech Problem A mentioned previouly, period finding i a rephraing
Standard normal distribution. t-distribution, (df=5) t-distribution, (df=2) PDF created with pdffactory Pro trial version
 t-distribution, (df=2) PDF created with pdffactory Pro trial version") t-ditribution In biological reearch the population variance i uually unknown and an unbiaed etimate,, obtained from the ample data, ha to be ued in place of σ. The propertie of t- ditribution are: -It
t-ditribution In biological reearch the population variance i uually unknown and an unbiaed etimate,, obtained from the ample data, ha to be ued in place of σ. The propertie of t- ditribution are: -It
Electronic Theses and Dissertations
 Eat Tenneee State Univerity Digital Common @ Eat Tenneee State Univerity Electronic Thee and Diertation Student Work 5-208 Vector Partition Jennifer French Eat Tenneee State Univerity Follow thi and additional
Physics 741 Graduate Quantum Mechanics 1 Solutions to Final Exam, Fall 2014
 Phyic 7 Graduate Quantum Mechanic Solution to inal Eam all 0 Each quetion i worth 5 point with point for each part marked eparately Some poibly ueful formula appear at the end of the tet In four dimenion
Research Article Reliability of Foundation Pile Based on Settlement and a Parameter Sensitivity Analysis
 Mathematical Problem in Engineering Volume 2016, Article ID 1659549, 7 page http://dxdoiorg/101155/2016/1659549 Reearch Article Reliability of Foundation Pile Baed on Settlement and a Parameter Senitivity
A Bluffer s Guide to... Sphericity
 A Bluffer Guide to Sphericity Andy Field Univerity of Suex The ue of repeated meaure, where the ame ubject are teted under a number of condition, ha numerou practical and tatitical benefit. For one thing
Lecture 7: Testing Distributions
 CSE 5: Sublinear (and Streaming) Algorithm Spring 014 Lecture 7: Teting Ditribution April 1, 014 Lecturer: Paul Beame Scribe: Paul Beame 1 Teting Uniformity of Ditribution We return today to property teting
Thermal Resistance Measurements and Thermal Transient Analysis of Power Chip Slug-Up and Slug-Down Mounted on HDI Substrate
 Intl Journal of Microcircuit and Electronic Packaging Thermal Reitance Meaurement and Thermal Tranient Analyi of Power Chip Slug-Up and Slug-Down Mounted on HDI Subtrate Claudio Sartori Magneti Marelli
GNSS Solutions: What is the carrier phase measurement? How is it generated in GNSS receivers? Simply put, the carrier phase
 GNSS Solution: Carrier phae and it meaurement for GNSS GNSS Solution i a regular column featuring quetion and anwer about technical apect of GNSS. Reader are invited to end their quetion to the columnit,
( ) ( Statistical Equivalence Testing
 ( Statistical Equivalence Testing") ( Downloaded via 148.51.3.83 on November 1, 018 at 13:8: (UTC). See http://pub.ac.org/haringguideline for option on how to legitimately hare publihed article. 0 BEYOND Gielle B. Limentani Moira C. Ringo
( Downloaded via 148.51.3.83 on November 1, 018 at 13:8: (UTC). See http://pub.ac.org/haringguideline for option on how to legitimately hare publihed article. 0 BEYOND Gielle B. Limentani Moira C. Ringo
Fair Game Review. Chapter 6. Evaluate the expression. 3. ( ) 7. Find ± Find Find Find the side length s of the square.
 7. Find ± Find Find Find the side length s of the square.") Name Date Chapter 6 Evaluate the epreion. Fair Game Review 1. 5 1 6 3 + 8. 18 9 + 0 5 3 3 1 + +. 9 + 7( 8) + 5 0 + ( 6 8) 1 3 3 3. ( ) 5. Find 81. 6. Find 5. 7. Find ± 16. 8. Find the ide length of the
Name Date Chapter 6 Evaluate the epreion. Fair Game Review 1. 5 1 6 3 + 8. 18 9 + 0 5 3 3 1 + +. 9 + 7( 8) + 5 0 + ( 6 8) 1 3 3 3. ( ) 5. Find 81. 6. Find 5. 7. Find ± 16. 8. Find the ide length of the
Bogoliubov Transformation in Classical Mechanics
 Bogoliubov Tranformation in Claical Mechanic Canonical Tranformation Suppoe we have a et of complex canonical variable, {a j }, and would like to conider another et of variable, {b }, b b ({a j }). How
Suggestions - Problem Set (a) Show the discriminant condition (1) takes the form. ln ln, # # R R
 Show the discriminant condition (1) takes the form. ln ln, # # R R") Suggetion - Problem Set 3 4.2 (a) Show the dicriminant condition (1) take the form x D Ð.. Ñ. D.. D. ln ln, a deired. We then replace the quantitie. 3ß D3 by their etimate to get the proper form for thi
Suggetion - Problem Set 3 4.2 (a) Show the dicriminant condition (1) take the form x D Ð.. Ñ. D.. D. ln ln, a deired. We then replace the quantitie. 3ß D3 by their etimate to get the proper form for thi
APPLICATION OF THE SINGLE IMPACT MICROINDENTATION FOR NON- DESTRUCTIVE TESTING OF THE FRACTURE TOUGHNESS OF NONMETALLIC AND POLYMERIC MATERIALS
 APPLICATION OF THE SINGLE IMPACT MICROINDENTATION FOR NON- DESTRUCTIVE TESTING OF THE FRACTURE TOUGHNESS OF NONMETALLIC AND POLYMERIC MATERIALS REN A. P. INSTITUTE OF APPLIED PHYSICS OF THE NATIONAL ACADEMY
Harris: Quantitative Chemical Analysis, Eight Edition CHAPTER 03: EXPERIMENTAL ERROR
 Harris: Quantitative Chemical Analysis, Eight Edition CHAPTER 03: EXPERIMENTAL ERROR Chapter 3. Experimental Error -There is error associated with every measurement. -There is no way to measure the true
(b) 99%; n = 15; σ is unknown; population appears to be normally distributed.
 99%; n = 15; σ is unknown; population appears to be normally distributed.") MTH 345 Exam 3 Fall 2013 Jutify all anwer with neat and organized work. Clearly indicate your anwer. 100 point poible. 1. (12 pt.) Women height are normally ditributed with mean 63.6 in. and tandard deviation
MTH 345 Exam 3 Fall 2013 Jutify all anwer with neat and organized work. Clearly indicate your anwer. 100 point poible. 1. (12 pt.) Women height are normally ditributed with mean 63.6 in. and tandard deviation
NEGATIVE z Scores. TABLE A-2 Standard Normal (z) Distribution: Cumulative Area from the LEFT. (continued)
 Distribution: Cumulative Area from the LEFT. (continued)") NEGATIVE z Score z 0 TALE A- Standard Normal (z) Ditribution: Cumulative Area from the LEFT z.00.01.0.03.04.05.06.07.08.09-3.50 and lower.0001-3.4.0003.0003.0003.0003.0003.0003.0003.0003.0003.000-3.3.0005.0005.0005.0004.0004.0004.0004.0004.0004.0003-3..0007.0007.0006.0006.0006.0006.0006.0005.0005.0005-3.1.0010.0009.0009.0009.0008.0008.0008.0008.0007.0007-3.0.0013.0013.0013.001.001.0011.0011.0011.0010.0010
NEGATIVE z Score z 0 TALE A- Standard Normal (z) Ditribution: Cumulative Area from the LEFT z.00.01.0.03.04.05.06.07.08.09-3.50 and lower.0001-3.4.0003.0003.0003.0003.0003.0003.0003.0003.0003.000-3.3.0005.0005.0005.0004.0004.0004.0004.0004.0004.0003-3..0007.0007.0006.0006.0006.0006.0006.0005.0005.0005-3.1.0010.0009.0009.0009.0008.0008.0008.0008.0007.0007-3.0.0013.0013.0013.001.001.0011.0011.0011.0010.0010
The continuous time random walk (CTRW) was introduced by Montroll and Weiss 1.
 was introduced by Montroll and Weiss 1.") 1 I. CONTINUOUS TIME RANDOM WALK The continuou time random walk (CTRW) wa introduced by Montroll and Wei 1. Unlike dicrete time random walk treated o far, in the CTRW the number of jump n made by the walker
1 I. CONTINUOUS TIME RANDOM WALK The continuou time random walk (CTRW) wa introduced by Montroll and Wei 1. Unlike dicrete time random walk treated o far, in the CTRW the number of jump n made by the walker
Problem Set 8 Solutions
 Deign and Analyi of Algorithm April 29, 2015 Maachuett Intitute of Technology 6.046J/18.410J Prof. Erik Demaine, Srini Devada, and Nancy Lynch Problem Set 8 Solution Problem Set 8 Solution Thi problem
Determination of Flow Resistance Coefficients Due to Shrubs and Woody Vegetation
 December 000 Determination of Flow Reitance Coefficient Due to hrub and Woody Vegetation by Ronald R. Copeland PURPOE: The purpoe of thi Technical Note i to tranmit reult of an experimental invetigation
Design By Emulation (Indirect Method)
") Deign By Emulation (Indirect Method he baic trategy here i, that Given a continuou tranfer function, it i required to find the bet dicrete equivalent uch that the ignal produced by paing an input ignal
Deign By Emulation (Indirect Method he baic trategy here i, that Given a continuou tranfer function, it i required to find the bet dicrete equivalent uch that the ignal produced by paing an input ignal
Estimation of Peaked Densities Over the Interval [0,1] Using Two-Sided Power Distribution: Application to Lottery Experiments
![Estimation of Peaked Densities Over the Interval [0,1] Using Two-Sided Power Distribution: Application to Lottery Experiments](/thumbs/83/87516965.jpg "Estimation of Peaked Densities Over the Interval [0,1] Using Two-Sided Power Distribution: Application to Lottery Experiments") MPRA Munich Peronal RePEc Archive Etimation of Peaed Denitie Over the Interval [0] Uing Two-Sided Power Ditribution: Application to Lottery Experiment Krzyztof Konte Artal Invetment 8. April 00 Online
MPRA Munich Peronal RePEc Archive Etimation of Peaed Denitie Over the Interval [0] Uing Two-Sided Power Ditribution: Application to Lottery Experiment Krzyztof Konte Artal Invetment 8. April 00 Online
Lecture 21. The Lovasz splitting-off lemma Topics in Combinatorial Optimization April 29th, 2004
 18.997 Topic in Combinatorial Optimization April 29th, 2004 Lecture 21 Lecturer: Michel X. Goeman Scribe: Mohammad Mahdian 1 The Lovaz plitting-off lemma Lovaz plitting-off lemma tate the following. Theorem
Linear Motion, Speed & Velocity
 Add Important Linear Motion, Speed & Velocity Page: 136 Linear Motion, Speed & Velocity NGSS Standard: N/A MA Curriculum Framework (006): 1.1, 1. AP Phyic 1 Learning Objective: 3.A.1.1, 3.A.1.3 Knowledge/Undertanding
Chapter 5 Consistency, Zero Stability, and the Dahlquist Equivalence Theorem
 Chapter 5 Conitency, Zero Stability, and the Dahlquit Equivalence Theorem In Chapter 2 we dicued convergence of numerical method and gave an experimental method for finding the rate of convergence (aka,
The Hassenpflug Matrix Tensor Notation
 The Haenpflug Matrix Tenor Notation D.N.J. El Dept of Mech Mechatron Eng Univ of Stellenboch, South Africa e-mail: dnjel@un.ac.za 2009/09/01 Abtract Thi i a ample document to illutrate the typeetting of
A FUNCTIONAL BAYESIAN METHOD FOR THE SOLUTION OF INVERSE PROBLEMS WITH SPATIO-TEMPORAL PARAMETERS AUTHORS: CORRESPONDENCE: ABSTRACT
 A FUNCTIONAL BAYESIAN METHOD FOR THE SOLUTION OF INVERSE PROBLEMS WITH SPATIO-TEMPORAL PARAMETERS AUTHORS: Zenon Medina-Cetina International Centre for Geohazard / Norwegian Geotechnical Intitute Roger
Stratified Analysis of Probabilities of Causation
 Stratified Analyi of Probabilitie of Cauation Manabu Kuroki Sytem Innovation Dept. Oaka Univerity Toyonaka, Oaka, Japan mkuroki@igmath.e.oaka-u.ac.jp Zhihong Cai Biotatitic Dept. Kyoto Univerity Sakyo-ku,
Advanced Digital Signal Processing. Stationary/nonstationary signals. Time-Frequency Analysis... Some nonstationary signals. Time-Frequency Analysis
 Advanced Digital ignal Proceing Prof. Nizamettin AYDIN naydin@yildiz.edu.tr Time-Frequency Analyi http://www.yildiz.edu.tr/~naydin 2 tationary/nontationary ignal Time-Frequency Analyi Fourier Tranform
USING NONLINEAR CONTROL ALGORITHMS TO IMPROVE THE QUALITY OF SHAKING TABLE TESTS
 October 12-17, 28, Beijing, China USING NONLINEAR CONTR ALGORITHMS TO IMPROVE THE QUALITY OF SHAKING TABLE TESTS T.Y. Yang 1 and A. Schellenberg 2 1 Pot Doctoral Scholar, Dept. of Civil and Env. Eng.,
CHARGING OF DUST IN A NEGATIVE ION PLASMA (APS DPP-06 Poster LP )
") 1 CHARGING OF DUST IN A NEGATIVE ION PLASMA (APS DPP-06 Poter LP1.00128) Robert Merlino, Ro Fiher, Su Hyun Kim And Nathan Quarderer Department of Phyic and Atronomy, The Univerity of Iowa Abtract. We invetigate
1 CHARGING OF DUST IN A NEGATIVE ION PLASMA (APS DPP-06 Poter LP1.00128) Robert Merlino, Ro Fiher, Su Hyun Kim And Nathan Quarderer Department of Phyic and Atronomy, The Univerity of Iowa Abtract. We invetigate
MINITAB Stat Lab 3
 MINITAB Stat 20080 Lab 3. Statitical Inference In the previou lab we explained how to make prediction from a imple linear regreion model and alo examined the relationhip between the repone and predictor
Gain and Phase Margins Based Delay Dependent Stability Analysis of Two- Area LFC System with Communication Delays
 Gain and Phae Margin Baed Delay Dependent Stability Analyi of Two- Area LFC Sytem with Communication Delay Şahin Sönmez and Saffet Ayaun Department of Electrical Engineering, Niğde Ömer Halidemir Univerity,
Inferences Based on Two Samples: Confidence Intervals and Tests of Hypothesis Chapter 7
 Inference Baed on Two Sample: Confidence Interval and Tet of Hypothei Chapter 7 7. a. b. μ x = μ = μ x = μ = 0 σ 4 σ x = = =.5 n 64 σ σ x = = =.375 n 64 3 c. μ = μ μ = 0 = x x σ σ 4 3 5 σ x x = + = + =
STUDY OF THE INFLUENCE OF CONVECTIVE EFFECTS IN INCIDENT RADIATIVE HEAT FLUX DENSITY MEASUREMENT UNCERTAINTY
 XIX IMEKO World Congre Fundamental and Applied Metrology September 6, 009, Libon, Portugal SUDY OF HE INFLUENCE OF CONVECIVE EFFECS IN INCIDEN RADIAIVE HEA FLUX DENSIY MEASUREMEN UNCERAINY L. Lage Martin,
PIPELINED DIVISION OF SIGNED NUMBERS WITH THE USE OF RESIDUE ARITHMETIC FOR SMALL NUMBER RANGE WITH THE PROGRAMMABLE GATE ARRAY
 POZNAN UNIVE RSITY OF TE CHNOLOGY ACADE MIC JOURNALS No 76 Electrical Engineering 03 Robert SMYK* Zenon ULMAN* Maciej CZYŻAK* PIPELINED DIVISION OF SIGNED NUMBERS WITH THE USE OF RESIDUE ARITHMETIC FOR
Comparison of independent process analytical measurements a variographic study
 WSC 7, Raivola, Ruia, 15-19 February, 010 Comparion of independent proce analytical meaurement a variographic tudy Atmopheric emiion Watewater Solid wate Pentti Minkkinen 1) Lappeenranta Univerity of Technology
Molecular Dynamics Simulations of Nonequilibrium Effects Associated with Thermally Activated Exothermic Reactions
 Original Paper orma, 5, 9 7, Molecular Dynamic Simulation of Nonequilibrium Effect ociated with Thermally ctivated Exothermic Reaction Jerzy GORECKI and Joanna Natalia GORECK Intitute of Phyical Chemitry,
STATISTICAL SIGNIFICANCE
 STATISTICAL SIGNIFICANCE EFFECT SIZE More to life than tatitical ignificance Reporting effect ize Turn out a lot of reearcher do not know what preciely p
Optimal Coordination of Samples in Business Surveys
 Paper preented at the ICES-III, June 8-, 007, Montreal, Quebec, Canada Optimal Coordination of Sample in Buine Survey enka Mach, Ioana Şchiopu-Kratina, Philip T Rei, Jean-Marc Fillion Statitic Canada New
7.2 INVERSE TRANSFORMS AND TRANSFORMS OF DERIVATIVES 281
 72 INVERSE TRANSFORMS AND TRANSFORMS OF DERIVATIVES 28 and i 2 Show how Euler formula (page 33) can then be ued to deduce the reult a ( a) 2 b 2 {e at co bt} {e at in bt} b ( a) 2 b 2 5 Under what condition
Codes Correcting Two Deletions
 1 Code Correcting Two Deletion Ryan Gabry and Frederic Sala Spawar Sytem Center Univerity of California, Lo Angele ryan.gabry@navy.mil fredala@ucla.edu Abtract In thi work, we invetigate the problem of
Moment of Inertia of an Equilateral Triangle with Pivot at one Vertex
 oment of nertia of an Equilateral Triangle with Pivot at one Vertex There are two wa (at leat) to derive the expreion f an equilateral triangle that i rotated about one vertex, and ll how ou both here.
The Use of MDL to Select among Computational Models of Cognition
 The Ue of DL to Select among Computational odel of Cognition In J. yung, ark A. Pitt & Shaobo Zhang Vijay Balaubramanian Department of Pychology David Rittenhoue Laboratorie Ohio State Univerity Univerity
Convex Hulls of Curves Sam Burton
 Convex Hull of Curve Sam Burton 1 Introduction Thi paper will primarily be concerned with determining the face of convex hull of curve of the form C = {(t, t a, t b ) t [ 1, 1]}, a < b N in R 3. We hall
Asymptotics of ABC. Paul Fearnhead 1, Correspondence: Abstract
 Aymptotic of ABC Paul Fearnhead 1, 1 Department of Mathematic and Statitic, Lancater Univerity Correpondence: p.fearnhead@lancater.ac.uk arxiv:1706.07712v1 [tat.me] 23 Jun 2017 Abtract Thi document i due
By Xiaoquan Wen and Matthew Stephens University of Michigan and University of Chicago
 Submitted to the Annal of Applied Statitic SUPPLEMENTARY APPENDIX TO BAYESIAN METHODS FOR GENETIC ASSOCIATION ANALYSIS WITH HETEROGENEOUS SUBGROUPS: FROM META-ANALYSES TO GENE-ENVIRONMENT INTERACTIONS
The Electric Potential Energy
 Lecture 6 Chapter 28 Phyic II The Electric Potential Energy Coure webite: http://aculty.uml.edu/andriy_danylov/teaching/phyicii New Idea So ar, we ued vector quantitie: 1. Electric Force (F) Depreed! 2.
Lecture 10 Filtering: Applied Concepts
 Lecture Filtering: Applied Concept In the previou two lecture, you have learned about finite-impule-repone (FIR) and infinite-impule-repone (IIR) filter. In thee lecture, we introduced the concept of filtering
EE 508 Lecture 16. Filter Transformations. Lowpass to Bandpass Lowpass to Highpass Lowpass to Band-reject
 EE 508 Lecture 6 Filter Tranformation Lowpa to Bandpa Lowpa to Highpa Lowpa to Band-reject Review from Lat Time Theorem: If the perimeter variation and contact reitance are neglected, the tandard deviation
Harris: Quantitative Chemical Analysis, Eight Edition CHAPTER 03: EXPERIMENTAL ERROR
 Harris: Quantitative Chemical Analysis, Eight Edition CHAPTER 03: EXPERIMENTAL ERROR Chapter 3. Experimental Error -There is error associated with every measurement. -There is no way to measure the true
Stochastic Optimization with Inequality Constraints Using Simultaneous Perturbations and Penalty Functions
 Stochatic Optimization with Inequality Contraint Uing Simultaneou Perturbation and Penalty Function I-Jeng Wang* and Jame C. Spall** The John Hopkin Univerity Applied Phyic Laboratory 11100 John Hopkin
Learning Multiplicative Interactions
 CSC2535 2011 Lecture 6a Learning Multiplicative Interaction Geoffrey Hinton Two different meaning of multiplicative If we take two denity model and multiply together their probability ditribution at each
Factor Analysis with Poisson Output
 Factor Analyi with Poion Output Gopal Santhanam Byron Yu Krihna V. Shenoy, Department of Electrical Engineering, Neurocience Program Stanford Univerity Stanford, CA 94305, USA {gopal,byronyu,henoy}@tanford.edu
03.1 Experimental Error
 03.1 Experimental Error Problems: 15, 18, 20 Dr. Fred Omega Garces Chemistry 251 Miramar College 1 Making a measurement In general, the uncertainty of a measurement is determined by the precision of the
 Pythagorean Triple Updated 08--5 Drlnoordzij@leennoordzijnl wwwleennoordzijme Content A Roadmap for generating Pythagorean Triple Pythagorean Triple 3 Dicuion Concluion 5 A Roadmap for generating Pythagorean
Compact finite-difference approximations for anisotropic image smoothing and painting
 CWP-593 Compact finite-difference approximation for aniotropic image moothing and painting Dave Hale Center for Wave Phenomena, Colorado School of Mine, Golden CO 80401, USA ABSTRACT Finite-difference
Question 1 Equivalent Circuits
 MAE 40 inear ircuit Fall 2007 Final Intruction ) Thi exam i open book You may ue whatever written material you chooe, including your cla note and textbook You may ue a hand calculator with no communication