Chapter 8: Sampling, Standardization, and Calibration
|
|
|
- Winifred Summers
- 5 years ago
- Views:
Transcription
1 Chapter 8: Sampling, Standardization, and Calibration
2 A chemical analysis uses only a small fraction of the available sample, the process of sampling is a very important operation. Knowing how much sample to collect and how to further subdivide the collected sample to obtain a laboratory sample is vital in the analytical process. Statistical methods are used to aid in the selection of a representative sample. The analytical sample must be processed in a dependable manner that maintains sample integrity without losing sample or introducing contaminants. Many laboratories use the automated sample handling methods.


3 8A Analytical Samples and Methods Types of Samples and Methods Quantitative methods are traditionally classified as gravimetric methods, volumetric methods, and instrumental methods. Other methods are based on the size of the sample and the level of the constituents. Sample Size Techniques for handling very small samples are quite different from those for treating macro samples.

 and 1 ppb are called trace constituents.")
4 Constituent Types In some cases, analytical methods are used to determine major constituents, which are those present in the range of 1 to 100% by mass. Species present in the range of 0.01 to 1% are usually termed minor constituents. Those present in amounts between 100 ppm (0.01%) and 1 ppb are called trace constituents. Components present in amounts lower than 1 ppb are usually considered to be ultratrace constituents.
 is nearly 50%.")
5 A general problem in trace procedures is that the reliability of results usually decreases dramatically with a decrease in analyte level. The relative standard deviation between laboratories increases as the level of analyte decreases. At the ultratrace level of 1 ppb, interlaboratory error (%RSD) is nearly 50%. At lower levels, the error approaches 100%. Figure 8-3 Inter-laboratory error as a function of analyte concentration.
6 Real Samples The analysis of real samples is complicated by the presence of the sample matrix. The matrix can contain species with chemical properties similar to the analyte. If the interferences are caused by extraneous species in the matrix, they are often called matrix effects. Such effects can be induced not only by the sample itself but also by the reagents and solvents used to prepare the samples for the determination. Samples are analyzed, but constituents or concentrations are determined.

7 8B Sampling The process by which a representative fraction is acquired from a material of interest is termed sampling. ( e.g. a few milliliters of water from a polluted lake) It is often the most difficult aspect of an analysis. Sampling for a chemical analysis necessarily requires the use of statistics because conclusions will be drawn about a much larger amount of material from the analysis of a small laboratory sample. 8B-1 Obtaining a Representative Sample The items chosen for analysis are often called sampling units or sampling increments. The collection of sampling units or increments is called the gross sample. For laboratory analysis, the gross sample is usually reduced in size and homogenized to create the laboratory sample. The composition of the gross sample and the laboratory sample must closely resemble the average composition of the total mass of material to be analyzed. Figure 8-4 Steps in obtaining a laboratory sample. The laboratory sample consists of a few grams to at most a few hundred grams. It may constitute as little as 1 part in of the bulk material.
8 Statistically, the goals of the sampling process are: 1. To obtain a mean analyte concentration that is an unbiased estimate of the population mean. This goal can be realized only if all members of the population have an equal probability of being included in the sample.. To obtain a variance in the measured analyte concentration that is an unbiased estimate of the population variance so that valid confidence limits can be found for the mean, and various hypothesis tests can be applied. This goal can be reached only if every possible sample is equally likely to be drawn. Both goals require obtaining a random sample. A randomization procedure may be used wherein the samples are assigned a number and then a sample to be tested is selected from a table of random numbers. For example, suppose our sample is to consist of 10 pharmaceutical tablets to be drawn from 1000 tablets off a production line. One way to ensure the sample is random is to choose the tablets to be tested from a table of random numbers. These can be conveniently generated from a random number table or from a spreadsheet as is shown in Figure 8-5. Here, we would assign each of the tablets a number from 1 to 1000 and use the sorted random numbers in column C of the spreadsheet to pick tablet 16, 33, 97, etc. for analysis.
] generates random numbers between 0")
9 Figure random numbers are generated from 1 to 1000 using a spreadsheet. The random number function in Excel [=RAND()] generates random numbers between 0 and 1.
10 8B- Sampling Uncertainties Systematic errors can be eliminated by exercising care, by calibration, and by the proper use of standards, blanks, and reference materials. Random errors, which are reflected in the precision of data, can generally be kept at an acceptable level by close control of the variables that influence the measurements. Errors due to invalid sampling are unique in the sense that they are not controllable by the use of blanks and standards or by closer control of experimental variables. For random and independent uncertainties, the overall standard deviation s o for an analytical measurement is related to the standard deviation of the sampling process s s and to the standard deviation of the method s m by the relationship s o = s s + s m An analysis of variance can reveal whether the between samples variation (sampling plus measurement variance) is significantly greater than the within samples variation (measurement variance). When s m s s /3, there is no point in trying to improve the measurement precision. This result suggests that, if the sampling uncertainty is large and cannot be improved, it is often a good idea to switch to a less precise but faster method of analysis so that more samples can be analyzed in a given length of time. Since the standard deviation of the mean is lower by a factor of N, taking more samples can improve precision.
11 8B-3 The Gross Sample Ideally, the gross sample is a miniature replica of the entire mass of material to be analyzed. It is the collection of individual sampling units. It must be representative of the whole in composition and in particle-size distribution. Size of the Gross Sample is determined by (1) the uncertainty that can be tolerated between the composition of the gross sample and that of the whole, () the degree of heterogeneity of the whole, and (3) the level of particle size at which heterogeneity begins. The number of particles, N, required in a gross sample ranges from a few particles to 10 1 particles. The magnitude of this number depends on the uncertainty that can be tolerated and how heterogeneous the material is. The need for large numbers of particles is not necessary for homogeneous gases and liquids. The laws of probability govern the composition of a gross sample removed randomly from a bulk of material.
12 As an idealized example, - let us presume that a pharmaceutical mixture contains just two types of particles: * type A particles containing the active ingredient and * type B particles containing only an inactive filler material. All particles are the same size. We wish to collect a gross sample that will allow us to determine the percentage of particles containing the active ingredient in the bulk material. --Assume that the probability of randomly drawing an A type particle is p and that of randomly drawing a B type particle is (1 - p). -- If N particles of the mixture are taken, the most probable value for the number of A type particles is pn, while the most probable number of B type part is (1 p)n. -- For such a binary population, the Bernoulli equation can be used to calculate the standard deviation of the number of A particles drawn, σa σ = Np(1 p) A The relative standard deviation σ r of drawing A type particles is, σ r σ A = Np = 1 p Np Thus, the number of particles needed is, Thus, for example, if 80% of the particles are type A (p 5 0.8) and the desired relative standard deviation is 1% (σ r = 0.01), the number of particles making up the gross sample should be N=1-0.8/0.8(0.01) = 500 N = 1 p pσ r
13 To determine the number of particles and thus what mass we should ensure that we have a sample with the overall average percent of active ingredient P with a sampling relative standard deviation of σ r N = p(1 d p)( d P P A B A B ) ( ) d σ r P The degree of heterogeneity as measured by P A - P B has a large influence on the number of particles required since N increases with the square of the difference in composition of the two components of the mixture. Rearranging the equation to calculate the relative standard deviation of sampling, σ r we get σ r = P A P P B d Ad d B p(1 N p) If we make the assumption that the sample mass m is proportional to the number of particles and the other quantities are constant, the product of m and σ r should be a constant. This constant K s is called the Ingamells sampling constant. K s = m (σ r 100) where the term σ r 100% is the percent relative standard deviation.
14 To simplify the problem of defining the mass of a gross sample of a multi-component mixture, assume that the sample is a hypothetical two-component mixture. The problem of variable particle size can be handled by calculating the number of particles that would be needed if the sample consisted of particles of a single size. The gross sample mass is then determined by taking into account the particle-size distribution. One approach is to calculate the necessary mass by assuming that all particles are the size of the largest. This procedure is not very efficient because it usually calls for removal of a larger mass of material than necessary. The mass of the sample increases directly as the volume (or as the cube of the particle diameter) so that reduction in the particle size of a given material has a large effect on the mass required for the gross sample.

15
16 Sampling Homogeneous Solutions of Liquids and Gases Well-mixed solutions of liquids and gases require only a very small sample because they are homogeneous down to the molecular level. Gases can be sampled by several methods. Ex., a sampling bag is simply opened and filled with the gas or gases can be trapped in a liquid or adsorbed onto the surface of a solid. Sampling Metals and Alloys Samples of metals and alloys are obtained by sawing, milling, or drilling. It is not safe to assume that chips of the metal removed from the surface are representative of the entire bulk. Solid from the interior must be sampled as well. With some materials, a representative sample can be obtained by sawing across the piece at random intervals.

17 Sampling Particulate Solids It is often difficult to obtain a random sample from a bulky particulate material. Random sampling can best be accomplished while the material is being transferred. Mechanical devices have been developed for handling many types of particulate matter. Figure 8-6 Sampling Particulate Solids
18 8B-4 Preparing a Laboratory Sample For heterogeneous solids, the mass of the gross sample may range from hundreds of grams to kilograms or more. Reduction of the gross sample to a finely ground and homogeneous laboratory sample, of at most a few hundred grams, is necessary. this process involves a cycle of operations that includes crushing and grinding, sieving, mixing, and dividing the sample (often into halves) to reduce its mass.
19
20 Number of Laboratory Samples The number, of samples, depends on the required confidence interval and the desired relative standard deviation of the method. If the sampling standard deviation σ s is known, we can use values of z from tables, to get: CIforµ = x ± zσ s N Usually, an estimate of σ s is used with t instead of z CIforµ = If we divide this term by the mean value x, we can calculate the relative uncertainty σ r that is tolerable at a given confidence level: x ± tss N σ r = ts s x N If we solve Equation 8-8 for the number of samples N, we obtain N = t σ r s s x

21
22 8 C Automated sample handling Automated sample handling can lead to higher throughput (more analyses per unit time), higher reliability, and lower costs than manual sample handling. Discrete (Batch) Methods These often mimic the operations that would be performed manually. Some discrete sample processors automate only the measurement step of the procedure or a few chemical steps and the measurement step. Continuous Flow Methods The sample is inserted into a flowing stream where a number of operations can be performed prior to transporting it to a flow-through detector. These methods can perform not only sample processing operations but also the final measurement step.
23 Two types of continuous flow analyzers are * the segmented flow analyzer and * the flow injection analyzer. The segmented flow analyzer divides the sample into discrete segments separated by gas bubbles. the gas bubbles provide barriers to prevent the sample from spreading out along the tube due to dispersion processes. Dispersion is a band-spreading or mixing phenomenon that results from the coupling of fluid flow with molecular diffusion. Diffusion is mass transport due to a concentration gradient. Figure 8-7 Segmented continuous flow analyzer. The segmented sample is shown in more detail in (b).the analyte concentration profiles at the sampler and at the detector are shown in (c). Normally the height of a sample peak is related to the concentration of the analyte.
24 Figure 8-8 Flow injection analyzer. Samples can be processed with FIA at rates varying from 60 to 300 samples per hour. The valve, shown in the load position, also has a second inject position shown by the dotted lines. When switched to the inject position, the stream containing the reagent flows through the sample loop. Sample and reagent are allowed to mix and react in the mixing coil before reaching the detector. In this case, the sample plug is allowed to disperse prior to reaching the detector (b). The resulting concentration profile (detector response) depends on the degree of dispersion.
25 8D Standardization and calibration - Calibration determines the relationship between the analytical response and the analyte concentration, which is usually determined by the use of chemical standards prepared from purified reagents. - To reduce interferences from other constituents in the sample matrix, called concomitants, standards are added to the analyte solution (internal standard methods or standard addition methods) or matrix matching or modification is done. - Almost all analytical methods require calibration with chemical standards. - Gravimetric methods and some coulometric methods are absolute methods that do not rely on calibration with chemical standards.
26 8D-1 Comparison with Standards Two types of comparison methods are: - direct comparison techniques - titration procedures. Direct Comparison - Some analytical procedures involve comparing a property of the analyte with standards such that the property being tested matches or nearly matches that of the standard. This is called null comparison or isomation methods. -Some modern instruments use a variation of this procedure to determine if an analyte concentration exceeds or is less than some threshold level. Such a comparator can be used to determine whether the threshold has been exceeded. -e.g. A comparator to determine whether aflatoxin levels in a sample exceeds the threshold level that would indicate a toxic situation.
27 Titrations: - Titrations are one of the most accurate of all analytical procedures. - In a titration, the analyte reacts with a standardized reagent (the titrant) in a known stoichiometric manner. - The amount of titrant is varied until chemical equivalence is reached as indicated by the color change of a chemical indicator or by the change in an instrument response. This is called the end point. - The amount of the standardized reagent needed to achieve chemical equivalence can then be related to the amount of analyte present by means of the stoichiometry. - Titration is thus a type of chemical comparison.
28 8D-- External Standard Calibration - A series of standard solutions is prepared separately from the sample. - The standards are used to establish the instrument calibration function, which is obtained from analysis of the instrument response as a function of the known analyte concentration. - The calibration function can be obtained graphically or in mathematical form. - Generally, a plot of instrument response versus known analyte concentrations is used to produce a calibration curve, sometimes called a working curve.
29 Figure 8-9 Calibration curve of absorbance versus analyte concentration for a series of standards. -The calibration curve is used in an inverse fashion to obtain the concentration of an unknown with an absorbance of The absorbance is located on the line, and then the concentration corresponding to that absorbance is obtained by extrapolating to the x-axis.
30 External Standard Calibration The Least-Squares Method Statistical methods, such as the method of least squares, are routinely used to find the mathematical equation describing the calibration function. Two assumptions are made: 1.There is actually a linear relationship between the measured response y (absorbance) and the standard analyte concentration x. Figure 8-10 The slope-intercept form of a straight line. The mathematical relationship that describes this assumption is called the regression model, which may be represented as y = mx + b where, b is the y intercept (the value of y when x is zero), and m is the slope of the line.. We also assume that any deviation of the individual points from the straight line arises from error in the measurement. That is, we assume there is no error in x values of the points (concentrations).
31 Whenever there is significant uncertainty in the x data, basic linear least-squares analysis may not give the best straight line in which case, a more complex correlation analysis may be used. It may be necessary to apply different weighting factors to the points and perform a weighted least-squares analysis. Finding the least-squares line The least-squares method finds the sum of the squares of the residuals SS resid and minimizes the sum using calculus. SS resid = N [ ] yi ( b + mxi ) i= 1
32 The slope and the intercept are defined as: where x i and y i are individual pairs of data for x and y, N is the number of pairs, and x and y are the average values for x and y. From these values, one can derive the (1) Slope of the line, () Intercept, N y x y x y y x x S N y y y y S N x x x x S i i i i i i xy i i i yy i i i xx = = = = = = ) )( ( ) ( ) ( ) ( ) ( S xy S xx m = mx y b =
33 (3) Standard deviation about regression (4) Standard deviation of the slope (5) Standard deviation of the intercept (6) Standard deviation for results obtained from the calibration curve xx c r c i i r i i i r b xx r m xx yy r S m y y N M m s s x x N s x x N x s s S s s N S m S s ) ( 1 1 ) /( ) ( 1 ) ( + + = = = = =
34 The standard deviation about regression, also called the standard error of the estimate or just the standard error, is a rough measure of the magnitude of a typical deviation from the regression line. s r = N i= 1 [ y ( b + mx )] i N i = SS N resid


35

36

37
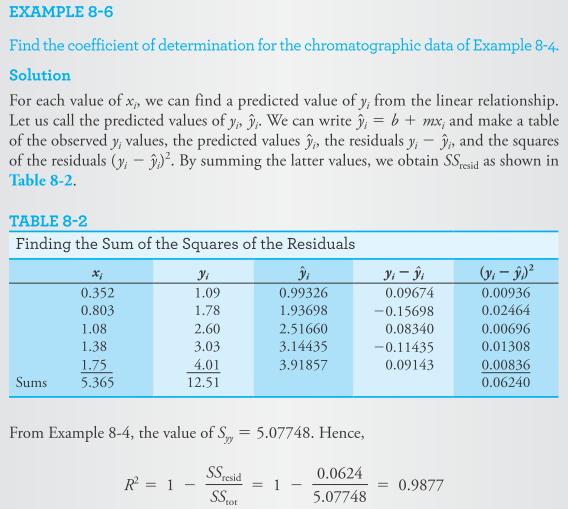
38 Interpretation of least-squares results The sum of the squares of the residuals, SS resid, measures the variation in the observed values of the dependent variable (y values) that are not explained by the presumed linear relationship between x and y. SS resid = N i= 1 [ y ( b + mx )] i i SS tot = S yy = ( y i y) = y i ( yi ) N The coefficient of determination (R ) measures the fraction of the observed variation in y that is explained by the linear relationship. SS resid R = 1 SS The difference between SS tot and SS resid is the sum of the squares due to regression, SS regr. tot SS R regr = SS = SS SS regr tot tot SS resid * A significant regression is one in which the variation in the y values due to the presumed linear relationship is large compared to that due to error (residuals). * The F value gives us an indication of the significance of the regression. When the regression is significant, a large value of F occurs.
39

40

41 Transformed Variables Linear least squares gives best estimates of the transformed variables, but these may not be optimal when transformed back to obtain estimates of the original parameters. For the original parameters, nonlinear regression methods may give better estimates.
42 Errors in External Standard Calibration When external standards are used, it is assumed that, when the same analyte concentration is present in the sample and in the standard, the same response will be obtained. The raw response from the instrument is usually not used. Instead, the raw analytical response is corrected by measuring a blank. The ideal blank is identical to the sample but without the analyte. A real blank is either a solvent blank, containing the same solvent in which the sample is dissolved, or a reagent blank, containing the solvent plus all the reagents used in sample preparation. Systematic errors can also occur during the calibration process. To avoid systematic errors in calibration, standards must be accurately prepared, and their chemical state must be identical to that of the analyte in the sample. The standards should be stable in concentration, at least during the calibration process. Random errors can also influence the accuracy of results obtained from calibration curves.

43 Figure 8-11 Shown here is a calibration curve with confidence limits. Measurements made near the center of the curve will give less uncertainty in analyte concentration than those made at the extremes.
44 Minimizing Errors in Analytical Procedures The overall accuracy and precision of an analysis is not limited to the measurement step and might instead be limited by factors such as sampling, sample preparation, and calibration. Separations Sample cleanup by separation methods is an important way to minimize errors from possible interferences in the sample matrix. Techniques such as filtration, precipitation, dialysis, solvent extraction, volatilization, ion exchange, and chromatography can be used. In most cases, separations may be the only way to eliminate an interfering specimen.
45 Saturation, Matrix Modification, and Masking *The saturation method involves adding the interfering species to all the samples, standards, and blanks so that the interference effect becomes independent of the original concentration of the interfering species in the sample. *A matrix modifier is a species, not itself an interfering species, added to samples, standards, and blanks in sufficient amounts to make the analytical response independent of the concentration of the interfering species. *Sometimes, a masking agent is added that reacts selectively with the interfering species to form a complex that does not interfere.
46 Dilution and Matrix Matching *The dilution method can sometimes be used if the interfering species produces no significant effect below a certain concentration level. *The matrix-matching method attempts to duplicate the sample matrix by adding the major matrix constituents to the standard and blank solutions. *Errors in procedures can be minimized by saturating with interfering species, by adding matrix modifiers or masking agents, by diluting the sample, or by matching the matrix of the sample.
47 Internal Standard Methods *An internal standard is a reference species, chemically and physically similar to the analyte, that is added to samples, standards, and blanks. *The ratio of the response of the analyte to that of the internal standard is plotted versus the concentration of analyte. *In the internal standard method, a known amount of a reference species is added to all the samples, standards, and blanks. *The response signal is then not the analyte signal itself but the ratio of the analyte signal to the reference species signal.
48 *A calibration curve is prepared where the y-axis is the ratio of responses and the x-axis is the analyte concentration in the standards as usual. *This method can compensate for certain types of errors if these influence both the analyte and the reference species to the same proportional extent. *The calibration curve plots the ratio of the analyte signal to the internal standard signal against the concentration of the analyte.

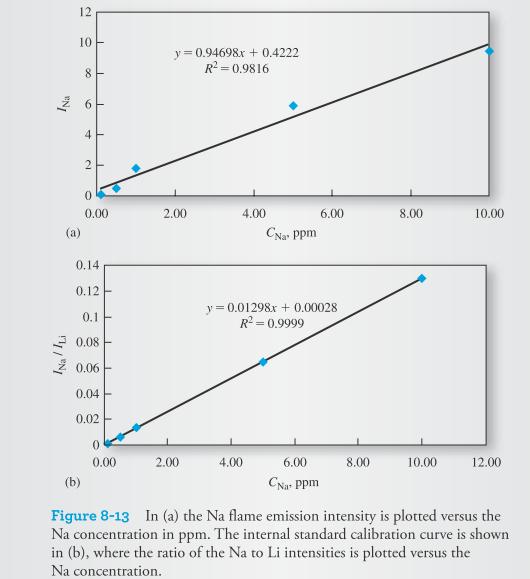
49 Figure 8-1 Illustration of the internal standard method.

50
51
52 Standard Addition Methods *The method of standard additions is used when it is difficult or impossible to duplicate the sample matrix. *A known amount of a standard solution of analyte is added to one portion of the sample. *The responses before and after the addition are measured and used to obtain the analyte concentration. *Alternatively, multiple additions are made to several portions of the sample. *The standard additions method assumes a linear response. *Linearity should always be confirmed, or the multiple additions method used to check linearity. *The method of standard additions is quite powerful so long as there is a good blank measurement so that extraneous species do not contribute to the analytical response. * Second, the calibration curve for the analyte must be linear in the sample matrix.
53

54
55 8E Figures of merit for analytical methods Analytical procedures are characterized by a number of figures of merit such as: - accuracy, precision, sensitivity, detection limit, and dynamic range. 8E-1 Sensitivity and Detection Limit The definition of sensitivity most often used is the calibration sensitivity, or the change in the response signal per unit change in analyte concentration. The calibration sensitivity is thus the slope of the calibration curve. The calibration sensitivity does not indicate what concentration differences can be detected. Noise in the response signals must be taken into account in order to be quantitative about what differences can be detected. For this reason, the term analytical sensitivity is sometimes used. The analytical sensitivity is the ratio of the calibration curve slope to the standard deviation of the analytical signal at a given analyte concentration. The analytical sensitivity is usually a strong function of concentration. The detection limit, DL, is the smallest concentration that can be reported with a certain level of confidence. Figure 8-14 Calibration curve of response R versus concentration c. The slope of the calibration curve is called the calibration sensitivity m. The detection limit, DL, designates the lowest concentration that can be
56 * Every analytical technique has a detection limit. * It is the analyte concentration that produces a response equal to k times the standard deviation of the blank σ b DL = ks m b - where k is called the confidence factor and m is the calibration sensitivity. The factor k is usually chosen to be or 3. A k value of corresponds to a confidence level of 9.1%, while a k value of 3 corresponds to a 98.3% confidence level. Linear Dynamic Range * The linear dynamic range of an analytical method most often refers to the concentration range over which the analyte can be determined using a linear calibration curve. * The lower limit is generally considered to be the detection limit. * The upper end is usually taken as the concentration at which the analytical signal or the slope of the calibration curve deviates by a specified amount. * Usually a deviation of 5% from linearity is considered the upper limit.
57 Quality Assurance of Analytical Results Control Charts * A control chart is a sequential plot of some quality characteristic that is important in quality assurance. * The chart also shows the statistical limits of variation, the upper control limit (UCL) and lower control limit (LCL), that are permissible for the characteristic being measured. 3σ 3σ UCL = µ + N LCL = µ + N Where µ is the population mean σ is the population standard deviation and N, number of replicates for each sample. Figure 8-15 A control chart for a modern analytical balance. As long as the mean mass remains between the LCL and the UCL, the balance is said to be in statistical control. Mass data were collected on twenty-four consecutive days for a g standard mass certified by the National Institute of Standards and Technology. On each day, five replicate determinations were made. From independent experiments, estimates of the population mean and standard deviation were found to be µ= g and σ= g, respectively. For the mean of five measurements, 3x0.0001/ 5 = Hence, the UCL value = g, and the LCL value = g.
58 Figure 8-16 A control chart for monitoring the concentration of benzoyl peroxide in a commercial acne preparation. The manufacturing process became out of statistical control with sample 83 and exhibited a systematic change in the mean concentration.
59 Validation Validation determines the suitability of an analysis for providing the sought-for information and can apply to samples, to methodologies, and to data. Validation is often done by the analyst, but it can also be done by supervisory personnel. There are several different ways to validate analytical methods. The most common methods include: analysis of standard reference materials when available, analysis by a different analytical method, analysis of spiked samples, and analysis of synthetic samples approximating the chemical composition of the test samples. Individual analysts and laboratories often must periodically demonstrate the validity of the methods and techniques used. Data validation is the final step before release of the results. This process starts with validating the samples and methods used. Then, the data are reported with statistically valid limits of uncertainty after a thorough check has been made to eliminate blunders in sampling and sample handling, mistakes in performing the analysis, errors in identifying samples, and mistakes in the calculations used.
60 Reporting Analytical Results Analytical results should be reported as the mean value and the standard deviation. Sometimes, the standard deviation of the mean is reported instead of that of the data A confidence interval for the mean, the interval and its confidence level should be explicitly reported. The results of various statistical tests on the data should also be reported when appropriate, as should the rejection of any outlying results along with the rejection criterion. Significant figures are quite important when reporting results and should be based on statistical evaluation of the data. Whenever possible graphical presentation should include error bars on the data points to indicate uncertainty.
61 Suggested Problems 8.4, 8.10, 8.13, 8.17, 8.0, 8-3
Glossary of Common Laboratory Terms
 Accuracy A measure of how close a measured value is to the true value. Assessed by means of percent recovery of spikes and standards. Aerobic Atmospheric or dissolved oxygen is available. Aliquot A measured
Uncertainty, Error, and Precision in Quantitative Measurements an Introduction 4.4 cm Experimental error
 Uncertainty, Error, and Precision in Quantitative Measurements an Introduction Much of the work in any chemistry laboratory involves the measurement of numerical quantities. A quantitative measurement
-However, this definition can be expanded to include: biology (biometrics), environmental science (environmetrics), economics (econometrics).
, environmental science (environmetrics), economics (econometrics).") Chemometrics Application of mathematical, statistical, graphical or symbolic methods to maximize chemical information. -However, this definition can be expanded to include: biology (biometrics), environmental
Chemometrics Application of mathematical, statistical, graphical or symbolic methods to maximize chemical information. -However, this definition can be expanded to include: biology (biometrics), environmental
CHEM 3420 /7420G Instrumental Analysis
 CHEM 3420 /7420G Instrumental Analysis Prof. Brian Gibney 2411 Ingersoll bgibney@brooklyn.cuny.edu Course Introduction Prof. Brian R. Gibney B.S. Chemistry (ACS Certified) Ph.D. Chemistry Brooklyn College,
Protocol for the design, conducts and interpretation of collaborative studies (Resolution Oeno 6/2000)
") Protocol for the design, conducts and interpretation of collaborative studies (Resolution Oeno 6/2000) INTRODUCTION After a number of meetings and workshops, a group of representatives from 27 organizations
Protocol for the design, conducts and interpretation of collaborative studies (Resolution Oeno 6/2000) INTRODUCTION After a number of meetings and workshops, a group of representatives from 27 organizations
The Theory of HPLC. Quantitative and Qualitative HPLC
 The Theory of HPLC Quantitative and Qualitative HPLC i Wherever you see this symbol, it is important to access the on-line course as there is interactive material that cannot be fully shown in this reference
OF ANALYSIS FOR DETERMINATION OF PESTICIDES RESIDUES IN FOOD (CX/PR 15/47/10) European Union Competence European Union Vote
 European Union Competence European Union Vote") 1 April 2015 European Union s CODEX COMMITTEE ON PESTICIDE RESIDUES 47 th Session Beijing, China, 13 18 April 2015 AGENDA ITEM 8 PROPOSED DRAFT GUIDELINES ON PERFORMANCE CRITERIA SPECIFIC FOR METHODS OF
1 April 2015 European Union s CODEX COMMITTEE ON PESTICIDE RESIDUES 47 th Session Beijing, China, 13 18 April 2015 AGENDA ITEM 8 PROPOSED DRAFT GUIDELINES ON PERFORMANCE CRITERIA SPECIFIC FOR METHODS OF
Chapter 5. Errors in Chemical Analysis 熊同銘.
 Chapter 5 Errors in Chemical Analysis 熊同銘 tmhsiung@gmail.com http://www.chem.ntou.edu.tw/ Slide 1 of 19 Contents in Chapter 5 5.1 Accuracy, Precision and Bias 5.2 Types of Errors in Experimental Data 5.3
Method Validation. Role of Validation. Two levels. Flow of method validation. Method selection
 Role of Validation Method Validation An overview Confirms the fitness for purpose of a particular analytical method. ISO definition: Conformation by examination and provision of objective evidence that
Statistics: Error (Chpt. 5)
") Statistics: Error (Chpt. 5) Always some amount of error in every analysis (How much can you tolerate?) We examine error in our measurements to know reliably that a given amount of analyte is in the sample
Statistics: Error (Chpt. 5) Always some amount of error in every analysis (How much can you tolerate?) We examine error in our measurements to know reliably that a given amount of analyte is in the sample
Analytical Performance & Method. Validation
 Analytical Performance & Method Ahmad Aqel Ifseisi Assistant Professor of Analytical Chemistry College of Science, Department of Chemistry King Saud University P.O. Box 2455 Riyadh 11451 Saudi Arabia Building:
CEM 333 Instrumental Analysis
 CEM 333 Instrumental Analysis Simon J. Garrett Room: CEM 234 Phone: 355 9715 ext 208 E-mail: garrett@cem.msu.edu Lectures: Tuesday, Thursday 9:00-9:50 am Room 136 Office Hours: Tuesdays 10:00-11:00 am
Source: Chapter 5: Errors in Chemical Analyses
 Source: Chapter 5: Errors in Chemical Analyses Measurements invariably involve errors and uncertainties. it is impossible to perform a chemical analysis that is totally free of errors or uncertainties
Basic Statistics. 1. Gross error analyst makes a gross mistake (misread balance or entered wrong value into calculation).
.") Basic Statistics There are three types of error: 1. Gross error analyst makes a gross mistake (misread balance or entered wrong value into calculation). 2. Systematic error - always too high or too low
Basic Statistics There are three types of error: 1. Gross error analyst makes a gross mistake (misread balance or entered wrong value into calculation). 2. Systematic error - always too high or too low
ALLOWAY METHOD OUTLINE
 ALLOWAY METHOD OUTLINE Standard Laboratory Method SM4500-Cl -G Parameter Residual Chlorine & Free Chlorine Method DPD Colorimetric Test Kit Date Issued Originator: Section Supervisor: QA Manager Date:
Instrumental methods of analysis
 Instrumental methods of analysis By Dr Hisham Ezzat Abdellatef Prof. of Analytical Chemistry Background: Analytical Chemistry: The Science of Chemical Measurements. Analyte: The compound or chemical species
Harris: Quantitative Chemical Analysis, Eight Edition CHAPTER 03: EXPERIMENTAL ERROR
 Harris: Quantitative Chemical Analysis, Eight Edition CHAPTER 03: EXPERIMENTAL ERROR Chapter 3. Experimental Error -There is error associated with every measurement. -There is no way to measure the true
FUNDAMENTAL CONCEPTS IN MEASUREMENT & EXPERIMENTATION (continued) Measurement Errors and Uncertainty:
 Measurement Errors and Uncertainty:") FUNDAMENTAL CNCEPTS N MEASUREMENT & EXPERMENTATN (continued) Measurement Errors and Uncertainty: The Error in a measurement is the difference between the Measured Value and the True Value of the Measurand.
FUNDAMENTAL CNCEPTS N MEASUREMENT & EXPERMENTATN (continued) Measurement Errors and Uncertainty: The Error in a measurement is the difference between the Measured Value and the True Value of the Measurand.
EXPERIMENT 30A1: MEASUREMENTS. Learning Outcomes. Introduction. Experimental Value - True Value. 100 True Value
 1 Learning Outcomes EXPERIMENT 30A1: MEASUREMENTS Upon completion of this lab, the student will be able to: 1) Use various common laboratory measurement tools such as graduated cylinders, volumetric flask,
ASEAN GUIDELINES FOR VALIDATION OF ANALYTICAL PROCEDURES
 ASEAN GUIDELINES FOR VALIDATION OF ANALYTICAL PROCEDURES Adopted from ICH Guidelines ICH Q2A: Validation of Analytical Methods: Definitions and Terminology, 27 October 1994. ICH Q2B: Validation of Analytical
Harris: Quantitative Chemical Analysis, Eight Edition CHAPTER 03: EXPERIMENTAL ERROR
 Harris: Quantitative Chemical Analysis, Eight Edition CHAPTER 03: EXPERIMENTAL ERROR Chapter 3. Experimental Error -There is error associated with every measurement. -There is no way to measure the true
Application of mathematical, statistical, graphical or symbolic methods to maximize chemical information.
 Application of mathematical, statistical, graphical or symbolic methods to maximize chemical information. -However, this definition can be expanded to include: biology (biometrics), environmental science
VALIDATION OF A UPLC METHOD FOR A BENZOCAINE, BUTAMBEN, AND TETRACAINE HYDROCHLORIDE TOPICAL SOLUTION
 VALIDATION OF A UPLC METHOD FOR A BENZOCAINE, BUTAMBEN, AND TETRACAINE HYDROCHLORIDE TOPICAL SOLUTION Andrew J. Aubin and Tanya L. Jenkins Waters Corporation, Milford, MA, USA INTRODUCTION Benzocaine (4-Aminobenzoic
How Measurement Error Affects the Four Ways We Use Data
 Measurement error is generally considered to be a bad thing, and yet there is very little written about how measurement error affects the way we use our measurements. This column will consider these effects
Part I. Experimental Error
 Part I. Experimental Error 1 Types of Experimental Error. There are always blunders, mistakes, and screwups; such as: using the wrong material or concentration, transposing digits in recording scale readings,
Assay Transfer from HPLC to UPLC for Higher Analysis Throughput
 MAY 2005 SEPARATION SCIENCE REDEFINED 31 Assay Transfer from HPLC to UPLC for Higher Analysis Throughput A typical HPLC assay was transferred and optimized for a Waters ACQUITY UPLC system to achieve both
Validation of an Analytical Method
 Validation of an Analytical Method Refer to: ICH Guideline Q2(R1), Validation of Analytical Procedures: Teaxt andmethodology. Introduction All major laboratories eg. in the industry operates with clearly
Automating Wet Chemical Analysis. William Lipps Market Specialist for Water Analyzer Products December 11, 2008
 Automating Wet Chemical Analysis William Lipps Market Specialist for Water Analyzer Products December 11, 2008 The advantages of automating wet chemical analysis. Save time Decrease cost Improve quality
CHEM 334 Quantitative Analysis Laboratory
 Calibration of Volumetric Glassware Introduction Volumetric glassware is a class of glass vessels that are calibrated to contain or deliver certain volumes of substances. Graduated cylinders, pipettes
Chemistry 3200 High Performance Liquid Chromatography: Quantitative Determination of Headache Tablets
 Chemistry 3200 High Performance Liquid Chromatography: Quantitative Determination of Headache Tablets Liquid chromatography was developed by Tswett in early 1900 s and was shown to be a powerful separation
ANALYSIS OF LOW DENSITY PARTICLES USING DIFFERENTIAL CENTRIFUGAL SEDIMENTATION
 ANALYSIS OF LOW DENSITY PARTICLES USING DIFFERENTIAL CENTRIFUGAL SEDIMENTATION Conventional Centrifugal Methods Centrifugal sedimentation of particles suspended in a fluid is a well known method (1, 2)
Schedule. Draft Section of Lab Report Monday 6pm (Jan 27) Summary of Paper 2 Monday 2pm (Feb 3)
 Summary of Paper 2 Monday 2pm (Feb 3)") Schedule Assignment Due Date Draft Section of Lab Report Monday 6pm (Jan 27) Quiz for Lab 2 Peer Review of Draft Complete Lab Report 1 Tuesday 9:30am Wednesday 6pm Friday 6pm Summary of Paper 2 Monday
Schedule Assignment Due Date Draft Section of Lab Report Monday 6pm (Jan 27) Quiz for Lab 2 Peer Review of Draft Complete Lab Report 1 Tuesday 9:30am Wednesday 6pm Friday 6pm Summary of Paper 2 Monday
429 LIGHT DIFFRACTION MEASUREMENT OF PARTICLE SIZE
 Search USP29 429 LIGHT DIFFRACTION MEASUREMENT OF PARTICLE SIZE Light diffraction is one of the most widely used techniques for measuring the size of a wide range of particles from very fine to very coarse.
Chapter 13. Titrations in Analytical Chemistry
 Chapter 13 Titrations in Analytical Chemistry Titrations in Analytical Chemistry Titration methods are based on determining the quantity of a reagent of known concentration that is required to react completely
Rapid Screening and Confirmation of Melamine Residues in Milk and Its Products by Liquid Chromatography Tandem Mass Spectrometry
 Rapid Screening and Confirmation of Melamine Residues in Milk and Its Products by Liquid Chromatography Tandem Mass Spectrometry Application Note Food Authors Jianqiu Mi, Zhengxiang Zhang, Zhixu Zhang,
GRAVIMETRIC ANALYSIS
 GRAVIMETRIC ANALYSIS Gravimetric methods are quantitative methods in which the mass of the analyte or some compound that is chemically related to the analyte is determined. What are the steps in a gravimetric
Analytical Chemistry I CHEM247. Introduction Lecture. Mehmet U. Garip Office : AS 348 Tel:
 Mehmet U. Garip Office : AS 348 Tel: 1064 e-mail: mehmet.garip@emu.edu.tr 2012-13 FALL Monday Tuesday Wednesday Thursday Friday 08.30 09.20 09.30 10.20 10.30 11.20 11.30 12.20 CMS213 CMS213 ASA ASA OFFICE
ADVANCED ANALYTICAL LAB TECH (Lecture) CHM
 CHM") ADVANCED ANALYTICAL LAB TECH (Lecture) CHM 4130-0001 Spring 2013 Professor Andres D. Campiglia Textbook: Principles of Instrumental Analysis Skoog, Holler and Crouch, 5 th Edition, 6 th Edition or newest
ADVANCED ANALYTICAL LAB TECH (Lecture) CHM 4130-0001 Spring 2013 Professor Andres D. Campiglia Textbook: Principles of Instrumental Analysis Skoog, Holler and Crouch, 5 th Edition, 6 th Edition or newest
A New On-line Cyanide Analyzer for Measurement of Cyanide in Hydrometallurgical Processing of Precious Metal Ores
 Application Note 37890312 A New On-line Cyanide Analyzer for Measurement of Cyanide in Hydrometallurgical Processing of Precious Metal Ores Keywords CNSolution 9310 On-line Cyanide Analyzer Cyanidation
Measurements Chapter 3
 Measurements Chapter 3 Analytical Chemistry is the science of chemical measurement. Its object is the generation, treatment and evaluation of signals from which information is obtained on the composition
Test Method Development and Validation as Pertaining to Microtrac Particle Size Measuring Instruments
 Test Method Development and Validation as Pertaining to Microtrac Particle Size Measuring Instruments Philip E. Plantz, PhD Application Note SL AN 17 Rev B Provided By: Microtrac, Inc. Particle Size Measuring
Copyright ENCO Laboratories, Inc. II. Quality Control. A. Introduction
 II. Quality Control A. Introduction ENCO adheres to strict quality control practices in order to assure our clients that the data provided are accurate and reliable. We are required by the EPA to analyze
Chapter 3 Electrochemical methods of Analysis-Potentiometry
 Chapter 3 Electrochemical methods of Analysis-Potentiometry Electroanalytical chemistry Contents Introduction Galvanic and electrolytic cells Salt bridge Electrode potential and cell potential Indicator
Volumetric Analysis: Analysis of antacid tablets Analysis of Cl - concentrations in IV solutions
 Volumetric Analysis: Analysis of antacid tablets Analysis of Cl - concentrations in IV solutions OBJECTIVE: The goals of this experiment are to learn titration concepts and techniques. SKILLS: Titration,
Basic Analysis of Data
 Basic Analysis of Data Department of Chemical Engineering Prof. Geoff Silcox Fall 008 1.0 Reporting the Uncertainty in a Measured Quantity At the request of your supervisor, you have ventured out into
SWGDRUG GLOSSARY. Independent science-based organization that has the authority to grant
 SWGDRUG GLOSSARY These definitions were developed and adopted by the SWGDRUG Core Committee from a variety of sources including The United Nations Glossary of Terms for Quality Assurance and Good Laboratory
IB Physics STUDENT GUIDE 13 and Processing (DCP)
") IB Physics STUDENT GUIDE 13 Chapter Data collection and PROCESSING (DCP) Aspect 1 Aspect Aspect 3 Levels/marks Recording raw data Processing raw data Presenting processed data Complete/ Partial/1 Not at
IB Physics STUDENT GUIDE 13 Chapter Data collection and PROCESSING (DCP) Aspect 1 Aspect Aspect 3 Levels/marks Recording raw data Processing raw data Presenting processed data Complete/ Partial/1 Not at
University of Massachusetts Boston - Chemistry Department Physical Chemistry Laboratory Introduction to Maximum Probable Error
 University of Massachusetts Boston - Chemistry Department Physical Chemistry Laboratory Introduction to Maximum Probable Error Statistical methods describe random or indeterminate errors in experimental
1.0 Basic Concepts and Definitions
 1.0 Basic Concepts and Definitions signals, noise, and the signal-to-noise ratio (SNR or S/N) definition of basic terms calibration graph terms types of measurements hypothesis testing general observations
Chemistry Instrumental Analysis Lecture 31. Chem 4631
 Chemistry 4631 Instrumental Analysis Lecture 31 High Performance Liquid Chromatography (HPLC) High Performance Liquid Chromatography (HPLC) High Performance Liquid Chromatography (HPLC) Solvent Delivery
Statistical quality control (SQC)
") Statistical quality control (SQC) The application of statistical techniques to measure and evaluate the quality of a product, service, or process. Two basic categories: I. Statistical process control (SPC):
Statistical quality control (SQC) The application of statistical techniques to measure and evaluate the quality of a product, service, or process. Two basic categories: I. Statistical process control (SPC):
Revision: 11 (MBAS) ALLOWAY METHOD OUTLINE. Standard Laboratory Method:
 ALLOWAY METHOD OUTLINE. Standard Laboratory Method:") ALLOWAY METHOD OUTLINE Standard Laboratory Method: SM Parameter: Methylene Blue Method: Colorimetric Reporting Level: Reference: 0.05 mg/l Standard Methods for the Examination Of Water and Wastewater;
ALLOWAY METHOD OUTLINE Standard Laboratory Method: SM Parameter: Methylene Blue Method: Colorimetric Reporting Level: Reference: 0.05 mg/l Standard Methods for the Examination Of Water and Wastewater;
Chemistry Gas Chromatography: Separation of Volatile Organics
 Chemistry 3200 Gas chromatography (GC) is an instrumental method for separating volatile compounds in a mixture. A small sample of the mixture is injected onto one end of a column housed in an oven. The
Experiment 1 - Mass, Volume and Graphing
 Experiment 1 - Mass, Volume and Graphing In chemistry, as in many other sciences, a major part of the laboratory experience involves taking measurements and then calculating quantities from the results
Quality Assurance is what we do to get the right answer for our purpose FITNESS FOR PURPOSE
 Quality Assurance is what we do to get the right answer for our purpose FITNESS FOR PURPOSE Use objectives: state purpose for which results will be used. Specifications: How good should the numbers be
Topic 2 Measurement and Calculations in Chemistry
 Topic Measurement and Calculations in Chemistry Nature of Measurement Quantitative observation consisting of two parts. number scale (unit) Examples 0 grams 6.63 10 34 joule seconds The Fundamental SI
MECHANICAL ENGINEERING SYSTEMS LABORATORY
 MECHANICAL ENGINEERING SYSTEMS LABORATORY Group 02 Asst. Prof. Dr. E. İlhan KONUKSEVEN FUNDAMENTAL CONCEPTS IN MEASUREMENT AND EXPERIMENTATION MEASUREMENT ERRORS AND UNCERTAINTY THE ERROR IN A MEASUREMENT
Quantitative Analysis of Caffeine in Energy Drinks by High Performance Liquid Chromatography
 Quantitative Analysis of Caffeine in Energy Drinks by High Performance Liquid Chromatography CHEM 329 Professor Vogt TA: Fahad Hasan Allison Poget Date Performed: April 5, 2016 Date Submitted: April 12,
Atmospheric Analysis Gases. Sampling and analysis of gaseous compounds
 Atmospheric Analysis Gases Sampling and analysis of gaseous compounds Introduction - External environment (ambient air) ; global warming, acid rain, introduction of pollutants, etc - Internal environment
If you like us, please share us on social media. The latest UCD Hyperlibrary newsletter is now complete, check it out.
 Sign In Forgot Password Register username username password password Sign In If you like us, please share us on social media. The latest UCD Hyperlibrary newsletter is now complete, check it out. ChemWiki
On the use of Deming and quadratic calibrations in analytical chemistry
 On the use of Deming and quadratic calibrations in analytical chemistry Henry Foden Rand Water October 09-2013 PO Box 3526, Vereeniging, 1930, Republic of South Africa e-mail: hfoden@randwater.co.za Phone:
ENVIRONMENTAL CHEMICAL ANALYSIS
 ENVIRONMENTAL CHEMICAL ANALYSIS ANALYSIS Identification and Quantification CHEMICAL The Analyte: A Discrete Chemical Species or A Collection of Related Chemical Species (i.e., An Aggregate) ENVIRONMENTAL
IENG581 Design and Analysis of Experiments INTRODUCTION
 Experimental Design IENG581 Design and Analysis of Experiments INTRODUCTION Experiments are performed by investigators in virtually all fields of inquiry, usually to discover something about a particular
Analytical Chemistry. The Analytical Process Sample Preparation. Dr. A. Jesorka, 6112,
 Analytical Chemistry The Analytical Process Sample Preparation Dr. A. Jesorka, 6112, aldo@chalmers.se Lecture Summary 1. The analytical process. More than measurement! Several steps from problem to report.
Chapter 4: Verification of compendial methods
 Chapter 4: Verification of compendial methods Introduction In order to ensure accurate and reliable test results, the quality control laboratory (QCL) needs to use analytical methods (and accompanying
Glossary. The ISI glossary of statistical terms provides definitions in a number of different languages:
 Glossary The ISI glossary of statistical terms provides definitions in a number of different languages: http://isi.cbs.nl/glossary/index.htm Adjusted r 2 Adjusted R squared measures the proportion of the
Lecture 3. - all digits that are certain plus one which contains some uncertainty are said to be significant figures
 Lecture 3 SIGNIFICANT FIGURES e.g. - all digits that are certain plus one which contains some uncertainty are said to be significant figures 10.07 ml 0.1007 L 4 significant figures 0.10070 L 5 significant
Simple Linear Regression
 Simple Linear Regression ST 430/514 Recall: A regression model describes how a dependent variable (or response) Y is affected, on average, by one or more independent variables (or factors, or covariates)
CHAPTER 4 VARIABILITY ANALYSES. Chapter 3 introduced the mode, median, and mean as tools for summarizing the
 CHAPTER 4 VARIABILITY ANALYSES Chapter 3 introduced the mode, median, and mean as tools for summarizing the information provided in an distribution of data. Measures of central tendency are often useful
Abstract: An minimalist overview of chromatography for the person who would conduct chromatographic experiments, but not design experiments.
 Chromatography Primer Abstract: An minimalist overview of chromatography for the person who would conduct chromatographic experiments, but not design experiments. At its heart, chromatography is a technique
What is measurement uncertainty?
 What is measurement uncertainty? What is measurement uncertainty? Introduction Whenever a measurement is made, the result obtained is only an estimate of the true value of the property being measured.
Experiment 1 (Part A): Plotting the Absorption Spectrum of Iron (II) Complex with 1,10- Phenanthroline
: Plotting the Absorption Spectrum of Iron (II) Complex with 1,10- Phenanthroline") Experiment (Part A): Plotting the Absorption Spectrum of Iron (II) Complex with,0- Phenanthroline Background The first step of an analytical spectrophotometric procedure for quantitative determination
Experiment (Part A): Plotting the Absorption Spectrum of Iron (II) Complex with,0- Phenanthroline Background The first step of an analytical spectrophotometric procedure for quantitative determination
Mass Transfer Operations I Prof. Bishnupada Mandal Department of Chemical Engineering Indian Institute of Technology, Guwahati
 Mass Transfer Operations I Prof. Bishnupada Mandal Department of Chemical Engineering Indian Institute of Technology, Guwahati Module - 5 Distillation Lecture - 5 Fractional Distillation Welcome to the
UNIVERSITY OF CAMBRIDGE INTERNATIONAL EXAMINATIONS General Certifi cate of Education Advanced Level
 *3046788947* UNIVERSITY OF CAMBRIDGE INTERNATIONAL EXAMINATIONS General Certifi cate of Education Advanced Level CHEMISTRY 9701/51 Paper 5 Planning, Analysis and Evaluation October/November 2013 1 hour
Math Precalculus I University of Hawai i at Mānoa Spring
 Math 135 - Precalculus I University of Hawai i at Mānoa Spring - 2014 Created for Math 135, Spring 2008 by Lukasz Grabarek and Michael Joyce Send comments and corrections to lukasz@math.hawaii.edu Contents
MOLEBIO LAB #4: Using a Spectrophotometer
 Introduction: Spectrophotometry MOLEBIO LAB #4: Using a Spectrophotometer Many kinds of molecules interact with or absorb specific types of radiant energy in a predictable fashion. For example, when while
Application Note. Abstract. Introduction. Experimental-Instrument Conditions. By: Anne Jurek
 Automated Handling Techniques for the Analysis of Elevated Volatile Organic Compound (VOC) Concentrations in Soils Utilizing the Atomx Concentrator/Multimatrix Autosampler. Application Note By: Anne Jurek
CHAPTER EIGHT Linear Regression
 7 CHAPTER EIGHT Linear Regression 8. Scatter Diagram Example 8. A chemical engineer is investigating the effect of process operating temperature ( x ) on product yield ( y ). The study results in the following
MAT2377. Rafa l Kulik. Version 2015/November/26. Rafa l Kulik
 MAT2377 Rafa l Kulik Version 2015/November/26 Rafa l Kulik Bivariate data and scatterplot Data: Hydrocarbon level (x) and Oxygen level (y): x: 0.99, 1.02, 1.15, 1.29, 1.46, 1.36, 0.87, 1.23, 1.55, 1.40,
TOPIC 3: READING AND REPORTING NUMERICAL DATA
 Page 1 TOPIC 3: READING AND REPORTING NUMERICAL DATA NUMERICAL DATA 3.1: Significant Digits; Honest Reporting of Measured Values Why report uncertainty? That is how you tell the reader how confident to
Statistical Analysis of Engineering Data The Bare Bones Edition. Precision, Bias, Accuracy, Measures of Precision, Propagation of Error
 Statistical Analysis of Engineering Data The Bare Bones Edition (I) Precision, Bias, Accuracy, Measures of Precision, Propagation of Error PRIOR TO DATA ACQUISITION ONE SHOULD CONSIDER: 1. The accuracy
Measurement uncertainty and legal limits in analytical measurements
 UNCERTAINTY Measurement uncertainty and legal limits in analytical measurements MIRELLA BUZOIANU, Reference Materials Laboratory, National Institute of Metrology (INM), Bucharest, Romania 1 Introduction
DETERMINATION OF DRUG RELEASE DURING DISSOLUTION OF NICORANDIL IN TABLET DOSAGE FORM BY USING REVERSE PHASE HIGH PERFORMANCE LIQUID CHROMATOGRAPHY
 CHAPTER 9 DETERMINATION OF DRUG RELEASE DURING DISSOLUTION OF NICORANDIL IN TABLET DOSAGE FORM BY USING REVERSE PHASE HIGH PERFORMANCE LIQUID CHROMATOGRAPHY CHAPTER 9 Determination of drug release during
Direct Measurement of Metallic Impurities in 20% Ammonium Hydroxide by 7700s/7900 ICP-MS
 Direct Measurement of Metallic Impurities in 20% Ammonium Hydroxide by 7700s/7900 ICP-MS Application Note Semiconductor Authors Junichi Takahashi Agilent Technologies Tokyo, Japan Abstract Ammonium hydroxide
CHEMICAL KINETICS E + 2B 2C + D (1)
") CHEMICAL KINETICS Chemical kinetics is the branch of chemistry that is concerned with the study of the rates and mechanisms of chemical reactions. The rate of a reaction is a measure of its speed. Consider
CHEMICAL KINETICS Chemical kinetics is the branch of chemistry that is concerned with the study of the rates and mechanisms of chemical reactions. The rate of a reaction is a measure of its speed. Consider
Citric Acid Analysis L-6-1. MOISTURE (Karl Fischer)
") Citric Acid Analysis L-6-1 MOISTURE (Karl Fischer) PRINCIPLE SCOPE The sample is dissolved in a mixture of methanol and formamide (50:50 v/v) and then titrated with standardized Karl Fischer reagent. The
Citric Acid Analysis L-6-1 MOISTURE (Karl Fischer) PRINCIPLE SCOPE The sample is dissolved in a mixture of methanol and formamide (50:50 v/v) and then titrated with standardized Karl Fischer reagent. The
CHEM Experiment Five Gas Chromatographic Analysis Of A Phenolic Extract. Objectives:
 CHEM 3281 Experiment Five Gas Chromatographic Analysis Of A Phenolic Extract Objectives: The objectives of this experiment are: 1. to evaluate the fundamental parameters of gas chromatography; 2. to identify
Practical Statistics for the Analytical Scientist Table of Contents
 Practical Statistics for the Analytical Scientist Table of Contents Chapter 1 Introduction - Choosing the Correct Statistics 1.1 Introduction 1.2 Choosing the Right Statistical Procedures 1.2.1 Planning
Structural characterization begins with a purity check!
 Structural characterization begins with a purity check! Refractive Index Melting Point Elemental Analysis (EA) Thin Layer Chromatography (TLC) High Performance Liquid Chromatography (HPLC) Course: 59-320
Variance. Standard deviation VAR = = value. Unbiased SD = SD = 10/23/2011. Functional Connectivity Correlation and Regression.
 10/3/011 Functional Connectivity Correlation and Regression Variance VAR = Standard deviation Standard deviation SD = Unbiased SD = 1 10/3/011 Standard error Confidence interval SE = CI = = t value for
22 Approximations - the method of least squares (1)
") 22 Approximations - the method of least squares () Suppose that for some y, the equation Ax = y has no solutions It may happpen that this is an important problem and we can t just forget about it If we
22 Approximations - the method of least squares () Suppose that for some y, the equation Ax = y has no solutions It may happpen that this is an important problem and we can t just forget about it If we
Chemistry Calibration of a Pipet and Acid Titration
 Chemistry 3200 Today you are given a chance to brush up on some of the techniques that you will be using during the remainder of the semester. Lab grades will be based on obtaining the correct answer in
Analytical Chemistry-I
 MODEL ANSWER M. Sc. (First Semester) 2013, CHEMISTRY (AS-2142) Analytical Chemistry-I SECTION: A (2 marks) 1. (i) UV-visible spectrophotometer (ii) Atomic absorption spectrometer (iii) Nuclear magnetic
Error Analysis and Graph Drawing
 Error Analysis and Graph Drawing I. Introduction: I.1 It is impossible to do an experimental measurement with perfect accuracy. There is always an uncertainty associated with any measured quantity in an
Approximations - the method of least squares (1)
") Approximations - the method of least squares () In many applications, we have to consider the following problem: Suppose that for some y, the equation Ax = y has no solutions It could be that this is an
Approximations - the method of least squares () In many applications, we have to consider the following problem: Suppose that for some y, the equation Ax = y has no solutions It could be that this is an
atomic absorption spectroscopy general can be portable and used in-situ preserves sample simpler and less expensive
 Chapter 9: End-of-Chapter Solutions 1. The following comparison provides general trends, but both atomic absorption spectroscopy (AAS) and atomic absorption spectroscopy (AES) will have analyte-specific
Method Transfer between HPLC and UHPLC Instruments Equipment-related challenges and solutions
 Method Transfer between HPLC and UHPLC Instruments Equipment-related challenges and solutions Today, ultra-high-performance liquid chromatography (UHPLC) has taken a firm foothold in the analytical laboratory.
The Importance of Area and Retention Time Precision in Gas Chromatography Technical Note
 The Importance of Area and Retention Time Precision in Gas Chromatography Technical Note Abstract Area and retention time are the two primary measurements in gas chromatography. The precision with which
Uncertainty Analysis of Experimental Data and Dimensional Measurements
 Uncertainty Analysis of Experimental Data and Dimensional Measurements Introduction The primary objective of this experiment is to introduce analysis of measurement uncertainty and experimental error.
Automated determination of the uniformity of dosage in quinine sulfate tablets using a fiber optics autosampler
 Automated determination of the uniformity of dosage in quinine sulfate tablets using a fiber optics autosampler Application Note Author John Sanders. Agilent Technologies, Inc. Mulgrave, Victoria 3170,