Statistical Analysis of Engineering Data The Bare Bones Edition. Precision, Bias, Accuracy, Measures of Precision, Propagation of Error
|
|
|
- Gordon O’Brien’
- 6 years ago
- Views:
Transcription
1 Statistical Analysis of Engineering Data The Bare Bones Edition (I) Precision, Bias, Accuracy, Measures of Precision, Propagation of Error PRIOR TO DATA ACQUISITION ONE SHOULD CONSIDER: 1. The accuracy and/or precision required in your data and calculations should be consistent with the projected use of the result. 2. It is desirable to complete the investigation and obtain the required accuracy and/or precision with a minimum of time and expense. TYPICAL QUESTIONS TO ASK: 1. What types of errors are likely to enter a given measurement or calculation? 2. To what extent do the errors in data influence the error in a result calculated from the data? (propagation of error) 3. What accuracy and/or precision is it economically feasible to obtain? 4. Is absolute accuracy and/or precision needed, or merely trends or differences? Types of uncertainties: 1. Random or indeterminate errors. The word Precision is used to describe random error. Precision is best quantified by the sample * variance (S 2 ) or sample * standard deviation (S) of values obtained by repeating trials several times. Example: n (=5) repeated trials from the draining tank experiment yield the following data: Trial # Drain time (s) sample mean or average = x m = * x1 x2... Eqn. 1 n = 1/5 ( ) = 26.2 s sample standard deviation = S = * x1 xm x2 x m... 1 Eqn. 2 n = [(1/4{( ) 2 + ( ) 2 + ( ) 2 + ( ) 2 + ( ) 2 }] 1/2 = 2.4 s * A sample represents a finite selection of items from an entire population. For instance, in the draining tank example, the entire population consists of infinite replicate determinations of draining time. Samples provide an image of the population. One of the severest limitations of a sample, as a representation of the population, is its size. However, the size of a sample is not the only factor affecting its merit as an image of the population. It must be noted that x m is the sample estimate of the population mean ( ) and S 2 is the sample estimate of the population variance ( 2 ). 1
2 2. Fixed or systematic errors a consistent or repeated error. Systematic error is called Bias. Bias is determined by comparing the sample mean to the reference value of the measured property. Reference values can be (a) real, though unknown true values; (b) assigned values, arrived at by agreement among experts; or (c) the result of a hypothetical experiment which is approximated by a sequence of actual experiments. Only type (b) reference values lend themselves to mathematical description of bias, i.e. bias = sample mean assigned value. Total Accuracy ** is total absence of bias. **Sometimes accuracy is defined as the total absence of error (both bias and random error). STATISTICS deals only with precision, not with bias (i.e. accuracy). Possible reasons for Poor Precision fluctuations in surroundings, fluctuations in system, sloppy sampling or recording by a human, data taken by different people, fluctuations in measuring device, magnitude of the measured value, etc. Possible reasons for Bias improper calibration of measuring device, malfunction in measuring device, consistent human error in sampling or measuring, etc
3 The precision in the measurement of dependent and independent variables can only be assessed if replicate measurements are made at a single experimental condition (i.e. you must be able to compute a mean and a standard deviation of a measured value within a single experimental condition). Precision can be reported many different ways. 1) Standard deviation provides a measure of precision by indicating how far, on average, replicate observations are from their mean. Coefficient of variation is a convenient way to report precision based on std dev. Coeff of variation = (std dev/mean)*100 2) Confidence Intervals also provide a measure of our precision (and are related to std dev). A confidence interval = range of values between which the population mean can be expected to lie with a given certainty they provide a probability statement about the likelihood of correctness. The two-sided 95% Confidence Interval (based on the Student-t distribution) is given by: S S xm t0.025 * xm t * Eqn. 3 n n where t is the distribution factor for the Student-t distribution (obtainable from tables provided in most statistics textbooks). Note- for a normally distributed variable, ~95% of all possible observations lie within two standard deviations to either side of the mean. Note: Most spreadsheet and graphing software will compute sample statistics including confidence intervals when given data and associated information. CHEG 237W - Excel calculation of sample statistics and confidence intervals Draining Tank Experiment Replicate Data for drain time of water from a tank Run 1 - pipe length = 10", diameter = 0.25 Trial # Time (s) Required to Drain 6 of fluid sample size 5 Average 26.2 Excel command for Average = Average(list of numbers) Stand Dev 2.4 Excel command for stand dev = STDEV(list of numbers) 95% Confidence Interval = Excel command for conf = Confidence(alpha, stdev, sample size) Where alpha = (100-confidence level desired)/100 i.e. alpha=0.05 for 95% confidence 3) Error Bars. In Excel, the value of error bars on data points can be based on 1) fixed values you define, 2)%of each data point, 3) specific number of std dev from the mean of the plotted values 4) std error of the plotted values 5) custom values you define (i.e. you could put confidence values in here).
4 Propagation of error refers to uncertainty in a computed quantity (u) resulting from uncertainties in the primary measurements (x,y,z) on which it is based. 1. If (u) is a linear function of the primary measurements (x, y, z) i.e. u = ax + by + cz and x, y, and z are statistically independent* measurements the variance in u is given by: 2 (u) = 2 (ax + by + cz) = a 2 2 (x) + b 2 2 (y) + c 2 2 (z) Eqn. 4 * Statistical independence means that the error in the measurement of x has no effect upon the error made in the measurement of y and z, etc. Example: The iron content of a copper-based alloy, determined by a backtitration method is calculated according to the formula: %Fe = (D-F) where D=ml 0.01 N potassium dichromate used in the analysis and F= ml of 0.01N ferrous-ammonium sulfate required for titration. Suppose D=21.0 ml and F=0.8 ml. Then % Fe = ( )= If the standard deviation of the titrations with either D or F is 0.1 ml, then the variance in %Fe calculated is 2 (%Fe) = ( ) 2 (0.1) 2 + ( ) 2 (0.1) 2 = x10-6 (%Fe) = (2.4954x10⁻⁶ ) 1/2 = (% Fe) Coefficient of variation = * 100 % Fe = 100 = 0.69% If (u) is a non-linear function of the primary measurements, for example u = xyz, and the measurements are statistically independent a method of linearization based on a Taylor expansion can be used. Suppose u = f(x,y,z) f 2 f 2 f 2 ( u) ( x) ( y) ( z) Eqn. 5 x y z Note- this method is valid when (x) is of the order of 10% x or smaller Example: Electric power is calculated using the formula P = V*I where V = voltage = 100 V 2V and I= current = 10A 0.2 A 2 (P) = (10) 2 (2) 2 + (100) 2 (0.2) 2 = 800 (P) = 28.3 We would report the power as P = 1000 W 28.3 W. The coefficient of variation is 2.8%. 2
5 II. Hypothesis Testing (comparing two averages) & Analysis of Variance (ANOVA) (comparing more than two averages) Hypothesis testing is the formal procedure for determining statistical significance when comparing two methods, two operating conditions, two materials, etc. In other words, hypothesis testing tells us whether a change in level of the independent variable resulted in a significant change in the dependent variable. Hypothesis tests and confidence intervals are closely related. The procedure is: 1. Formulate hypotheses 2. Select appropriate distribution function for the test statistic 3. Specify the level of significance 4. Collect and analyze data and calculate an estimate of the test statistic 5. Define the region of rejection for the test statistic 6. Accept or reject hypotheses Hypotheses (when used for comparing two populations ) are statements that indicate the absence or presence of differences. Hypotheses consist of pairs of statements. The first hypothesis (null hypothesis) states that the sample means of two populations are equal The two means are equal: x m1 = x m2 The second hypothesis (alternative hypothesis) can be stated various ways: The two means are different: Mean 1 is less than mean 2: Mean 1 is greater than mean 2: x m1 x m2 x m1 < x m2 x m1 > x m2 A Distribution function is a mathematical model describing the probability that a random variable X lies within the interval x1 to x2. The location, scale and shape of the function are usually characterized by one to three parameters (mean, variance, skewness). Uniform, normal, lognormal, student-t, and chi-squared are some examples of continuous distribution functions. The test statistic is the distribution function that you choose to represent your particular testing requirements. When comparing random samples drawn from two normally distributed populations, the student-t distribution is used: xm 1 xm2 Student-t test statistic: t S p n1 n2 Eqn. 6 where S p the pooled variance is given by 2 n 1 S n S 2 S p Eqn. 7 n n 2 S 2 is the sample variance, n is the sample size and the subscript 1 and 2 represent populations 1 and
6 The level of significance ( ) represents the probability of rejecting the null hypothesis when indeed it is true. Selection of the level of significance should be based on an evaluation of the consequences of making an incorrect conclusion (in your case, a false conclusion is not life threatening or is it?!) Typical values for are 0.05 or The region of rejection consists of those values of the test statistic that would be unlikely if the null hypothesis were true. For a hypothesis test of two means, the region of rejection is a function of the degrees of freedom (n1+n2-2), level of significance ( ), and the statement of the alternative hypothesis: If the alternative hypothesis is then reject the null hypothesis if x m1 x m2 x m1 < x m2 x m1 > x m2 t < -t /2 or t > t /2 t < -t t > t t is the value calculated using Eqns. 6 & 7. t and t /2 are found in the student-t table. Accept or reject the null hypothesis by comparing the sample estimate of the t statistic calculated using experimental data with tabulated values of t or t /2. Example: CHEG 237W - Excel calculation of sample statistics and hypothesis testing Draining Tank Experiment - Data for drain time of water from tanks with different length outlet pipes Run 1 - pipe length = 10" Run 2 - pipe length = 1" Trial # Time (s) Trial # Time (s) sample size 5 5 Average Stand Dev Confidence Interval =
7 Error bars represent the confidence intervals calculated above Hypothesis Test of drain times from 1" and 10" length pipes Null hypothesis = means of the two runs are equal Alternative hypothesis = mean of the 10" pipe is less than mean of the 1" pipe calculated t = ( )/Sp/(1/5+1/5)^.5) t= where Sp 2 ={(5-1)*(2.39)^2+(5-1)*(.84)^2}/(5+5-2) Sp 2 = 3.2 t from t-table (for degrees of freedom and level of significance = 0.1) t = test = reject null hypothesis if t< -t is less than so we can be 90% certain that the null hypothesis is false!!!! i.e. run 1 time is significantly different from run 2 time
8
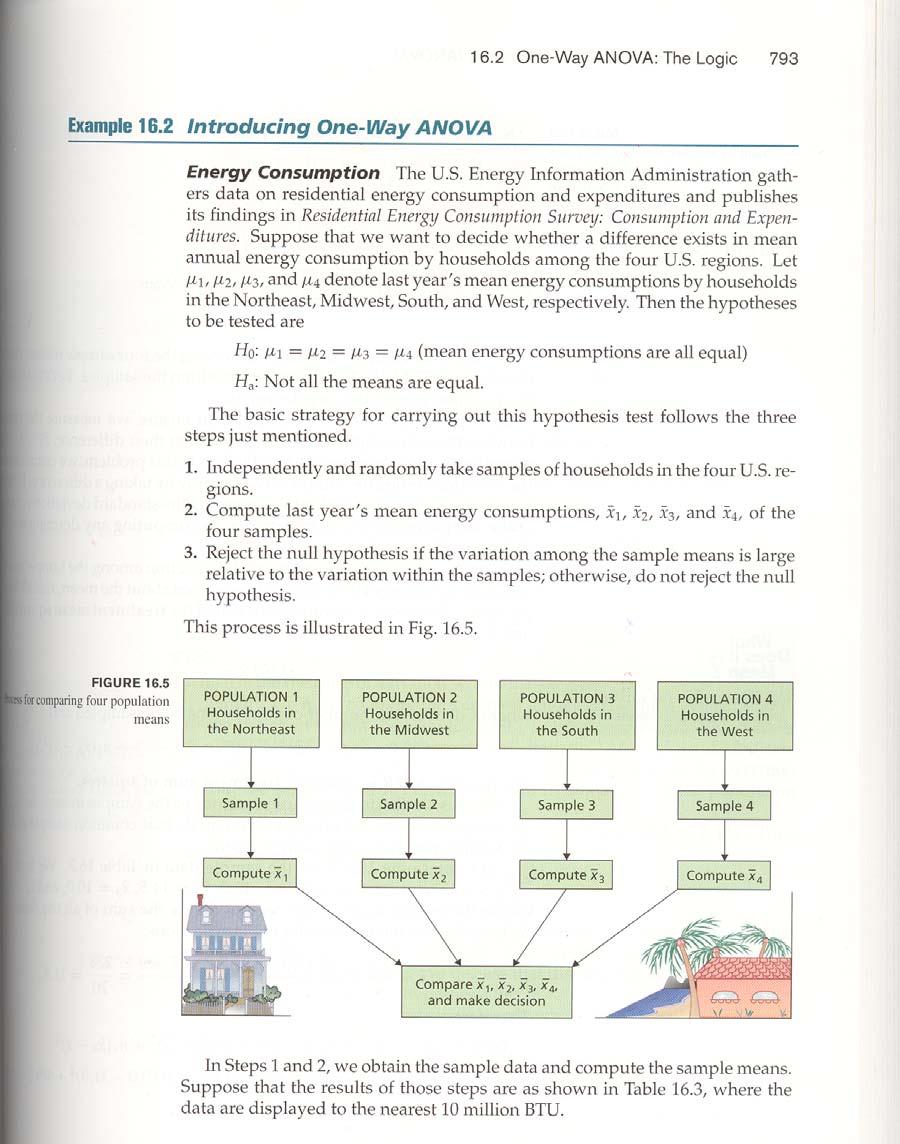
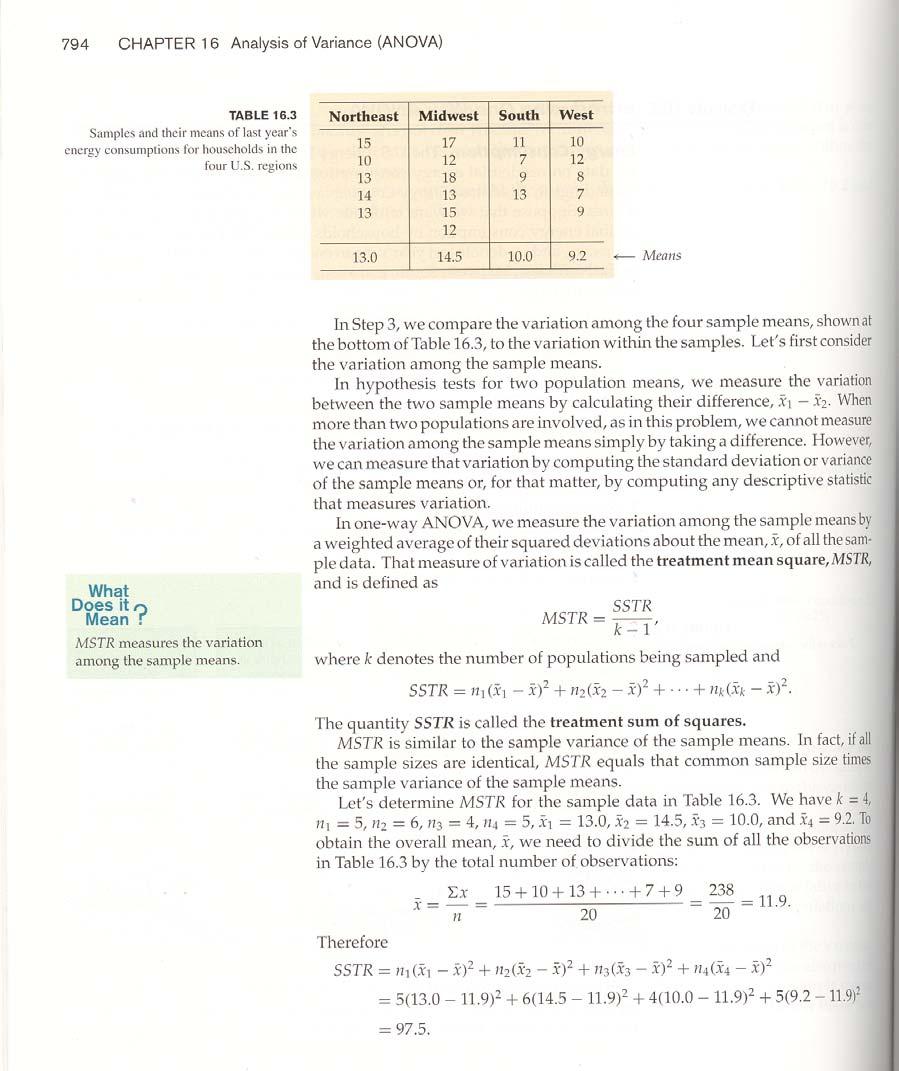
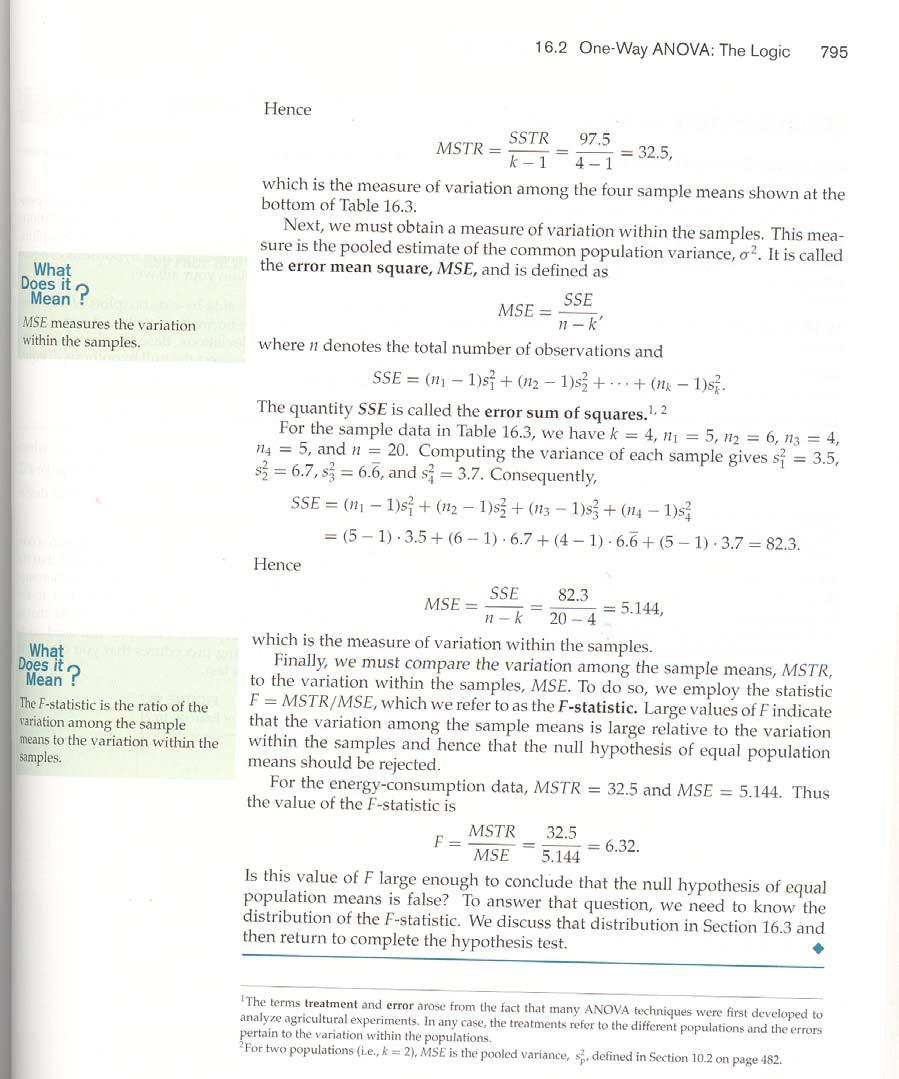
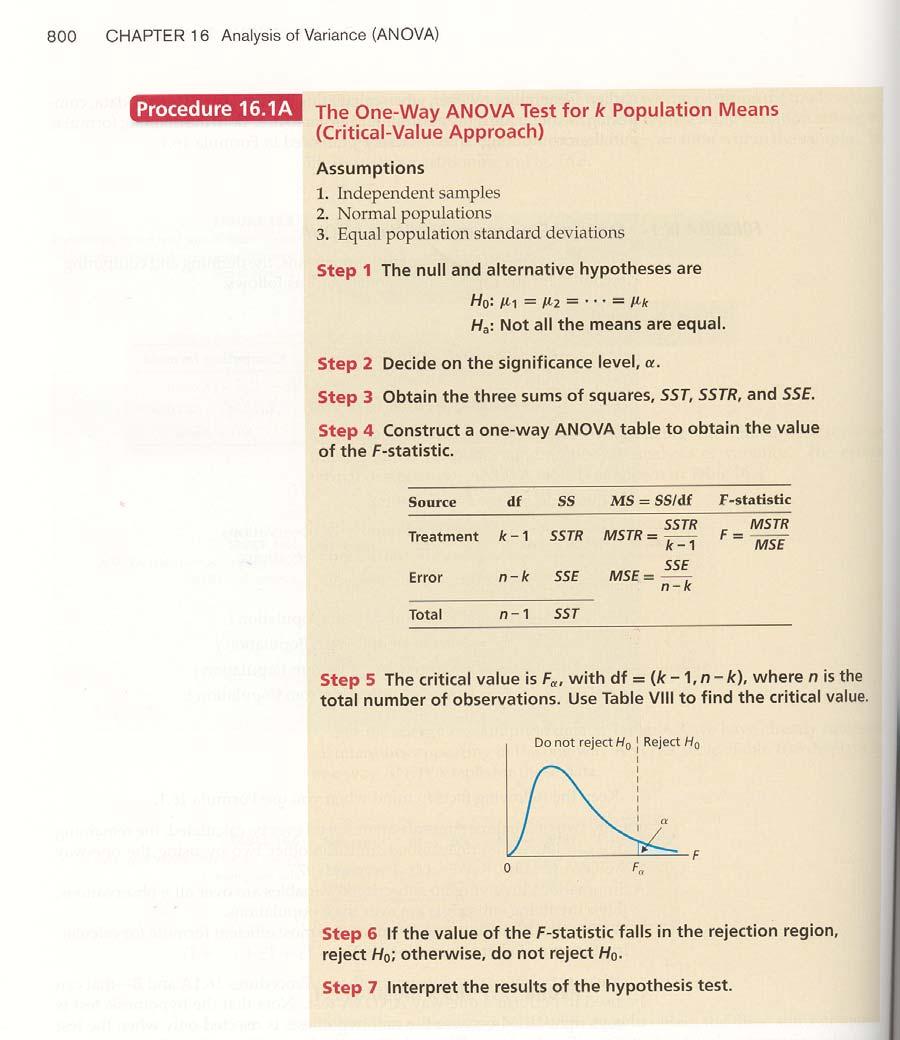
9 It is often necessary to compare more than two means. The analysis of variance (ANOVA) methodology is used in these cases. Essentially this analysis determines whether the discrepancies between means are greater than could reasonably be expected within the means. The following is an example from Introductory Statistics by Weiss for performing oneway ANOVA (comparing N number of means of a single dependent variable that result by varying N levels of a single independent variable i.e. comparing 3 draining times resulting from 3 different outlet pipe lengths).
10
11
12
13
14
15 III. Data Regression and Correlation After data are taken and sample statistics computed (mean, standard deviation, confidence intervals, test of significance) it must be analyzed. You need to make sense of the data, explain the physical phenomena that are occurring, and show how your data conform or not conform to theory or other experimental work. Before data regression and correlation, you should anticipate the types of behavior you expect to observe between independent and dependent variables. For instance, a popular empirical equation used to relate pressure drop in pipes to fluid and pipe properties is P/ = 4fL/D V 2 /2, therefore one might expect measured pressure drop to be proportional to V 2 for constant density, diameter, length, and friction factor. Data Regression refers to the process of statistically deriving a mathematical relationship between a dependent variable and measured values of independent variables i.e. deriving an empirical model. Linear regression using the least-squares criterion is an example of model development from experimental data. The utility of any model for making predictions (be it a regression model or a model based on physical laws or theory) can be assessed using correlation methods, hypothesis tests, or prediction intervals which are similar to confidence intervals. Data Correlation provides information about the strength and type of relationship between two or more variables or the strength of the relationship between observed values and predicted values i.e. the degree to which one or more variables can be used to predict the values of another variable. 1) Coefficient of determination, r 2, is the (sum of the squared errors between the predicted value and the mean)/(sum of the squared errors between the observed value and the mean). It is the squared value of r, the correlation coefficient. 2) Hypothesis testing (performed on slope or r or r 2 ) 3) Prediction intervals A few examples of data regression and correlation are given below. (1) Fitting a line to experimental data (calculating slope and intercept) Example: calibrating a rotameter (rotameter reading vs flowrate) Solution Method: linear regression (method of least squares) with determination of variance, confidence intervals ** and residual plots plots of [measured values of dependent variable minus predicted values of the dependent variable] vs the independent variable. Residual plots should fall roughly in a horizontal band centered and symmetric about the x-axis. A normal probability plot of residuals should be roughly linear. (2) Fitting curves to experimental data ** (calculating polynomial coefficients and/or model parameters) Example: developing an expression for the heat capacity of a gas as a function of temperature Solution Method: polynomial and/or multiple linear and nonlinear regression with determination of variance, confidence intervals and residual plots (3) Estimating parameters in existing models from raw data ** (finding the best fit coefficients for existing models)
16 Example: finding Antoine constants [log p = A + B/(T+C)] from vapor pressure vs temperature data Solution Method: nonlinear regression of general algebraic expression with determination of variance, confidence intervals and residual analysis (4) Comparing models derived from experimental data to existing models ** Example: correlation of heat transfer data using dimensionless groups followed by comparison to existing empirical models Solution Method: linear and/or non-linear regression with linearization and transformation functions, determination of variance, confidence intervals, and residual analysis (5) Comparing the effects of various independent variables on the dependent variable (determining the relative significance of independent variables) Example: comparing the effects of pipe diameter, pipe length, and viscosity on draining time Solution Method: analysis of variance (ANOVA) equivalent to regression analysis with determination of variance, confidence intervals and residual analysis **Polymath example attached
Basic Statistics. 1. Gross error analyst makes a gross mistake (misread balance or entered wrong value into calculation).
.") Basic Statistics There are three types of error: 1. Gross error analyst makes a gross mistake (misread balance or entered wrong value into calculation). 2. Systematic error - always too high or too low
Basic Statistics There are three types of error: 1. Gross error analyst makes a gross mistake (misread balance or entered wrong value into calculation). 2. Systematic error - always too high or too low
What If There Are More Than. Two Factor Levels?
 What If There Are More Than Chapter 3 Two Factor Levels? Comparing more that two factor levels the analysis of variance ANOVA decomposition of total variability Statistical testing & analysis Checking
Chapter 10. Regression. Understandable Statistics Ninth Edition By Brase and Brase Prepared by Yixun Shi Bloomsburg University of Pennsylvania
 Chapter 10 Regression Understandable Statistics Ninth Edition By Brase and Brase Prepared by Yixun Shi Bloomsburg University of Pennsylvania Scatter Diagrams A graph in which pairs of points, (x, y), are
Lectures 5 & 6: Hypothesis Testing
 Lectures 5 & 6: Hypothesis Testing in which you learn to apply the concept of statistical significance to OLS estimates, learn the concept of t values, how to use them in regression work and come across
Review of Statistics 101
 Review of Statistics 101 We review some important themes from the course 1. Introduction Statistics- Set of methods for collecting/analyzing data (the art and science of learning from data). Provides methods
The SuperBall Lab. Objective. Instructions
 1 The SuperBall Lab Objective This goal of this tutorial lab is to introduce data analysis techniques by examining energy loss in super ball collisions. Instructions This laboratory does not have to be
Practical Statistics for the Analytical Scientist Table of Contents
 Practical Statistics for the Analytical Scientist Table of Contents Chapter 1 Introduction - Choosing the Correct Statistics 1.1 Introduction 1.2 Choosing the Right Statistical Procedures 1.2.1 Planning
-However, this definition can be expanded to include: biology (biometrics), environmental science (environmetrics), economics (econometrics).
, environmental science (environmetrics), economics (econometrics).") Chemometrics Application of mathematical, statistical, graphical or symbolic methods to maximize chemical information. -However, this definition can be expanded to include: biology (biometrics), environmental
Chemometrics Application of mathematical, statistical, graphical or symbolic methods to maximize chemical information. -However, this definition can be expanded to include: biology (biometrics), environmental
Chapter 1 Statistical Inference
 Chapter 1 Statistical Inference causal inference To infer causality, you need a randomized experiment (or a huge observational study and lots of outside information). inference to populations Generalizations
1 Introduction to Minitab
 1 Introduction to Minitab Minitab is a statistical analysis software package. The software is freely available to all students and is downloadable through the Technology Tab at my.calpoly.edu. When you
Relating Graph to Matlab
 There are two related course documents on the web Probability and Statistics Review -should be read by people without statistics background and it is helpful as a review for those with prior statistics
PHYS 2211L - Principles of Physics Laboratory I
 PHYS 2211L - Principles of Physics Laboratory I Laboratory Advanced Sheet Acceleration Due to Gravity 1. Objectives. The objectives of this laboratory are a. To measure the local value of the acceleration
Subject CS1 Actuarial Statistics 1 Core Principles
 Institute of Actuaries of India Subject CS1 Actuarial Statistics 1 Core Principles For 2019 Examinations Aim The aim of the Actuarial Statistics 1 subject is to provide a grounding in mathematical and
* Tuesday 17 January :30-16:30 (2 hours) Recored on ESSE3 General introduction to the course.
 Recored on ESSE3 General introduction to the course.") Name of the course Statistical methods and data analysis Audience The course is intended for students of the first or second year of the Graduate School in Materials Engineering. The aim of the course
Name of the course Statistical methods and data analysis Audience The course is intended for students of the first or second year of the Graduate School in Materials Engineering. The aim of the course
Index. Cambridge University Press Data Analysis for Physical Scientists: Featuring Excel Les Kirkup Index More information
 χ 2 distribution, 410 χ 2 test, 410, 412 degrees of freedom, 414 accuracy, 176 adjusted coefficient of multiple determination, 323 AIC, 324 Akaike s Information Criterion, 324 correction for small data
T.I.H.E. IT 233 Statistics and Probability: Sem. 1: 2013 ESTIMATION AND HYPOTHESIS TESTING OF TWO POPULATIONS
 ESTIMATION AND HYPOTHESIS TESTING OF TWO POPULATIONS In our work on hypothesis testing, we used the value of a sample statistic to challenge an accepted value of a population parameter. We focused only
One-Way ANOVA. Some examples of when ANOVA would be appropriate include:
 One-Way ANOVA 1. Purpose Analysis of variance (ANOVA) is used when one wishes to determine whether two or more groups (e.g., classes A, B, and C) differ on some outcome of interest (e.g., an achievement
A discussion on multiple regression models
 A discussion on multiple regression models In our previous discussion of simple linear regression, we focused on a model in which one independent or explanatory variable X was used to predict the value
Data Analysis. with Excel. An introduction for Physical scientists. LesKirkup university of Technology, Sydney CAMBRIDGE UNIVERSITY PRESS
 Data Analysis with Excel An introduction for Physical scientists LesKirkup university of Technology, Sydney CAMBRIDGE UNIVERSITY PRESS Contents Preface xv 1 Introduction to scientific data analysis 1 1.1
DETAILED CONTENTS PART I INTRODUCTION AND DESCRIPTIVE STATISTICS. 1. Introduction to Statistics
 DETAILED CONTENTS About the Author Preface to the Instructor To the Student How to Use SPSS With This Book PART I INTRODUCTION AND DESCRIPTIVE STATISTICS 1. Introduction to Statistics 1.1 Descriptive and
PHYS 1111L - Introductory Physics Laboratory I
 PHYS 1111L - Introductory Physics Laboratory I Laboratory Advanced Sheet Acceleration Due to Gravity 1. Objectives. The objectives of this laboratory are a. To measure the local value of the acceleration
Basic Analysis of Data
 Basic Analysis of Data Department of Chemical Engineering Prof. Geoff Silcox Fall 008 1.0 Reporting the Uncertainty in a Measured Quantity At the request of your supervisor, you have ventured out into
Basic Statistics. 1. Gross error analyst makes a gross mistake (misread balance or entered wrong value into calculation).
.") Basic Statistics There are three types of error: 1. Gross error analyst makes a gross mistake (misread balance or entered wrong value into calculation). 2. Systematic error - always too high or too low
Basic Statistics There are three types of error: 1. Gross error analyst makes a gross mistake (misread balance or entered wrong value into calculation). 2. Systematic error - always too high or too low
CIVL /8904 T R A F F I C F L O W T H E O R Y L E C T U R E - 8
 CIVL - 7904/8904 T R A F F I C F L O W T H E O R Y L E C T U R E - 8 Chi-square Test How to determine the interval from a continuous distribution I = Range 1 + 3.322(logN) I-> Range of the class interval
Uncertainty in Physical Measurements: Module 5 Data with Two Variables
 : Module 5 Data with Two Variables Often data have two variables, such as the magnitude of the force F exerted on an object and the object s acceleration a. In this Module we will examine some ways to
This gives us an upper and lower bound that capture our population mean.
 Confidence Intervals Critical Values Practice Problems 1 Estimation 1.1 Confidence Intervals Definition 1.1 Margin of error. The margin of error of a distribution is the amount of error we predict when
Inferences for Regression
 Inferences for Regression An Example: Body Fat and Waist Size Looking at the relationship between % body fat and waist size (in inches). Here is a scatterplot of our data set: Remembering Regression In
Typing Equations in MS Word 2010
 CM3215 Fundamentals of Chemical Engineering Laboratory Typing Equations in MS Word 2010 https://www.youtube.com/watch?v=cenp9mehtmy Professor Faith Morrison Department of Chemical Engineering Michigan
Measurements and Data Analysis
 Measurements and Data Analysis 1 Introduction The central point in experimental physical science is the measurement of physical quantities. Experience has shown that all measurements, no matter how carefully
Trendlines Simple Linear Regression Multiple Linear Regression Systematic Model Building Practical Issues
 Trendlines Simple Linear Regression Multiple Linear Regression Systematic Model Building Practical Issues Overfitting Categorical Variables Interaction Terms Non-linear Terms Linear Logarithmic y = a +
PLS205 Lab 2 January 15, Laboratory Topic 3
 PLS205 Lab 2 January 15, 2015 Laboratory Topic 3 General format of ANOVA in SAS Testing the assumption of homogeneity of variances by "/hovtest" by ANOVA of squared residuals Proc Power for ANOVA One-way
Lack-of-fit Tests to Indicate Material Model Improvement or Experimental Data Noise Reduction
 Lack-of-fit Tests to Indicate Material Model Improvement or Experimental Data Noise Reduction Charles F. Jekel and Raphael T. Haftka University of Florida, Gainesville, FL, 32611, USA Gerhard Venter and
Formal Statement of Simple Linear Regression Model
 Formal Statement of Simple Linear Regression Model Y i = β 0 + β 1 X i + ɛ i Y i value of the response variable in the i th trial β 0 and β 1 are parameters X i is a known constant, the value of the predictor
Unit 27 One-Way Analysis of Variance
 Unit 27 One-Way Analysis of Variance Objectives: To perform the hypothesis test in a one-way analysis of variance for comparing more than two population means Recall that a two sample t test is applied
Sampling Distributions: Central Limit Theorem
 Review for Exam 2 Sampling Distributions: Central Limit Theorem Conceptually, we can break up the theorem into three parts: 1. The mean (µ M ) of a population of sample means (M) is equal to the mean (µ)
Calibrate Rotameter and Orifice Meter and Explore Reynolds #
 CM3215 Fundamentals of Chemical Engineering Laboratory Calibrate Rotameter and Orifice Meter and Explore Reynolds # Extra features! Professor Faith Department of Chemical Engineering Michigan Technological
9/2/2010. Wildlife Management is a very quantitative field of study. throughout this course and throughout your career.
 Introduction to Data and Analysis Wildlife Management is a very quantitative field of study Results from studies will be used throughout this course and throughout your career. Sampling design influences
Cool Off, Will Ya! Investigating Effect of Temperature Differences between Water and Environment on Cooling Rate of Water
 Ding 1 Cool Off, Will Ya! Investigating Effect of Temperature Differences between Water and Environment on Cooling Rate of Water Chunyang Ding 000844-0029 Physics HL Ms. Dossett 10 February 2014 Ding 2
Factorial designs. Experiments
 Chapter 5: Factorial designs Petter Mostad mostad@chalmers.se Experiments Actively making changes and observing the result, to find causal relationships. Many types of experimental plans Measuring response
Data Analysis and Statistical Methods Statistics 651
 Data Analysis and Statistical Methods Statistics 651 http://www.stat.tamu.edu/~suhasini/teaching.html Suhasini Subba Rao Motivations for the ANOVA We defined the F-distribution, this is mainly used in
Final Exam - Solutions
 Ecn 102 - Analysis of Economic Data University of California - Davis March 19, 2010 Instructor: John Parman Final Exam - Solutions You have until 5:30pm to complete this exam. Please remember to put your
Regression. Estimation of the linear function (straight line) describing the linear component of the joint relationship between two variables X and Y.
 describing the linear component of the joint relationship between two variables X and Y.") Regression Bivariate i linear regression: Estimation of the linear function (straight line) describing the linear component of the joint relationship between two variables and. Generally describe as a
Regression Bivariate i linear regression: Estimation of the linear function (straight line) describing the linear component of the joint relationship between two variables and. Generally describe as a
GROUPED DATA E.G. FOR SAMPLE OF RAW DATA (E.G. 4, 12, 7, 5, MEAN G x / n STANDARD DEVIATION MEDIAN AND QUARTILES STANDARD DEVIATION
 FOR SAMPLE OF RAW DATA (E.G. 4, 1, 7, 5, 11, 6, 9, 7, 11, 5, 4, 7) BE ABLE TO COMPUTE MEAN G / STANDARD DEVIATION MEDIAN AND QUARTILES Σ ( Σ) / 1 GROUPED DATA E.G. AGE FREQ. 0-9 53 10-19 4...... 80-89
Ordinary Least Squares Regression Explained: Vartanian
 Ordinary Least Squares Regression Eplained: Vartanian When to Use Ordinary Least Squares Regression Analysis A. Variable types. When you have an interval/ratio scale dependent variable.. When your independent
ISQS 5349 Final Exam, Spring 2017.
 ISQS 5349 Final Exam, Spring 7. Instructions: Put all answers on paper other than this exam. If you do not have paper, some will be provided to you. The exam is OPEN BOOKS, OPEN NOTES, but NO ELECTRONIC
Quantitative Techniques - Lecture 8: Estimation
 Quantitative Techniques - Lecture 8: Estimation Key words: Estimation, hypothesis testing, bias, e ciency, least squares Hypothesis testing when the population variance is not known roperties of estimates
INFERENCE FOR REGRESSION
 CHAPTER 3 INFERENCE FOR REGRESSION OVERVIEW In Chapter 5 of the textbook, we first encountered regression. The assumptions that describe the regression model we use in this chapter are the following. We
Glossary. The ISI glossary of statistical terms provides definitions in a number of different languages:
 Glossary The ISI glossary of statistical terms provides definitions in a number of different languages: http://isi.cbs.nl/glossary/index.htm Adjusted r 2 Adjusted R squared measures the proportion of the
Business Statistics. Lecture 10: Course Review
 Business Statistics Lecture 10: Course Review 1 Descriptive Statistics for Continuous Data Numerical Summaries Location: mean, median Spread or variability: variance, standard deviation, range, percentiles,
Extra Exam Empirical Methods VU University Amsterdam, Faculty of Exact Sciences , July 2, 2015
 Extra Exam Empirical Methods VU University Amsterdam, Faculty of Exact Sciences 12.00 14.45, July 2, 2015 Also hand in this exam and your scrap paper. Always motivate your answers. Write your answers in
Chemometrics. Matti Hotokka Physical chemistry Åbo Akademi University
 Chemometrics Matti Hotokka Physical chemistry Åbo Akademi University Hypothesis testing Inference method Confidence levels Descriptive statistics Hypotesis testing Predictive statistics Hypothesis testing
Simple Linear Regression: One Quantitative IV
 Simple Linear Regression: One Quantitative IV Linear regression is frequently used to explain variation observed in a dependent variable (DV) with theoretically linked independent variables (IV). For example,
Regression analysis is a tool for building mathematical and statistical models that characterize relationships between variables Finds a linear
 Regression analysis is a tool for building mathematical and statistical models that characterize relationships between variables Finds a linear relationship between: - one independent variable X and -
Chapter 9 Regression. 9.1 Simple linear regression Linear models Least squares Predictions and residuals.
 9.1 Simple linear regression 9.1.1 Linear models Response and eplanatory variables Chapter 9 Regression With bivariate data, it is often useful to predict the value of one variable (the response variable,
Module 1: Introduction to Experimental Techniques Lecture 6: Uncertainty analysis. The Lecture Contains: Uncertainity Analysis
 The Lecture Contains: Uncertainity Analysis Error Propagation Analysis of Scatter Table A1: Normal Distribution Table A2: Student's-t Distribution file:///g /optical_measurement/lecture6/6_1.htm[5/7/2012
MICROPIPETTE CALIBRATIONS
 Physics 433/833, 214 MICROPIPETTE CALIBRATIONS I. ABSTRACT The micropipette set is a basic tool in a molecular biology-related lab. It is very important to ensure that the micropipettes are properly calibrated,
Analysis of variance
 Analysis of variance 1 Method If the null hypothesis is true, then the populations are the same: they are normal, and they have the same mean and the same variance. We will estimate the numerical value
Econometrics. 4) Statistical inference
 Statistical inference") 30C00200 Econometrics 4) Statistical inference Timo Kuosmanen Professor, Ph.D. http://nomepre.net/index.php/timokuosmanen Today s topics Confidence intervals of parameter estimates Student s t-distribution
30C00200 Econometrics 4) Statistical inference Timo Kuosmanen Professor, Ph.D. http://nomepre.net/index.php/timokuosmanen Today s topics Confidence intervals of parameter estimates Student s t-distribution
Basic Statistical Analysis!
 Basic Statistical Analysis! Prof. Dan Burkey! CHEG 4137W!! UConn CMBE!! Fall 011! 1 Why do we care? We can only make a finite number of measurements of a system Statistical analysis tells us something
Hypothesis testing. Data to decisions
 Hypothesis testing Data to decisions The idea Null hypothesis: H 0 : the DGP/population has property P Under the null, a sample statistic has a known distribution If, under that that distribution, the
1 Measurement Uncertainties
 1 Measurement Uncertainties (Adapted stolen, really from work by Amin Jaziri) 1.1 Introduction No measurement can be perfectly certain. No measuring device is infinitely sensitive or infinitely precise.
Robustness and Distribution Assumptions
 Chapter 1 Robustness and Distribution Assumptions 1.1 Introduction In statistics, one often works with model assumptions, i.e., one assumes that data follow a certain model. Then one makes use of methodology
LECTURE 5. Introduction to Econometrics. Hypothesis testing
 LECTURE 5 Introduction to Econometrics Hypothesis testing October 18, 2016 1 / 26 ON TODAY S LECTURE We are going to discuss how hypotheses about coefficients can be tested in regression models We will
Sociology 6Z03 Review II
 Sociology 6Z03 Review II John Fox McMaster University Fall 2016 John Fox (McMaster University) Sociology 6Z03 Review II Fall 2016 1 / 35 Outline: Review II Probability Part I Sampling Distributions Probability
Correlation and Simple Linear Regression
 Correlation and Simple Linear Regression Sasivimol Rattanasiri, Ph.D Section for Clinical Epidemiology and Biostatistics Ramathibodi Hospital, Mahidol University E-mail: sasivimol.rat@mahidol.ac.th 1 Outline
Fundamental Statistical Concepts and Methods Needed in a Test-and-Evaluator s Toolkit. Air Academy Associates
 Fundamental Statistical Concepts and Methods Needed in a Test-and-Evaluator s Toolkit Mark Kiemele Air Academy Associates mkiemele@airacad.com ITEA 010 Symposium Glendale, AZ 13 September 010 INTRODUCTIONS
CHAPTER 10 ONE-WAY ANALYSIS OF VARIANCE. It would be very unusual for all the research one might conduct to be restricted to
 CHAPTER 10 ONE-WAY ANALYSIS OF VARIANCE It would be very unusual for all the research one might conduct to be restricted to comparisons of only two samples. Respondents and various groups are seldom divided
Data Analysis for University Physics
 Data Analysis for University Physics by John Filaseta orthern Kentucky University Last updated on ovember 9, 004 Four Steps to a Meaningful Experimental Result Most undergraduate physics experiments have
Midterm 2 - Solutions
 Ecn 102 - Analysis of Economic Data University of California - Davis February 24, 2010 Instructor: John Parman Midterm 2 - Solutions You have until 10:20am to complete this exam. Please remember to put
Modules 1-2 are background; they are the same for regression analysis and time series.
 Regression Analysis, Module 1: Regression models (The attached PDF file has better formatting.) Required reading: Chapter 1, pages 3 13 (until appendix 1.1). Updated: May 23, 2005 Modules 1-2 are background;
Uncertainty in Physical Measurements: Module 5 Data with Two Variables
 : Often data have two variables, such as the magnitude of the force F exerted on an object and the object s acceleration a. In this Module we will examine some ways to determine how one of the variables,
A Scientific Model for Free Fall.
 A Scientific Model for Free Fall. I. Overview. This lab explores the framework of the scientific method. The phenomenon studied is the free fall of an object released from rest at a height H from the ground.
Experimental Uncertainty (Error) and Data Analysis
 and Data Analysis") Experimental Uncertainty (Error) and Data Analysis Advance Study Assignment Please contact Dr. Reuven at yreuven@mhrd.org if you have any questions Read the Theory part of the experiment (pages 2-14) and
Experimental Uncertainty (Error) and Data Analysis Advance Study Assignment Please contact Dr. Reuven at yreuven@mhrd.org if you have any questions Read the Theory part of the experiment (pages 2-14) and
HYPOTHESIS TESTING. Hypothesis Testing
 MBA 605 Business Analytics Don Conant, PhD. HYPOTHESIS TESTING Hypothesis testing involves making inferences about the nature of the population on the basis of observations of a sample drawn from the population.
IENG581 Design and Analysis of Experiments INTRODUCTION
 Experimental Design IENG581 Design and Analysis of Experiments INTRODUCTION Experiments are performed by investigators in virtually all fields of inquiry, usually to discover something about a particular
df=degrees of freedom = n - 1
 One sample t-test test of the mean Assumptions: Independent, random samples Approximately normal distribution (from intro class: σ is unknown, need to calculate and use s (sample standard deviation)) Hypotheses:
2.2 Classical Regression in the Time Series Context
 48 2 Time Series Regression and Exploratory Data Analysis context, and therefore we include some material on transformations and other techniques useful in exploratory data analysis. 2.2 Classical Regression
Do not copy, post, or distribute
 14 CORRELATION ANALYSIS AND LINEAR REGRESSION Assessing the Covariability of Two Quantitative Properties 14.0 LEARNING OBJECTIVES In this chapter, we discuss two related techniques for assessing a possible
Precision Correcting for Random Error
 Precision Correcting for Random Error The following material should be read thoroughly before your 1 st Lab. The Statistical Handling of Data Our experimental inquiries into the workings of physical reality
" M A #M B. Standard deviation of the population (Greek lowercase letter sigma) σ 2
 σ 2") Notation and Equations for Final Exam Symbol Definition X The variable we measure in a scientific study n The size of the sample N The size of the population M The mean of the sample µ The mean of the
Notation and Equations for Final Exam Symbol Definition X The variable we measure in a scientific study n The size of the sample N The size of the population M The mean of the sample µ The mean of the
Statistics Introductory Correlation
 Statistics Introductory Correlation Session 10 oscardavid.barrerarodriguez@sciencespo.fr April 9, 2018 Outline 1 Statistics are not used only to describe central tendency and variability for a single variable.
Statistics 191 Introduction to Regression Analysis and Applied Statistics Practice Exam
 Statistics 191 Introduction to Regression Analysis and Applied Statistics Practice Exam Prof. J. Taylor You may use your 4 single-sided pages of notes This exam is 14 pages long. There are 4 questions,
INTRODUCTION TO ANALYSIS OF VARIANCE
 CHAPTER 22 INTRODUCTION TO ANALYSIS OF VARIANCE Chapter 18 on inferences about population means illustrated two hypothesis testing situations: for one population mean and for the difference between two
Final Exam. Name: Solution:
 Final Exam. Name: Instructions. Answer all questions on the exam. Open books, open notes, but no electronic devices. The first 13 problems are worth 5 points each. The rest are worth 1 point each. HW1.
BIOL 458 BIOMETRY Lab 9 - Correlation and Bivariate Regression
 BIOL 458 BIOMETRY Lab 9 - Correlation and Bivariate Regression Introduction to Correlation and Regression The procedures discussed in the previous ANOVA labs are most useful in cases where we are interested
Correlation Analysis
 Simple Regression Correlation Analysis Correlation analysis is used to measure strength of the association (linear relationship) between two variables Correlation is only concerned with strength of the
Statistics: Error (Chpt. 5)
") Statistics: Error (Chpt. 5) Always some amount of error in every analysis (How much can you tolerate?) We examine error in our measurements to know reliably that a given amount of analyte is in the sample
Statistics: Error (Chpt. 5) Always some amount of error in every analysis (How much can you tolerate?) We examine error in our measurements to know reliably that a given amount of analyte is in the sample
16.400/453J Human Factors Engineering. Design of Experiments II
 J Human Factors Engineering Design of Experiments II Review Experiment Design and Descriptive Statistics Research question, independent and dependent variables, histograms, box plots, etc. Inferential
9. Linear Regression and Correlation
 9. Linear Regression and Correlation Data: y a quantitative response variable x a quantitative explanatory variable (Chap. 8: Recall that both variables were categorical) For example, y = annual income,
03.1 Experimental Error
 03.1 Experimental Error Problems: 15, 18, 20 Dr. Fred Omega Garces Chemistry 251 Miramar College 1 Making a measurement In general, the uncertainty of a measurement is determined by the precision of the
BIOL Biometry LAB 6 - SINGLE FACTOR ANOVA and MULTIPLE COMPARISON PROCEDURES
 BIOL 458 - Biometry LAB 6 - SINGLE FACTOR ANOVA and MULTIPLE COMPARISON PROCEDURES PART 1: INTRODUCTION TO ANOVA Purpose of ANOVA Analysis of Variance (ANOVA) is an extremely useful statistical method
Statistical methods and data analysis
 Statistical methods and data analysis Teacher Stefano Siboni Aim The aim of the course is to illustrate the basic mathematical tools for the analysis and modelling of experimental data, particularly concerning
STA 101 Final Review
 STA 101 Final Review Statistics 101 Thomas Leininger June 24, 2013 Announcements All work (besides projects) should be returned to you and should be entered on Sakai. Office Hour: 2 3pm today (Old Chem
1 Descriptive statistics. 2 Scores and probability distributions. 3 Hypothesis testing and one-sample t-test. 4 More on t-tests
 Overall Overview INFOWO Statistics lecture S3: Hypothesis testing Peter de Waal Department of Information and Computing Sciences Faculty of Science, Universiteit Utrecht 1 Descriptive statistics 2 Scores
BIOMETRICS INFORMATION
 BIOMETRICS INFORMATION Index of Pamphlet Topics (for pamphlets #1 to #60) as of December, 2000 Adjusted R-square ANCOVA: Analysis of Covariance 13: ANCOVA: Analysis of Covariance ANOVA: Analysis of Variance
Linear Algebra is Your Friend: Least Squares Solutions to Overdetermined Linear Systems
 Linear Algebra is Your Friend: Least Squares Solutions to Overdetermined Linear Systems R. E. Babcock, Mark E. Arnold Department of Chemical Engineering and Department of Mathematical Sciences Fayetteville,
Experiment 2 Random Error and Basic Statistics
 PHY9 Experiment 2: Random Error and Basic Statistics 8/5/2006 Page Experiment 2 Random Error and Basic Statistics Homework 2: Turn in at start of experiment. Readings: Taylor chapter 4: introduction, sections
Simple Linear Regression Using Ordinary Least Squares
 Simple Linear Regression Using Ordinary Least Squares Purpose: To approximate a linear relationship with a line. Reason: We want to be able to predict Y using X. Definition: The Least Squares Regression
Propagation of Error. Ch En 475 Unit Operations
 Propagation of Error Ch En 475 Unit Operations Spiritual Thought Matthew 11:28-30 28 Come unto me, all ye that labour and are heavy laden, and I will give you rest. 29 Take my yoke upon you, and learn
Chapter 7: Simple linear regression
 The absolute movement of the ground and buildings during an earthquake is small even in major earthquakes. The damage that a building suffers depends not upon its displacement, but upon the acceleration.