Multiple Linear Regression estimation, testing and checking assumptions
|
|
|
- Edwin Harrell
- 5 years ago
- Views:
Transcription

1 Multiple Linear Regression estimation, testing and checking assumptions Lecture No. 07
2 Example 1 The president of a large chain of fast-food restaurants has randomly selected 10 franchises and recorded for each franchise the following information on last year s net profit and sales activity. For these data, there will be one dependent variable (y net profit) and two independent variables (x 1 counter sales; x 2 drive-through sales). The form of the sample regression equation will be y = b 0 + b 1 x 1 + b 2 x 2.

3 The multiple linear regression model
4 The multiple linear regression model The sample regression equation is based on observed values for the dependent and independent variables. I has the form: Determination of the best-fit multiple regression equation is according to the least-squares criterion, in which the sum of the squared deviations between observed and estimated values of y is minimized.
5 Assumptions for multiple linear regression 1. Linear relationship between the independent and dependent variables 2. All variables are normally distributed 3. No multicollinearity independent variables must not be highly correlated 4. Independence of random errors (residuals) 5. Homoscedasticity (homogeneity of variance) 6. Normally distributed errors
6 Example 1 Solution in Excel

7 Example 1 Solution in Statistica

8 Example


9 Example

10 Example 1

11 Example 1 The scatter diagram for the fast-food data can be visualized as a room where each of 10 helium-filled balloons is held to the floor by a string. The length of each string is the observed value of y for that data point. The least-squares regression equation (not shown) passes through the data and takes the form of a two-dimensional surface, or plane.
12 Example 1 - Point Estimation Using the Regression Equation Point estimates are made by substituting a set of x values into the regression equation and calculating the estimated value of y. For example, if a franchise had sold x 1 = $5.0 million over the counter and x 2 = $7.4 million at the drive-through, we would estimate its net profit as $1.05 million:

13 The Multiple Standard Error of Estimate For our example, there are k = 2 independent variables and n = 10 data points. We calculate the error sum of squares

14 Example 1 - Confidence Interval for the Conditional Mean of y For the sample of 10 fastfood franchises, the summary results from these calculations are important in determining both the multiple standard error of estimate and the coefficients of multiple correlation and determination. (Data are in millions of dollars.)

15 Confidence Interval for the Conditional Mean of y
16 Example 1 - Confidence Interval for the Conditional Mean of y


17 Example 1 - Confidence Interval for the Conditional Mean of y Solution in Statistica

18 Example 1 - Confidence Interval for the Conditional Mean of y Solution in Statistica

19 Prediction Interval for an Individual y Observation
20 Example 1 - Prediction Interval for an Individual y Observation
21 Example 1 - Prediction Interval for an Individual y Observation

22 Example 1 - Prediction Interval for an Individual y Observation Solution in Statistica

23 Testing the Partial Regression Coefficients
24 Example 1 - Testing the Partial Regression Coefficients
25 Example 1 - Testing the Partial Regression Coefficients

26 Interval Estimation for the Partial Regression Coefficients
27 Example 1 - Interval Estimation for the Partial Regression Coefficients
28 Checking the assumptions for multiple linear regression 1. Linear relationship between the independent and dependent variables 2. All variables are normally distributed 3. No multicollinearity independent variables must not be highly correlated 4. Independence of random errors (residuals) 5. Homoscedasticity (homogeneity of variance) 6. Normally distributed errors
29 Example 2 - Checking the assumptions for multiple linear regression Solution in Statistica

30 Example 2 - Linear relationship between the independent and dependent variables 1 2 3


31 Example 2 - Linear relationship between the independent and dependent variables 1 2 3

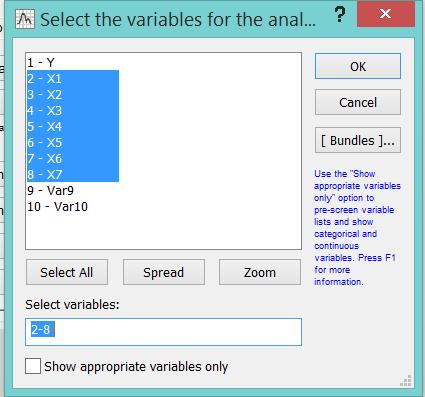
32 Example 2 - Linear relationship between the independent and dependent variables 1 2 Checking the linear relationship between Y and X1 X7

33 Example 2 - Linear relationship between the independent and dependent variables 1

34 Example 2 - All variables are normally distributed

35 Example 2 - All variables are normally distributed 3 1 2

36 Example 2 - All variables are normally distributed p value of Shapiro-Wilk test review all graphs

37 Example 2 - No multicollinearity 1 2 3

38 Example 2 - No multicollinearity 1 2 3


39 Example 2 - No multicollinearity 1
 1")
 Normally distributed")
40 Example 2 - Independence of random errors (residuals) 1 Homoscedasticity (homogeneity of variance) Normally distributed errors
 1")
 Normally distributed")
41 Example 2 - Independence of random errors (residuals) 1 Homoscedasticity (homogeneity of variance) Normally distributed errors 2 3
 Normally")
42 Example 2 - Independence of random errors (residuals) Homoscedasticity (homogeneity of variance) Normally distributed errors
 1")
 Normally")
43 Example 2 - Independence of random errors (residuals) 1 Homoscedasticity (homogeneity of variance) Normally distributed errors 2
 Normally")
44 Example 2 - Independence of random errors (residuals) Homoscedasticity (homogeneity of variance) Normally distributed errors

45 Example 2 - Checking the assumptions for multiple linear regression Solution in Excel

46 Example 2 - Linear relationship between the independent and dependent variables 1 2 3

47 Example 2 - Linear relationship between the independent and dependent variables 1 2 3


48 Example 2 - All variables are normally distributed

49 Example 2 - All variables are normally distributed


50 Example 2 - No multicollinearity 1 2 3

51 Example 2 - No multicollinearity
 1")
 Normally distributed")
52 Example 2 - Independence of random errors (residuals) 1 Homoscedasticity (homogeneity of variance) Normally distributed errors
 Normally")
53 Example 2 - Independence of random errors (residuals) Homoscedasticity (homogeneity of variance) Normally distributed errors
 Normally")
54 Example 2 - Independence of random errors (residuals) Homoscedasticity (homogeneity of variance) Normally distributed errors
55 Example 2 - Independence of random errors (residuals) Homoscedasticity (homogeneity of variance) Normally distributed errors
STATS DOESN T SUCK! ~ CHAPTER 16
 SIMPLE LINEAR REGRESSION: STATS DOESN T SUCK! ~ CHAPTER 6 The HR manager at ACME food services wants to examine the relationship between a workers income and their years of experience on the job. He randomly
Chapter 7 Student Lecture Notes 7-1
 Chapter 7 Student Lecture Notes 7- Chapter Goals QM353: Business Statistics Chapter 7 Multiple Regression Analysis and Model Building After completing this chapter, you should be able to: Explain model
CS 147: Computer Systems Performance Analysis
 CS 147: Computer Systems Performance Analysis Advanced Regression Techniques CS 147: Computer Systems Performance Analysis Advanced Regression Techniques 1 / 31 Overview Overview Overview Common Transformations
Regression Analysis. BUS 735: Business Decision Making and Research
 Regression Analysis BUS 735: Business Decision Making and Research 1 Goals and Agenda Goals of this section Specific goals Learn how to detect relationships between ordinal and categorical variables. Learn
FAQ: Linear and Multiple Regression Analysis: Coefficients
 Question 1: How do I calculate a least squares regression line? Answer 1: Regression analysis is a statistical tool that utilizes the relation between two or more quantitative variables so that one variable
Chapter 14 Student Lecture Notes 14-1
 Chapter 14 Student Lecture Notes 14-1 Business Statistics: A Decision-Making Approach 6 th Edition Chapter 14 Multiple Regression Analysis and Model Building Chap 14-1 Chapter Goals After completing this
Inference with Simple Regression
 1 Introduction Inference with Simple Regression Alan B. Gelder 06E:071, The University of Iowa 1 Moving to infinite means: In this course we have seen one-mean problems, twomean problems, and problems
Trendlines Simple Linear Regression Multiple Linear Regression Systematic Model Building Practical Issues
 Trendlines Simple Linear Regression Multiple Linear Regression Systematic Model Building Practical Issues Overfitting Categorical Variables Interaction Terms Non-linear Terms Linear Logarithmic y = a +
Ch. 9 Pretest Correlation & Residuals
 Ch. 9 Pretest Correlation & Residuals Name Period 1. The number of students in a school chorus has increased since the school first opened 6 years ago. Predicted # Residual a) Find the Linear Regression
SMAM 314 Exam 49 Name. 1.Mark the following statements true or false (10 points-2 each)
") SMAM 314 Exam 49 Name 1.Mark the following statements true or false (10 points-2 each) _F A. When fitting a least square equation it is necessary that the observations come from a normal distribution.
SMAM 314 Exam 49 Name 1.Mark the following statements true or false (10 points-2 each) _F A. When fitting a least square equation it is necessary that the observations come from a normal distribution.
Simple Linear Regression Using Ordinary Least Squares
 Simple Linear Regression Using Ordinary Least Squares Purpose: To approximate a linear relationship with a line. Reason: We want to be able to predict Y using X. Definition: The Least Squares Regression
Chapter 14 Student Lecture Notes Department of Quantitative Methods & Information Systems. Business Statistics. Chapter 14 Multiple Regression
 Chapter 14 Student Lecture Notes 14-1 Department of Quantitative Methods & Information Systems Business Statistics Chapter 14 Multiple Regression QMIS 0 Dr. Mohammad Zainal Chapter Goals After completing
Chapter 14 Simple Linear Regression (A)
") Chapter 14 Simple Linear Regression (A) 1. Characteristics Managerial decisions often are based on the relationship between two or more variables. can be used to develop an equation showing how the variables
Chapter 14 Simple Linear Regression (A) 1. Characteristics Managerial decisions often are based on the relationship between two or more variables. can be used to develop an equation showing how the variables
Describe in words how the graph of each function below would differ from the graph of f (x).
.") MATH 111 Exam # Review (4.1-4.4, 6.1, 6.) Describe in words how the graph of each function below would differ from the graph of f (. 1. f ( x 7). f (. f ( 5 4. f ( 5. 7 f ( 6. f ( x ) 9 7. f ( 8. f ( 9.
MATH 111 Exam # Review (4.1-4.4, 6.1, 6.) Describe in words how the graph of each function below would differ from the graph of f (. 1. f ( x 7). f (. f ( 5 4. f ( 5. 7 f ( 6. f ( x ) 9 7. f ( 8. f ( 9.
Chapter 3 Multiple Regression Complete Example
 Department of Quantitative Methods & Information Systems ECON 504 Chapter 3 Multiple Regression Complete Example Spring 2013 Dr. Mohammad Zainal Review Goals After completing this lecture, you should be
Multicollinearity occurs when two or more predictors in the model are correlated and provide redundant information about the response.
 Multicollinearity Read Section 7.5 in textbook. Multicollinearity occurs when two or more predictors in the model are correlated and provide redundant information about the response. Example of multicollinear
Inferences for Regression
 Inferences for Regression An Example: Body Fat and Waist Size Looking at the relationship between % body fat and waist size (in inches). Here is a scatterplot of our data set: Remembering Regression In
Single and multiple linear regression analysis
 Single and multiple linear regression analysis Marike Cockeran 2017 Introduction Outline of the session Simple linear regression analysis SPSS example of simple linear regression analysis Additional topics
Analyzing Functions Maximum & Minimum Points Lesson 75
 (A) Lesson Objectives a. Understand what is meant by the term extrema as it relates to functions b. Use graphic and algebraic methods to determine extrema of a function c. Apply the concept of extrema
MATH 115: Review for Chapter 5
 MATH 5: Review for Chapter 5 Can you find the real zeros of a polynomial function and identify the behavior of the graph of the function at its zeros? For each polynomial function, identify the zeros of
BNAD 276 Lecture 10 Simple Linear Regression Model
 1 / 27 BNAD 276 Lecture 10 Simple Linear Regression Model Phuong Ho May 30, 2017 2 / 27 Outline 1 Introduction 2 3 / 27 Outline 1 Introduction 2 4 / 27 Simple Linear Regression Model Managerial decisions
15.063: Communicating with Data
 15.063: Communicating with Data Summer 2003 Recitation 6 Linear Regression Today s Content Linear Regression Multiple Regression Some Problems 15.063 - Summer '03 2 Linear Regression Why? What is it? Pros?
Regression Models. Chapter 4
 Chapter 4 Regression Models To accompany Quantitative Analysis for Management, Eleventh Edition, by Render, Stair, and Hanna Power Point slides created by Brian Peterson Introduction Regression analysis
Regression Models. Chapter 4. Introduction. Introduction. Introduction
 Chapter 4 Regression Models Quantitative Analysis for Management, Tenth Edition, by Render, Stair, and Hanna 008 Prentice-Hall, Inc. Introduction Regression analysis is a very valuable tool for a manager
MATH 2070 Test 3 (Sections , , & )
") Multiple Choice: Use a #2 pencil and completely fill in each bubble on your scantron to indicate the answer to each question. Each question has one correct answer. If you indicate more than one answer,
Multiple Choice: Use a #2 pencil and completely fill in each bubble on your scantron to indicate the answer to each question. Each question has one correct answer. If you indicate more than one answer,
Heteroscedasticity 1
 Heteroscedasticity 1 Pierre Nguimkeu BUEC 333 Summer 2011 1 Based on P. Lavergne, Lectures notes Outline Pure Versus Impure Heteroscedasticity Consequences and Detection Remedies Pure Heteroscedasticity
Six Sigma Black Belt Study Guides
 Six Sigma Black Belt Study Guides 1 www.pmtutor.org Powered by POeT Solvers Limited. Analyze Correlation and Regression Analysis 2 www.pmtutor.org Powered by POeT Solvers Limited. Variables and relationships
STA 108 Applied Linear Models: Regression Analysis Spring Solution for Homework #6
 STA 8 Applied Linear Models: Regression Analysis Spring 011 Solution for Homework #6 6. a) = 11 1 31 41 51 1 3 4 5 11 1 31 41 51 β = β1 β β 3 b) = 1 1 1 1 1 11 1 31 41 51 1 3 4 5 β = β 0 β1 β 6.15 a) Stem-and-leaf
Chapter 13. Multiple Regression and Model Building
 Chapter 13 Multiple Regression and Model Building Multiple Regression Models The General Multiple Regression Model y x x x 0 1 1 2 2... k k y is the dependent variable x, x,..., x 1 2 k the model are the
Statistics and Quantitative Analysis U4320. Segment 10 Prof. Sharyn O Halloran
 Statistics and Quantitative Analysis U4320 Segment 10 Prof. Sharyn O Halloran Key Points 1. Review Univariate Regression Model 2. Introduce Multivariate Regression Model Assumptions Estimation Hypothesis
DEMAND ESTIMATION (PART III)
") BEC 30325: MANAGERIAL ECONOMICS Session 04 DEMAND ESTIMATION (PART III) Dr. Sumudu Perera Session Outline 2 Multiple Regression Model Test the Goodness of Fit Coefficient of Determination F Statistic t
BEC 30325: MANAGERIAL ECONOMICS Session 04 DEMAND ESTIMATION (PART III) Dr. Sumudu Perera Session Outline 2 Multiple Regression Model Test the Goodness of Fit Coefficient of Determination F Statistic t
Making sense of Econometrics: Basics
 Making sense of Econometrics: Basics Lecture 7: Multicollinearity Egypt Scholars Economic Society November 22, 2014 Assignment & feedback Multicollinearity enter classroom at room name c28efb78 http://b.socrative.com/login/student/
Regression Analysis. BUS 735: Business Decision Making and Research. Learn how to detect relationships between ordinal and categorical variables.
 Regression Analysis BUS 735: Business Decision Making and Research 1 Goals of this section Specific goals Learn how to detect relationships between ordinal and categorical variables. Learn how to estimate
AMS 315/576 Lecture Notes. Chapter 11. Simple Linear Regression
 AMS 315/576 Lecture Notes Chapter 11. Simple Linear Regression 11.1 Motivation A restaurant opening on a reservations-only basis would like to use the number of advance reservations x to predict the number
Chapter 4. Regression Models. Learning Objectives
 Chapter 4 Regression Models To accompany Quantitative Analysis for Management, Eleventh Edition, by Render, Stair, and Hanna Power Point slides created by Brian Peterson Learning Objectives After completing
Instantaneous Rate of Change
 Instantaneous Rate of Change Lecture 13 Section 2.1 Robb T. Koether Hampden-Sydney College Wed, Feb 8, 2017 Robb T. Koether (Hampden-Sydney College) Instantaneous Rate of Change Wed, Feb 8, 2017 1 / 11
Regression Models REVISED TEACHING SUGGESTIONS ALTERNATIVE EXAMPLES
 M04_REND6289_10_IM_C04.QXD 5/7/08 2:49 PM Page 46 4 C H A P T E R Regression Models TEACHING SUGGESTIONS Teaching Suggestion 4.1: Which Is the Independent Variable? We find that students are often confused
A discussion on multiple regression models
 A discussion on multiple regression models In our previous discussion of simple linear regression, we focused on a model in which one independent or explanatory variable X was used to predict the value
Regression Analysis Primer DEO PowerPoint, Bureau of Labor Market Statistics
 Regression Analysis Primer DEO PowerPoint, Bureau of Labor Market Statistics September 27-30, 2017 Regression Analysis Stephen Birch, Economic Consultant LTIP Technical Lead, Projections Managing Partnership
2. Linear regression with multiple regressors
 2. Linear regression with multiple regressors Aim of this section: Introduction of the multiple regression model OLS estimation in multiple regression Measures-of-fit in multiple regression Assumptions
Reducing Computation Time for the Analysis of Large Social Science Datasets
 Reducing Computation Time for the Analysis of Large Social Science Datasets Douglas G. Bonett Center for Statistical Analysis in the Social Sciences University of California, Santa Cruz Jan 28, 2014 Overview
Lesson 2: Exploring Quadratic Relations Quad Regression Unit 5 Quadratic Relations
 (A) Lesson Context BIG PICTURE of this UNIT: CONTEXT of this LESSON: How do we analyze and then work with a data set that shows both increase and decrease What is a parabola and what key features do they
IMPORTANT NOTES HERE IS AN EXAMPLE OF A SCANTRON FORM FOR YOUR EXAM.
 IMPORTANT NOTES HERE IS AN EXAMPLE OF A SCANTRON FORM FOR YOUR EXAM. YOU NEED TO MAKE SURE YOU PROPERLY FILL OUT THE SCANTRON FORM.. Write and bubble in your first and last name.. VERY important, write
Ch 13 & 14 - Regression Analysis
 Ch 3 & 4 - Regression Analysis Simple Regression Model I. Multiple Choice:. A simple regression is a regression model that contains a. only one independent variable b. only one dependent variable c. more
COLLEGE ALGEBRA. Linear Functions & Systems of Linear Equations
 COLLEGE ALGEBRA By: Sister Mary Rebekah www.survivormath.weebly.com Cornell-Style Fill in the Blank Notes and Teacher s Key Linear Functions & Systems of Linear Equations 1 2 Slope & the Slope Formula
Chapter 8: Regression Models with Qualitative Predictors
 Chapter 8: Regression Models with Qualitative Predictors Some predictors may be binary (e.g., male/female) or otherwise categorical (e.g., small/medium/large). These typically enter the regression model
2. Outliers and inference for regression
 Unit6: Introductiontolinearregression 2. Outliers and inference for regression Sta 101 - Spring 2016 Duke University, Department of Statistical Science Dr. Çetinkaya-Rundel Slides posted at http://bit.ly/sta101_s16
Math 1314 Lesson 19: Numerical Integration
 Math 1314 Lesson 19: Numerical Integration For more complicated functions, we will use GeoGebra to find the definite integral. These will include functions that involve the exponential function, logarithms,
The simple linear regression model discussed in Chapter 13 was written as
 1519T_c14 03/27/2006 07:28 AM Page 614 Chapter Jose Luis Pelaez Inc/Blend Images/Getty Images, Inc./Getty Images, Inc. 14 Multiple Regression 14.1 Multiple Regression Analysis 14.2 Assumptions of the Multiple
Basic Business Statistics 6 th Edition
 Basic Business Statistics 6 th Edition Chapter 12 Simple Linear Regression Learning Objectives In this chapter, you learn: How to use regression analysis to predict the value of a dependent variable based
Chapter 4: Regression Models
 Sales volume of company 1 Textbook: pp. 129-164 Chapter 4: Regression Models Money spent on advertising 2 Learning Objectives After completing this chapter, students will be able to: Identify variables,
Class 15. Daniel B. Rowe, Ph.D. Department of Mathematics, Statistics, and Computer Science. Marquette University MATH 1700
 Class 15 Daniel B. Rowe, Ph.D. Department of Mathematics, Statistics, and Computer Science Copyright 17 by D.B. Rowe 1 Agenda: Recap Chapter 7.1 7. Lecture Chapter 7. Discussion of Chapters Problem Solving
S The Over-Reliance on the Central Limit Theorem
 S04-2008 The Over-Reliance on the Central Limit Theorem Abstract The objective is to demonstrate the theoretical and practical implication of the central limit theorem. The theorem states that as n approaches
Unit 8: Designs Applied Math 30. Unit 8: Designs
 8-1: Reviewing Perimeter, Area, Surface Area and Volume Perimeter: - the length (one-dimensional) around an object. Area: - the amount of space (two-dimensional) a flat-object occupies. Surface Area: -
Chapter 15 Multiple Regression
 Multiple Regression Learning Objectives 1. Understand how multiple regression analysis can be used to develop relationships involving one dependent variable and several independent variables. 2. Be able
The Multiple Regression Model
 Multiple Regression The Multiple Regression Model Idea: Examine the linear relationship between 1 dependent (Y) & or more independent variables (X i ) Multiple Regression Model with k Independent Variables:
Chapter 16. Simple Linear Regression and Correlation
 Chapter 16 Simple Linear Regression and Correlation 16.1 Regression Analysis Our problem objective is to analyze the relationship between interval variables; regression analysis is the first tool we will
Exercises on Chapter 2: Linear Regression with one independent variable:
 Exercises on Chapter 2: Linear Regression with one independent variable: Summary: Simple Linear Regression Model: (distribution of error terms unspecified) (2.1) where, value of the response variable in
Math 142 Lecture Notes. Section 7.1 Area between curves
 Math 4 Lecture Notes Section 7. Area between curves A) Introduction Now, we want to find the area between curves using the concept of definite integral. Let's assume we want to find the area between the
Econ 3790: Statistics Business and Economics. Instructor: Yogesh Uppal
 Econ 3790: Statistics Business and Economics Instructor: Yogesh Uppal Email: yuppal@ysu.edu Chapter 14 Covariance and Simple Correlation Coefficient Simple Linear Regression Covariance Covariance between
Eco 391, J. Sandford, spring 2013 April 5, Midterm 3 4/5/2013
 Midterm 3 4/5/2013 Instructions: You may use a calculator, and one sheet of notes. You will never be penalized for showing work, but if what is asked for can be computed directly, points awarded will depend
1 Functions And Change
 1 Functions And Change 1.1 What Is a Function? * Function A function is a rule that takes certain numbers as inputs and assigns to each a definite output number. The set of all input numbers is called
Last updated: Oct 18, 2012 LINEAR REGRESSION PSYC 3031 INTERMEDIATE STATISTICS LABORATORY. J. Elder
 Last updated: Oct 18, 2012 LINEAR REGRESSION Acknowledgements 2 Some of these slides have been sourced or modified from slides created by A. Field for Discovering Statistics using R. Simple Linear Objectives
The Model Building Process Part I: Checking Model Assumptions Best Practice (Version 1.1)
") The Model Building Process Part I: Checking Model Assumptions Best Practice (Version 1.1) Authored by: Sarah Burke, PhD Version 1: 31 July 2017 Version 1.1: 24 October 2017 The goal of the STAT T&E COE
The Model Building Process Part I: Checking Model Assumptions Best Practice (Version 1.1) Authored by: Sarah Burke, PhD Version 1: 31 July 2017 Version 1.1: 24 October 2017 The goal of the STAT T&E COE
Biostatistics and Design of Experiments Prof. Mukesh Doble Department of Biotechnology Indian Institute of Technology, Madras
 Biostatistics and Design of Experiments Prof. Mukesh Doble Department of Biotechnology Indian Institute of Technology, Madras Lecture - 39 Regression Analysis Hello and welcome to the course on Biostatistics
Simple Linear Regression
 Simple Linear Regression ST 430/514 Recall: A regression model describes how a dependent variable (or response) Y is affected, on average, by one or more independent variables (or factors, or covariates)
Student study guide for the MAT 151 Spring 2016 final examination
 Student study guide for the MAT 151 Spring 016 final examination Use the problems in this study guide to help you prepare for the problems on the final. The problems below are similar to the ones on the
Exam details. Final Review Session. Things to Review
 Exam details Final Review Session Short answer, similar to book problems Formulae and tables will be given You CAN use a calculator Date and Time: Dec. 7, 006, 1-1:30 pm Location: Osborne Centre, Unit
Business Statistics. Chapter 14 Introduction to Linear Regression and Correlation Analysis QMIS 220. Dr. Mohammad Zainal
 Department of Quantitative Methods & Information Systems Business Statistics Chapter 14 Introduction to Linear Regression and Correlation Analysis QMIS 220 Dr. Mohammad Zainal Chapter Goals After completing
Correlation Analysis
 Simple Regression Correlation Analysis Correlation analysis is used to measure strength of the association (linear relationship) between two variables Correlation is only concerned with strength of the
Multiple Regression Analysis
 Chapter 4 Multiple Regression Analysis The simple linear regression covered in Chapter 2 can be generalized to include more than one variable. Multiple regression analysis is an extension of the simple
The Model Building Process Part I: Checking Model Assumptions Best Practice
 The Model Building Process Part I: Checking Model Assumptions Best Practice Authored by: Sarah Burke, PhD 31 July 2017 The goal of the STAT T&E COE is to assist in developing rigorous, defensible test
ST430 Exam 2 Solutions
 ST430 Exam 2 Solutions Date: November 9, 2015 Name: Guideline: You may use one-page (front and back of a standard A4 paper) of notes. No laptop or textbook are permitted but you may use a calculator. Giving
Regression analysis is a tool for building mathematical and statistical models that characterize relationships between variables Finds a linear
 Regression analysis is a tool for building mathematical and statistical models that characterize relationships between variables Finds a linear relationship between: - one independent variable X and -
Ref.: Spring SOS3003 Applied data analysis for social science Lecture note
 SOS3003 Applied data analysis for social science Lecture note 05-2010 Erling Berge Department of sociology and political science NTNU Spring 2010 Erling Berge 2010 1 Literature Regression criticism I Hamilton
Simple Regression Model (Assumptions)
") Simple Regression Model (Assumptions) Lecture 18 Reading: Sections 18.1, 18., Logarithms in Regression Analysis with Asiaphoria, 19.6 19.8 (Optional: Normal probability plot pp. 607-8) 1 Height son, inches
Simple Regression Model (Assumptions) Lecture 18 Reading: Sections 18.1, 18., Logarithms in Regression Analysis with Asiaphoria, 19.6 19.8 (Optional: Normal probability plot pp. 607-8) 1 Height son, inches
Regression With a Categorical Independent Variable
 Regression ith a Independent Variable ERSH 8320 Slide 1 of 34 Today s Lecture Regression with a single categorical independent variable. Today s Lecture Coding procedures for analysis. Dummy coding. Relationship
Two-Variable Analysis: Simple Linear Regression/ Correlation
 Two-Variable Analysis: Simple Linear Regression/ Correlation 1 Topics I. Scatter Plot (X-Y Graph) II. III. Simple Linear Regression Correlation, R IV. Assessing Model Accuracy, R 2 V. Regression Abuses
Simple Linear Regression
 Simple Linear Regression 1 Correlation indicates the magnitude and direction of the linear relationship between two variables. Linear Regression: variable Y (criterion) is predicted by variable X (predictor)
the logic of parametric tests
 the logic of parametric tests define the test statistic (e.g. mean) compare the observed test statistic to a distribution calculated for random samples that are drawn from a single (normal) distribution.
Chapter 5 Least Squares Regression
 Chapter 5 Least Squares Regression A Royal Bengal tiger wandered out of a reserve forest. We tranquilized him and want to take him back to the forest. We need an idea of his weight, but have no scale!
Chapter 16. Simple Linear Regression and dcorrelation
 Chapter 16 Simple Linear Regression and dcorrelation 16.1 Regression Analysis Our problem objective is to analyze the relationship between interval variables; regression analysis is the first tool we will
MBA Statistics COURSE #4
 MBA Statistics 51-651-00 COURSE #4 Simple and multiple linear regression What should be the sales of ice cream? Example: Before beginning building a movie theater, one must estimate the daily number of
This document consists of 8 printed pages and 0 blank page.
 SERANGOON JUNIOR COLLEGE 07 JC PRELIMINARY EXAMINATION MATHEMATICS Higher 8865/0 Tuesday Sep 07 Hours Additional materials: Writing paper List of Formulae (MF6) READ THESE INSTRUCTIONS FIRST Write your
The ε ij (i.e. the errors or residuals) are normally distributed. This assumption has the least influence on the F test.
 are normally distributed. This assumption has the least influence on the F test.") Lecture 11 Topic 8: Data Transformations Assumptions of the Analysis of Variance 1. Independence of errors The ε ij (i.e. the errors or residuals) are statistically independent from one another. Failure
Lecture 11 Topic 8: Data Transformations Assumptions of the Analysis of Variance 1. Independence of errors The ε ij (i.e. the errors or residuals) are statistically independent from one another. Failure
Lecture 2: Linear and Mixed Models
 Lecture 2: Linear and Mixed Models Bruce Walsh lecture notes Introduction to Mixed Models SISG, Seattle 18 20 July 2018 1 Quick Review of the Major Points The general linear model can be written as y =
Interactions. Interactions. Lectures 1 & 2. Linear Relationships. y = a + bx. Slope. Intercept
 Interactions Lectures 1 & Regression Sometimes two variables appear related: > smoking and lung cancers > height and weight > years of education and income > engine size and gas mileage > GMAT scores and
Data Analysis and Statistical Methods Statistics 651
 y 1 2 3 4 5 6 7 x Data Analysis and Statistical Methods Statistics 651 http://www.stat.tamu.edu/~suhasini/teaching.html Lecture 32 Suhasini Subba Rao Previous lecture We are interested in whether a dependent
2-5 Solving Equations Containing Integers. Warm Up Problem of the Day Lesson Presentation Lesson Quizzes
 Warm Up Problem of the Day Lesson Presentation Lesson Quizzes Warm Up Use mental math to find each solution. 1. 7 + y = 15 2. x 9 = 9 3. 6x = 24 4. x 12 = 30 Problem of the Day Zelda sold her wet suit
Statistics For Economics & Business
 Statistics For Economics & Business Analysis of Variance In this chapter, you learn: Learning Objectives The basic concepts of experimental design How to use one-way analysis of variance to test for differences
MATH 2070 Test 3 (Sections , , & )
") Multiple Choice: Use a #2 pencil and completely fill in each bubble on your scantron to indicate the answer to each question. Each question has one correct answer. If you indicate more than one answer,
Multiple Choice: Use a #2 pencil and completely fill in each bubble on your scantron to indicate the answer to each question. Each question has one correct answer. If you indicate more than one answer,
regression analysis is a type of inferential statistics which tells us whether relationships between two or more variables exist
 regression analysis is a type of inferential statistics which tells us whether relationships between two or more variables exist sales $ (y - dependent variable) advertising $ (x - independent variable)
Mathematical Modeling
 Mathematical Modeling Sample Problem: The chart below gives the profit for a company for the years 1990 to 1999, where 0 corresponds to 1990 and the profit is in millions of dollars. Year 0 1 2 3 4 5 6
610 - R1A "Make friends" with your data Psychology 610, University of Wisconsin-Madison
 610 - R1A "Make friends" with your data Psychology 610, University of Wisconsin-Madison Prof Colleen F. Moore Note: The metaphor of making friends with your data was used by Tukey in some of his writings.
Maximums and Minimums
 Maximums and Minimums Lecture 25 Section 3.1 Robb T. Koether Hampden-Sydney College Mon, Mar 6, 2017 Robb T. Koether (Hampden-Sydney College) Maximums and Minimums Mon, Mar 6, 2017 1 / 9 Objectives Objectives
Topic 8. Data Transformations [ST&D section 9.16]
![Topic 8. Data Transformations [ST&D section 9.16]](/thumbs/83/87808537.jpg "Topic 8. Data Transformations [ST&D section 9.16]") Topic 8. Data Transformations [ST&D section 9.16] 8.1 The assumptions of ANOVA For ANOVA, the linear model for the RCBD is: Y ij = µ + τ i + β j + ε ij There are four key assumptions implicit in this model.
Topic 8. Data Transformations [ST&D section 9.16] 8.1 The assumptions of ANOVA For ANOVA, the linear model for the RCBD is: Y ij = µ + τ i + β j + ε ij There are four key assumptions implicit in this model.
Chapter 12 - Part I: Correlation Analysis
 ST coursework due Friday, April - Chapter - Part I: Correlation Analysis Textbook Assignment Page - # Page - #, Page - # Lab Assignment # (available on ST webpage) GOALS When you have completed this lecture,
Linear Regression and Correlation
 Linear Regression and Correlation Chapter 13 McGraw-Hill/Irwin Copyright 2010 by The McGraw-Hill Companies, Inc. All rights reserved. GOALS 1. Understand and interpret the terms dependent and independent
Intro to Linear Regression
 Intro to Linear Regression Introduction to Regression Regression is a statistical procedure for modeling the relationship among variables to predict the value of a dependent variable from one or more predictor
SALES AND MARKETING Department MATHEMATICS. 2nd Semester. Bivariate statistics. Tutorials and exercises
 SALES AND MARKETING Department MATHEMATICS 2nd Semester Bivariate statistics Tutorials and exercises Online document: http://jff-dut-tc.weebly.com section DUT Maths S2. IUT de Saint-Etienne Département