DEMAND ESTIMATION (PART III)
|
|
|
- Lynette Watkins
- 6 years ago
- Views:
Transcription
1 BEC 30325: MANAGERIAL ECONOMICS Session 04 DEMAND ESTIMATION (PART III) Dr. Sumudu Perera
2 Session Outline 2 Multiple Regression Model Test the Goodness of Fit Coefficient of Determination F Statistic t Test Statistic Problems in Regression Analysis Steps in Demand Estimation Dr.Sumudu Perera 04/10/2017

3 Multiple Regression Model Relationship between 1 dependent & 2 or more independent variables is a linear function Identification of variables: Dependent Variable, Independent Variable Identify/interpret the Intercept Identification and Interpretation of Coefficients
4 Multiple Regression with the support of Software Collect data Data Entry Selection of Variables Selection of Measurements to each variable Model Development Run Regression Test the Goodness of Fit Interpret the Results
5 Test the Goodness of Fit Coefficient of Determination -R Squared Test the Overall Fitness of the Model Test the significance of independent variables

6 Coefficient of Determination It measures the proportion of the total variation in the dependent variable that is explained by the variation in the independent or explanatory variables in the regression. 2 SSR r Y, 12 SST R eg ressio n S tatistics M u lt ip le R R S q u a re A d ju s t e d R S q u a re S t a n d a rd E rro r O b s e rva t io n s 15
7 Interpretation of Coefficient of Multiple Determination 7 Value lies between 0 and 1. Ex: 0.95 means 95 % of total variation is explained by the model Closer to one shows that more of the variation is explained by the model
8 Testing for Overall Significance 8 It shows whether the variation in the independent variables is explained by the variations in the dependent variable. Use F Test Statistic Hypotheses: H 0 : 1 2 k = 0 (No independent variable affect the dependent variable) H 1 : At least one i 0 ( At least one independent variable affects Y )

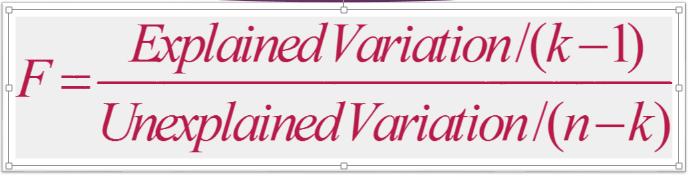
9 F Statistic 9
10 Test for Overall Significance Excel Output: Example 10 k = 3, no of parameters ANOVA df SS MS F Significance F Regression E-09 Residual Total k -1= 2, the number of explanatory variables and dependent variable n - 1 p-value
11 Test for Overall Significance: Example Solution 11 H 0 : 1 = 2 = = k = 0 H 1 : At least one j 0 =.05 df = 2 and 12 Critical Value: 0 = Test Statistic: F Decision: Reject at = Conclusion: There is evidence that at least one independent variable affects Y.
12 t Test Statistic Test the significance of independent variables Ho: b1=0 Have to do separately for each variable If the hypothesis is rejected, it means the variable make a significant impact on the dependent variable Use t statistic
13 t Test Statistic Excel Output: Example 13 t Test Statistic for X 1 (Temperature) Coefficients Standard Error t Stat P-value Intercept E-12 Temp E-09 Insulation E-06 t b S i b i t Test Statistic for X 2 (Insulation)
14 t Test : Example Solution 14 H 0 : 1 = 0 H 1 : 1 0 df = 12 Critical Values: Reject H 0 Reject H Test Statistic: t Test Statistic = Decision: Reject H 0 at = Conclusion: There is evidence of a significant effect of temperature on oil consumption holding constant the effect of insulation.
15 Example 01 Regression Output 15 Summary Findings of the Consumer Survey- Lux Soap Qd x = P x C x S x I A t Statistic ( ) ( ) ( ) ( ) ( ) ( ) Where, P x = Price of the Product, C x = Price of the Competitive Products (Ayuruwedha Soaps), S x = Price of the Substitution Products, I = per capita income, A = Advertising expenses, Qd x = Lux Sales Quantity and the t-statistics are shown in parentheses. R 2 = Sample Size = 23 Standard Error (Regression) = F statistic = Significance Level = 10% Dr.Sumudu Perera 04/10/2017
16 Example 02 Regression Output
17 Questions The regression output is related to demand for 18PK type bottle cases. The estimated coefficients and the other statistics are provided in the following output table. Interpret the estimated demand function. What is implied by the t-statistic value of the estimate of PRICE_18PK? Using the P-value, discuss the significance of the independent variable. Discuss the overall explanatory power of the model for CASES_18PK.
18 Problems in Regression Analysis 18 Multicollinearity: Two or more explanatory variables are highly correlated. Heteroskedasticity: Variance of error term is not independent of the Y variable. Autocorrelation: Consecutive error terms are correlated. Functional form: Misspecified by the omission of a variable Normality: Residuals are normally distributed or not
19 Practical Consequences of Multicollinearity 19 Large variance or standard error Wider confidence intervals Insignificant t-ratios A high R 2 value but few significant t-ratios OLS estimators and their Std. Errors tend to be unstable Wrong signs for regression coefficients
20 Multicollinearity 20 How can Multicollinearity be overcome? Increasing number of observation Acquiring additional data A new sample Using an experience from a previous study Transformation of the variables Dropping a variable from the model This is the simplest solution, but the worse one referring an economic model (i.e., model specification error)
21 Heteroskedasticity 21 Heteroskedasticity: Variance of error term is not independent of the Y variable or unequal/non-constant variance. This means that when both response and explanatory variables increase, the variance of response variables does not remain same at all levels of explanatory variables (cross-sectional data). Homoscedasticity: when both response and explanatory variables increase, the variance of response variable around its mean value remains same at all levels of explanatory variables (equal variance).
22 Residual Analysis for Homoscedasticity 22 Y Y SR X SR X X X Heteroscedasticity Homoscedasticity
23 Autocorrelation or serial correlation 23 Autocorrelation: Correlation between members of observation ordered in time as in time series data (i.e., residuals are correlated where consecutive errors have the same sign). Detecting Autocorrelation: This can be detected by many ways. The most common used is DW statistics.

24 Durbin-Watson Statistic 24 Test for Autocorrelation If d=2, autocorrelation is absent.
25 Residual Analysis for Independence 25 The Durbin-Watson Statistic Used when data is collected over time to detect autocorrelation (residuals in one time period are related to residuals in another period) Measures violation of independence assumption D n i2 ( e e ) i n i1 e 2 i i1 2 Should be close to 2. If not, examine the model for autocorrelation.
26 Residual Analysis for Independence 26 Graphical Approach e Not Independent e Independent Time Time Cyclical Pattern No Particular Pattern Residual is Plotted Against Time to Detect Any Autocorrelation
27 Using the Durbin-Watson Statistic 27 H 0 H 1 : No autocorrelation (error terms are independent) : There is autocorrelation (error terms are not) Reject H 0 (positive autocorrelation) Inconclusive Reject H 0 Accept H 0 (no autocorrelation) (negative autocorrelation) 0 d L d U 2 4-d U 4-d L 4
28 Steps in Demand Estimation 28 Model Specification: Identify Variables Collect Data Specify Functional Form Estimate Function Test the Results
Regression Analysis. BUS 735: Business Decision Making and Research. Learn how to detect relationships between ordinal and categorical variables.
 Regression Analysis BUS 735: Business Decision Making and Research 1 Goals of this section Specific goals Learn how to detect relationships between ordinal and categorical variables. Learn how to estimate
The Multiple Regression Model
 Multiple Regression The Multiple Regression Model Idea: Examine the linear relationship between 1 dependent (Y) & or more independent variables (X i ) Multiple Regression Model with k Independent Variables:
Econometrics Part Three
 !1 I. Heteroskedasticity A. Definition 1. The variance of the error term is correlated with one of the explanatory variables 2. Example -- the variance of actual spending around the consumption line increases
Statistics for Managers using Microsoft Excel 6 th Edition
 Statistics for Managers using Microsoft Excel 6 th Edition Chapter 13 Simple Linear Regression 13-1 Learning Objectives In this chapter, you learn: How to use regression analysis to predict the value of
Chapter 14 Student Lecture Notes Department of Quantitative Methods & Information Systems. Business Statistics. Chapter 14 Multiple Regression
 Chapter 14 Student Lecture Notes 14-1 Department of Quantitative Methods & Information Systems Business Statistics Chapter 14 Multiple Regression QMIS 0 Dr. Mohammad Zainal Chapter Goals After completing
ECON 4230 Intermediate Econometric Theory Exam
 ECON 4230 Intermediate Econometric Theory Exam Multiple Choice (20 pts). Circle the best answer. 1. The Classical assumption of mean zero errors is satisfied if the regression model a) is linear in the
Chapter 7 Student Lecture Notes 7-1
 Chapter 7 Student Lecture Notes 7- Chapter Goals QM353: Business Statistics Chapter 7 Multiple Regression Analysis and Model Building After completing this chapter, you should be able to: Explain model
LECTURE 11. Introduction to Econometrics. Autocorrelation
 LECTURE 11 Introduction to Econometrics Autocorrelation November 29, 2016 1 / 24 ON PREVIOUS LECTURES We discussed the specification of a regression equation Specification consists of choosing: 1. correct
Correlation Analysis
 Simple Regression Correlation Analysis Correlation analysis is used to measure strength of the association (linear relationship) between two variables Correlation is only concerned with strength of the
MULTIPLE REGRESSION AND ISSUES IN REGRESSION ANALYSIS
 MULTIPLE REGRESSION AND ISSUES IN REGRESSION ANALYSIS Page 1 MSR = Mean Regression Sum of Squares MSE = Mean Squared Error RSS = Regression Sum of Squares SSE = Sum of Squared Errors/Residuals α = Level
CHAPTER 6: SPECIFICATION VARIABLES
 Recall, we had the following six assumptions required for the Gauss-Markov Theorem: 1. The regression model is linear, correctly specified, and has an additive error term. 2. The error term has a zero
Basic Business Statistics 6 th Edition
 Basic Business Statistics 6 th Edition Chapter 12 Simple Linear Regression Learning Objectives In this chapter, you learn: How to use regression analysis to predict the value of a dependent variable based
Chapter 14 Student Lecture Notes 14-1
 Chapter 14 Student Lecture Notes 14-1 Business Statistics: A Decision-Making Approach 6 th Edition Chapter 14 Multiple Regression Analysis and Model Building Chap 14-1 Chapter Goals After completing this
Diagnostics of Linear Regression
 Diagnostics of Linear Regression Junhui Qian October 7, 14 The Objectives After estimating a model, we should always perform diagnostics on the model. In particular, we should check whether the assumptions
Chapter 14 Simple Linear Regression (A)
") Chapter 14 Simple Linear Regression (A) 1. Characteristics Managerial decisions often are based on the relationship between two or more variables. can be used to develop an equation showing how the variables
Chapter 14 Simple Linear Regression (A) 1. Characteristics Managerial decisions often are based on the relationship between two or more variables. can be used to develop an equation showing how the variables
Inferences for Regression
 Inferences for Regression An Example: Body Fat and Waist Size Looking at the relationship between % body fat and waist size (in inches). Here is a scatterplot of our data set: Remembering Regression In
Applied Econometrics. Applied Econometrics. Applied Econometrics. Applied Econometrics. What is Autocorrelation. Applied Econometrics
 Autocorrelation 1. What is 2. What causes 3. First and higher orders 4. Consequences of 5. Detecting 6. Resolving Learning Objectives 1. Understand meaning of in the CLRM 2. What causes 3. Distinguish
Chapter 3 Multiple Regression Complete Example
 Department of Quantitative Methods & Information Systems ECON 504 Chapter 3 Multiple Regression Complete Example Spring 2013 Dr. Mohammad Zainal Review Goals After completing this lecture, you should be
Regression Analysis. BUS 735: Business Decision Making and Research
 Regression Analysis BUS 735: Business Decision Making and Research 1 Goals and Agenda Goals of this section Specific goals Learn how to detect relationships between ordinal and categorical variables. Learn
STA121: Applied Regression Analysis
 STA121: Applied Regression Analysis Linear Regression Analysis - Chapters 3 and 4 in Dielman Artin Department of Statistical Science September 15, 2009 Outline 1 Simple Linear Regression Analysis 2 Using
FinQuiz Notes
 Reading 10 Multiple Regression and Issues in Regression Analysis 2. MULTIPLE LINEAR REGRESSION Multiple linear regression is a method used to model the linear relationship between a dependent variable
Iris Wang.
 Chapter 10: Multicollinearity Iris Wang iris.wang@kau.se Econometric problems Multicollinearity What does it mean? A high degree of correlation amongst the explanatory variables What are its consequences?
Basic Business Statistics, 10/e
 Chapter 4 4- Basic Business Statistics th Edition Chapter 4 Introduction to Multiple Regression Basic Business Statistics, e 9 Prentice-Hall, Inc. Chap 4- Learning Objectives In this chapter, you learn:
Heteroscedasticity 1
 Heteroscedasticity 1 Pierre Nguimkeu BUEC 333 Summer 2011 1 Based on P. Lavergne, Lectures notes Outline Pure Versus Impure Heteroscedasticity Consequences and Detection Remedies Pure Heteroscedasticity
Regression Analysis II
 Regression Analysis II Measures of Goodness of fit Two measures of Goodness of fit Measure of the absolute fit of the sample points to the sample regression line Standard error of the estimate An index
Business Statistics. Chapter 14 Introduction to Linear Regression and Correlation Analysis QMIS 220. Dr. Mohammad Zainal
 Department of Quantitative Methods & Information Systems Business Statistics Chapter 14 Introduction to Linear Regression and Correlation Analysis QMIS 220 Dr. Mohammad Zainal Chapter Goals After completing
Chapter 13. Multiple Regression and Model Building
 Chapter 13 Multiple Regression and Model Building Multiple Regression Models The General Multiple Regression Model y x x x 0 1 1 2 2... k k y is the dependent variable x, x,..., x 1 2 k the model are the
Exercise E7. Heteroskedasticity and Autocorrelation. Pilar González and Susan Orbe. Dpt. Applied Economics III (Econometrics and Statistics)
") Exercise E7 Heteroskedasticity and Autocorrelation Pilar González and Susan Orbe Dpt. Applied Economics III (Econometrics and Statistics) Pilar González and Susan Orbe OCW 2014 E7 Heteroskedasticity and
Exercise E7 Heteroskedasticity and Autocorrelation Pilar González and Susan Orbe Dpt. Applied Economics III (Econometrics and Statistics) Pilar González and Susan Orbe OCW 2014 E7 Heteroskedasticity and
Regression Models. Chapter 4. Introduction. Introduction. Introduction
 Chapter 4 Regression Models Quantitative Analysis for Management, Tenth Edition, by Render, Stair, and Hanna 008 Prentice-Hall, Inc. Introduction Regression analysis is a very valuable tool for a manager
Chapter 4. Regression Models. Learning Objectives
 Chapter 4 Regression Models To accompany Quantitative Analysis for Management, Eleventh Edition, by Render, Stair, and Hanna Power Point slides created by Brian Peterson Learning Objectives After completing
A discussion on multiple regression models
 A discussion on multiple regression models In our previous discussion of simple linear regression, we focused on a model in which one independent or explanatory variable X was used to predict the value
Multiple Regression. Peerapat Wongchaiwat, Ph.D.
 Peerapat Wongchaiwat, Ph.D. wongchaiwat@hotmail.com The Multiple Regression Model Examine the linear relationship between 1 dependent (Y) & 2 or more independent variables (X i ) Multiple Regression Model
Outline. Nature of the Problem. Nature of the Problem. Basic Econometrics in Transportation. Autocorrelation
 1/30 Outline Basic Econometrics in Transportation Autocorrelation Amir Samimi What is the nature of autocorrelation? What are the theoretical and practical consequences of autocorrelation? Since the assumption
Answer all questions from part I. Answer two question from part II.a, and one question from part II.b.
 B203: Quantitative Methods Answer all questions from part I. Answer two question from part II.a, and one question from part II.b. Part I: Compulsory Questions. Answer all questions. Each question carries
Making sense of Econometrics: Basics
 Making sense of Econometrics: Basics Lecture 7: Multicollinearity Egypt Scholars Economic Society November 22, 2014 Assignment & feedback Multicollinearity enter classroom at room name c28efb78 http://b.socrative.com/login/student/
Stat 500 Midterm 2 12 November 2009 page 0 of 11
 Stat 500 Midterm 2 12 November 2009 page 0 of 11 Please put your name on the back of your answer book. Do NOT put it on the front. Thanks. Do not start until I tell you to. The exam is closed book, closed
Multiple Regression Analysis. Part III. Multiple Regression Analysis
 Part III Multiple Regression Analysis As of Sep 26, 2017 1 Multiple Regression Analysis Estimation Matrix form Goodness-of-Fit R-square Adjusted R-square Expected values of the OLS estimators Irrelevant
AUTOCORRELATION. Phung Thanh Binh
 AUTOCORRELATION Phung Thanh Binh OUTLINE Time series Gauss-Markov conditions The nature of autocorrelation Causes of autocorrelation Consequences of autocorrelation Detecting autocorrelation Remedial measures
BNAD 276 Lecture 10 Simple Linear Regression Model
 1 / 27 BNAD 276 Lecture 10 Simple Linear Regression Model Phuong Ho May 30, 2017 2 / 27 Outline 1 Introduction 2 3 / 27 Outline 1 Introduction 2 4 / 27 Simple Linear Regression Model Managerial decisions
(ii) Scan your answer sheets INTO ONE FILE only, and submit it in the drop-box.
 Scan your answer sheets INTO ONE FILE only, and submit it in the drop-box.") FINAL EXAM ** Two different ways to submit your answer sheet (i) Use MS-Word and place it in a drop-box. (ii) Scan your answer sheets INTO ONE FILE only, and submit it in the drop-box. Deadline: December
FINAL EXAM ** Two different ways to submit your answer sheet (i) Use MS-Word and place it in a drop-box. (ii) Scan your answer sheets INTO ONE FILE only, and submit it in the drop-box. Deadline: December
The simple linear regression model discussed in Chapter 13 was written as
 1519T_c14 03/27/2006 07:28 AM Page 614 Chapter Jose Luis Pelaez Inc/Blend Images/Getty Images, Inc./Getty Images, Inc. 14 Multiple Regression 14.1 Multiple Regression Analysis 14.2 Assumptions of the Multiple
Econometrics. 4) Statistical inference
 Statistical inference") 30C00200 Econometrics 4) Statistical inference Timo Kuosmanen Professor, Ph.D. http://nomepre.net/index.php/timokuosmanen Today s topics Confidence intervals of parameter estimates Student s t-distribution
30C00200 Econometrics 4) Statistical inference Timo Kuosmanen Professor, Ph.D. http://nomepre.net/index.php/timokuosmanen Today s topics Confidence intervals of parameter estimates Student s t-distribution
Inference for Regression Simple Linear Regression
 Inference for Regression Simple Linear Regression IPS Chapter 10.1 2009 W.H. Freeman and Company Objectives (IPS Chapter 10.1) Simple linear regression p Statistical model for linear regression p Estimating
Introduction to statistical modeling
 Introduction to statistical modeling Illustrated with XLSTAT Jean Paul Maalouf webinar@xlstat.com linkedin.com/in/jean-paul-maalouf November 30, 2016 www.xlstat.com 1 PLAN XLSTAT: who are we? Statistics:
Heteroskedasticity and Autocorrelation
 Lesson 7 Heteroskedasticity and Autocorrelation Pilar González and Susan Orbe Dpt. Applied Economics III (Econometrics and Statistics) Pilar González and Susan Orbe OCW 2014 Lesson 7. Heteroskedasticity
LINEAR REGRESSION ANALYSIS. MODULE XVI Lecture Exercises
 LINEAR REGRESSION ANALYSIS MODULE XVI Lecture - 44 Exercises Dr. Shalabh Department of Mathematics and Statistics Indian Institute of Technology Kanpur Exercise 1 The following data has been obtained on
G. S. Maddala Kajal Lahiri. WILEY A John Wiley and Sons, Ltd., Publication
 G. S. Maddala Kajal Lahiri WILEY A John Wiley and Sons, Ltd., Publication TEMT Foreword Preface to the Fourth Edition xvii xix Part I Introduction and the Linear Regression Model 1 CHAPTER 1 What is Econometrics?
Multiple Regression Analysis. Basic Estimation Techniques. Multiple Regression Analysis. Multiple Regression Analysis
 Multiple Regression Analysis Basic Estimation Techniques Herbert Stocker herbert.stocker@uibk.ac.at University of Innsbruck & IIS, University of Ramkhamhaeng Regression Analysis: Statistical procedure
Mathematics for Economics MA course
 Mathematics for Economics MA course Simple Linear Regression Dr. Seetha Bandara Simple Regression Simple linear regression is a statistical method that allows us to summarize and study relationships between
ECON 497 Midterm Spring
 ECON 497 Midterm Spring 2009 1 ECON 497: Economic Research and Forecasting Name: Spring 2009 Bellas Midterm You have three hours and twenty minutes to complete this exam. Answer all questions and explain
STAT 350 Final (new Material) Review Problems Key Spring 2016
 Review Problems Key Spring 2016") 1. The editor of a statistics textbook would like to plan for the next edition. A key variable is the number of pages that will be in the final version. Text files are prepared by the authors using LaTeX,
1. The editor of a statistics textbook would like to plan for the next edition. A key variable is the number of pages that will be in the final version. Text files are prepared by the authors using LaTeX,
Trendlines Simple Linear Regression Multiple Linear Regression Systematic Model Building Practical Issues
 Trendlines Simple Linear Regression Multiple Linear Regression Systematic Model Building Practical Issues Overfitting Categorical Variables Interaction Terms Non-linear Terms Linear Logarithmic y = a +
Inference for Regression
 Inference for Regression Section 9.4 Cathy Poliak, Ph.D. cathy@math.uh.edu Office in Fleming 11c Department of Mathematics University of Houston Lecture 13b - 3339 Cathy Poliak, Ph.D. cathy@math.uh.edu
Answers: Problem Set 9. Dynamic Models
 Answers: Problem Set 9. Dynamic Models 1. Given annual data for the period 1970-1999, you undertake an OLS regression of log Y on a time trend, defined as taking the value 1 in 1970, 2 in 1972 etc. The
Ch 2: Simple Linear Regression
 Ch 2: Simple Linear Regression 1. Simple Linear Regression Model A simple regression model with a single regressor x is y = β 0 + β 1 x + ɛ, where we assume that the error ɛ is independent random component
The linear model. Our models so far are linear. Change in Y due to change in X? See plots for: o age vs. ahe o carats vs.
 8 Nonlinear effects Lots of effects in economics are nonlinear Examples Deal with these in two (sort of three) ways: o Polynomials o Logarithms o Interaction terms (sort of) 1 The linear model Our models
LECTURE 10. Introduction to Econometrics. Multicollinearity & Heteroskedasticity
 LECTURE 10 Introduction to Econometrics Multicollinearity & Heteroskedasticity November 22, 2016 1 / 23 ON PREVIOUS LECTURES We discussed the specification of a regression equation Specification consists
The general linear regression with k explanatory variables is just an extension of the simple regression as follows
 3. Multiple Regression Analysis The general linear regression with k explanatory variables is just an extension of the simple regression as follows (1) y i = β 0 + β 1 x i1 + + β k x ik + u i. Because
Making sense of Econometrics: Basics
 Making sense of Econometrics: Basics Lecture 4: Qualitative influences and Heteroskedasticity Egypt Scholars Economic Society November 1, 2014 Assignment & feedback enter classroom at http://b.socrative.com/login/student/
Finding Relationships Among Variables
 Finding Relationships Among Variables BUS 230: Business and Economic Research and Communication 1 Goals Specific goals: Re-familiarize ourselves with basic statistics ideas: sampling distributions, hypothesis
Econ 3790: Business and Economics Statistics. Instructor: Yogesh Uppal
 Econ 3790: Business and Economics Statistics Instructor: Yogesh Uppal yuppal@ysu.edu Sampling Distribution of b 1 Expected value of b 1 : Variance of b 1 : E(b 1 ) = 1 Var(b 1 ) = σ 2 /SS x Estimate of
LECTURE 10: MORE ON RANDOM PROCESSES
 LECTURE 10: MORE ON RANDOM PROCESSES AND SERIAL CORRELATION 2 Classification of random processes (cont d) stationary vs. non-stationary processes stationary = distribution does not change over time more
ACE 564 Spring Lecture 8. Violations of Basic Assumptions I: Multicollinearity and Non-Sample Information. by Professor Scott H.
 ACE 564 Spring 2006 Lecture 8 Violations of Basic Assumptions I: Multicollinearity and Non-Sample Information by Professor Scott H. Irwin Readings: Griffiths, Hill and Judge. "Collinear Economic Variables,
Types of economic data
 Types of economic data Time series data Cross-sectional data Panel data 1 1-2 1-3 1-4 1-5 The distinction between qualitative and quantitative data The previous data sets can be used to illustrate an important
Eco and Bus Forecasting Fall 2016 EXERCISE 2
 ECO 5375-701 Prof. Tom Fomby Eco and Bus Forecasting Fall 016 EXERCISE Purpose: To learn how to use the DTDS model to test for the presence or absence of seasonality in time series data and to estimate
School of Mathematical Sciences. Question 1
 School of Mathematical Sciences MTH5120 Statistical Modelling I Practical 8 and Assignment 7 Solutions Question 1 Figure 1: The residual plots do not contradict the model assumptions of normality, constant
Single and multiple linear regression analysis
 Single and multiple linear regression analysis Marike Cockeran 2017 Introduction Outline of the session Simple linear regression analysis SPSS example of simple linear regression analysis Additional topics
Lecture 8. Using the CLR Model. Relation between patent applications and R&D spending. Variables
 Lecture 8. Using the CLR Model Relation between patent applications and R&D spending Variables PATENTS = No. of patents (in 000) filed RDEP = Expenditure on research&development (in billions of 99 $) The
CHAPTER 4: Forecasting by Regression
 CHAPTER 4: Forecasting by Regression Prof. Alan Wan 1 / 57 Table of contents 1. Revision of Linear Regression 3.1 First-order Autocorrelation and the Durbin-Watson Test 3.2 Correction for Autocorrelation
Chapter 4: Regression Models
 Sales volume of company 1 Textbook: pp. 129-164 Chapter 4: Regression Models Money spent on advertising 2 Learning Objectives After completing this chapter, students will be able to: Identify variables,
ECON 497 Final Exam Page 1 of 12
 ECON 497 Final Exam Page of 2 ECON 497: Economic Research and Forecasting Name: Spring 2008 Bellas Final Exam Return this exam to me by 4:00 on Wednesday, April 23. It may be e-mailed to me. It may be
Ref.: Spring SOS3003 Applied data analysis for social science Lecture note
 SOS3003 Applied data analysis for social science Lecture note 05-2010 Erling Berge Department of sociology and political science NTNU Spring 2010 Erling Berge 2010 1 Literature Regression criticism I Hamilton
Christopher Dougherty London School of Economics and Political Science
 Introduction to Econometrics FIFTH EDITION Christopher Dougherty London School of Economics and Political Science OXFORD UNIVERSITY PRESS Contents INTRODU CTION 1 Why study econometrics? 1 Aim of this
SIMPLE REGRESSION ANALYSIS. Business Statistics
 SIMPLE REGRESSION ANALYSIS Business Statistics CONTENTS Ordinary least squares (recap for some) Statistical formulation of the regression model Assessing the regression model Testing the regression coefficients
Introduction to Eco n o m et rics
 2008 AGI-Information Management Consultants May be used for personal purporses only or by libraries associated to dandelon.com network. Introduction to Eco n o m et rics Third Edition G.S. Maddala Formerly
Assumptions of the error term, assumptions of the independent variables
 Petra Petrovics, Renáta Géczi-Papp Assumptions of the error term, assumptions of the independent variables 6 th seminar Multiple linear regression model Linear relationship between x 1, x 2,, x p and y
Chapter Learning Objectives. Regression Analysis. Correlation. Simple Linear Regression. Chapter 12. Simple Linear Regression
 Chapter 12 12-1 North Seattle Community College BUS21 Business Statistics Chapter 12 Learning Objectives In this chapter, you learn:! How to use regression analysis to predict the value of a dependent
Econometrics Summary Algebraic and Statistical Preliminaries
 Econometrics Summary Algebraic and Statistical Preliminaries Elasticity: The point elasticity of Y with respect to L is given by α = ( Y/ L)/(Y/L). The arc elasticity is given by ( Y/ L)/(Y/L), when L
Econ 300/QAC 201: Quantitative Methods in Economics/Applied Data Analysis. 17th Class 7/1/10
 Econ 300/QAC 201: Quantitative Methods in Economics/Applied Data Analysis 17th Class 7/1/10 The only function of economic forecasting is to make astrology look respectable. --John Kenneth Galbraith show
Week 11 Heteroskedasticity and Autocorrelation
 Week 11 Heteroskedasticity and Autocorrelation İnsan TUNALI Econ 511 Econometrics I Koç University 27 November 2018 Lecture outline 1. OLS and assumptions on V(ε) 2. Violations of V(ε) σ 2 I: 1. Heteroskedasticity
Econometric Forecasting Overview
 Econometric Forecasting Overview April 30, 2014 Econometric Forecasting Econometric models attempt to quantify the relationship between the parameter of interest (dependent variable) and a number of factors
ECO220Y Simple Regression: Testing the Slope
 ECO220Y Simple Regression: Testing the Slope Readings: Chapter 18 (Sections 18.3-18.5) Winter 2012 Lecture 19 (Winter 2012) Simple Regression Lecture 19 1 / 32 Simple Regression Model y i = β 0 + β 1 x
Multiple Regression Methods
 Chapter 1: Multiple Regression Methods Hildebrand, Ott and Gray Basic Statistical Ideas for Managers Second Edition 1 Learning Objectives for Ch. 1 The Multiple Linear Regression Model How to interpret
405 ECONOMETRICS Chapter # 11: MULTICOLLINEARITY: WHAT HAPPENS IF THE REGRESSORS ARE CORRELATED? Domodar N. Gujarati
 405 ECONOMETRICS Chapter # 11: MULTICOLLINEARITY: WHAT HAPPENS IF THE REGRESSORS ARE CORRELATED? Domodar N. Gujarati Prof. M. El-Sakka Dept of Economics Kuwait University In this chapter we take a critical
REED TUTORIALS (Pty) LTD ECS3706 EXAM PACK
 LTD ECS3706 EXAM PACK") REED TUTORIALS (Pty) LTD ECS3706 EXAM PACK 1 ECONOMETRICS STUDY PACK MAY/JUNE 2016 Question 1 (a) (i) Describing economic reality (ii) Testing hypothesis about economic theory (iii) Forecasting future
REED TUTORIALS (Pty) LTD ECS3706 EXAM PACK 1 ECONOMETRICS STUDY PACK MAY/JUNE 2016 Question 1 (a) (i) Describing economic reality (ii) Testing hypothesis about economic theory (iii) Forecasting future
Chapter 16. Simple Linear Regression and Correlation
 Chapter 16 Simple Linear Regression and Correlation 16.1 Regression Analysis Our problem objective is to analyze the relationship between interval variables; regression analysis is the first tool we will
Auto correlation 2. Note: In general we can have AR(p) errors which implies p lagged terms in the error structure, i.e.,
 errors which implies p lagged terms in the error structure, i.e.,") 1 Motivation Auto correlation 2 Autocorrelation occurs when what happens today has an impact on what happens tomorrow, and perhaps further into the future This is a phenomena mainly found in time-series
1 Motivation Auto correlation 2 Autocorrelation occurs when what happens today has an impact on what happens tomorrow, and perhaps further into the future This is a phenomena mainly found in time-series
Econ 510 B. Brown Spring 2014 Final Exam Answers
 Econ 510 B. Brown Spring 2014 Final Exam Answers Answer five of the following questions. You must answer question 7. The question are weighted equally. You have 2.5 hours. You may use a calculator. Brevity
Econ107 Applied Econometrics
 Econ107 Applied Econometrics Topics 2-4: discussed under the classical Assumptions 1-6 (or 1-7 when normality is needed for finite-sample inference) Question: what if some of the classical assumptions
Econometric Analysis of Some Economic Indicators Influencing Nigeria s Economy.
 Econometric Analysis of Some Economic Indicators Influencing Nigeria s Economy. Babalola B. Teniola, M.Sc. 1* and A.O. Olubiyi, M.Sc. 2 1 Department of Mathematical and Physical Sciences, Afe Babalola
Estadística II Chapter 5. Regression analysis (second part)
") Estadística II Chapter 5. Regression analysis (second part) Chapter 5. Regression analysis (second part) Contents Diagnostic: Residual analysis The ANOVA (ANalysis Of VAriance) decomposition Nonlinear
Estadística II Chapter 5. Regression analysis (second part) Chapter 5. Regression analysis (second part) Contents Diagnostic: Residual analysis The ANOVA (ANalysis Of VAriance) decomposition Nonlinear
New York University Department of Economics. Applied Statistics and Econometrics G Spring 2013
 New York University Department of Economics Applied Statistics and Econometrics G31.1102 Spring 2013 Text: Econometric Analysis, 7 h Edition, by William Greene (Prentice Hall) Optional: A Guide to Modern
Econometrics. Final Exam. 27thofJune,2008. Timeforcompletion: 2h30min
 Econometrics Final Exam 27thofJune,2008 João Valle e Azevedo António José Morgado Tiago Silva Vieira Timeforcompletion: 2h30min Give your answers in the space provided. Usedraftpapertoplanyouranswersbeforewritingthemontheexampaper.
Business Statistics. Lecture 10: Correlation and Linear Regression
 Business Statistics Lecture 10: Correlation and Linear Regression Scatterplot A scatterplot shows the relationship between two quantitative variables measured on the same individuals. It displays the Form
We like to capture and represent the relationship between a set of possible causes and their response, by using a statistical predictive model.
 Statistical Methods in Business Lecture 5. Linear Regression We like to capture and represent the relationship between a set of possible causes and their response, by using a statistical predictive model.
STAT 511. Lecture : Simple linear regression Devore: Section Prof. Michael Levine. December 3, Levine STAT 511
 STAT 511 Lecture : Simple linear regression Devore: Section 12.1-12.4 Prof. Michael Levine December 3, 2018 A simple linear regression investigates the relationship between the two variables that is not
Eco 391, J. Sandford, spring 2013 April 5, Midterm 3 4/5/2013
 Midterm 3 4/5/2013 Instructions: You may use a calculator, and one sheet of notes. You will never be penalized for showing work, but if what is asked for can be computed directly, points awarded will depend
Answer Key: Problem Set 6
 : Problem Set 6 1. Consider a linear model to explain monthly beer consumption: beer = + inc + price + educ + female + u 0 1 3 4 E ( u inc, price, educ, female ) = 0 ( u inc price educ female) σ inc var,,,
NATCOR Regression Modelling for Time Series
 Universität Hamburg Institut für Wirtschaftsinformatik Prof. Dr. D.B. Preßmar Professor Robert Fildes NATCOR Regression Modelling for Time Series The material presented has been developed with the substantial
A Second Course in Statistics: Regression Analysis
 FIFTH E D I T I 0 N A Second Course in Statistics: Regression Analysis WILLIAM MENDENHALL University of Florida TERRY SINCICH University of South Florida PRENTICE HALL Upper Saddle River, New Jersey 07458