Signal interactions Cross correlation, cross spectral coupling and significance testing Centre for Doctoral Training in Healthcare Innovation
|
|
|
- Sheryl Marian Hampton
- 5 years ago
- Views:
Transcription
1 Signal interactions Cross correlation, cross spectral coupling and significance testing Centre for Doctoral Training in Healthcare Innovation Dr. Gari D. Clifford, University Lecturer & Director, Centre for Doctoral Training in Healthcare Innovation, Institute of Biomedical Engineering, University of Oxford

2 Cross correlation Time domain Cross spectral coupling Fourier Wavelet Detecting significance in the time domain Parametric Non-parametric Detecting significance in the frequency domain Parametric Non-parametric
3 A time domain statistic A measure of similarity of two time series as a function of a time-lag applied to one of them Also known as cross-covariance, a sliding dot product or inner-product. Commonly used to search a long duration signal for a shorter, known feature. (* indicates complex conjugate)
4 Similar in nature to the convolution of two functions. Convolution involves reversing a signal, then shifting it and multiplying by another signal Correlation only involves shifting it and multiplying (no reversing) What s the correlation function between sine & cosine?
5 Cross correlation function Cos & Sin are the same, but π/2 out of phase So C has max/min (=±1) at ±π/2 (± 100 samples) Completely (anti-) correlated at this point Another max every 200 sample shift (with alternating sign) Function dies away at edges (less samples) Completely symmetric Theoretically equal to correlation coefficient r=max(c ) f=0.5;t=[1:1000]/200; x=sin(2*pi*f*t); y=cos(2*pi*f*t); [c lags] = xcorr(x,y,'coeff');
6 Cross correlation of sine with itself

7 FT(C) is the PSD! (Wiener Khinchin theorem, Wiener Khintchine theorem, Wiener Khinchin Einstein theorem or the Khinchin Kolmogorov theorem)
8 Take two random time series y(1)=randn(1,1);for(i=2:1000); y(i)=y(i-1)/2+randn(1,1);end x(1)=randn(1,1);for(i=2:1000); x(i)=x(i-1)/2+randn(1,1);end A correlation >0 doesn t mean there is really any significant correlation But - size of correlation doesn t imply anything regarding significance
9 Parametric: Bartlett s (1935) correction (Orcutt & James, Biometrika (1948) Vol. 35, No. 3-4, ) Nonparametric: Method of surrogates / bootstrap test (Politis, Statistical Science (2003) Vol. 18, No. 2, )
10 1. Measure correlation, Cr 2. Take one time series and shuffle order of samples (removes all temporal information) 3. Check correlation, Cn 4. Repeat step 1 N times (n=1:n) 5. Significance, p = length(cn<cr)/n (Proportion of times that we see a higher correlation from a random time series!)

11 What does the shuffling do? Preserves all statistics except autocorrelation Same mean, variance, skew, kurtosis Non-parametric technique Does not assume any distribution
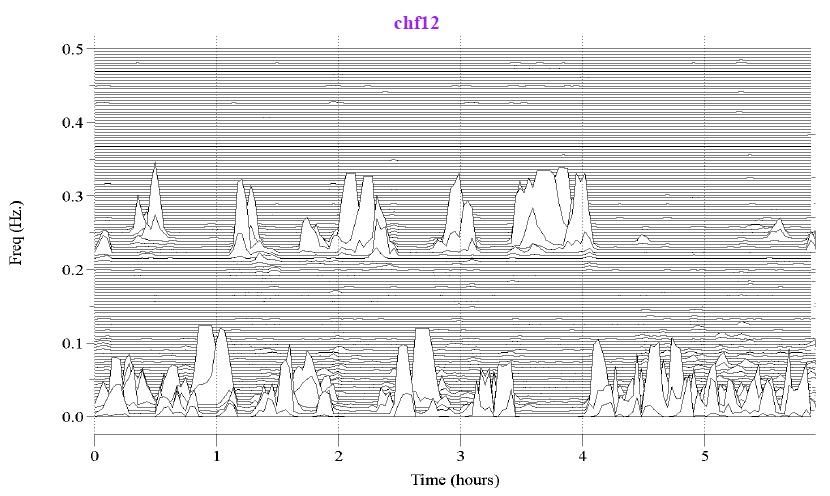
12 Recall respiration from the ECG (EDR), HR (RSA) PPG, and IP: Test significance between correlation
13
14 Coherence analysis, or cross-spectral analysis, may be used to identify variations which have similar spectral properties (high power in the same spectral frequency bands) Similar to FFT results with real and imaginary coefficients The cross-spectrum is defined from the covariance function Cxy: Complex function: the power is: and the phase information is: The coherence spectrum is analogous to the conventional correlation coefficient and is defined as:

15 Two signals One single freq One dual freq Share a common freq
16
17 Coherence only at common frequency Normalized See: mschohere.m

18 Example with EDR and RSA c.f. STFT

,.")
19 Non-stationary frequency coupling W is the wavelet transform of x at scale a, and translation (time shift),. Let s consider the Morlet wavelet
20 Cross wavelet transform of two time series x(t) and y(t) is given by: Cross wavelet power: (common power in both time series) Wavelet Coherency: where <> represents a smoothing operator achieved by a convolution in time and scale:
21 COI Black arrows indicate the phase at a given time & frequency (point right for in-phase, left for anti-phase, down for X leading Y by 90 and up for Y leading X by 90)
22

23

24

25
26 Are my peaks real? Parametric tests False alarm probability when compared to the amplitude you would expect from a background noise (such as white noise) Non-parametric tests Bootstrap or surrogate methods phase randomisation
27 If the PSD, P(ω), is normalized Scargle shows that the distribution of P(ω) is exponential So the probability that P(ω) will be between some positive z and z + dz is exp( z)dz Therefore, if we scan some M independent frequencies, the probability that none give values larger than z is (1 e -z ) M. So P(> z) 1 (1 e -z ) M is the false alarm probability of the null hypothesis (that the data values are independent Gaussian random values) i.e. the significance level of any peak in P(ω) that we do see. A small value for the false-alarm probability indicates a highly significant periodic signal.
28 A small value for the false-alarm probability indicates a highly significant periodic signal
29 Instead of shuffling time locations, shuffle phases in Fourier domain Test cross spectral coherence of surrogates is > real coherence. If larger over many bootstrap iterations, we have significance Similar to time series bootstrap method


30 COI Black arrows indicate the phase at a given time & frequency (point right for in-phase, left for anti-phase, down for X leading Y by 90 and up for Y leading X by 90)
31 The MatLab wavelet coherence package: wtc-r16.zip Grinsted, A., S. Jevrejeva, J. Moore, "Application of the cross wavelet transform and wavelet coherence to geophysical time series." submitted to a special issue of Nonlinear Proc. Geophys., 'Nonlinear analysis of multivariate geoscientific data - advanced methods, theory and application', 2004 [pdf] Torrence, C., and G.P. Compo, A practical guide to wavelet analysis, Bull. Am. Meteorol. Soc., 79, 61-78, 1998.
32 Spectral estimation of unevenly sampled data without resampling Variable integration step size Equivalent to least squares fitting of sines to data!
Introduction to time-frequency analysis Centre for Doctoral Training in Healthcare Innovation
 Introduction to time-frequency analysis Centre for Doctoral Training in Healthcare Innovation Dr. Gari D. Clifford, University Lecturer & Director, Centre for Doctoral Training in Healthcare Innovation,
Up/down-sampling & interpolation Centre for Doctoral Training in Healthcare Innovation
 Up/down-sampling & interpolation Centre for Doctoral Training in Healthcare Innovation Dr. Gari D. Clifford, University Lecturer & Director, Centre for Doctoral Training in Healthcare Innovation, Institute
Probability and Statistics for Final Year Engineering Students
 Probability and Statistics for Final Year Engineering Students By Yoni Nazarathy, Last Updated: May 24, 2011. Lecture 6p: Spectral Density, Passing Random Processes through LTI Systems, Filtering Terms
Stochastic Processes. M. Sami Fadali Professor of Electrical Engineering University of Nevada, Reno
 Stochastic Processes M. Sami Fadali Professor of Electrical Engineering University of Nevada, Reno 1 Outline Stochastic (random) processes. Autocorrelation. Crosscorrelation. Spectral density function.
Applied Probability and Stochastic Processes
 Applied Probability and Stochastic Processes In Engineering and Physical Sciences MICHEL K. OCHI University of Florida A Wiley-Interscience Publication JOHN WILEY & SONS New York - Chichester Brisbane
ELEG 3143 Probability & Stochastic Process Ch. 6 Stochastic Process
 Department of Electrical Engineering University of Arkansas ELEG 3143 Probability & Stochastic Process Ch. 6 Stochastic Process Dr. Jingxian Wu wuj@uark.edu OUTLINE 2 Definition of stochastic process (random
Correlation, discrete Fourier transforms and the power spectral density
 Correlation, discrete Fourier transforms and the power spectral density visuals to accompany lectures, notes and m-files by Tak Igusa tigusa@jhu.edu Department of Civil Engineering Johns Hopkins University
Wavelet entropy as a measure of solar cycle complexity
 Astron. Astrophys. 363, 3 35 () Wavelet entropy as a measure of solar cycle complexity S. Sello Mathematical and Physical Models, Enel Research, Via Andrea Pisano, 56 Pisa, Italy (sello@pte.enel.it) Received
Wavelet analysis of the parameters of edge plasma fluctuations in the L-2M stellarator
 Journal of Physics: Conference Series PAPER OPEN ACCESS Wavelet analysis of the parameters of edge plasma fluctuations in the L-2M stellarator To cite this article: S A Maslov et al 2016 J. Phys.: Conf.
L29: Fourier analysis
 L29: Fourier analysis Introduction The discrete Fourier Transform (DFT) The DFT matrix The Fast Fourier Transform (FFT) The Short-time Fourier Transform (STFT) Fourier Descriptors CSCE 666 Pattern Analysis
2. SPECTRAL ANALYSIS APPLIED TO STOCHASTIC PROCESSES
 2. SPECTRAL ANALYSIS APPLIED TO STOCHASTIC PROCESSES 2.0 THEOREM OF WIENER- KHINTCHINE An important technique in the study of deterministic signals consists in using harmonic functions to gain the spectral
13.42 READING 6: SPECTRUM OF A RANDOM PROCESS 1. STATIONARY AND ERGODIC RANDOM PROCESSES
 13.42 READING 6: SPECTRUM OF A RANDOM PROCESS SPRING 24 c A. H. TECHET & M.S. TRIANTAFYLLOU 1. STATIONARY AND ERGODIC RANDOM PROCESSES Given the random process y(ζ, t) we assume that the expected value
2A1H Time-Frequency Analysis II
 2AH Time-Frequency Analysis II Bugs/queries to david.murray@eng.ox.ac.uk HT 209 For any corrections see the course page DW Murray at www.robots.ox.ac.uk/ dwm/courses/2tf. (a) A signal g(t) with period
3. ESTIMATION OF SIGNALS USING A LEAST SQUARES TECHNIQUE
 3. ESTIMATION OF SIGNALS USING A LEAST SQUARES TECHNIQUE 3.0 INTRODUCTION The purpose of this chapter is to introduce estimators shortly. More elaborated courses on System Identification, which are given
Application of the cross wavelet transform and wavelet coherence to geophysical time series
 Application of the cross wavelet transform and wavelet coherence to geophysical time series A. Grinsted, J. C. Moore, S. Jevrejeva To cite this version: A. Grinsted, J. C. Moore, S. Jevrejeva. Application
Introduction to Signal Processing
 to Signal Processing Davide Bacciu Dipartimento di Informatica Università di Pisa bacciu@di.unipi.it Intelligent Systems for Pattern Recognition Signals = Time series Definitions Motivations A sequence
Spectral Analysis of Random Processes
 Spectral Analysis of Random Processes Spectral Analysis of Random Processes Generally, all properties of a random process should be defined by averaging over the ensemble of realizations. Generally, all
Problem Sheet 1 Examples of Random Processes
 RANDOM'PROCESSES'AND'TIME'SERIES'ANALYSIS.'PART'II:'RANDOM'PROCESSES' '''''''''''''''''''''''''''''''''''''''''''''''''''''''''''''''''Problem'Sheets' Problem Sheet 1 Examples of Random Processes 1. Give
ECE302 Spring 2006 Practice Final Exam Solution May 4, Name: Score: /100
 ECE302 Spring 2006 Practice Final Exam Solution May 4, 2006 1 Name: Score: /100 You must show ALL of your work for full credit. This exam is open-book. Calculators may NOT be used. 1. As a function of
2A1H Time-Frequency Analysis II Bugs/queries to HT 2011 For hints and answers visit dwm/courses/2tf
 Time-Frequency Analysis II (HT 20) 2AH 2AH Time-Frequency Analysis II Bugs/queries to david.murray@eng.ox.ac.uk HT 20 For hints and answers visit www.robots.ox.ac.uk/ dwm/courses/2tf David Murray. A periodic
Elec4621 Advanced Digital Signal Processing Chapter 11: Time-Frequency Analysis
 Elec461 Advanced Digital Signal Processing Chapter 11: Time-Frequency Analysis Dr. D. S. Taubman May 3, 011 In this last chapter of your notes, we are interested in the problem of nding the instantaneous
EEM 409. Random Signals. Problem Set-2: (Power Spectral Density, LTI Systems with Random Inputs) Problem 1: Problem 2:
 Problem 1: Problem 2:") EEM 409 Random Signals Problem Set-2: (Power Spectral Density, LTI Systems with Random Inputs) Problem 1: Consider a random process of the form = + Problem 2: X(t) = b cos(2π t + ), where b is a constant,
EEM 409 Random Signals Problem Set-2: (Power Spectral Density, LTI Systems with Random Inputs) Problem 1: Consider a random process of the form = + Problem 2: X(t) = b cos(2π t + ), where b is a constant,
L6: Short-time Fourier analysis and synthesis
 L6: Short-time Fourier analysis and synthesis Overview Analysis: Fourier-transform view Analysis: filtering view Synthesis: filter bank summation (FBS) method Synthesis: overlap-add (OLA) method STFT magnitude
Correlator I. Basics. Chapter Introduction. 8.2 Digitization Sampling. D. Anish Roshi
 Chapter 8 Correlator I. Basics D. Anish Roshi 8.1 Introduction A radio interferometer measures the mutual coherence function of the electric field due to a given source brightness distribution in the sky.
Stochastic Processes: I. consider bowl of worms model for oscilloscope experiment:
 Stochastic Processes: I consider bowl of worms model for oscilloscope experiment: SAPAscope 2.0 / 0 1 RESET SAPA2e 22, 23 II 1 stochastic process is: Stochastic Processes: II informally: bowl + drawing
Effects of data windows on the methods of surrogate data
 Effects of data windows on the methods of surrogate data Tomoya Suzuki, 1 Tohru Ikeguchi, and Masuo Suzuki 1 1 Graduate School of Science, Tokyo University of Science, 1-3 Kagurazaka, Shinjuku-ku, Tokyo
Assignment #09 - Solution Manual
 Assignment #09 - Solution Manual 1. Choose the correct statements about representation of a continuous signal using Haar wavelets. 1.5 points The signal is approximated using sin and cos functions. The
Statistics of Stochastic Processes
 Prof. Dr. J. Franke All of Statistics 4.1 Statistics of Stochastic Processes discrete time: sequence of r.v...., X 1, X 0, X 1, X 2,... X t R d in general. Here: d = 1. continuous time: random function
Advanced Digital Signal Processing -Introduction
 Advanced Digital Signal Processing -Introduction LECTURE-2 1 AP9211- ADVANCED DIGITAL SIGNAL PROCESSING UNIT I DISCRETE RANDOM SIGNAL PROCESSING Discrete Random Processes- Ensemble Averages, Stationary
Introduction to Biomedical Engineering
 Introduction to Biomedical Engineering Biosignal processing Kung-Bin Sung 6/11/2007 1 Outline Chapter 10: Biosignal processing Characteristics of biosignals Frequency domain representation and analysis
HST.582J/6.555J/16.456J
 Blind Source Separation: PCA & ICA HST.582J/6.555J/16.456J Gari D. Clifford gari [at] mit. edu http://www.mit.edu/~gari G. D. Clifford 2005-2009 What is BSS? Assume an observation (signal) is a linear
6.435, System Identification
 System Identification 6.435 SET 3 Nonparametric Identification Munther A. Dahleh 1 Nonparametric Methods for System ID Time domain methods Impulse response Step response Correlation analysis / time Frequency
Chapter 6. Random Processes
 Chapter 6 Random Processes Random Process A random process is a time-varying function that assigns the outcome of a random experiment to each time instant: X(t). For a fixed (sample path): a random process
Notes on Wavelets- Sandra Chapman (MPAGS: Time series analysis) # $ ( ) = G f. y t
 # $ ( ) = G f. y t") Wavelets Recall: we can choose! t ) as basis on which we expand, ie: ) = y t ) = G! t ) y t! may be orthogonal chosen or appropriate properties. This is equivalent to the transorm: ) = G y t )!,t )d 2
Wavelets Recall: we can choose! t ) as basis on which we expand, ie: ) = y t ) = G! t ) y t! may be orthogonal chosen or appropriate properties. This is equivalent to the transorm: ) = G y t )!,t )d 2
ECE 450 Homework #3. 1. Given the joint density function f XY (x,y) = 0.5 1<x<2, 2<y< <x<4, 2<y<3 0 else
 = 0.5 1<x<2, 2<y< <x<4, 2<y<3 0 else") ECE 450 Homework #3 0. Consider the random variables X and Y, whose values are a function of the number showing when a single die is tossed, as show below: Exp. Outcome 1 3 4 5 6 X 3 3 4 4 Y 0 1 3 4 5
ECE 450 Homework #3 0. Consider the random variables X and Y, whose values are a function of the number showing when a single die is tossed, as show below: Exp. Outcome 1 3 4 5 6 X 3 3 4 4 Y 0 1 3 4 5
Course content (will be adapted to the background knowledge of the class):
:") Biomedical Signal Processing and Signal Modeling Lucas C Parra, parra@ccny.cuny.edu Departamento the Fisica, UBA Synopsis This course introduces two fundamental concepts of signal processing: linear systems
Biomedical Signal Processing and Signal Modeling Lucas C Parra, parra@ccny.cuny.edu Departamento the Fisica, UBA Synopsis This course introduces two fundamental concepts of signal processing: linear systems
Adaptive Filtering. Squares. Alexander D. Poularikas. Fundamentals of. Least Mean. with MATLABR. University of Alabama, Huntsville, AL.
 Adaptive Filtering Fundamentals of Least Mean Squares with MATLABR Alexander D. Poularikas University of Alabama, Huntsville, AL CRC Press Taylor & Francis Croup Boca Raton London New York CRC Press is
HST.582J / 6.555J / J Biomedical Signal and Image Processing Spring 2007
 MIT OpenCourseWare http://ocw.mit.edu HST.582J / 6.555J / 16.456J Biomedical Signal and Image Processing Spring 2007 For information about citing these materials or our Terms of Use, visit: http://ocw.mit.edu/terms.
SEISMIC WAVE PROPAGATION. Lecture 2: Fourier Analysis
 SEISMIC WAVE PROPAGATION Lecture 2: Fourier Analysis Fourier Series & Fourier Transforms Fourier Series Review of trigonometric identities Analysing the square wave Fourier Transform Transforms of some
Stochastic Processes. A stochastic process is a function of two variables:
 Stochastic Processes Stochastic: from Greek stochastikos, proceeding by guesswork, literally, skillful in aiming. A stochastic process is simply a collection of random variables labelled by some parameter:
SRI VIDYA COLLEGE OF ENGINEERING AND TECHNOLOGY UNIT 3 RANDOM PROCESS TWO MARK QUESTIONS
 UNIT 3 RANDOM PROCESS TWO MARK QUESTIONS 1. Define random process? The sample space composed of functions of time is called a random process. 2. Define Stationary process? If a random process is divided
NONLINEAR TIME SERIES ANALYSIS, WITH APPLICATIONS TO MEDICINE
 NONLINEAR TIME SERIES ANALYSIS, WITH APPLICATIONS TO MEDICINE José María Amigó Centro de Investigación Operativa, Universidad Miguel Hernández, Elche (Spain) J.M. Amigó (CIO) Nonlinear time series analysis
Classic Time Series Analysis
 Classic Time Series Analysis Concepts and Definitions Let Y be a random number with PDF f Y t ~f,t Define t =E[Y t ] m(t) is known as the trend Define the autocovariance t, s =COV [Y t,y s ] =E[ Y t t
Lecture 15. Theory of random processes Part III: Poisson random processes. Harrison H. Barrett University of Arizona
 Lecture 15 Theory of random processes Part III: Poisson random processes Harrison H. Barrett University of Arizona 1 OUTLINE Poisson and independence Poisson and rarity; binomial selection Poisson point
Basics on 2-D 2 D Random Signal
 Basics on -D D Random Signal Spring 06 Instructor: K. J. Ray Liu ECE Department, Univ. of Maryland, College Park Overview Last Time: Fourier Analysis for -D signals Image enhancement via spatial filtering
ECE Homework Set 3
 ECE 450 1 Homework Set 3 0. Consider the random variables X and Y, whose values are a function of the number showing when a single die is tossed, as show below: Exp. Outcome 1 3 4 5 6 X 3 3 4 4 Y 0 1 3
: The coordinate origin dependence of the phase distribution. Fig B(t) OBS OBS PRS PCS
 OBS OBS PRS PCS") MHD, Abstract The earth s foreshoc is a region where particularly large amplitude MHD waves are commonly observed. They ehibit various waveforms, suggesting that nonlinear interaction between the waves
MHD, Abstract The earth s foreshoc is a region where particularly large amplitude MHD waves are commonly observed. They ehibit various waveforms, suggesting that nonlinear interaction between the waves
MATSUYAMA CITY RAINFALL DATA ANALYSIS USING
 Annual Journal of Hydraulic Engineering, JSCE, VOL. 45, 2001. February MATSUYAMA CITY RAINFALL DATA ANALYSIS USING WAVELET TRANSFORM Celso A. G. SANTOS 1, Carlos de O. GALVAO2, Koichi SUZUKI3 and Ricardo
Signal Modeling Techniques in Speech Recognition. Hassan A. Kingravi
 Signal Modeling Techniques in Speech Recognition Hassan A. Kingravi Outline Introduction Spectral Shaping Spectral Analysis Parameter Transforms Statistical Modeling Discussion Conclusions 1: Introduction
EA2.3 - Electronics 2 1
 In the previous lecture, I talked about the idea of complex frequency s, where s = σ + jω. Using such concept of complex frequency allows us to analyse signals and systems with better generality. In this
Fourier Transform in Image Processing. CS/BIOEN 6640 U of Utah Guido Gerig (slides modified from Marcel Prastawa 2012)
") Fourier Transform in Image Processing CS/BIOEN 6640 U of Utah Guido Gerig (slides modified from Marcel Prastawa 2012) Basis Decomposition Write a function as a weighted sum of basis functions f ( x) wibi(
Fourier Transform in Image Processing CS/BIOEN 6640 U of Utah Guido Gerig (slides modified from Marcel Prastawa 2012) Basis Decomposition Write a function as a weighted sum of basis functions f ( x) wibi(
Prof. Dr.-Ing. Armin Dekorsy Department of Communications Engineering. Stochastic Processes and Linear Algebra Recap Slides
 Prof. Dr.-Ing. Armin Dekorsy Department of Communications Engineering Stochastic Processes and Linear Algebra Recap Slides Stochastic processes and variables XX tt 0 = XX xx nn (tt) xx 2 (tt) XX tt XX
WAVEPAL. A Python software for the frequency and wavelet analyses of irregularly sampled time series. Guillaume Lenoir
 WAVEPAL A Python software for the frequency and wavelet analyses of irregularly sampled time series Guillaume Lenoir Talk at the VUB 24/05/2018 MY RESEARCH WORLD Statistics & signal processing { Paleoclimate
ECE-340, Spring 2015 Review Questions
 ECE-340, Spring 2015 Review Questions 1. Suppose that there are two categories of eggs: large eggs and small eggs, occurring with probabilities 0.7 and 0.3, respectively. For a large egg, the probabilities
MATSUYAMA CITY RAINFALL DATA ANALYSIS USING WAVELET TRANSFORM
 Annual Journal of Hydraulic Engineering, JSCE, VOL.45, 21, February MATSUYAMA CITY RAINFALL DATA ANALYSIS USING WAVELET TRANSFORM Celso A. G. SANTOS 1, Carlos de O. GALVÃO 2, Koichi SUZUKI 3 and Ricardo
TAKEHOME FINAL EXAM e iω e 2iω e iω e 2iω
 ECO 513 Spring 2015 TAKEHOME FINAL EXAM (1) Suppose the univariate stochastic process y is ARMA(2,2) of the following form: y t = 1.6974y t 1.9604y t 2 + ε t 1.6628ε t 1 +.9216ε t 2, (1) where ε is i.i.d.
EL1820 Modeling of Dynamical Systems
 EL1820 Modeling of Dynamical Systems Lecture 10 - System identification as a model building tool Experiment design Examination and prefiltering of data Model structure selection Model validation Lecture
System Modeling and Identification CHBE 702 Korea University Prof. Dae Ryook Yang
 System Modeling and Identification CHBE 702 Korea University Prof. Dae Ryook Yang 1-1 Course Description Emphases Delivering concepts and Practice Programming Identification Methods using Matlab Class
EE/CpE 345. Modeling and Simulation. Fall Class 9
 EE/CpE 345 Modeling and Simulation Class 9 208 Input Modeling Inputs(t) Actual System Outputs(t) Parameters? Simulated System Outputs(t) The input data is the driving force for the simulation - the behavior
Random signals II. ÚPGM FIT VUT Brno,
 Random signals II. Jan Černocký ÚPGM FIT VUT Brno, cernocky@fit.vutbr.cz 1 Temporal estimate of autocorrelation coefficients for ergodic discrete-time random process. ˆR[k] = 1 N N 1 n=0 x[n]x[n + k],
Signal Processing With Wavelets
 Signal Processing With Wavelets JAMES MONK Niels Bohr Institute, University of Copenhagen. Reminder of the Fourier Transform g(!) = 1 p 2 Z 1 1 f(t)e i!t dt Tells you the frequency components in a signal
Fourier Analysis and Power Spectral Density
 Chapter 4 Fourier Analysis and Power Spectral Density 4. Fourier Series and ransforms Recall Fourier series for periodic functions for x(t + ) = x(t), where x(t) = 2 a + a = 2 a n = 2 b n = 2 n= a n cos
( nonlinear constraints)
") Wavelet Design & Applications Basic requirements: Admissibility (single constraint) Orthogonality ( nonlinear constraints) Sparse Representation Smooth functions well approx. by Fourier High-frequency
Wavelet Design & Applications Basic requirements: Admissibility (single constraint) Orthogonality ( nonlinear constraints) Sparse Representation Smooth functions well approx. by Fourier High-frequency
ECG782: Multidimensional Digital Signal Processing
 Professor Brendan Morris, SEB 3216, brendan.morris@unlv.edu ECG782: Multidimensional Digital Signal Processing Filtering in the Frequency Domain http://www.ee.unlv.edu/~b1morris/ecg782/ 2 Outline Background
Jean Morlet and the Continuous Wavelet Transform
 Jean Brian Russell and Jiajun Han Hampson-Russell, A CGG GeoSoftware Company, Calgary, Alberta, brian.russell@cgg.com ABSTRACT Jean Morlet was a French geophysicist who used an intuitive approach, based
A6523 Signal Modeling, Statistical Inference and Data Mining in Astrophysics Spring 2013
 A6523 Signal Modeling, Statistical Inference and Data Mining in Astrophysics Spring 2013 Lecture 26 Localization/Matched Filtering (continued) Prewhitening Lectures next week: Reading Bases, principal
State Space Representation of Gaussian Processes
 State Space Representation of Gaussian Processes Simo Särkkä Department of Biomedical Engineering and Computational Science (BECS) Aalto University, Espoo, Finland June 12th, 2013 Simo Särkkä (Aalto University)
A6523 Modeling, Inference, and Mining Jim Cordes, Cornell University. False Positives in Fourier Spectra. For N = DFT length: Lecture 5 Reading
 A6523 Modeling, Inference, and Mining Jim Cordes, Cornell University Lecture 5 Reading Notes on web page Stochas
Characteristic Behaviors of Wavelet and Fourier Spectral Coherences ABSTRACT
 1 2 Characteristic Behaviors of Wavelet and Fourier Spectral Coherences Yueon-Ron Lee and Jin Wu ABSTRACT Here we examine, as well as make comparison of, the behaviors of coherences based upon both an
Lecture 30. DATA 8 Summer Regression Inference
 DATA 8 Summer 2018 Lecture 30 Regression Inference Slides created by John DeNero (denero@berkeley.edu) and Ani Adhikari (adhikari@berkeley.edu) Contributions by Fahad Kamran (fhdkmrn@berkeley.edu) and
Waves, the Wave Equation, and Phase Velocity. We ll start with optics. The one-dimensional wave equation. What is a wave? Optional optics texts: f(x)
") We ll start with optics Optional optics texts: Waves, the Wave Equation, and Phase Velocity What is a wave? f(x) f(x-) f(x-) f(x-3) Eugene Hecht, Optics, 4th ed. J.F. James, A Student's Guide to Fourier
We ll start with optics Optional optics texts: Waves, the Wave Equation, and Phase Velocity What is a wave? f(x) f(x-) f(x-) f(x-3) Eugene Hecht, Optics, 4th ed. J.F. James, A Student's Guide to Fourier
Lecture Wigner-Ville Distributions
 Introduction to Time-Frequency Analysis and Wavelet Transforms Prof. Arun K. Tangirala Department of Chemical Engineering Indian Institute of Technology, Madras Lecture - 6.1 Wigner-Ville Distributions
EEG- Signal Processing
 Fatemeh Hadaeghi EEG- Signal Processing Lecture Notes for BSP, Chapter 5 Master Program Data Engineering 1 5 Introduction The complex patterns of neural activity, both in presence and absence of external
A computationally efficient approach to generate large ensembles of coherent climate data for GCAM
 A computationally efficient approach to generate large ensembles of coherent climate data for GCAM GCAM Community Modeling Meeting Joint Global Change Research Institute, College Park MD November 7 th,
Statistical Analysis of fmrl Data
 Statistical Analysis of fmrl Data F. Gregory Ashby The MIT Press Cambridge, Massachusetts London, England Preface xi Acronyms xv 1 Introduction 1 What Is fmri? 2 The Scanning Session 4 Experimental Design
Frequency Based Fatigue
 Frequency Based Fatigue Professor Darrell F. Socie Department of Mechanical Science and Engineering University of Illinois at Urbana-Champaign 001-01 Darrell Socie, All Rights Reserved Deterministic versus
Time Series. Anthony Davison. c
 Series Anthony Davison c 2008 http://stat.epfl.ch Periodogram 76 Motivation............................................................ 77 Lutenizing hormone data..................................................
MATLAB Signal Processing Toolbox. Greg Reese, Ph.D Research Computing Support Group Academic Technology Services Miami University
 MATLAB Signal Processing Toolbox Greg Reese, Ph.D Research Computing Support Group Academic Technology Services Miami University October 2013 MATLAB Signal Processing Toolbox 2013 Greg Reese. All rights
Fundamentals of Noise
 Fundamentals of Noise V.Vasudevan, Department of Electrical Engineering, Indian Institute of Technology Madras Noise in resistors Random voltage fluctuations across a resistor Mean square value in a frequency
Gaussian Processes in Machine Learning
 Gaussian Processes in Machine Learning November 17, 2011 CharmGil Hong Agenda Motivation GP : How does it make sense? Prior : Defining a GP More about Mean and Covariance Functions Posterior : Conditioning
Theoretical and Simulation-guided Exploration of the AR(1) Model
 Model") Theoretical and Simulation-guided Exploration of the AR() Model Overview: Section : Motivation Section : Expectation A: Theory B: Simulation Section : Variance A: Theory B: Simulation Section : ACF A:
Theoretical and Simulation-guided Exploration of the AR() Model Overview: Section : Motivation Section : Expectation A: Theory B: Simulation Section : Variance A: Theory B: Simulation Section : ACF A:
PART 1. Review of DSP. f (t)e iωt dt. F(ω) = f (t) = 1 2π. F(ω)e iωt dω. f (t) F (ω) The Fourier Transform. Fourier Transform.
e iωt dt. F(ω) = f (t) = 1 2π. F(ω)e iωt dω. f (t) F (ω) The Fourier Transform. Fourier Transform.") PART 1 Review of DSP Mauricio Sacchi University of Alberta, Edmonton, AB, Canada The Fourier Transform F() = f (t) = 1 2π f (t)e it dt F()e it d Fourier Transform Inverse Transform f (t) F () Part 1 Review
PART 1 Review of DSP Mauricio Sacchi University of Alberta, Edmonton, AB, Canada The Fourier Transform F() = f (t) = 1 2π f (t)e it dt F()e it d Fourier Transform Inverse Transform f (t) F () Part 1 Review
3. Lecture. Fourier Transformation Sampling
 3. Lecture Fourier Transformation Sampling Some slides taken from Digital Image Processing: An Algorithmic Introduction using Java, Wilhelm Burger and Mark James Burge Separability ² The 2D DFT can be
If we want to analyze experimental or simulated data we might encounter the following tasks:
 Chapter 1 Introduction If we want to analyze experimental or simulated data we might encounter the following tasks: Characterization of the source of the signal and diagnosis Studying dependencies Prediction
Lecture 8: Signal Detection and Noise Assumption
 ECE 830 Fall 0 Statistical Signal Processing instructor: R. Nowak Lecture 8: Signal Detection and Noise Assumption Signal Detection : X = W H : X = S + W where W N(0, σ I n n and S = [s, s,..., s n ] T
IV. Covariance Analysis
 IV. Covariance Analysis Autocovariance Remember that when a stochastic process has time values that are interdependent, then we can characterize that interdependency by computing the autocovariance function.
CS 6604: Data Mining Large Networks and Time-series. B. Aditya Prakash Lecture #12: Time Series Mining
 CS 6604: Data Mining Large Networks and Time-series B. Aditya Prakash Lecture #12: Time Series Mining Pa
Fourier Transform for Continuous Functions
 Fourier Transform for Continuous Functions Central goal: representing a signal by a set of orthogonal bases that are corresponding to frequencies or spectrum. Fourier series allows to find the spectrum
Package biwavelet. September 29, 2012
 Type Package Package biwavelet September 29, 2012 Title Conduct univariate and bivariate wavelet analyses Version 0.11 Date 2012-04-19 Author Tarik C. Gouhier, Aslak Grinsted Maintainer Tarik C. Gouhier
D.S.G. POLLOCK: BRIEF NOTES
 BIVARIATE SPECTRAL ANALYSIS Let x(t) and y(t) be two stationary stochastic processes with E{x(t)} = E{y(t)} =. These processes have the following spectral representations: (1) x(t) = y(t) = {cos(ωt)da
Review of Fourier Transform
 Review of Fourier Transform Fourier series works for periodic signals only. What s about aperiodic signals? This is very large & important class of signals Aperiodic signal can be considered as periodic
SNR Calculation and Spectral Estimation [S&T Appendix A]
![SNR Calculation and Spectral Estimation [S&T Appendix A]](/thumbs/75/71929358.jpg "SNR Calculation and Spectral Estimation [S&T Appendix A]") SR Calculation and Spectral Estimation [S&T Appendix A] or, How not to make a mess of an FFT Make sure the input is located in an FFT bin 1 Window the data! A Hann window works well. Compute the FFT 3
SR Calculation and Spectral Estimation [S&T Appendix A] or, How not to make a mess of an FFT Make sure the input is located in an FFT bin 1 Window the data! A Hann window works well. Compute the FFT 3
Periodogram of a sinusoid + spike Single high value is sum of cosine curves all in phase at time t 0 :
 Periodogram of a sinusoid + spike Single high value is sum of cosine curves all in phase at time t 0 : X(t) = µ + Asin(ω 0 t)+ Δ δ ( t t 0 ) ±σ N =100 Δ =100 χ ( ω ) Raises the amplitude uniformly at all
Information and Communications Security: Encryption and Information Hiding
 Short Course on Information and Communications Security: Encryption and Information Hiding Tuesday, 10 March Friday, 13 March, 2015 Lecture 5: Signal Analysis Contents The complex exponential The complex
Gaussian Processes for Audio Feature Extraction
 Gaussian Processes for Audio Feature Extraction Dr. Richard E. Turner (ret26@cam.ac.uk) Computational and Biological Learning Lab Department of Engineering University of Cambridge Machine hearing pipeline
The General Linear Model (GLM)
") The General Linear Model (GLM) Dr. Frederike Petzschner Translational Neuromodeling Unit (TNU) Institute for Biomedical Engineering, University of Zurich & ETH Zurich With many thanks for slides & images
The General Linear Model (GLM) Dr. Frederike Petzschner Translational Neuromodeling Unit (TNU) Institute for Biomedical Engineering, University of Zurich & ETH Zurich With many thanks for slides & images
Lecture 4 - Spectral Estimation
 Lecture 4 - Spectral Estimation The Discrete Fourier Transform The Discrete Fourier Transform (DFT) is the equivalent of the continuous Fourier Transform for signals known only at N instants separated
E 4101/5101 Lecture 6: Spectral analysis
 E 4101/5101 Lecture 6: Spectral analysis Ragnar Nymoen 3 March 2011 References to this lecture Hamilton Ch 6 Lecture note (on web page) For stationary variables/processes there is a close correspondence
EE/CpE 345. Modeling and Simulation. Fall Class 10 November 18, 2002
 EE/CpE 345 Modeling and Simulation Class 0 November 8, 2002 Input Modeling Inputs(t) Actual System Outputs(t) Parameters? Simulated System Outputs(t) The input data is the driving force for the simulation
EE482: Digital Signal Processing Applications
 Professor Brendan Morris, SEB 3216, brendan.morris@unlv.edu EE482: Digital Signal Processing Applications Spring 2014 TTh 14:305:45 CBC C222 Lecture 8 Frequency Analysis 14/02/18 http://www.ee.unlv.edu/~b1morris/ee482/