The University of Adelaide
|
|
|
- Valentine Anderson
- 5 years ago
- Views:
Transcription

1 The University of Adelaide Faculty of Engineering, Computer and Mathematical Sciences School of Civil, Environment and Mining Engineering A dissertation submitted to the School of Civil, Environment and Mining Engineering and Adelaide Graduate Centre of the University of Adelaide in partial fulfilment of the requirements for the degree of Doctor of Philosophy Rock Strength and Deformability Characterisation and Assessment for Drilling Performance Estimation By Henry Munoz MEng Geotechnical Engineering, BS Civil Engineering Adelaide, 2017
2 STATEMENT OF ORIGINALITY I certify that this work contains no material which has been accepted for the award of any other degree or diploma in my name, in any university or other tertiary institution and, to the best of my knowledge and belief, contains no material previously published or written by another person, except where due reference has been made in the text. In addition, I certify that no part of this work will, in the future, be used in a submission in my name, for any other degree or diploma in any university or other tertiary institution without the prior approval of the University of Adelaide and where applicable, any partner institution responsible for the joint-award of this degree. I give consent to this copy of my thesis when deposited in the University Library, being made available for loan and photocopying, subject to the provisions of the Copyright Act The author acknowledges that copyright of published works contained within this thesis resides with the copyright holder(s) of those works. I also give permission for the digital version of my thesis to be made available on the web, via the University s digital research repository, the Library Search and also through web search engines, unless permission has been granted by the University to restrict access for a period of time. H Munoz 1
3 SUMMARY Rock Strength and Deformability Characterisation and Assessment for Drilling Performance Estimation Rock drilling and cutting is essential in the mining industry. Rock characterisation and classification methods have been proposed to assess drilling or cutting performance. However, a unique method to relate rock characteristics to rock cutting performance has not yet been developed. This is due to the complexity of interactions among the variables involved in the drilling process encompassing not only rock properties, but also the nature of drilling. Costeffective drilling is achievable by allocating the available gross energy towards the drilling action and, at the same time, reducing systematically that energy consumed in frictional processes inherent to tool-rock interactions. Several attempts have been made to assess drilling performance by correlating different rock properties with the drilling rate. For instance, rock texture, grain size, Unconfined Compressive Strength (UCS), Mohs hardness and rock mass structural parameters, and others have been used to build a number of drillability indices. However, not only rock properties, but also different sets of drilling parameters and drilling techniques have an impact on the drilling performance and efficiency of the process. On one hand, to predict rock drilling performance and optimisation of drilling operation, tool-rock interaction laws, i.e. the relations between forces acting on the tool in contact with rock, are essential. For instance, through toolrock interaction laws, it was found that during rotary drilling, the energy consumed in pure cutting action of rock is measured by the intrinsic specific energy. In the case of percussive drilling, tool-rock interactions are focused 2
4 mostly in the prediction of the penetration rate and the optimum thrust. On the other hand, rock failure characterised by rock brittleness is a concept yet to be investigated as there is not a unique criterion able to describe rock brittleness quantitatively nor consensus about the most suitable and reliable brittleness index to apply to different rock engineering works encountered in the field. A new brittleness index upon fracture strain-energy quantities extracted from the area under complete stress-strain curve of rocks in uniaxial compressive tests is proposed herein to study drilling performance by rock brittleness capacity. This brittleness index takes into account post-peak instability in uniaxial compression as post-peak instability of rock during compression can be treated as a manifestation of rock brittleness. That is, an increase in the post-peak energy indicates an increase of stability (i.e. a decrease in brittleness or increase in ductility). In the same manner, a dramatic decrease of post-peak energy indicates less stability of the failure process (i.e. an increase in brittleness). In this view, advanced laboratory experiments on strength and deformability of soft-to-hard rock types (UCS is ranging from 7 to 215 MPa) were carried out. The compressive tests complied with the application of a prescribed constant lateral strain-rate as a feedback signal to control the axial load which was found to be a suitable loading rate to measure the complete stress-strain response for the rocks. The new brittleness index developed herein describes a monotonic and unambiguous scale of brittleness with increasing pre-peak strength parameters such as crack damage stress and peak stress as well as deformation parameters such as the tangent Young s modulus of rock. This outcome becomes relevant in order to better understand material brittleness associated with the progressive fracture process characterised by the typical threshold damage stresses, peak stress and the elasticity parameters. The brittleness index scale indicates that a higher brittleness index means that rock is more brittle which corresponds to higher strength rocks. 3
5 In order to reliably estimate drilling performance both tool-rock interaction laws along with a proper rock brittleness index are required to be implemented. In this study the performance of a single PDC (Polycrystalline Diamond Compact) cutter cutting and different drilling methods including PDC rotary drilling, roller-cone rotary drilling and percussive drilling were investigated. To investigate drilling performance by rock strength properties, laboratory PDC cutting tests were performed on soft-to-hard rocks to obtain cutting parameters. In addition, results of laboratory and field drilling on different rocks found elsewhere in literature were used. Laboratory and field cutting and drilling test results were coupled with values of a new rock brittleness index proposed herein and developed upon energy dissipation extracted from the complete stress-strain curve in uniaxial compression. To quantify cutting and drilling performance, the intrinsic specific energy in rotary-cutting action, i.e. the energy consumed in pure cutting action, and drilling penetration rate values in percussive action were used. The results show that the new energy-based brittleness index successfully describes the performance of the studied cutting and drilling methods. 4
6 TABLE OF CONTENTS STATEMENT OF ORIGINALITY... 1 SUMMARY... 2 TABLE OF CONTENTS... 5 LIST OF FIGURES... 9 LIST OF TABLES ACKNOWLEDGEMENTS THESIS DISSERTATION CONCLUSIONS REFERENCES PUBLICATION IN JOURNALS STATEMENT OF AUTHORSHIP PRE-PEAK AND POST-PEAK ROCK STRAIN CHARACTERISTICS DURING UNIAXIAL COMPRESSION BY 3D DIGITAL IMAGE CORRELATION ABSTRACT KEYWORDS INTRODUCTION EXPERIMENTAL STUDY Rock type and core preparation Speckle pattern preparation Rock instrumentation Loading set-up and testing method D digital image correlation method D digital image correlation set up and measurement TEST RESULTS AND DISCUSSION
7 Rock stress-strain characteristics Post-peak strain measurement method Field strain patterns CONCLUSIONS ACKNOWLEDGEMENT REFERENCES LIST OF SYMBOLS AND NOMENCLATURE LIST OF FIGURES LIST OF TABLES STATEMENT OF AUTHORSHIP FRACTURE ENERGY-BASED BRITTLENESS INDEX DEVELOPMENT AND BRITTLENESS QUANTIFICATION BY PRE-PEAK STRENGTH PARAMETERS IN ROCK UNIAXIAL COMPRESSION ABSTRACT KEYWORDS INTRODUCTION EXPERIMENTAL STUDY Rock material and preparation Rock instrumentation D Digital Image Correlation method Loading set-up and testing method COMPRESSIVE TEST RESULTS Lateral-strain controlled test Complete average stress-strain curves Pre-peak stress-strain quantities Post-peak local strain features FRACTURE ENERGY IN COMPRESSION ENERGY-BASED BRITTLENESS INDEX CONCLUSIONS ACKNOWLEDGEMENT REFERENCES LIST OF FIGURES LIST OF TABLES STATEMENT OF AUTHORSHIP
8 ROCK CUTTING CHARACTERISTICS ON SOFT-TO-HARD ROCKS UNDER DIFFERENT CUTTER INCLINATIONS KEYWORDS INTRODUCTION ROCK CUTTING MECHANISM EXPERIMENTAL STUDY Rocks investigated Uniaxial Compressive tests Cutting tests with a single PDC TEST RESULTS AND DISCUSSION Rock strength characteristics Intrinsic specific energy from PDC cutting CONCLUSIONS ACKNOWLEDGEMENT REFERENCES LIST OF FIGURES LIST OF TABLES STATEMENT OF AUTHORSHIP ROCK DRILLING PERFORMANCE EVALUATION BY AN ENERGY DISSIPATION BASED ROCK BRITTLENESS INDEX ABSTRACT KEYWORDS INTRODUCTION NEW ENERGY-BASED BRITTLENESS INDEX PDC CUTTING PERFORMANCE Cutting experiments conducted in the present study Intrinsic specific energy from PDC cutting Intrinsic specific energy and brittleness index ROTARY DRILLING PERFORMANCE Drilling experiments from literature Intrinsic specific energy from rotary drilling Intrinsic specific energy and brittleness index PERCUSSIVE DRILLING PERFORMANCE Drilling experiments from literature Penetration rate and brittleness index
9 CONCLUSIONS ACKNOWLEDGEMENT REFERENCES LIST OF FIGURES LIST OF TABLES
10 LIST OF FIGURES Pre-Peak and Post-Peak Rock Strain Characteristics during Uniaxial Compression by 3D Digital Image Correlation Figure 1.1 Classification of class I and class II behaviour of rock failure in uniaxial compression (Hudson et al. 1971) Figure 1.2 Identification of the compression zone damage model and deformation of a specimen loaded in uniaxial compression (Vasconcelos et al. 2009) Figure 1.3 Experimental set up: servo-controlled closed-loop testing system and two-camera stereo system for 3D DIC in uniaxial compression loading Figure 1.4 Strain gauge instrumentation arrangement and typical failure pattern of Hawkesbury sandstone. A, B, C, D and E refer to the location of strain gauges Figure 1.5 Typical time history of a) loading and strains and b) loading rate and strain rate in uniaxial compression tests with lateral-strain rate feedback signal Figure 1.6 Recovering the third dimension by using two cameras (Sutton et al. 2009) Figure 1.7 a) Calibration procedure for the stereo cameras left and right pair imaging and b) location of the virtual extensometers within the area of interest and rock at the end of the compression test Figure 1.8 a) Stress-axial strain curves from platen displacement, external LVDT and DIC measurements (DIC-E0) and b) Stress-lateral strain curves from lateral extensometer and DIC measurements (DIC-E5 and E6)
11 Figure 1.9 Typical stress-strain curves with axial strains obtained from external LVDT and strain gauges Figure 1.10 Typical stress-strain curves obtained from DIC for virtual extensometers DIC-E0, DIC-E1 and DIC-E Figure 1.11 Field of axial strains developed at different stress levels in a) pre-peak regime and b) and c) post-peak regime Figure 1.12 Field of shear strains developed at different stress levels in a) pre-peak regime and b) post-peak regime Fracture Energy-Based Brittleness Index Development and Brittleness Quantification by Pre-Peak Strength Parameters in Rock Uniaxial Compression Figure 2.1 a) Rock instrumentation (Massangis limestone) and rocks at the end of the test (Tuffeau limestone, Hawkesbury sandstone and Alvand granite) and b) servo-controlled closed-loop testing system and 3D DIC set up Figure 2.2 Normalised stress-strain relations of Hawkesbury sandstone under axial-load, axial-strain and lateral-strain control (the origin of the curves were shifted horizontally to not overcrowd the figure) Figure 2.3 Typical time history of a) loading and strains and b) loading and strain rates in uniaxial compression tests (Hawkesbury sandstone) with lateral-strain control feedback Figure 2.4 Typical stress-strain curves with axial strains obtained from external LVDT and strain gauges in Hawkesbury sandstone Figure 2.5 Typical complete stress-strain curves for different rocks under lateral strain-rate control Figure 2.6 Pre-peak stress-strain quantities: a) tangent Young s modulus and b) crack damage stress relations with peak stress for different rock types. Numbers 1 to 8 refer to the rock type in Table Figure 2.7 a) Stress- strain curve and b) Field of axial strains in pre-peak regime (0.29, 0.52, 0.67 and ) and c) post-peak 10
12 regime (0.70, 0.60, 0.45 and 0.15) of Hawkesbury sandstone Figure 2.8 a) Stress- strain curve and b) Field of axial strains developed in pre-peak regime (0.81and ) and post-peak regime (0.70 and 0.45) of Tuffeau limestone Figure 2.9 a) Hawkesbury sandstone specimen and location of local virtual extensometers, b) Local stress-strain curves and c) Locally consumed energy by extensometers E(A), E(B) and E(C) and average consumed energy by E Figure 2.10 a) and b) Strain energy of rock in compression and c) Strain energy quantities versus peak stress for different rocks. Numbers 1 to 8 refer to the rock type in Table Figure 2.11 Brittleness index 1 relations with a a) peak stress, b) crack damage stress and c) tangent Young s modulus for different rock types. Numbers 1 to 8 refer to the rock type in Table Figure 2.12 Brittleness index 2 relations with a) peak stress, b) crack damage stress and c) tangent Young s modulus for different rock types. Numbers 1 to 8 refer to the rock type in Table Figure 2.13 Brittleness index 3 relations with a) peak stress, b) crack damage stress and c) tangent Young s modulus for different rock types. Numbers 1 to 8 refer to the rock type in Table Figure 2.14 Brittleness index relations with a) peak stress, b) crack damage stress and c) tangent Young s modulus for different rock types. Numbers 1 to 8 refer to the rock type in Table Figure 2.15 Brittleness index relations with a) peak stress, b) crack damage stress and c) tangent Young s modulus for different rock types. Numbers 1 to 8 refer to the rock type in Table Figure 2.16 Brittleness index relations with a) peak stress, b) crack damage stress and c) tangent Young s modulus for different rock types. Numbers 1 to 8 refer to the rock type in Table
13 Rock Cutting Characteristics on Soft-To-Hard Rocks under Different Cutter Inclinations Figure 3.1 PDC cutting test at shallow depth of cut Figure 3.2 Cutting force,, versus cutting advancement along the rock surface for Mantina basalt at a prescribed depth of cut of 0.2 mm Figure 3.3 a) Cutting force,, versus depth of cut,, for the rocks investigated and respective intrinsic specific energy values Figure 3.4 Cutting force,, versus constant cross-section area for different back-rake angles for the rocks investigated Figure 3.5 Intrinsic specific energy for a back-rake angle of 15 degrees versus unconfined compressive strength Figure 3.6 Intrinsic specific energy relation with the back-rake angle for the rocks investigated Rock Drilling Performance Evaluation by an Energy Dissipation Based Rock Brittleness Index Figure 4.1 Relations between compressive-to-tensile brittleness indices a) 1, b) 2 and c) 3 with unconfined compressive strength. Data from literature (Howarth 1987; Paone et al. 1969; Schmidt 1972; Selim and Bruce 1970) Figure 4.2 a) and b) Strain energy of rock in compression, c) typical complete stress-strain curves for different rocks under lateral strain-rate control and d) strain energy quantities with compressive strength for different rock types Figure 4.3 Brittleness index relations with unconfined compressive strength for different rock types Figure 4.4 a) PDC cutting test at shallow depth of cut and b) geometry of cutting and forces acting on the PDC cutter Figure 4.5 a) Cutting force,, versus depth of cut,, b) SEL for the rock investigated and intrinsic specific energy
14 Figure 4.6 Intrinsic specific energy from PDC cutting tests and its relation with the brittleness index Figure 4.7 Intrinsic specific energy and its relation with the brittleness index a) 1, b) 2 and c) 3 from rotary drilling tests Figure 4.8 Intrinsic specific energy from rotary drilling tests and its relation with the brittleness index Figure 4.9 Penetration rate and its relation with the brittleness index a) 1, b) 2 and c) 3 from percussive drilling tests Figure 4.10 a) Penetration rate and b) penetration rate normalised from percussive drilling tests and their relation with the brittleness index
15 LIST OF TABLES Pre-Peak and Post-Peak Rock Strain Characteristics during Uniaxial Compression by 3D Digital Image Correlation Table 1.1 Hawkesbury sandstone properties and threshold stresses for fracture damage Fracture Energy-Based Brittleness Index Development and Brittleness Quantification by Pre-Peak Strength Parameters in Rock Uniaxial Compression Table 2.1 Rock types investigated and their physical properties Table 2.2 Pre-peak stress-strain quantities for the rocks investigated 136 Table 2.3 Pre-peak and post-peak stress-strain quantities for the rocks investigated Table 2.4 Brittleness indices for the rocks investigated Rock Cutting Characteristics on Soft-To-Hard Rocks under Different Cutter Inclinations Table 3.1 Experimental program Table 3.2 List of rock types investigated and their physical and mechanical properties Table 3.3 List of rock types investigated and their Intrinsic Specific Energy
16 Rock Drilling Performance Evaluation by an Energy Dissipation Based Rock Brittleness Index Table 4.1 Rocks investigated to develop a energy-based brittleness index BU I Table 4.2 Rocks tested for PDC cutting performance Table 4.3 Rocks for PDC drilling performance and brittleness index 203 Table 4.4 Rocks for roller-cone drilling performance and brittleness index Table 4.5 Rocks for percussive drilling performance and brittleness index
17 ACKNOWLEDGEMENTS First and foremost, I would like to express my profound gratitude and thankfulness to my advisor A Prof Emmanuel Chanda for his support and superb guidance during my research tenure as a PhD student. Emmanuel took care of me before my arriving in Australia and throughout my stay in Australia. I cannot fully express my gratitude to Dr Abbas Taheri, for his generosity, friendship and assistance to manage many aspects on my academic live. Abbas is a good long-time friend back in our research time at The Tokyo University of Science in Japan where we met for the first time. Abbas painstakingly guided each step to successfully complete my PhD work and we spent several hours together working on the quality of the publications resulting from this PhD work. I would like to express my appreciation to Prof Richard Hillis, currently Professor at the Australian School of Petroleum at the University of Adelaide and CEO of the Deep Exploration Technologies CRC. Richard was my mentor during my PhD candidature. His very valuable advice aided to strengthen not only several aspects of my academic life but also my daily life and aspects related to my future career. Furthermore, I want to thanks Dr Caroline Forbes, from the Department of Earth Sciences School of Physical Sciences at the University of Adelaide and Chair of the Educational Committee of Deep Exploration Technologies CRC. Caroline supported my internship tenure at the Earth Science and Resource Engineering Department of The Commonwealth Scientific and Industrial Research Organisation (CSIRO) and at the Australian Centre for Geomechanics of the University of Western Australia. 16
18 Special thanks are addressed to Dr Luiz Franca from (formerly) the Australian Resource Research Centre (ARRC), CSIRO Perth, for facilitating the cutting experiments, the fruitful discussions. For their generous assistance, I would like to thanks to all the members of the Mining Laboratory who made the laboratory an ideal environment to work. Especial thanks are addressed to Ian Cates, Simon Golding and Adam Ryntjes who enthusiastically collaborated in many ways to complete the experimental tests I developed in this thesis work. Last but not the least, the financial support to complete this PhD work provided by Deep Exploration Technologies CRC whose activities are funded by the Australian Government's Cooperative Research Centre Programme is deeply acknowledged. 17
19 THESIS DISSERTATION Rock mass characterisation and classification to assess drilling performance have been undertaken previously by a number of researchers. However, a systematic classification method in this respect has not been achieved yet. This is due to the complexity of the variables involved in the drilling process which depends not only on a number of rock properties, but also on drilling parameters (i.e. the nature of drilling). Previous studies on rock drilling and rock characterisation were found to not take into account the toolrock interaction laws to find the more relevant rock properties involved in the drilling process. In this context, tool-rock interaction laws need to be introduced to successfully characterise the rock drilling and optimise the drilling performance. Furthermore, as not all rock physical and mechanical properties may be relevant to characterise drilling, a proper rock parameter able to represent the strength and deformability properties of the rock in drilling, by rock brittleness, needs to be defined. In this regard, implementing a new rock brittleness index able to picture either ductile or brittle failure behaviour of rocks can serve to evaluate the drilling performance of rotary and percussive drilling methods. Based on the comprehensive literature review presented in the introductory sections of four journal papers published as part of this thesis work, appended herein, it is evident that there is not a comprehensive study on rock strength and deformability and brittleness characterisation and their relation to drilling performance within the rock mechanics and drilling community. Therefore, the following are considered research gaps which are addressed in this thesis work. 18
20 1) There are few studies on complete stress-strain characteristics of rocks under uniaxial loading conditions along with mapping the strain field development of the specimen throughout the compressive test. The complete stress-strain characteristics of intact rock, i.e. the prepeak and post-peak stress-strain regimes are relevant in the understanding of the total process of rock deformation. Pioneering studies on the complete stress-strain behaviour of rocks undergoing quasi-static compression loads suggest that rock can be classified into two categories, i.e. class I where fracture propagation is stable, and class II where fracture propagation is unstable. Few studies can be found in the literature dealing with post-peak measurements in the case of rocks following class II behaviour. In the first place, this limitation is due to the lack of implementation of a proper load-control method to respond accordingly to rock class II behaviour. The complete stress-strain curve for both class I and II rocks can be successfully obtained, depending on the brittleness of the rock, by implementing a closed-loop servo-controlled loading system having the feedback signal to control the applied axial load a prescribed constant lateral-strain rate. This method has been by far the most widely used to investigate the post-peak behaviour of quasibrittle materials while another method based on a linear combination of stress and strain is also available. Rock behaviour under axial loading is generally studied in laboratory using load-controlled or displacement-controlled compressive loading systems. From here, load-controlled method can only measure pre-peak behaviour. To measure post-peak behaviour of rocks in unconfined and confined conditions, generally displacement-controlled method (i.e. axial-displacement or axial- 19
21 strain rate feedback to control axial load) is implemented in servocontrolled compressive machines. Nevertheless, displacementcontrolled method is insufficient to measure post-peak regime for class II rocks because axial strain no longer monotonically increases from the moment rock behave as class II. As a result, following this method, a critical response of the rock takes place leading to rock drastic failure. Consequently, post-peak stress-strain behaviour is masked by a rapid strength reduction at constant displacement immediately after peak stress. However, this post-peak critical response may be a manifestation of axial displacement-control compliance and not true material behaviour. In this view, circumferential or lateral-strain controlled method is required mainly because lateral displacement (or lateral-strain) monotonically increases after peak stress even if axial displacement decreases. Improper measurement of strains in the post-peak regime can lead to improper characterisation of the post-peak behaviour of rock useful to quantify post-peak fracture energy and rock brittleness on the ground of post-peak instability. Conventional strain measurement of rock specimen in uniaxial compression includes setting up external devices, e.g. Linear Variable Displacement Transducers (LVDT) and direct-contact extensometers or bonded strain gauges. In this respect, a major drawback using LVDT includes bedding error measurements. Although free from bedding errors, extensometers and strain gauge measurements are yet limited to a fixed gauge length and specific points of bonding, respectively. In addition, they may not capture entirely strains found in post-peak regime. In this case, extensometer misalignment and strain gauge damage are the major issues particularly when progressively growing cracks and localisation take place in the rock surface. Therefore, accurate noncontact strain measurements, via Three-Dimensional Digital Image 20
22 Correlation (3D DIC), becomes relevant to study strains in particular in post-peak regime. 3D DIC method is based on the calculation of surface deformation using a number of digital images from a reference undeformed and subsequent deformed states. This technique encompasses the use of two digital cameras positioned in the manner that the surface of the specimen is viewed from two different angles that allows full-field three-dimensional shape and displacement measurements. To study post-peak progressive failure behaviour of rock as well as strain pattern development on the rock surface, 3D DIC technique has not been implemented yet. Therefore, the application of 3D DIC technique in rock uniaxial compression is required. 2) There are few studies on the definition and development of a proper rock brittleness index from the complete stress-strain characteristics by fracture energy dissipation of rocks. Brittleness refers to deformation that involves hard, strong material that fractures and splits rather than staying whole while pliably deforming. Therefore, rock failure behaviour is defined by brittleness. However, rock brittleness is a concept yet to be developed as there is not a single and standard criterion (i.e. brittleness index) available to describe failure characteristics of different rocks. For instance, a number of different criteria to assess brittleness upon prepeak stress-strain characteristics in uniaxial compression including ratios between elastic to plastic strains as well as fracture strainenergy relations in pre-peak regime are found to be insufficient to describe failure behaviour of rock. In the same manner, other brittleness indices developed based on ratios between uniaxial compressive to tensile strength are insufficient. 21
23 Post-peak fracture development characteristics are very complex as post-peak progressive fracture in the rock takes place at different shear-tensile extent and at different rates. Therefore, the post-peak stress-strain curve cannot be characterised simply by a single postpeak stress-strain modulus (i.e. class I characterised by a negative stress-strain post-peak slope and class II showing positive stressstrain post-peak slope) but by a combination of class I-II behaviour at different extent. Therefore, a single stress-strain post-peak modulus value may not be an accurate representation of the whole post-peak response. In post-peak regime deformations, conventional local strain measurements by direct-contact extensometers and bonded strain gauges may not capture entirely the strains developed in post-peak regime. In this case, extensometer misalignment and strain gauge damage are the major issues. Particularly, these problems initiate when progressively growing cracks and localisation take place in a specimen. As a result, non-contact strain measurement via threedimensional digital image correlation (3D DIC) becomes relevant to measure strains development in the rock surface in post-peak regime to study the deformation process. In summary, there is not any study on rock brittleness assessment on the ground of post-peak instability taking into account fracture energy dissipation quantities from the complete stress-strain characteristics in uniaxial compression. In addition, an unambiguous brittleness scale against rock strength and deformation parameters such as crack damage stress, peak stress and elastic modulus, relevant to represent failure process development has not been developed yet. 3) There is not a comprehensive study on rock drilling performance assessment by a rock brittleness that takes into account fracture 22
24 energy dissipation quantities from the complete stress-strain characteristics. A generalised method to relate drilling performance with rock strength characteristics has not been developed yet. This is due to the complexity of interactions among the variables involved in the drilling process encompassing not only rock properties, but also the nature of drilling. Therefore, not only rock properties, but also different sets of drilling forces acting on rock as well as drilling method all have impacts on the drilling performance. In this view, by coupling relevant drilling parameters with relevant rock properties, a reliable drilling performance prediction method can be developed. On one hand, to predict rock drilling performance and optimisation of drilling operation, tool-rock interaction laws, i.e. the relations between forces acting on the tool in contact with rock, are essential. In this instance, the energy consumed in pure cutting action of rock is measured by the intrinsic specific energy that quantifies the maximum drilling efficiency. In the case of percussive drilling, toolrock interactions are focused mostly in the prediction of the penetration rate and the optimum thrust. Therefore, the intrinsic specific energy and penetration rate can be used to study rotary and percussive drilling, respectively. On the other hand, a rock brittleness index sufficient to quantify unambiguously a scale from ductile to brittle failure for a wide range of rocks (i.e. from soft to hard rocks) is needed to be implemented. Previous studies to assess rock brittleness have applied a number of different criteria primarily developed upon the pre-peak stress-strain characteristics from uniaxial compression experiments. In this regard, brittleness indices include ratios between elastic to plastic strain as well as strain-energy relations. In addition, other brittleness 23
25 indices defined upon relations between rock compressive strength, UCS, and tensile strength, TS, can be cited. Nonetheless, none of this brittleness indices can describe an unambiguous scale of brittleness from ductile to brittle failure. Therefore, in order to predict drilling performance successfully, firstly tool-rock interaction laws should be implemented to quantify drilling. In this respect, it was found that there are very few studies that consider tool-rock interaction to characterise drilling performance. Secondly, a proper brittleness index is required to describe rock failure characteristics in drilling. As a result, the present study aims at evaluating drilling performance by taking into account both the drilling response from tool-rock interaction laws and by applying a newly developed energy-based rock brittleness index able to picture rock failure behaviour and describe an unambiguous brittleness scale. On the research gaps presented above, the present PhD work addressed the following three research objectives: 1) To study the complete stress-strain characteristics of rocks under uniaxial loading conditions and strain field development. In this regard, the complete stress-strain behaviour of rock in uniaxial compression was studied through advanced laboratory testing and experimentation. This was successfully achieved by controlling the applied axial load to the rock specimens with a feedback signal based on monotonically-increased lateral-strain rate in a closed-loop system. The method proposed was efficient in capturing the postpeak characteristics of soft-to-hard rocks (i.e. sedimentary and igneous rocks with UCS ranging from 7 to 215 MPa). As shown later herein in the appended journal papers, the selected rocks sufficed to 24
26 successfully study brittleness and drilling performance for different rock types. The rocks samples used in the present study were intact, uniform and isotropic in strength. Therefore, repeatability and consistency of the testing results were guaranteed. The diameter of the specimens tested under uniaxial compression was 42 mm that ultimately limited the maximum grain size of the specimens tested (i.e. fine to medium grain size) to satisfy the recommendations by the International Society for Rock Mechanics (ISRM). The capacity of the available compressive equipment limited the extent of the experiment program. Non-contact strain measurement via three-dimensional digital image correlation (3D DIC) becomes relevant to measure strains development in post-peak regime. This technique was implemented to accurately measure rock deformation in pre-peak and post-peak regimes. Stresses in the rock samples were coupled with the field of strains, both axial and shear strains, obtained via 3D DIC that develops in the rock. Results of this synergy show that 3D DIC is a sound method to study the stress-strain characteristics of rocks under uniaxial compression tests. 2) To define and develop a proper rock brittleness index from the complete stress-strain characteristics by fracture energy dissipation of rocks under uniaxial compression conditions. The present study aims to characterise complete stress-strain behaviour of soft-to-hard rocks (UCS is ranging from 7 to 215 MPa) in uniaxial compression and to define and to develop a brittleness index. Rock brittleness is developed upon pre-peak and post-peak stress-strain energy balance to describe unambiguously a brittleness 25
27 scale against rock mechanical parameters, i.e. rock brittleness against pre-peak rock strength and deformation parameters in uniaxial compression including crack damage stress, peak stress and Young s modulus. In this sense, the complete stress-strain characteristics in uniaxial compression become a fundamental piece of information to describe the total process of rock deformation and to assess brittleness based on post-peak failure behaviour. Non-contact strain measurement via 3D DIC technique was implemented to accurately measure rock deformation in pre-peak and post-peak regimes. 3) To study rock drilling performance assessment by a rock brittleness that takes into account fracture energy dissipation quantities from the complete stress-strain characteristics in uniaxial compression. Therefore, in order to predict drilling performance successfully, firstly tool-rock interaction laws should be implemented to quantify drilling. Secondly, a proper brittleness index is required to describe rock failure characteristics in drilling. The present study aims at evaluating drilling performance by taking into account both the drilling response from tool-rock interaction laws and by defining a new energy-based rock brittleness index that considers rock failure behaviour which is able to describe an ambiguous brittleness scale from ductile to brittle. The performance of two major mechanical drilling methods, namely rotary drilling and percussive drilling, are investigated against rock brittleness capacity by the new energy-based brittleness index. The intrinsic specific energy and rate of penetration, as two main drilling performance parameters, were coupled with rock brittleness. To validate this proposal, cutting experiments with a single PDC (Polycrystalline Diamond Compact) and uniaxial compressive tests 26
28 were carried out on different rock types (i.e. fine-grained sedimentary, igneous and metamorphic rocks with UCS is ranging from 9 to 250 MPa) to quantify the intrinsic specific energy. The capacity of the available cutting equipment limited the extent of the experiment program. In addition, independent rotary drilling as well as percussive drilling results from laboratory and field tests (from the literature) were used. Impregnated diamond drilling (micro-cutting at depths of cut in the order of 10 µm to 40 µm), where quartz content in the rock may be relevant to the drilling process, is out of the purview of the present study so does brittleness index, quartz content and drilling process relation. Objectives 1 to 3 described above include the performance of both analytical and extensive advanced laboratory works including strength and deformation tests as well as rock cutting tests on soft-to-hard rocks (UCS is ranging from 7 to 250 MPa). The flow chart in Figure 1 depicts the methodology followed up in this research work to complete the objectives 1 to 3 mentioned above alongside with the outcomes reflected in the published papers. This PhD thesis was completed by publishing four journal papers to meet the proposed research objectives. The papers have been published in leading journals in the Rocks Mechanics community, i.e. journals ranked as A+ and A according to the Excellence of Research for Australia (ERA) assessment in The material derived from this research work is as follows (Figure 1): 27
29 Rock Characterisation and Assessment for Drilling Performance Experimental and Analytical works Tool-rock interaction laws implemented to quantify rotary and percussive drilling process Study the complete stress-strain characteristics of rocks under uniaxial loading conditions and strain field development Percussive drillings: Literature data Assessment of the penetration rate Rotary drillings: - Cutting Lab works - Literature data Assessment of the intrinsic specific energy Objective 1 (Paper 1) Define and develop a proper rock brittleness index from the complete stress-strain characteristics by fracture energy dissipation of rocks under uniaxial compression conditions Objective 2 (Paper 2) Study rock drilling performance assessment by a rock brittleness that takes into account fracture energy dissipation quantities from the complete stress-strain characteristics in uniaxial compression Objective 3 (Paper 3 and 4) Figure 1. Flow chart of the methodology, objectives and outcomes of the research 1) To meet the objective 1 of this research work, i.e. to study the complete stress-strain characteristics of rocks under uniaxial loading conditions and strain field development, the following was produced (Munoz et al. 2016b): Paper 1: Munoz H, Taheri A, Chanda E (2016) Pre-Peak and Post-Peak Rock Strain Characteristics During Uniaxial Compression by 3D Digital Image Correlation. Rock Mechanics and Rock Engineering:1-14 DOI: /s y ERA: A, Impact Factor: 2.38, Journal with highest Impact Factor in Rock Mechanics journals. 28
30 2) To meet the objective 2 of this research work, i.e. to define and develop a proper rock brittleness index from the complete stressstrain characteristics by fracture energy dissipation of rocks under uniaxial compression conditions, the following was produced (Munoz et al. 2016a): Paper 2: Munoz H, Taheri A, Chanda E (2016) Fracture energy-based brittleness index development and brittleness quantification by prepeak strength parameters in rock uniaxial compression. Rock Mechanics and Rock Engineering DOI: /s ERA: A, Impact Factor: Journal with highest Impact Factor in Rock Mechanics journals. 3) To meet the objective 3 of this research work, i.e. to study rock drilling performance assessment by a rock brittleness that takes into account fracture energy dissipation quantities from the complete stress-strain characteristics in uniaxial compression, the following were published (Munoz et al. 2016d; Munoz et al. 2016e): Paper 3: Munoz H, Taheri A, Chanda E (2016) Rock Cutting Characteristics on Soft-to-Hard Rocks under Different Cutter Inclinations. International Journal of Rock Mechanics and Mining Sciences: DOI: /j.ijrmms ERA: A*, Impact Factor: Journal of International Society of Rock Mechanics (ISRM). 29
31 Paper 4: Munoz H, Taheri A, Chanda EK (2016) Rock Drilling Performance Evaluation by an Energy Dissipation Based Rock Brittleness Index. Rock Mechanics and Rock Engineering:1-13 DOI: /s ERA: A, Impact Factor: Journal with highest Impact Factor in Rock Mechanics journals. These papers were developed in strict sequential order as mention above. That is, firstly, in Paper 1 (Munoz et al. 2016b), a new method is developed to study the complete stress-strain characteristics of rocks under uniaxial loading conditions and the strain field. Secondly, after validating the work in Paper 1, Paper 2 (Munoz et al. 2016a) was produced on the development of an energybased rock brittleness index from the complete stress-strain characteristics of rocks under uniaxial compression conditions. Subsequently, after validating the work in Paper 2, two papers referred to as Paper 3 (Munoz et al. 2016d) and Paper 4 (Munoz et al. 2016e) were produced on the evaluation of rock drilling performance by a the proposed fracture energy-based brittleness index. In addition, it is noteworthy to mention that the results of this research has been delivered in a world-wide high standard conferences (Munoz et al. 2015; Munoz et al. 2016c; Munoz et al. 2016f; Munoz et al. 2014) through the following conference papers titles: 1) Munoz H, Taheri A, Chanda E (2016) Rock Brittleness Capacity upon Compressive Fracture Energy Dissipation to Assess Drilling Efficiency. 50th US Rock Mechanics/Geomechanics Symposium. ARMA , 16p 2) Munoz H, Taheri A, Chanda E (2016) Strain Localisation Characteristics in Sandstone during Uniaxial Compression by 3D Digital Image Correlation. ISRM International Symposium EUROCK :
32 3) Munoz H, Taheri A, Chanda E (2015) Experiment Assessment of Rock-Cutting Characteristics by Strength-and-Fracture Driven Mechanisms. Africa Australia Technical Mining Conference AusIMM 1: ) Munoz H, Taheri A, Chanda E, Xu C, Grant D, Franca LFP (2014) Strain Rock Energy Approach to The Optimisation of Rock Drilling Processes. Seventh International Conference on Deep and High Stress Mining. Australian Centre for Geomechanics 1: CONCLUSIONS The following general conclusion can be drawn from the present research work. Firstly, a non-contact optical method for strain measurement applying three-dimensional digital image correlation (3D DIC) in uniaxial compression was presented. Observations showed that, by 3D DIC technique relatively large strains developed in the post-peak regime, in particular within localised zones, difficult to capture by bonded strain gauges, can be measured in a straightforward manner. Field strain development in the rock samples suggested that strain localisation takes place progressively and develops at a lower rate in pre-peak regime. It is accelerated, otherwise, in post-peak regime associated with the increasing rate of strength degradation. Secondly, new brittleness indices were developed based on fracture strain-energy quantities obtained from the complete stress-strain characteristics of rocks. In doing so, different rocks (UCS values ranging from 7 to 215 MPa) were examined in a series of quasi-static uniaxial compression tests after properly implementing lateral-strain control in a closed-loop system to apply axial load to rock specimen. This testing method was essential to capture postpeak regime of the rocks since a combination of class I-II or class II behaviour featured post-peak stress-strain behaviour. Further analysis on the post-peak strain localisation, stress-strain characteristics and the fracture pattern causing class I-II and class II behaviour were undertaken by analysing the development of field of strains in the rocks via three-dimensional digital image correlation 31
33 (3D DIC). Analyses of the experimental results demonstrated that brittleness indices proposed solely based on pre-peak stress-strain behaviour do not show strong correlation with any of the pre-peak rock mechanical parameters, otherwise they seemed to collapse in a single value irrespective of rock mechanical properties. On the other hand, the proposed brittleness indices based on pre-peak and post-peak stress-strain relations were found to competently describe an unambiguous brittleness scale against rock strength and deformation parameters such as crack damage stress, peak stress and elastic Young s modulus, relevant to represent failure process. Finally, in order to reliably estimate drilling performance both tool-rock interaction laws along with a proper rock brittleness were implemented. In this study the performance of a single PDC (Polycrystalline Diamond Compact) cutter cutting and different drilling methods including PDC rotary drilling, roller-cone rotary drilling and percussive drilling were investigated against rock brittleness capacity. To investigate drilling performance by rock strength properties, laboratory PDC (Polycrystalline Diamond Compact) cutting tests were performed on different rocks (UCS values ranging from 9 to 250 MPa) to obtain cutting parameters and quantify the intrinsic specific energy. In addition, results of laboratory and field drilling on different rocks found elsewhere in literature were used. Laboratory and field cutting and drilling test results were coupled with values of a new rock brittleness index proposed herein and developed based on energy dissipation withdrawn from the complete stressstrain curve in uniaxial compression. To quantify cutting and drilling performance, the intrinsic specific energy in rotary-cutting action, i.e. the energy consumed in pure cutting action, and drilling penetration rate values in percussive action were used. The results show that the new energy-based brittleness index successfully describes the performance of the studied cutting and drilling methods. 32
34 REFERENCES Munoz H, Taheri A, Chanda E (2015) Experiment assesment of rock-cutting characteristics by strengh-and-fracture driven mechanisms. Africa Australia Technical Mining Conference AusIMM 1: Munoz H, Taheri A, Chanda E (2016a) Fracture energy-based brittleness index development and brittleness quantification by pre-peak strength parameters in rock uniaxial compression. Rock Mechanics and Rock Engineering doi:doi: /s Munoz H, Taheri A, Chanda E (2016b) Pre-Peak and Post-Peak Rock Strain Characteristics During Uniaxial Compression by 3D Digital Image Correlation. Rock Mechanics and Rock Engineering:1-14 doi: /s y Munoz H, Taheri A, Chanda E (2016c) Rock brittleness capacity upon compressive fracture energy dissipation to assess drilling efficiency. 50th US Rock Mechanics/Geomechanics Symposium: ARMA , 2016p Munoz H, Taheri A, Chanda E (2016d) Rock Cutting Characteristics on Soft-to- Hard Rocks under Different Cutter Inclinations. International Journal of Rock Mechanics and Mining Sciences:85-89 doi: /j.ijrmms Munoz H, Taheri A, Chanda E (2016e) Rock Drilling Performance Evaluation by an Energy Dissipation Based Rock Brittleness Index. Rock Mechanics and Rock Engineering:1-13 doi: /s Munoz H, Taheri A, Chanda E (2016f) Strain localisation characteristics in sandstone during uniaxial compression by 3D digital image correlation. ISRM International Symposium EUROCK : Munoz H, Taheri A, Chanda E, Xu C, Grant D, Franca LFP (2014) Strain rock energy approach to the optimisation of rock drilling processes. Seventh International Conference on Deep and High Stress Mining Australian Centre for Geomechanics 1:
35 PUBLICATION IN JOURNALS 34
36 STATEMENT OF AUTHORSHIP 35
37 PRE-PEAK AND POST-PEAK ROCK STRAIN CHARACTERISTICS DURING UNIAXIAL COMPRESSION BY 3D DIGITAL IMAGE CORRELATION H. Munoz 1, A. Taheri 2, E. K. Chanda 3 1 Deep Exploration Technologies Cooperative Research Centre DET CRC, Export Park, Adelaide Airport, SA 5950, Australia, and School of Civil, Environmental & Mining Engineering, The University of Adelaide, SA 5005, Australia, Ph: , Fax: , henry.munozprincipe@adelaide.edu.au (corresponding author) 2 Senior Lecturer, School of Civil, Environmental & Mining Engineering, The University of Adelaide, SA 5005, Australia, Ph: , Fax: , abbas.taheri@adelaide.edu.au 3 Associate Professor, School of Civil & Environmental & Mining Engineering, The University of Adelaide, SA 5005, Australia, Ph: , Fax: , emmanuel.chanda@adelaide.edu.au ABSTRACT A non-contact optical method for strain measurement applying threedimensional digital image correlation (3D DIC) in uniaxial compression is presented. A series of monotonic uniaxial compression tests under quasi-static loading conditions on Hawkesbury sandstone specimens were conducted. A prescribed constant lateral-strain rate to control the applied axial load in a closedloop system allowed capturing the complete stress-strain behaviour of the rock, i.e. the pre-peak and post-peak stress-strain regimes. 3D DIC uses two-digital cameras to acquire images of the undeformed and deformed shape of an object 36
38 to perform image analysis and provides deformation and motion measurements. Observations showed that, 3D DIC provides strains free from bedding error in contrast to strains from LVDT. Erroneous measurements due to the compliance of the compressive machine are also eliminated. Furthermore, by 3D DIC technique relatively large strains developed in the post-peak regime, in particular within localised zones, difficult to capture by bonded strain gauges, can be measured in a straight forward manner. Field of strains and eventual strain localisation in the rock surface were analysed by 3D DIC method, coupled with the respective stress levels in the rock. Field strain development in the rock samples, both in axial and shear strain domains suggested that strain localisation takes place progressively and develops at a lower rate in pre-peak regime. It is accelerated, otherwise, in postpeak regime associated with the increasing rate of strength degradation. The results show that a major failure plane, due to strain localisation, becomes noticeable only long after the peak stress took place. In addition, post-peak stress-strain behaviour, was observed to be either in a form of localised strain in a shearing zone or inelastic unloading outside of the shearing zone. KEYWORDS Uniaxial compression test, post-peak behaviour, strain localisation, digital image correlation INTRODUCTION The mechanical properties of intact rock extracted from the stress-strain curve in uniaxial compression tests have major implications on civil engineering projects, mining engineering and mineral exploration related operations. In this sense, the complete stress-strain characteristics of intact rock, i.e. the pre-peak and post-peak stress-strain regimes are relevant in the understanding of the total process of rock deformation (Fairhurst and Hudson 1999; Hashiba et al. 2006; He et al. 1990; Hudson et al. 1971; Okubo and Nishimatsu 1985; Vasconcelos et al. 2009; Wawersik and Brace 1971; Wawersik and Fairhurst 1970). 37
39 Pioneering studies on the complete stress-strain behaviour of rocks undergoing quasi-static compression loads (Hudson et al. 1971; Rummel and Fairhurst 1970; Wawersik and Brace 1971; Wawersik and Fairhurst 1970) suggest that rock can be classified into two categories as shown in Figure 1.1 (Hudson et al. 1971), i.e. class I where fracture propagation is stable, and class II where fracture propagation is unstable. The complete stress-strain curve for both class I and II rocks can be successfully obtained, depending on the brittleness of the rock, by implementing a closed-loop servo-controlled loading system having the feedback signal to control the applied axial load a prescribed constant lateralstrain rate (Hudson et al. 1971). This method has been by far the most widely used to investigate the post-peak behaviour of quasi-brittle materials (Amann et al. 2011; Daniel C. Jansen and Edwin 1995; Fairhurst and Hudson 1999; Hudson et al. 1971; Vasconcelos et al. 2009); the other method is based on a linear combination of stress and strain (He et al. 1990; Okubo and Nishimatsu 1985; Okubo et al. 1990). The compressive loading process of quasi-brittle materials, such as rock and concrete, leads to localisation of macro cracks when peak stress is attained (Jansen and Shah 1997; Markeset and Hillerborg 1995). According to the compressive damage zone (CDZ) crack model (Markeset and Hillerborg 1995), failure of quasi-brittle materials, takes place within a damage zone, limited by the length of the damage zone as shown in Figure 1.2. In this framework, the stress-strain curve (in the region before peak stress) describes the compressive behaviour of the material in the whole specimen. Immediately after peak stress is reached and strain localisation takes place unloading happens in the material outside of the damage zone (see Figure 1.2). In this regime, the post-peak curve describes the deformation at the damage zone, which encompasses deformations associated with the formation and coalescence of distributed longitudinal cracks and deformations at localised zone. Improper measurement of strains in the post-peak regime can lead to improper characterisation of the post-peak behaviour of rock useful to quantify post-peak fracture energy (Bažant 1989; Jansen and Shah 1997; Markeset and 38
40 Hillerborg 1995) and rock brittleness on the ground of post-peak instability (Tarasov and Potvin 2013). Conventional strain measurement of rock specimen in uniaxial compression includes setting up external devices, e.g. Linear Variable Displacement Transducers (LVDT) and direct-contact extensometers or strain gauges. In this respect, a major drawback using LVDT includes bedding error measurements (Taheri and Tani 2008). Although free from bedding errors, extensometers and strain gauge measurements are yet limited to a fixed gauge length and specific points of bonding, respectively. In addition, they may not capture entirely strains found in post-peak regime. In this case, extensometer misalignment and strain gauge damage are the major issues particularly when progressively growing cracks and localisation take place in the rock surface. Therefore, accurate non-contact strain measurements, via three-dimensional digital image correlation (3D DIC), becomes relevant to study strains in particular in post-peak regime. Digital image correlation (DIC) refers to the class of non-contact methods that acquire images of an object, store images in digital form and perform image analysis to extract full-field shape, deformation and motion measurements (Sutton et al. 2009). Two-dimensional (2D) DIC technique was the foundation of early applications of DIC in the stress-strain characterisation of a wide variety of materials including polymers, metals, wood, composites, asphalt, ceramics, soils, concrete, rock, and so forth in specimens assumed to be nominally planar and deforming within the object plane (Sutton et al. 2009). Since 2D DIC requires predominantly in-plane displacements and strains, relatively small out-of-plane motions introduce errors in the measurement of inplane displacements. Furthermore, it is impractical to apply 2D DIC to rock cylinders in uniaxial compression. In essence, 3D DIC solves the limitations of 2D DIC. 3D DIC method is based on the calculation of surface deformation using a number of digital images from a reference undeformed and subsequent deformed states (Chu et al. 1985; Sutton et al. 2009). This technique encompasses the use of two digital cameras positioned in the manner that the surface of the specimen is viewed from two different angles that allows full-field 39
41 three-dimensional shape and displacement measurements. 3D DIC has been used to study deformation of different materials, e.g. (Heinz and Wiggins 2010). To study post-peak failure behaviour of rock material, 3D DIC technique, however, has not been implemented yet. This research focusses on the application of 3D DIC technique in rock uniaxial compression. In this research, the complete stress-strain behaviour of Hawkesbury sandstone in uniaxial compression was studied through laboratory testing and experimentation. Controlling the applied axial load to the rock specimens with a feedback signal based on monotonically-increased lateralstrain rate in a closed-loop system was efficient in capturing the post-peak characteristics of the rock. Stresses in the rock samples were coupled with the field of strains, both axial and shear strains, obtained via 3D DIC that develops in the rock. Results of this synergy show that 3D DIC is a sound method to study the stress-strain characteristics of rocks under uniaxial compression tests. EXPERIMENTAL STUDY ROCK TYPE AND CORE PREPARATION Hawkesbury sandstone was used in the experiments. This rock is an early Middle Triassic (Anisian) formation widely exposed in the Sydney Basin in Australia (Brian R. Rust and Jones 1987). The rock presents inherent bedding planes due to its natural sedimentary formation. Cylindrical specimens were retrieved from coring rock blocks in a way that the bedding plane orientation, defined as the angle between the bedding plane and the horizontal, was about 30º-40º in the cores tested here. The diameter of specimens was 42 mm and their aspect ratio (i.e. length to diameter ratio) was maintained at 2.4. A visual inspection shows that specimen diameter was more than 20 times bigger than the rock grains size satisfying the recommendations by the International Society for Rock Mechanics (ISRM) (Bieniawski and Bernede 1979; Fairhurst and Hudson 1999). The end faces and sides of the specimen were prepared smooth and straight according to 40
42 the ISRM standard (Fairhurst and Hudson 1999; ISRM 1981). The rock samples correspond to fine-grain size rock having a density of 2.20 g/cm 3. In total five rock samples were examined. In four of them, strains were measured by 3D DIC method. On the other hand, in one sample strains were measured by bonded strain gauges. Table 1.1 lists the mechanical properties of Hawkesbury sandstone, including the uniaxial compressive strength (UCS), Young s modulus (), Poisson s ratio () and the ratio of threshold stresses for fracture damage in the pre-peak regime. The UCS of the rock is 33.5 MPa, while, is about 10.1 GPa. SPECKLE PATTERN PREPARATION 3D DIC method relies on a contrasting random texture as speckle pattern in the surface of the specimen (Sutton et al. 2009). The pattern used in digital image correlation adheres to the surface of the object in study and it deforms as the surface does, therefore no loss of correlation occurs even under large translations and deformations the object may experience. Although some materials such as wood or concrete may display an inherent speckle pattern, a hand-made speckle pattern is usually needed for optimal measurement (Dautriat et al. 2011; Sutton et al. 2009). The latter was the case for Hawkesbury sandstone. So, a speckle pattern was thoroughly created by firstly spraying ordinary white paint on the rock surface in order to make a solid white basecoat and then spray-tarnishing black paint which created black speckles (Heinz and Wiggins 2010; Song et al. 2013; Yang et al. 2015). To achieve effective correlation, the speckle pattern was non-repetitive, isotropic and high in contrast, i.e. random pattern exhibiting no bias to an orientation and showing dark blacks and bright whites, adequate in size for high-strain resolution. By doing so, very sensitive defocus was avoided (Sutton et al. 2009). A typical speckle pattern on Hawkesbury sandstone is shown in Figure 1.3. ROCK INSTRUMENTATION The rock specimens having speckle pattern were instrumented by a direct-contact lateral extensometer placed along the perimeter and mounted at 41
43 mid-length of the rock specimens so that end-edge friction effects were eliminated (Hawkes and Mellor 1970). The lateral extensometer type used was F20-series manufactured by MTS Systems Co, as depicted in Figure 1.3, was used to record lateral strains,. Additionally, a rock specimen without speckle pattern was instrumented by six strain gauges orientated in the axial direction to measure the respective axial strain. Strain gauges, either types KFG C1 (30 mm gauge length) or KFG C1 (10 mm gauge length) manufactured by Tokyo Sokki Kenkyujo Co., were used. The strain gauges were bonded in different locations in each quarter on the lateral surface of the rock sample as shown in Figure 1.4 (letters A, B, C, D, E and F refer to the strain gauge location). This arrangement was made to capture strains in different rock location to later collate them with those obtained by the 3D DIC measurement. Similar to 3D DIC method, strains measured by strain gauges are free from bedding errors in contrast to LVDTs readings. LOADING SET-UP AND TESTING METHOD The rock specimens were subjected to a quasi-static monotonic axial loading by a closed-loop servo-controlled hydraulic compressive machine stiff enough to not allow the elastic energy to accumulate in the machine (i.e. Instron model manufactured by Instron Inc). The testing machine has a loading capacity of 250 kn. The closed-loop control system is fully digital and it is capable and flexible to operate loading control under either axial-load rate control, axial-strain rate control or lateral-strain rate control feedback signal using an in-built computer system. Applying uniform load to sample was ensured in all the tests. This is critical to avoid premature specimen failure due to machine platen or specimen surface misalignment. In this study, the applied axial load was controlled in a way keeping lateral strain-rate constant by the lateral extensometer. The electronics and computer program allows the hydraulic system to be adjusted continuously and automatically to ensure load to response accordingly with feedback signal and 42
44 damage extent to the specimen. A closed loop servo-controlled load system having the axial-strain rate feedback signal, provided sufficiently low rate and monotonic strain increase, can only capture post-peak behaviour if rock obviously follows class I behaviour (Rummel and Fairhurst 1970). This loading arrangement, however, cannot capture post-peak behaviour of most of strong and medium-strong rocks which generally follow class II mode or a combination of class I and class II behaviour (Hudson et al. 1971). Figure 1.5a shows the time history of loading (), axial strain ( ), and lateral strain ( ) in a typical test carried out herein. At a regime approaching to the peak stress, where load-lateral strain curve, i.e. -, becomes less steep, axial-strain rate ( /) decreases significantly so loading rate (/) does. During axial loading, the lateral strain is increased monotonically and linearly with time producing a constant lateral-strain rate throughout the test, i.e. /= 0.02x10⁻⁴ /s in Figure 1.5b. From this figure, it can be observed that the axial-strain rate fluctuates from /=0.17x10-4 decreasing fast to about 5x10⁻⁷ /s at the peak stress and then fluctuating to rates from about 1x10⁻⁸ /s - 2x10⁻⁶ /s satisfying static to quasi-static loading conditions in uniaxial compression tests for quasi-brittle materials (Hudson et al. 1971; P. H. Bischoff and Perry 1991; Wawersik and Brace 1971; Wawersik and Fairhurst 1970). In the same manner, the loading rate fluctuates from /=1.7x10-1 kn/s to about 1x x10-3 kn/s at peak stress and thereafter, experiencing rates up to 0.02 kn/s. Axial load (by a load cell), axial strain (by both strain gauges and external LVDTs) and lateral strain (by a ring extensometer) values were acquired continuously by a data acquisition system at a rate of 4 data points per second. Digital images taken automatically by the digital cameras were recorded simultaneously pairing the applied axial load with the respective instant image by an analog data recording. 43
45 3D DIGITAL IMAGE CORRELATION METHOD The principle of 3D computer rests on recovering the three-dimensional position by recording simultaneous image points using two cameras (C and C ), as shown schematically in Figure 1.6 (Sutton et al. 2009). For instance, two 3D points Q and R on the same projective ray (C, p) demonstrate that there exists an infinity of 3D points that correspond to the image point p. On the other hand, if two image points are (p, q ), then the unique 3D point correspond to Q. Similarly, image points (p, r ) correspond to a unique 3D point R. Then, the sensor positions for a common 3D point!, the scaled sensor location in the left camera, "#, and the corresponding scaled sensor location in right camera, "#, are related directly related through transformation matrices ([K], [T]) to transforms vectors in the world coordinate system, into the pinhole system located in the left and right camera by " = [K] [T] {!} "# = [K ] [T ] {!} (1) The matrices [K] and [T] (or [K ] and [T ]) take into account elementary transformations of the pinhole camera model and the associated coordinate systems based on pure perspective projection concepts of a coordinate point. The first transformation relates the world coordinate system of a scene point to coordinates in the camera system which requires rotation and translation operations associated to [T] (or [T ]). A second and subsequent transformations are the projection of this point onto the image coordinate system (retinal plane) to later transform this point into the sensor coordinate system (pixel units) both associated to [K] (or [K ]). 3D DIGITAL IMAGE CORRELATION SET UP AND MEASUREMENT 3D DIC method is based on the calculation of surface deformation of an object by using a number of digital images from a reference undeformed and subsequent deformed states. This technique encompasses setting up two digital 44
46 cameras pointing at the specimen from two different angles and capturing a series of grey-scale images of the surface pattern. In this manner, a threedimensional measurement of the specimen shape and displacements is created. As it is shown in Figure 1.3, during test the cameras, positioned on the left and right sides, were symmetrically focusing on rock specimen to capture digital grey-scale images. The cameras consisted of two high-resolution monochrome stereo cameras (i.e. Fujinon HF75SA-1, 1:1.8/75mm, 5 Megapixels resolution) deemed suitable for quasi-static load testing. Continuous and uniform illumination across the entire rock specimen was provided by a conveniently adjusted goose-neck halogen light to ensure adequate contrast with minimal rock heating. The images were captured by Vic-Snap software (produced by Correlated Solutions Inc.) using an exposure time of 37 ms. For quasi-static loading conditions, the primary function of the exposure time is to reduce the required object illumination for adequate image contrast (Sutton et al. 2009). Prior to the compression tests, each camera was stereo calibrated using a 30-mm standard target having uniformly spaced markers. Calibration of the cameras was done by taking at least 30 image pairs at the calibration target. To do so, as it is shown in Figure 1.7a, the calibration target was positioned and orientated differently, i.e. tilted and rotated, in and out of plane, close to the speckled rock specimen. Typical image pairs obtained by the left and right side cameras during calibration are shown in Figure 1.7a. The total images acquired during calibration were computed and analysed by VIC-3D software. VIC-3D software has been used effectively in a number of DIC material testing, e.g. (Sutton et al. 2009). Stereo calibration results produced a standard deviation of residuals of (in pixels), in general for all the tests. This value represents the difference between the position where a target point was found in the image and the theoretical position where the mathematical calibration model places the point. The value suggests that the calibration of the cameras is adequate for 45
47 measurements (Sutton et al. 2009). Therefore, the camera set up was ready for starting the compressive test. During the loading tests, the digital cameras were programmed to capture the images automatically at a frame rate of a picture each 0.5 seconds, from the start of loading for during the first 30 minutes, and thereafter a picture each 5 seconds until the end of the tests. This frame rate results suitable to capture and store a large number of images for further analysis. In this manner, digital data file size and subsequent computation time were minimised. Digital images were stored for post-test processing and analysis. Data acquisition systems of Vic-Snap and Instron 1342 were connected via an analog data recording and instantaneous axial deformation, lateral deformation, applied load and instantaneous pair images were synchronously acquired. A one-to-one correspondence between load, deformation and respective digital images during the compressive tests allowed assigning a specific image to a specific stress to study strain development with stresses. Deformation field study was concentrated within a portion of the specimen in each image (i.e. the area of interest) as shown in Figure 1.7b. VIC- 3D software (produced by Correlated Solutions Inc.) was used for the analysis. This software implements image processing algorithms for tracking surface coordinates and deformation from image to image. For deformation and strain analysis, a start image, when the axial load was not applied yet to the rock, was selected. The start image provides a reference for VIC-3D software to recreate the deformation field on subsequent images. Upon completion of image processing, the field of strains of the specimen surface was obtained. Strain measurement accuracy by computing confidence margins gets values in the order of 0.03x
48 TEST RESULTS AND DISCUSSION ROCK STRESS-STRAIN CHARACTERISTICS Figure 1.4 shows a shear failure plane oriented about 30º-40º formed after the end of the compressive loading. As it can be seen in Figure 1.4, shear failure plane is not affected by any bedding plane. The inherent bedding planes represent the texture of the sandstone rock rather than some weak planes which control shear failure. Previous studies on sandstone have shown the bedding plane upon UCS relation is complex and not unique, e.g. a W or U shape variation of UCS as the bedding orientation is increased from 0º to 90º (Al-Harthi 1998), a monotonic decrease in UCS with increasing the bedding orientation (Gatelier et al. 2002), etc. In this study, all the samples were cores in the same direction; therefore, effect of anisotropic properties, if any, was eliminated. Results of UCS tests on five specimens which are shown in Table 1.1 confirm this statement. Figure 1.8, Figure 1.9 and Figure 1.10 show the typical stress-strain curves for Hawkesbury sandstone. In these figures, stress-strain relations are given in terms of the axial stress and respective axial strain and lateral strain. In the pre-peak regime, the characteristics threshold stresses for fracture damage of rock associated with crack closure ( && ), crack initiation ( &' ), crack damage ( & ) and peak stress ( ()*+ ), were identified from the typical stressstrain curves. The following expressions were used (Martin and Chandler 1994):,-. = +2 (2) ),-. = (3) &,-. ) =,-.,-. (4) ) & Where,-. is the volumetric strain, and,-. and,-. are the elastic volumetric strain and the crack-induced volumetric strain, respectively. is the average axial strain obtained by strain gauges. is the lateral strain from the lateral extensometer. 47
49 The initial region of the stress-strain curve bound by && represents the stress level where closure of existing micro cracks in the rock takes place. Once the existing cracks are closed, the rock is assumed to behave elastic until the onset of dilation at &'. Cracking associated with axial stresses slightly above &' does not result in reduced rock strength (Martin and Chandler 1994). & represents the onset of unstable crack growth characterised by significant structural changes to the rock (Hallbauer et al. 1973), while ()*+ marks the onset of the post-peak behaviour. Figure 1.10 shows the location of the threshold stresses for fracture damage in a typical stress-strain curve of Hawkesbury sandstone. It was found that, on average && takes place at a stress of 0.29 ()*+, and &' and & occur at 0.52 ()*+ and 0.67 ()*+ respectively.young s modulus () and Poisson s ratio () for the rock were extracted from the linear-elastic portion of the stressstrain curves limited by && and &' with respective values / and /. In general, it was observed that the tangent modulus of the rock is at its highest value at relatively low axial strains and subsequently, the tangent modulus decreases progressively as the rock is reaching the peak stress. Table 1.1 summarises the threshold stresses of the tested rock samples. It was observed that after the peak stress ( ()*+ ) took place, progressive drop of stress was followed associated with the progressive strength degradation of the rock. The respective post-peak stress-strain curve of Hawkesbury sandstone was characterised by both class I (i.e. =/ <0) and class II rock (i.e. >0) if post-peak behaviour is classified similar to Wawersik and Fairhurst (Wawersik and Fairhurst 1970) (see Figure 1.1). That is, a negative post-peak slope immediately after the onset of peak stress and then a positive post-peak slope taking place at a stage where the compressive stress was about 0.7 ()* ()*+ up until the end of the test where residual stress was close to zero. Hawkesbury sandstone show no sign of perceptible major cracking detected in pre-peak regime. This evidence is well supported by the field of 48
50 strains in the rock surface obtained by 3D DIC as shown later. Localisation occurred in the post-peak regime in the form of a predominant single shearfailure plane. POST-PEAK STRAIN MEASUREMENT METHOD Figure 1.8a and Figure 1.8b compare the stress-strain curves generated from three different methods for axial and lateral strain measurements. That is, the axial strain by the vertical displacement of the machine platen, the average readings of a couple of LVDTs, and by a virtual extensometer E0 (extracted from 3D DIC analysis) located vertically along the rock sample, as shown in Figure 1.7b. In lateral strain, strains from the chain extensometer strain and virtual extensometer E5 and E6 located horizontally in the rock sample, as shown in Figure 1.7b, are compared. Figure 1.8a suggests that strains from 3D DIC technique are independent and free from bedding error, in contrast to LVDT strains, and free from any apparent additional strain due to machine displacements compliance. In fact, strains from 3D DIC measures only the actual strain deformations of the specimen under compression. Previous researches on material testing using DIC technique on rocks (Nguyen et al. 2011; Song et al. 2013; Zhang et al. 2012) and polymers (Heinz and Wiggins 2010) support this finding. Figure 1.8b shows a nearly single curve characterising the stress-lateral strain behaviour of the rock in pre-peak regime independent on the measurement device. Strains from 3D DIC virtual extensometers and strain gauges are in well agreement in magnitude as shown in Figure 1.9 and Figure The Young s modulus of Hawkesbury sandstone in Figure 1.9, with strains measured by strain gauges, yielded 10.4 GPa on average, as shown in Table 1.1. Similarly, the Young s modulus of the rock from 3D DIC analysis in the four tests yielded 10.0 GPa on average as presented in Table 1.1. The threshold stresses yielded nearly the same values after stress-strain curves with strain gauges and 3D DIC measurements were analysed, as shown in Table
51 In general, in the post-peak regime, progressive and generalised fractures in the rock surface may either break or detach bonded strain gauges from the rock surface making post-peak strains reading difficult or impossible as shown in the incomplete stress-strain curves in Figure 1.9. In this figure, labels A, B, D, and F refer to the strain gauge location in the rock sample as depicted in Figure 1.4 (C and E are not shown in Figure 1.9 to avoid overcrowding the figure). On the other hand, the post-peak strains, free from bedding error, were captured straightforward with 3D DIC as shown in Figure In this figure, labels DIC-E0, DIC-E1, and DIC-E2 refer to the virtual extensometers location in the rock sample as depicted in Figure 1.7b (DIC-E3, and DIC-E4 are not shown in Figure 1.10 to avoid overcrowding the figure). In Figure 1.9, curves B and F, which demonstrate results of those strain gauges that were not damaged in post-peak regime (see Figure 1.4), all experienced inelastic unloading. 3D DIC proved to be useful for studying the pre-peak and more importantly the post-peak strain behaviour of rock in uniaxial compression. Figure 1.10 shows different post-peak curves, characterised by either inelastic unloading or localised strain depending on the virtual extensometer length and location in the rock surface with respect to the localised zone. In this similar manner, Figure 1.8b shows different post-peak curves by labels DIC-E5 and DIC-E6, characterised by either inelastic unloading or localised strain, in stress-lateral strain space. In Figure 1.10, a portion of the rock outside the localised zone (taking place as a shear-failure plane) where strains were measured by DIC-E1, experiences inelastic unloading. In this case, the area under the stress-strain curve enclosed by the loading-unloading path is the pre-peak energy per unit volume of rock, which is dissipated due to micro cracking during the loading process up to the peak. On the other hand, both DIC-E0 and DIC-E2 encountered the localised zone at different extent, experiencing post-peak paths differently. So the energy from the post-peak stress-strain curve is associated with additional energy dissipated locally in the damage zone, e.g. (Bažant 1989; Jansen and Shah 1997; Markeset and Hillerborg 1995). 50
52 FIELD STRAIN PATTERNS Digital image correlation analysis provided quantitative evidence on the nature of field strains developed in the rock surface throughout the compressive test. In Figure 1.10, different loading stages along the stress-strain curve were identified to further examine field strain patterns both in axial and shear-strain domains. In pre-peak state, the threshold stress values for fracture damage of rock at 0.29 ()*+, 0.52 ()*+ and 0.67 ()*+, corresponding to cack closure, crack initiation and crack damage respectively, together with the peak stress ()*+ were selected. In post-peak state a number of specific stresses from 0.95 ()*+ to 0.15 ()*+ were selected. Figure 1.11a shows the field of axial strains within the area of interest analysed during pre-peak regime at the threshold stresses for fracture damage and peak stress. The field of axial strains suggests the specimen does deform at a uniform strain rate as axial strains start increasing uniformly with increasing axial load until peak stress was reached, as shown by colour gradient in Figure 1.11a. In correspondence with uniform development of the field of axial strains, the axial strains measured by the virtual extensometers DIC-E0, DIC-E1, DIC- E2, DIC-E3,DIC-E4, and DIC-E5, location depicted in Figure 1.7b, produces nearly a single stress-strain curve as shown in Figure 1.10 and Figure 1.8a. Finally, Figure 1.11a shows no sign of perceptible cracking in pre-peak regime. Figure 1.11b and Figure 1.11c show the field of axial strains in the rock surface during post-peak regime at selected stress levels. In the post-peak regime the axial-strain field does not increase uniformly, but progressively at different rates with large deformations localising around the future failure plane. The results suggest that deviation from strain uniformity begins progressively after peak stress was reached. This phenomenon has shown clearly by colour gradient in Figure 1.11b for stresses relatively immediately after ()*+ at 0.95 ()*+ to 0.75 ()*+. Thereafter, as shown by colour gradient in Figure 1.11c for stresses ranging from 0.70 ()*+ to 0.15 ()*+ strain localisation is accelerated which resulted in increasing the rate of strength degradation. As shown in Figure 1.10, 51
53 from the onset of post-peak, the virtual extensometers DIC-E0, DIC-E1, DIC- E2, DIC-E3, DIC-E4, and DIC-E5 experience either inelastic unloading or localised irreversible strain at different extent. Furthermore, comparison of Figure 1.8 and Figure 1.10 indicates that the local strains in the localisation zone may be much larger than the nominal average strain obtained from LVDT or lateral extensometer. Finally, it was observed that the failure plane became noticeable at the naked eye only long after the peak stress took place, on average at 0.45 ()* ()*+, as shown in Figure 1.11c. Figure 1.12a shows the field of shear strains within the area of interest analysed at the threshold stresses (i.e. qcc, qci, qcd) and the peak stress, qpeak, in the pre-peak regime. In the shear-strain field strains, with values of about 5x10⁻⁴, are marginal (see nearly a single colour gradient in Figure 1.12a). In conjunction with the field of axial strains discussed above, no localised shear strains into a failure plane was observed in the pre-peak regime. Figure 1.12b shows the field of shear strains in the rock surface during post-peak regime at selected stress levels. In the post-peak regime the shear strains are localised progressively along the future failure plane. First, the rate of shear strain development was slow, and then it accelerated with the increasing rate of strength degradation. The field of shear strains, within the area of interest, shows that shear strains are slightly localised along the future failure plane. Barely noticeable colour gradient even at a stress level of 0.7 ()*+ and 0.6 ()*+ was noticed. As it may be seen in Figure 1.12b, localised shear strains becomes clear only from stress levels about 0.45 ()* ()*+, where the failure plane becomes noticeable at the naked eye. Thereafter, a more significant shear strain gradient in the specimen was noticed. CONCLUSIONS In this study, three-dimensional digital image correlation (3D DIC) method was used to study the pre-peak and post-peak stress-strain characteristics of Hawkesbury sandstone in a series of uniaxial compression under quasi-static 52
54 loading conditions. 3D DIC is a non-contact method that provides deformation and motion measurements of an object undergoing external load. Post-peak stress-strain of the rock was successfully captured by controlling the applied axial load with prescribed constant lateral-strain rate from monotonically increased lateral strains. The following conclusions have been drawn from this study. Post-peak strain measurement with strain gauges bonded to the specimen surface is very difficult due to strain gauge damage caused by post-peak large crack propagations and strain localisation. In general, it was noticed that the strain gauges will either damage or exhibit unloading behaviour. It was found that using 3D DIC method, relatively large strains developed in the rock, in particular within localised zones, can be captured successfully. In addition, 3D DIC method shows major advantages in contrast with conventional external strain measurements. Firstly, by providing strains free from bedding errors unlike LVDT, and secondly by generating the field of strain development relevant for strain localisation insights. In post-peak regime, different stress-strain curves, characterised by either local inelastic unloading or localised strain, can be produced depending on the gauge length and gauge location with respect to the compression damage zone (CDZ) and the localised zone. 3D DIC method serves well for strain measurement inside and outside the CDZ. Field strain development, both in axial and shear strain domains, in the rock suggests that strain localisation takes place progressively and develops at a lower rate in the pre-peak regime. Strain localisation, however, is accelerated in the post-peak regime associated with accelerating rate of strength degradation. The results show that the major failure plane became noticeable only long after the peak stress was reached. 53
55 ACKNOWLEDGEMENT The work has been supported by the Deep Exploration Technologies Cooperative Research Centre whose activities are funded by the Australian Government's Cooperative Research Centre Programme. This is DET CRC Document 2015/781. REFERENCES Al-Harthi AA (1998) Effect of planar structures on the anisotropy of Ranyah sandstone, Saudi Arabia Engineering Geology 50:49-57 doi: Amann F, Button E, Evans K, Gischig V, Blümel M (2011) Experimental Study of the Brittle Behavior of Clay shale in Rapid Unconfined Compression Rock Mechanics and Rock Engineering 44: doi: /s Bažant Z (1989) Identification of strain softening constitutive relation from uniaxial tests by series coupling model for localisation Cement and Concrete Research 19: Bieniawski ZT, Bernede MJ (1979) Suggested methods for determining the uniaxial compressive strength and deformability of rock materials: Part 1. Suggested method for determination of the uniaxial compressive strength of rock materials International Journal of Rock Mechanics and Mining Sciences & Geomechanics Abstracts 16:137 doi: Brian R. Rust, Jones BG (1987) The Hawkesbury Sandstone South of Sydney, Australia: Triassic analogue for the deposit of a large, braided river Journal of Sedimentary Petrology 57: Chu TC, Ranson WF, Sutton MA (1985) Applications of digital-imagecorrelation techniques to experimental mechanics Experimental Mechanics 25: doi: /bf
56 Daniel C. Jansen SPS, Edwin CR (1995) Stress-Strain Results of Concrete from Circumferential Strain Feedback Control Testing Materials Journal 92 doi: /9774 Dautriat J, Bornert M, Gland N, Dimanov A, Raphanel J (2011) Localized deformation induced by heterogeneities in porous carbonate analysed by multi-scale digital image correlation Tectonophysics 503: doi: Fairhurst CE, Hudson JA (1999) Draf ISRM suggested method for the complete stress-strain curve for intact rock in uniaxial compression International Journal of Rock Mechanics and Mining Sciences 36: doi: Gatelier N, Pellet F, Loret B (2002) Mechanical damage of an anisotropic porous rock in cyclic triaxial tests International Journal of Rock Mechanics and Mining Sciences 39: doi: Hallbauer DK, Wagner H, Cook NGW (1973) Some observations concerning the microscopic and mechanical behaviour of quartzite specimens in stiff, triaxial compression tests International Journal of Rock Mechanics and Mining Sciences & Geomechanics Abstracts 10: doi: Hashiba K, Okubo S, Fukui K (2006) A new testing method for investigating the loading rate dependency of peak and residual rock strength International Journal of Rock Mechanics and Mining Sciences 43: doi: Hawkes I, Mellor M (1970) Uniaxial testing in rock mechanics laboratories Engineering Geology 4: doi: He C, Okubo S, Nishimatsu Y (1990) A study of the class II behaviour of rock Rock Mechanics and Rock Engineering 23: doi: /bf
57 Heinz SR, Wiggins JS (2010) Uniaxial compression analysis of glassy polymer networks using digital image correlation Polymer Testing 29: doi: Hudson JA, Brown ET, Fairhurst C (1971) Optimizing the control of rock failure in servo-controlled laboratory tests Rock mechanics 3: doi: /bf ISRM (1981) Rock characterization testing and monitoring ISRM suggested methods. Oxford Jansen DC, Shah S (1997) Effect of Length on Compressive Strain Softening of Concrete Journal of Engineering Mechanics 123:25-35 doi:doi: /(asce) (1997)123:1(25) Markeset G, Hillerborg A (1995) Softening of concrete in compression Localization and size effects Cement and Concrete Research 25: doi: Martin C, Chandler N The progressive fracture of Lac du Bonnet granite. In: International Journal of Rock Mechanics and Mining Sciences & Geomechanics Abstracts, vol 6. Elsevier, pp Nguyen TL, Hall SA, Vacher P, Viggiani G (2011) Fracture mechanisms in soft rock: Identification and quantification of evolving displacement discontinuities by extended digital image correlation Tectonophysics 503: doi: Okubo S, Nishimatsu Y (1985) Uniaxial compression testing using a linear combination of stress and strain as the control variable International Journal of Rock Mechanics and Mining Sciences & Geomechanics Abstracts 22: doi: Okubo S, Nishimatsu Y, He C (1990) Loading rate dependence of class II rock behaviour in uniaxial and triaxial compression tests an application of a proposed new control method International Journal of Rock Mechanics and Mining Sciences & Geomechanics Abstracts 27: doi: 56
58 P. H. Bischoff, Perry SH (1991) Compressive behaviour of concrete at high strain rates Materials and Structures 24: Rummel F, Fairhurst C (1970) Determination of the post-failure behavior of brittle rock using a servo-controlled testing machine Rock mechanics 2: doi: /bf Song H, Zhang H, Kang Y, Huang G, Fu D, Qu C (2013) Damage evolution study of sandstone by cyclic uniaxial test and digital image correlation Tectonophysics 608: doi: Sutton MA, Orteu JJ, Schreier H (2009) Image Correlation for Shape, Motion and Deformation Measurements. Springer US, Taheri A, Tani K (2008) Use of down-hole triaxial apparatus to estimate the mechanical properties of heterogeneous mudstone International Journal of Rock Mechanics and Mining Sciences 45: doi: Tarasov B, Potvin Y (2013) Universal criteria for rock brittleness estimation under triaxial compression International Journal of Rock Mechanics and Mining Sciences 59:57-69 doi: Vasconcelos G, Lourenço P, Alves C, Pamplona J (2009) Compressive Behavior of Granite: Experimental Approach Journal of Materials in Civil Engineering 21: doi:doi: /(asce) (2009)21:9(502) Wawersik WR, Brace WF (1971) Post-failure behavior of a granite and diabase Rock mechanics 3:61-85 doi: /bf Wawersik WR, Fairhurst CA (1970) A Study of Brittle Rock Fracture in Laboratory Compression Experiments Int J Rock Mech Min Sci 7: Yang G, Cai Z, Zhang X, Fu D (2015) An experimental investigation on the damage of granite under uniaxial tension by using a digital image correlation method Optics and Lasers in Engineering 73:46-52 doi: 57
59 Zhang H, Huang G, Song H, Kang Y (2012) Experimental investigation of deformation and failure mechanisms in rock under indentation by digital image correlation Engineering Fracture Mechanics 96: doi: 58
60 LIST OF SYMBOLS AND NOMENCLATURE Applied axial load Time Differential stress ()*+ Peak stress qcc Crack closure stress qci Crack initiation stress qcd Crack damage stress, Axial and lateral strains,-. Volumetric strain ),-. Elastic volumetric strain &,-. Crack-induced volumetric strain, respectively. d/dt d /dt d H /dt LVDT UCS Young s modulus Poisson s ratio Rate of loading Rate of axial strain Rate of lateral strain Linear Variable Displacement Transducers Unconfined Compressive Strength 3D DIC Three-dimensional digital image correlation 59
61 CDZ Compression Damage Zone LIST OF FIGURES Figure 1.1 Classification of class I and class II behaviour of rock failure in uniaxial compression (Hudson et al. 1971) 60
62 Figure 1.2 Identification of the compression zone damage model and deformation of a specimen loaded in uniaxial compression (Vasconcelos et al. 2009) 61


63 Figure 1.3 Experimental set up: servo-controlled closed-loop testing system and two-camera stereo system for 3D DIC in uniaxial compression loading 62


64 Figure 1.4 Strain gauge instrumentation arrangement and typical failure pattern of Hawkesbury sandstone. A, B, C, D and E refer to the location of strain gauges 63
65 Axial stress, q (MPa) q peak = 33.0 (ε A average by LVDTs) ( ε L by lateral extensometer) ε L dε L /dt= ε A Axial & lateral strain ε A & ε L (x10-4 ) Time, t (s) a) 64
66 10 10 (ε A average by LVDTs) Rate of loading df/dt (kn/s) E-3 dε A /dt df/dt Peak stress occurance ( ε L by lateral extensometer) dε L /dt= E-3 Rate of Axial & lateral strain dε A /dt & dε L /dt (x10-4 /s) 1E E Time, t (s) b) Figure 1.5 Typical time history of a) loading and strains and b) loading rate and strain rate in uniaxial compression tests with lateralstrain rate feedback signal 65
67 Figure 1.6 Recovering the third dimension by using two cameras (Sutton et al. 2009) 66
 Calibration procedure for the stereo cameras")

68 a) b) Figure 1.7 a) Calibration procedure for the stereo cameras left and right pair imaging and b) location of the virtual extensometers within the area of interest and rock at the end of the compression test 67
69 40 Bedding Machine error (BE) compliance (MC) Axial stress, q (MPa) DIC-E0 LVDT Platen Strain localisation BE MC Axial strain, ε A (x10-4 ) a) 68
70 40 Axial stress, q (MPa) Average DIC (E5 & E6) DIC-E5 Extensometer Lateral strain, ε L (x10-4 ) DIC-E6 b) Figure 1.8 a) Stress-axial strain curves from platen displacement, external LVDT and DIC measurements (DIC-E0) and b) Stress-lateral strain curves from lateral extensometer and DIC measurements (DIC-E5 and E6) 69
71 40 Strain gauge location A B D F LVDT Axial stress, q (MPa) Axial strain, ε A (x10-4 ) Figure 1.9 Typical stress-strain curves with axial strains obtained from external LVDT and strain gauges 70
72 40 q cc = Crack closure q ci = Crack initiation q cd = Crack damage q peak = peak stress q peak 0.90q peak Axial stress, q (MPa) q cd = 0.67q peak q ci = 0.52q peak q cc = 0.29q peak Strain localisation 0.70q peak 0.60q peak 0.45q peak 0.15q peak 0.03q DIC-E1 DIC-E2 DIC-E0 peak Axial strain, ε A (x10-4 ) Figure 1.10 Typical stress-strain curves obtained from DIC for virtual extensometers DIC-E0, DIC-E1 and DIC-E2 71

73 a) 72

74 b) 73

75 Figure 1.11 Field of axial strains developed at different stress levels in a) pre-peak regime and b) and c) post-peak regime c) 74
76 a) 75


77 Figure 1.12 Field of shear strains developed at different stress levels in a) pre-peak regime and b) post-peak regime b) 76
78 LIST OF TABLES Table 1.1 Hawkesbury sandstone properties and threshold stresses for fracture damage Sample No. Strain qpeak or UCS Young s Poisson s measurement (MPa) modulus ratio () qcc/qpeak qci/qpeak qcd/qpeak (GPa) 1 Strain gauge DIC DIC DIC DIC Average SD ±1.7 ±0.3 ±0.015 ±0.02 ±0.03 ±0.01 ()*+ : Peak stress, UCS: Unconfined Compressive Strength, qcc : Crack closure stress, qci : Crack initiation stress, qcd : Crack damage stress. SD: Standard deviation 77
79 STATEMENT OF AUTHORSHIP 78
80 FRACTURE ENERGY-BASED BRITTLENESS INDEX DEVELOPMENT AND BRITTLENESS QUANTIFICATION BY PRE-PEAK STRENGTH PARAMETERS IN ROCK UNIAXIAL COMPRESSION H. Munoz 1, A. Taheri 2, E. K. Chanda 3 1 Deep Exploration Technologies Cooperative Research Centre DET CRC, Export Park, Adelaide Airport, SA 5950, Australia, and School of Civil, Environmental & Mining Engineering, The University of Adelaide, SA 5005, Australia, Ph: , Fax: , henry.munozprincipe@adelaide.edu.au (corresponding author) 2 Senior Lecturer, School of Civil, Environmental & Mining Engineering, The University of Adelaide, SA 5005, Australia, Ph: , Fax: , abbas.taheri@adelaide.edu.au 3 Associate Professor, School of Civil & Environmental & Mining Engineering, The University of Adelaide, SA 5005, Australia, Ph: , Fax: , emmanuel.chanda@adelaide.edu.au ABSTRACT Brittleness is a fundamental mechanical rock property critical to many civil engineering works, mining development projects and mineral exploration operations. However, rock brittleness is a concept yet to be investigated as there is not any unique criterion available, widely accepted by rock engineering community able to describe rock brittleness quantitatively. In this study new brittleness indices were developed based on fracture strain-energy quantities obtained from the complete stress-strain characteristics of rocks. In doing so, different rocks having Unconfined Compressive Strength values ranging from 7 to 215 MPa, were 79
81 examined in a series of quasi-static uniaxial compression tests after properly implementing lateral-strain control in a closed-loop system to apply axial load to rock specimen. This testing method was essential to capture post-peak regime of the rocks since a combination of class I-II or class II behaviour featured post-peak stress-strain behaviour. Further analysis on the post-peak strain localisation, stressstrain characteristics and the fracture pattern causing class I-II and class II behaviour were undertaken by analysing the development of field of strains in the rocks via three-dimensional digital image correlation (3D DIC). Analysis of the results demonstrated that pre-peak stress-strain brittleness indices proposed solely based on pre-peak stress-strain behaviour do not show any correlation with any of pre-peak rock mechanical parameters. On the other hand, the proposed brittleness indices based on pre-peak and post-peak stress-strain relations were found to competently describe an unambiguous brittleness scale against rock deformation and strength parameters such as the elastic modulus, the crack damage stress and the peak stress relevant to represent failure process. KEYWORDS Brittleness index, fracture energy, post-peak energy, uniaxial compression, digital image correlation INTRODUCTION Brittleness refers to deformation that involves hard, strong material that fractures and splits rather than staying whole while pliably deforming. Therefore, rock failure behaviour is defined by brittleness. Brittleness is an essential mechanical rock property critical to many civil engineering works, mining development projects and mineral exploration operations. Rock brittle fracture damage, detrimental to stability of surface and underground rock excavations rock breakage and drilling, are amongst major practical applications. However, rock brittleness is a concept yet to be investigated as there is not any standard criterion (i.e. brittleness index) available to describe failure characteristics of different rocks. For instance, a number of different criteria to assess brittleness upon pre-peak stress-strain characteristics in uniaxial compression including ratios between elastic 80
82 to plastic strain as well as fracture strain-energy relations, e.g. (Hucka and Das 1974; Kidybiński 1981), are found to be insufficient to describe failure behaviour of rock (Tarasov and Potvin 2013). In the same manner, other brittleness indices are developed based on ratios between uniaxial compressive to tensile strength, e.g. (Altindag 2002; Hucka and Das 1974; Kahraman 2002). In this respect, in the present study rock brittleness is developed upon pre-peak and post-peak stressstrain energy balance to describe rock brittleness against pre-peak rock strength parameters in uniaxial compression including Young s modulus, crack damage stress and peak strength. In this sense, the complete stress-strain characteristics in uniaxial compression become a fundamental piece of information to describe the total process of rock deformation to assess brittleness based on post-peak failure behaviour. Pioneering studies on the complete stress-strain behaviour of rocks undergoing quasi-static compression (Hudson et al. 1971; Wawersik and Brace 1971; Wawersik and Fairhurst 1970) classify rocks into two categories: class I, characterised by a negative post-peak slope, where fracture propagation is stable, and class II, showing positive post-peak slope, where fracture propagation is unstable. Nonetheless, few studies can be found in the literature dealing with postpeak measurements in the case of rocks following class II behaviour. In the first place, this limitation is due to the lack of implementation of a proper load-control method to respond accordingly to rock class II behaviour. That is, rock behaviour under axial loading is generally studied in laboratory using load-controlled or displacement-controlled compressive loading systems. From here, load-controlled method can only measure pre-peak behaviour. To measure post-peak behaviour of rocks in unconfined and confined conditions, e.g. (Gowd and Rummel 1980; Kumar et al. 2010), generally displacement-controlled method (i.e. axial-displacement or axial-strain rate feedback to control axial load) is implemented in servo-controlled compressive machines, e.g. (Bieniawski and Bernede 1979). Nevertheless, displacement-controlled method is insufficient to measure post-peak regime for class II rocks because axial strain no longer monotonically increases from the moment rock behave as class II. As a result, following this method, a critical 81
83 response of the rock takes place leading to rock drastic failure. Consequently, postpeak stress-strain behaviour is masked by a rapid strength reduction at constant displacement immediately after peak stress, e.g. (Labuz and Biolzi 2007). However, this post-peak critical response may be a manifestation of axial displacementcontrol compliance and not true material behaviour. In this view, circumferential or lateral-strain controlled method is suggested by some researchers to measure postpeak stress-strain for brittle rocks (Fairhurst and Hudson 1999; Hudson et al. 1971). This is mainly because lateral displacement monotonically increases after peak stress even if axial displacement decreases. In the present study, fracture energies, obtained from the complete stressstrain curve and dissipated during crack development which is associated with decreasing of load-carrying capacity in post-peak regime, are the basis to develop brittleness indices. Fracture energy obtained from the complete stress-strain curve (i.e. pre-peak and post-peak energy) following either class I or class II behaviour can be estimated by taking into account the actual shape of complete stress-strain curve (Jansen and Shah 1997; Markeset and Hillerborg 1995). Alternatively, fracture energy can be estimated by some simplified expressions taking into account both the elastic Young s modulus and a single linear post-peak modulus to represent the complete stress-strain curves of rock (Tarasov and Potvin 2013; Tarasov and Potvin 2012; Xue-bin and Yi-shan 2003). However, in general, the actual features of pre-peak and post-peak stress-strain curves of rock may be overly simplified if fracture energy is obtained in this manner by using single values of Young s modulus and post-peak modulus. In addition, post-peak fracture development characteristics are very complex and they cannot be characterised simply by a single post-peak modulus as post-peak progressive fracture in the rock takes place at different shear-tensile extent and at different rates. Furthermore, post-peak behaviour can consist of not only class I or class II behaviour, i.e. class I, characterised by a negative post-peak slope and class II, showing positive post-peak slope, but it can be endowed by a combination of class I-II behaviour at different extent. Therefore, a single post-peak modulus value may not be an accurate representative of the whole post-peak response. 82
84 In this respect, Wawersik and Fairhurst (Wawersik and Fairhurst 1970), for instance, observed in uniaxial compressive test on granite, limestone, basalt and marble, (UCS between 35 and 350 MPa) that none of the post-failure curves could be approximated by a linear fitting. They pointed out that it is difficult to conceive intuitively how a simple approximately linear form of stress-strain relationship was obtained in the post-failure curves of norite, quartzite, and an unidentified soft rock by Bieniawski (Bieniawski 1967) as fracture in these materials consisted of a combination of slabbing and faulting. Unlike the study undertaken by Tarasov and Potvin (Tarasov and Potvin 2013) which shows a simple approximately linear form of post peak stress-strain relations for a sandstone, a quartzite and a dolerite (UCS between 180 to 380 MPa) all following class I behaviour in unconfined compression tests, studies on the post-peak curves on granite (UCS between 40 to 340 MPa) conducted by Vasconcelos et al. and Wawersik and Brace (Vasconcelos et al. 2009; Wawersik and Brace 1971) show successive drops and recoveries of the load-carrying capacity at different extent, i.e. class I and class II behaviour at different extent. In this case, as indicated by Vasconcelos et al. and Wawersik and Brace, crack propagation process is deemed as the main characteristic of post-peak behaviour that may be responsible to define the final shape of the stress-strain curve. Therefore, the post-peak stress strain curve may result on either type a smooth or irregular saw-shape curve associated with the mechanism of recovery of stress provided by grain interlocking in between the sides of macro cracks. In post-peak regime deformations associated with the formation and coalescence of distributed longitudinal cracks and faulting localisation of quasibrittle materials takes place within a damage zone which is limited by the length of the damage zone (Bažant 1989; Jansen and Shah 1997; Markeset and Hillerborg 1995). In this condition, conventional local strain measurements by extensometers and strain gauges cannot entirely capture the strains developed in post-peak regime. In this case, extensometer misalignment and strain gauge damage are the major issues. Particularly these problems initiate when progressively growing cracks and localisation take place in specimen. As a result, non-contact strain measurement via three-dimensional digital image correlation (3D DIC) becomes relevant to measure 83
85 strains development in post-peak regime. Digital image correlation (DIC) refers to the class of non-contact methods that acquire images of an object, store images in digital form and perform image analysis to extract full-field shape, deformation and motion measurements (Chu et al. 1985; Sutton et al. 2009). 3D DIC has been used to study deformation of different materials (Heinz and Wiggins 2010; Song et al. 2013; Yang et al. 2015). This technique was implemented in this study to accurately measure rock deformation in pre-peak and post-peak regimes. In summary, there is not any study on rock brittleness assessment on the ground of post-peak instability taking into account the complete stress-strain characteristics in uniaxial compression. In addition, an unambiguous brittleness scale against rock strength parameters such as elastic modulus, crack damage stress and peak stress relevant to represent failure process development has not been developed yet. In view of the above, the present study aims to characterise complete stress-strain behaviour of different soft, medium-strong and strong rocks (UCS is ranging from 7 to 215 MPa) in uniaxial compression. Another objective is to develop a brittleness index based on fracture energy dissipation resulted from the complete stress-strain curve in uniaxial compression able to describe unambiguously a brittleness scale against rock mechanical parameters. EXPERIMENTAL STUDY ROCK MATERIAL AND PREPARATION A series of uniaxial compressive tests under quasi-static monotonic loading conditions were carried out on different rock samples including five limestones (Tuffeau, Savonniere, Massangis, Chassagne and Rocheron), a sandstone (Hawkesbury) and two granites (Alvand and Harcourt) presented in Table 2.1. At least three specimens have been tested for each rock sample. It is anticipated that stress-strain parameters shown in the present study are representative values of a group of tests. The limestones, which are sources from different quarries in France, all belong to Middle Jurassic. Hawkesbury sandstone is an early Middle Triassic rock sources from New South Wales, Australia. Alvand granite, a late Paleogene rock, is known as a typical strong rock in western Iran. The Upper Devonian 84
86 Harcourt granite was sourced from Mount Alexander in Victoria, Australia. The rock samples correspond to fine to medium grain size rock having densities varying from 1.40 to 2.70 g/cm 3 (Table 2.1). The rocks were quarried and prepared in blocks otherwise were collected from the field as cores retrieved during drilling. Cylindrical specimens were prepared by coring the rock blocks. The diameter of the specimens was 42 mm. A visual inspection shows that the specimens diameters was from 10 to more than 20 times bigger than the rock grains size satisfying recommendations given by the International Society for Rock Mechanics (ISRM) (Bieniawski and Bernede 1979; Fairhurst and Hudson 1999). The end faces and sides of the specimen were prepared smooth and straight according to the ISRM standard (Fairhurst and Hudson 1999; ISRM 1981). The aspect ratio (i.e. length to diameter ratio) of the samples was maintained at 2.4 for all the rock samples. ROCK INSTRUMENTATION The rock specimens were instrumented locally by six strain gauges orientated in the axial direction, as depicted in Figure 2.1a (letters A, B, C, D, E and F refer to the strain gauge location), to measure the respective axial strains. The strain gauges used were both KFG C1 (30 mm gauge length) and KFG C1 (10 mm gauge length) types manufactured by Tokyo Sokki Kenkyujo Co. Axial extensometers type F20-series manufactured by MTS Systems Co were attached to the samples as well, as depicted in Figure 2.1a. Additionally, axial deformation of the specimens was measured externally by a pair of axial linear variable displacement transducers (LVDTs) mounted at both left and right sides to the rock specimen. Axial strains were calculated for strain gauges, extensometers and LVDTs readings. Additionally, the rock specimens were instrumented by a direct-contact lateral extensometer (lateral ring-shape extensometer) wrapped around the cylindrical sample, see Figure 2.1a. This device was essential to control the axial load by lateral strain. The lateral extensometer was mounted at mid-length of the rock specimens so that end-edge friction effects (Hawkes and Mellor 1970) and 85
87 confined zones due to boundary conditions (Van Vliet and Van Mier 1995) on the measurements were eliminated. Lateral strains ( ) were calculated from the change in diameter length of the sample induced by axial load. The lateral extensometer type used in the tests was that F20-series manufactured by MTS Systems Co. 3D DIGITAL IMAGE CORRELATION METHOD As the details of DIC application to uniaxial compression tests are given by Munoz et al. (Munoz et al. 2016a), herein only a brief description of the methodology is presented. This technique encompasses setting up two digital cameras pointing at the specimen from two different angles and capturing a series of grey-scale images of the specimen surface pattern to create three-dimensional measurement of shape and displacements of the specimen. Figure 2.1b shows the experimental set up used in this study for three-dimensional (3D) DIC measurements. Rock surface deformations induced by the compressive load throughout the tests were captured by taking a significant number of images of the speckle surface of the specimens by using a couple of digital cameras (i.e. Fujinon HF75SA-1, 1:1.8/75mm, 5 Megapixels resolution) suitable for quasi-static load testing. The speckle pattern on the rocks, created by firstly spraying ordinary white paint and then spray-tarnishing black paint, e.g. (Heinz and Wiggins 2010; Song et al. 2013; Yang et al. 2015), was non-repetitive, isotropic and high in contrast, i.e. random pattern exhibiting no bias to an orientation and showing dark blacks and bright whites, adequate in size for high-strain resolution (Sutton et al. 2009). Prior to the compression tests, each camera was calibrated using a 30-mm standard target having uniformly spaced markers. Calibration results produced a standard deviation of residuals of (in pixels). This value suggests that the calibration of the cameras is adequate for measurements (Sutton et al. 2009). Images of undeformed and deformed states of the specimen were captured automatically by Vic-Snap software at a frame rate of an image each 0.5 seconds, from the start of loading for during the first 30 minutes, and thereafter an image each 5 seconds until the end of the tests. This frame rate results suitable to capture 86
88 and store a large number of images for further analysis. Instantaneous axial deformation, lateral deformation, applied load and instantaneous images were synchronously acquired to ensured one-to-one correspondence between load, deformation and respective images. Imaging data processing of the area of interest was conducted by VIC-3D software. LOADING SET-UP AND TESTING METHOD The rock specimens were subjected to a quasi-static monotonic axial loading by a compressive machine which was stiff enough to not allow the elastic energy to be accumulated in the machine (i.e. Instron-1342 and 1282 models manufactured by Instron Inc.). The closed-loop servo control system of the compressive machine is fully digital and it is capable and flexible to control the applied axial load by an in-built computer system as a function of lateral-strain feedback signal. Thus, the applied axial load was controlled in a way keeping lateral strain-rate constant. In this sense, the electronics and computer program allowed the hydraulic system to be adjusted continuously and automatically to ensure the load to respond accordingly with the feedback signal and with the damage extent to the specimen. Axial load (by a load cell), axial strain (by strain gauges, extensometers and external LVDTs) and lateral strain (by a ring extensometer) were acquired continuously by a data acquisition system at a rate of 4 data points per second. Different load cells having capacities of 100, 250 or 1000 kn were installed in the compressive machine depending on the strength of rock. Applying uniform load to the rock samples, essential to avoid premature failure of the specimens, was ensured in all the tests by using a hinge-type pedestal that adjusted the specimens centre line to fit perpendicular to the loading platen and avoid misalignments. In all the tests, no additional friction-reducing layers in contact between the specimens and the loading platen were used. In this case, the platen was in direct contact with the specimens. 87
89 COMPRESSIVE TEST RESULTS LATERAL-STRAIN CONTROLLED TEST The application of a proper loading method in the compression tests was critical in order to obtain the complete post-peak stress-strain response of the rocks as post-peak stress-strain characteristics are the main component to develop the brittleness indices proposed herein. In this respect, Figure 2.2 shows the normalised stress-strain curves for Hawkesbury sandstone under uniaxial compression loading following load-controlled, axial-strain controlled and lateral-strain controlled loading methods. Tests were performed under a constant axial-load increment of kn/s (or MPa/s), a constant axial strain increment of 6x10⁻⁶ /s and a constant lateral-strain increment of 2x10⁻⁶ /s, respectively, to satisfy static to quasistatic loading conditions (Bischoff and Perry 1991; Hudson et al. 1971; Wawersik and Brace 1971; Wawersik and Fairhurst 1970). Normalisation was done by dividing stresses and strains (here strains comes from LVDT readings) by the peak stress and the strain at the peak stress, respectively. Figure 2.2 shows, on one hand, that pre-peak curves nearly overlap to each other irrespective of the loading method used in the tests. On the other hand, in the tests following axial load-controlled and axial-strain controlled methods, it was not possible to capture the complete postpeak stress-strain curves as Hawkesbury sandstone behaved at some moments as class II. In general, this outcome clearly indicates that if rock follows class II or a combination of class I-II mode behaviour, as observed in the rest of the rocks tested here, the compressive tests end prematurely at the moment that class II behaviour start dominating post-peak regime. Unlike load-controlled and axial-strain controlled methods, lateral-strain controlled method was successfully implemented to measure pre-peak and postpeak stress-strain relation of all the rocks introduced in Table 2.1. A constant lateral-strain increment of 2x10⁻⁶ /s was applied to all the rocks throughout the compressive tests. Axial-strain rate varied from 1.7x10⁻⁵ /s to 2x10⁻⁶ /s at the beginning to the end of the test with axial-rate fluctuations. Figure 2.3a and Figure 2.3b show the time history of stress and strains and stress and strain rates of Hawkesbury sandstone, respectively. As it can be seen in Figure 2.3b, from the 88
90 moment that lateral-strain control takes over the test, at nearly the beginning of loading, the axial-load rate and the axial-strain rate were about 0.2 kn/s and 1.7x10⁻⁵ /s, respectively, and thereafter they start to decrease gradually as the stress in the rock reaches peak stress. After peak stress, the axial strain and load rate experienced fluctuations as the result of the strength response of the rock and the automatic adjustment of applied loading upon the damage extend induced in the sample. In other words, post-peak regime was characterised by progressively dropping and minor recoveries, if any, of the load-carrying capacity accompanied with crack propagation process and localisation. Rock samples tested following lateral-controlled method failed very smoothly, i.e. an eruptive failure was not observed in any sample at the end of the tests. Cracks growing and shear zone localisation were the main failure characteristics of rock samples (see Figure 2.1a). Essentially axial splitting of the sample by macroscopic crack (or cracks) extending in the direction of axial load and faulting or macroscopic shear failure was observed depending on rock type and strength. For instance, in Hawkesbury sandstone, faulting was observed. For limestones and granites, predominantly distributed longitudinal cracks were observed at the end of the tests. COMPLETE AVERAGE STRESS-STRAIN CURVES In post-peak regime, local strain measurement (by extensometers and strain gauges) is insufficient to capture strains when progressively growing cracks and localisation took place. In this case, extensometer misalignment and strain gauge damage make post-peak strains reading difficult or impossible, thus incomplete stress-strain curves may be resulted. For instance, in Figure 2.4 LVDT captured the complete stress-strain curve (average strain) while curves labelled A and D (see strain gauge location in Figure 2.1a) were damaged at or immediately after peak stress and, therefore, they did not capture post-peak strains. This is very common for the strain gauges attached to specimen. Also, strain gauges C and E only captured pre-peak strains (curves C and E are not shown in Figure 2.4). Furthermore, strain gauges B and F which were not damaged during the compressive loading (i.e. B and F were out of the localised shear zones) only 89
91 measured local inelastic unloading after peak stress. Therefore, discussions given here are based on axial strains obtained from LVDTs or DIC measurements. Although LVDT s readings contained bedding error (Taheri and Tani 2008), they can be used to describe the post-peak characteristics of rocks with sufficient accuracy, see (Jansen and Shah 1997; Markeset and Hillerborg 1995). Results obtained by DIC measurement, however, are free from this experimental error (Munoz et al. 2016a). In this view, axial strains from LVDTs, both in pre-peak and post-peak regime are presented in Figure 2.5 for all the rocks tested in this study. In general, it was observed that immediately after the peak stress ()*+ took place, progressive drop of stress was followed associated with the progressive strength degradation of the rock. Upon strength and rock type, post-peak regime complied with either a combination of class I-II behaviour, or otherwise class II behaviour. Successively sudden drops and recoveries of the load-carrying capacity at different extent shaped post-peak stress-strain curves from smooth-type to irregular saw-shape as shown in Figure 2.5. The former may be associated with the internal bonding connections breakage and the favourable shear strain localisation. On the contrary, the latter, stress-strain curves may be associated with the mechanism of recovery of the stress provided by interlocking in between the sides of the macro cracks as suggested in previously studies on granite and high strength concrete, e.g. (Jansen and Shah 1997; Vasconcelos et al. 2009). It is noteworthy that no sign of perceptible major crack in the specimen was noticed during pre-peak regime neither at peak stress. It was only after peak stress was reached that the rocks experienced progressively macro cracking growth from coalescence of micro cracks. A major cracking in the form of a predominant single shear-failure plane took place in the case of Hawkesbury sandstone. For the rest of the rocks, as shown in Figure 2.1a combination of shear cracks and distributed longitudinal cracks at different extent gradually happened during post-peak loading. Microscopic studies, not conducted in the present study, suggest that macroscopic shear failure initially involves uniform nucleation and growth of micro crack throughout the sample 90
92 followed by accelerated cracking over a central region of sample as the peak stress is approached to eventually form a macroscopic large shear plane (Horii and Nemat- Nasser 1986; Wong 1982). On the other hand, if the axial compression is accompanied by large amount of lateral expansion, crack growth becomes unstable after a certain crack length is attained, resulting in axial splitting (Horii and Nemat- Nasser 1986). PRE-PEAK STRESS-STRAIN QUANTITIES In general, the stress-strain curves follow stages distinguished by: i) an initial region bound by && where existing micro cracks are closed during initial loading; ii) once existing cracks are closed, rock is assumed to behave linear elastic until the onset of &' (Martin and Chandler 1994). Random stable axial cracking associated with axial stresses slightly above &' are considered to not reduce the rock strength (Bieniawski 1967); iii) & is associated to the reversal point of the total volumetric strain at the onset of dilation generated by crack development and represents the onset of unstable crack growth (Bieniawski 1967) which is characterised by significant structural changes to the rock (Hallbauer et al. 1973); iv) while ()*+ marks the onset of the post-peak behaviour. After peak-stress is attained, macro cracks growing, coalescence of cracks and localisation characterise the post-peak regime (Bieniawski 1967). These typical characteristic stresses were well observed in the rocks tested in the present study and extracted from the stressstrain curves according to Martin and Chandler (Martin and Chandler 1994). Table 2.2 summarises the average values of ()*+ (i.e. UCS), Young s modulus ( IJK ) and normalised crack damage stresses & / ()*+ of the rocks tested here. The values of IJK were extracted from the linear-elastic portion of the stress-strain curves limited by && and &'. Here, strains were obtained from LVDTs and lateral-extensometer readings. Elastic modulus values ranged from 1.90 to 48.8 GPa, while the UCS of the rocks ranged from 7 to 215 MPa. Crack damage stress values & occurred at 0.66 to 0.99 ()*+ depending on rock type and its strength. Figure 2.6 shows the relationships between IJK and & with 91
93 ()*+ for all the rocks tested in this study. A sound linear correlation was found in both cases. POST-PEAK LOCAL STRAIN FEATURES Digital image correlation analysis provided quantitative evidence on the nature of field strains developed in the rock surface throughout the compressive test. In Figure 2.7, Figure 2.8, and Figure 2.9 different loading stages along the stress-strain curve including crack closure &&, crack initiation &', crack damage & and the peak stress ()*+ in pre-peak as well as post-peak stresses at 0.70 ()*+ to 0.15 ()*+ were selected of representative rocks to examine field of axial strain patterns. The field of strains within the area of interest Figure 2.7, Figure 2.8, and Figure 2.9 demonstrate that the specimens do deform uniformly in pre-peak regime, i.e. axial strains start increasing uniformly, provided relatively homogenous intact rock and uniform load, as axial load increases until peak stress, as shown by colour gradient in the samples at pre-peak stress levels. On the other hand, in post-peak regime the field of strains increased progressively at different rates with large deformations localising around the future failure plane or along axial macro cracks extending in the direction of the axial load. The results indicate that deviation from strain uniformity begins progressively after peak stress was reached. Thereafter, as shown by gradient colour in Figure 2.7, Figure 2.8, and Figure 2.9 strains start extending rapidly as the rate of strength degradation is accelerated. Uniform development of strains in the samples, explained in the above paragraph by Figure 2.7, Figure 2.8, and Figure 2.9, produced a single stress-strain curve in pre-peak regime, i.e. a single stress-strain curve in pre-peak regime was extracted from the virtual extensometers (i.e. E0, E1 and E2) irrespective of their length and location within the study area in the sample. See the length and location of E0, E1 and E2 in Figure 2.7, Figure 2.8, and Figure 2.9. This observation confirms that the stress-strain curve before peak stress describes the overall compressive behaviour of the material. Failure mode features of a given rock, be either class I-II or class II, were captured globally by LVDTs and locally by virtual 92
94 extensometers (i.e. E0, E1 and E2, see Figure 2.7, Figure 2.8, and Figure 2.9). The results indicate that a set of different local post-peak moduli in the specimen can be expected as local post-peak strains responded differently when deformation, encountered by local gauges, associated to axial cracking or faulting developed at different extent. Therefore, the average axial strain obtained from LVDTs in postpeak regime may be much lower than local axial strains measured at localised zones as shown for instance by E1 in Figure 2.8. This is mainly because after peak stress is reached, areas of sample which are located outside of the localised zone undergo inelastic unloading, making the average axial strain smaller that the strain measured in the localised zone. FRACTURE ENERGY IN COMPRESSION The complete stress-strain curves allowed assessing the total fracture energy per unit volume of rock dissipated throughout the compressive tests. Local stressstrain curves extracted from the virtual extensometers E0, E1 and E2 as shown in Figure 2.7, Figure 2.8, and Figure 2.9 do yield local fracture energy as fracture energy is calculated by the area under the respective local stress-strain curves. Therefore, it is expected to have a distribution of local fracture energy upon the length and location of local extensometers with respect to localised zones within the area of interest in the rock sample. In this respect, Figure 2.9 shows the local stress-strain and energy characteristics in a Hawkesbury sandstone sample. Figure 2.9a shows the location and length of virtual extensometers E0, E(A), E(B) and E(C) and Figure 2.9b shows their respective stress-strain curves. The stress-strain curves by E(A), E(B) and E(C) present a transition from damaged to undamaged zones in different areas of the specimen. This behaviour is also shown by the colour gradient in Figure 2.9a. The post-peak curves presented in Figure 2.9b were characterised by either i) local inelastic unloading in the material outside of the damaged zone or ii) localised strain in the material inside of the damaged zone. For instance, in Figure 2.9b, E(C) unloaded at the peak stress level unlike E(A) and E(B) which encountered the failure plane and experienced localised strains. Overall behaviour of the 93
95 Hawkesbury sandstone sample is captured by E0 which include localised damaged zone and undamaged zone which experiences unloading in post-peak regime. The distribution of the locally dissipated fracture energy is depicted in Figure 2.9c. From Figure 2.9c, it can be observed that the dissipated local energy in the damage zone in the specimen by E(A) is obviously the highest when compared with withdrawn energies from E(B) and E(C) and even with the energy withdrawn from the total length E0. This is mainly because, unlike other virtual extensometers, E(A) captures most of the strains in the localised zone. In this instance, energy by E0 can be calculated by summing up the local energy in each portion of the specimen following studies on localisation, e.g. (Markeset and Hillerborg 1995; Watanabe et al. 2004) as, l4() L-L*.14M = L-L*.14() + l4(q) l4m L-L*.14(Q) + l4(r) l4m L-L*.14(R) l4m Where l(s), l(), l() and l0 are the gauge length of virtual extensometers E(A), E(B), E(C) and E0, respectively. Correctness of this relation is proved by the experimental results of energy consumed locally by E(A), E(B) and E(C) and the average consumed energy by E0 presented in Figure 2.9c. Furthermore, energy quantities, from DIC extensometer E0 (see location of E0 in Figure 2.7, Figure 2.8, and Figure 2.9) and LVDT differed by only 2 to 7% in this study. This suggests that although LVDT strains contain bedding errors, they can be used with enough accuracy to assess fracture energy quantities of the rocks. Therefore, compression fracture energy for the rocks was estimated from the stressstrain curves with LVDTs depicted in Figure 2.5 which represent the total average strains of the entire rock specimen. The total fracture energy ( L-L*. ) comprises of pre-peak energy ( (T) ) and post-peak energy ( (T) ) and it is expressed by the following equation: (1) L-L*. = (T) + (-UL (2) 94
96 Pre-peak energy per unit volume of rock is estimated as the area under the stress-strain curve enclosed by loading the specimen up to the peak stress and then unloading it completely. In Figure 2.10a, the unloading path was assumed to be linear with a slope equal to HVWX (i.e. the Young modulus obtained by LVDTs), see Table 2.2 for the values of HVWX of the rocks. On the other hand, post-peak energy was calculated taking into account the area under the post-peak stressinelastic strain. That is the area under the unloaded pre-peak stress-strain curve (assuming that unloading curve s Young s modulus, Eun, is equal to loading curve s Young s modulus, ELVDT) and under the post-peak stress-inelastic strain as shown in Figure 2.10a. Herein, the post-peak fracture energy was defined until a post-peak stress level equal to about one third of the peak stress, i.e ()*+, a stress level where the stress-strain curve is terminated by drawing a linear unloading following a slope equal to HVWX (Jansen and Shah 1997; Jansen et al. 1995). The quantities of L-L*., (T) and (-UL for the rocks studied here are reported in Table 2.3. Furthermore, Table 2.3 also reports the values of elastic energy ( ) ) at peak stress (see Figure 2.10b for the notation of ) ) where ) is obtained as follows: ) = Y ^ Z[\] (3) 24 _`ab Figure 2.10c shows the relationship of (T), (-UL, L-L*. and ) with their respective peak stress ()*+ for the rocks studied here. This figure shows that ) obviously increases in a linear fashion with an increase in ()*+. Unlike the values of ), (-UL and L-L*. energies increase with an increase in ()*+ until ()*+ = 180 MPa and then decreases smoothly when ()*+ increases. This trend clearly complies with low energy enclosed in the stress-strain curve of rocks that follow class I-II or class II post-peak behaviour. Figure 2.5 clearly shows this behaviour in rocks with higher peak strength. In addition, in Figure 2.10c, (T) seems to increase slightly as ()*+ increases, although, the results does not show any conclusive trend. 95
97 ENERGY-BASED BRITTLENESS INDEX In this section, firstly, a number of brittleness indices, which were developed previously based on the pre-peak rock fracture energy, are examined to evaluate their capacity to measure brittleness and their relation with strength parameters. Then, a number of brittleness indices based on the pre-peak and the post-peak fracture energy in uniaxial compression are proposed. Finally, it is attempted to find correlations between the proposed brittleness indices with the prepeak strength parameters of rock including the elastic modulus ( IJK ), the crack damage stress ( & ) and peak stress ( ()*+ ). Brittleness indices that take into account only pre-peak stress-strain characteristics, namely, 0 upon strain ratio (Hucka and Das 1974) and upon energy ratios 2 (Hucka and Das 1974) and c (Kidybiński 1981), see expressions below, were investigated. 0 = d ef[ d efgh id ef[ (4) 2 = j [ j Z[\] (5) c = j Zh[ j [ (6) Where 1) is the elastic axial strain and 1'T is the irreversible axial strain. ()*+ is the strain energy until peak stress ( ()*+.= (T) + ) ). These quantities are summarised in Table 2.3. Figure 2.11, Figure 2.12 and Figure 2.13 show the plot relation of brittleness indices 0, 2 and c with strength parameters ()*+, &, and IJK. Figure 2.11a, b and c demonstrate that 0 was not able to correlate well with three pre-peak rock parameters. Furthermore, brittleness index 0 for most of the rocks shows a single value, about 0.8 on average, irrespective of rock increasing strength trend. Similarly, as can be seen in Figure 2.12a, b and c, the brittleness index 2, which is developed based on energy ratios in pre-peak regime, does not show an acceptable correlation with rock pre-peak parameters. In this case, although the 96
98 coefficient of correlation k 2 is relatively high for the overall data (i.e. about 0.8 in Figure 2.12a, b and c) the following was observed: the correlation was scatter for the rocks having peak strengths of 7 to 84 MPa. For the rest of the rocks, having peak strengths higher than 84 MPa, 2 is almost a constant value, in a broad sense about 0.9, which does not increase with an increase in mechanical properties values of rocks. In Figure 2.13a, b and c, the brittleness index c, which is defined using pre-peak stress-strain results was not able to show a strong correlation with prepeak mechanical rock parameters. In this case, similar to 2, although the coefficient of correlation k 2 is relatively high for the overall data (i.e. about 0.9 in Figure 2.13a, b and c) the following was observed: the brittleness index c was scatter for the rocks having peak strengths of 7 to about 84 MPa. On the other hand, for the rocks having peak strengths higher than 84 MPa, c slightly decreases and its value almost remains constant at 0.1. The above discussion on three brittleness indices based on the pre-peak stress-strain relations clearly shows that, pre-peak rock behaviour may not be sufficient to generate a rock brittleness index capable of describing rock failure behaviour with the required accuracy. As a result, in this study, a number of brittleness indices are proposed based on energy quantities from pre-peak and postpeak stress-strain characteristics following energy balance and post-peak instability. That is, an increase in the post-peak energy indicates an increase of stability (i.e. a decrease in brittleness). By the same argument, a dramatic decrease of post-peak energy indicates less stability of the failure process (i.e. an increase in brittleness). Figure 2.5 and Figure 2.10c clearly support these arguments. The following energy-based brittleness indices are proposed: j1l = j [ j mnm\o (7) j1ll = j [ j Znpm (8) j1lll = j Z[\] j mnm\o (9) 97
99 Table 2.3 summarises the strain energy quantities L-L*. and U (-UL for the rocks studied here. In Table 2.4 the values of j1l, j1ll and j1lll are presented for the rocks. As demonstrated in Figure 2.14, Figure 2.15 and Figure 2.16 the proposed brittleness indices j1l, j1ll and j1lll were able to describe properly a monotonic and unambiguous scale of brittleness with increasing pre-peak strength parameters of the rocks. In these figures, the brittleness indices clearly increase monotonically in a non-linear fashion with the peak stress ()*+, the crack damage stress &, and the tangent Young s modulus IJK. Then, obviously j1l, j1ll and j1lll applied to Tuffeau limestone (UCS= 7 MPa) yielded relatively the lowest values. On the other hand, Rocheron limestone (UCS= 215 MPa) produced the highest values of j1l, j1ll and j1lll. That is, the higher the brittleness index means that rock is more brittle. The rest of the rocks fell in between complying with the proposed brittleness scale. From the results presented in Figure 2.14, Figure 2.15 and Figure 2.16, a number of non-linear relationships between brittleness indices and pre-peak mechanical parameters are established as follows: j1l =0.563 M.MMstY Z[\], k 2 =0.955 j1l =0.581 M.MMsw Y xy, k 2 =0.956 j1l =0.510 M.M2s0 4 _`ab, k 2 =0.953 (10a) (10b) (10c) And j1ll =0.832 M.MMz0Y Z[\], k 2 =0.903 j1ll =0.847 M.MMzc Y xy, k 2 =0.927 j1ll =0.792 M.M0 c 4 _`ab, k 2 =0.820 (11a) (11b) (11c) And j1lll =0.792 M.M0 cy Z[\], k 2 =0.820 j1lll =0.867 M.MMcw Y xy, k 2 =0.925 (12a) (12b) 98
100 j1lll =0.818 M.M0sz 4 _`ab, k 2 =0.801 (12c) The above result clearly suggests that pre-peak parameters are well related to brittleness capacity of rock. This outcome becomes relevant in order to better understand material brittleness associated with the progressive fracture process characterised by the typical threshold damage stresses and the elasticity parameters. For instance, rock damage stress, & has been proposed to better quantify the in situ state of damage surrounding tunnel excavation (Eberhardt et al. 1999; Martin 1997). Furthermore, as noted by Hudson et al. (Hudson et al. 1974) and Martin and Chandler (Martin and Chandler 1994), & can be considered as intrinsic material property. Coefficient of correlations for j1l, j1ll and j1lll against rock strength parameters, indicate that in general j1l has the highest correlations in contrast to j1ll and j1lll for an exponential fitting. In summary, expressions above may become relevant for further geotechnical applications. The developed brittleness index, j1l, recently successfully has been implemented to evaluate the drilling performance of different drilling methods (Munoz et al. 2016b) CONCLUSIONS In this study three brittleness indices were developed based on not only prepeak but also post-peak stress-strain characteristics upon fracture energy balance and post-peak instability response. In this sense, obtaining the complete stressstrain characteristics of rock was fundamental to characterise pre-peak and postpeak rock properties. This was achieved by implementing properly lateral-strain controlled loading method in the uniaxial compression tests. Furthermore post-peak deformation characteristics were also examined by three-dimensional digital image correlation (3D DIC). Different soft, medium-strong and strong rocks (UCS is ranging from 7 to 215 MPa) were tested and analysed. Using results of DIC measurement, the post-peak relations of the rocks were characterised by either a local inelastic unloading in the material outside of the damaged zone (localized zone) or a localised strain in the material inside of the damaged zone. Analyses of the experimental results demonstrated that brittleness indices proposed solely based on pre-peak stress-strain behaviour do not show any strong 99
101 correlation with any of the pre-peak rock mechanical parameters, otherwise they seemed to collapse in a single value irrespective of rock mechanical properties. On the other hand, the proposed brittleness indices based on the pre-peak and the postpeak stress-strain relations were strongly correlated with the pre-peak mechanical parameters including the tangent Young s modulus, the crack damage stress and the peak stress. This outcome is relevant to suggest the pre-peak rock parameters as potential indicators for assessing and predicting rock brittleness. Therefore, the prepeak strength parameters can be suggested as potential indicators for assessing rock brittleness for further geotechnical applications. ACKNOWLEDGEMENT The work has been supported by the Deep Exploration Technologies Cooperative Research Centre whose activities are funded by the Australian Government's Cooperative Research Centre Programme. This is DET CRC Document 2016/105. REFERENCES Altindag R (2002) The evaluation of rock brittleness concept on rotary blast hole drills Journal-South African Institute of Mining and Metallurgy 102:61-66 Bažant Z (1989) Identification of strain softening constitutive relation from uniaxial tests by series coupling model for localisation Cement and Concrete Research 19: Bieniawski ZT (1967) Mechanism of brittle fracture of rock International Journal of Rock Mechanics and Mining Sciences & Geomechanics Abstracts 4: doi: Bieniawski ZT, Bernede MJ (1979) Suggested methods for determining the uniaxial compressive strength and deformability of rock materials: Part 1. Suggested method for determination of the uniaxial compressive strength of rock materials International Journal of Rock Mechanics and Mining Sciences & Geomechanics Abstracts 16:137 doi: 100
102 Bischoff PH, Perry SH (1991) Compressive behaviour of concrete at high strain rates Materials and Structures 24: Chu TC, Ranson WF, Sutton MA (1985) Applications of digital-image-correlation techniques to experimental mechanics Experimental Mechanics 25: doi: /bf Eberhardt E, Stead D, Stimpson B (1999) Quantifying progressive pre-peak brittle fracture damage in rock during uniaxial compression International Journal of Rock Mechanics and Mining Sciences 36: doi: Fairhurst CE, Hudson JA (1999) Draf ISRM suggested method for the complete stress-strain curve for intact rock in uniaxial compression International Journal of Rock Mechanics and Mining Sciences 36: doi: Gowd TN, Rummel F (1980) Effect of confining pressure on the fracture behaviour of a porous rock International Journal of Rock Mechanics and Mining Sciences & Geomechanics Abstracts 17: doi: Hallbauer DK, Wagner H, Cook NGW (1973) Some observations concerning the microscopic and mechanical behaviour of quartzite specimens in stiff, triaxial compression tests International Journal of Rock Mechanics and Mining Sciences & Geomechanics Abstracts 10: doi: Hawkes I, Mellor M (1970) Uniaxial testing in rock mechanics laboratories Engineering Geology 4: doi: Heinz SR, Wiggins JS (2010) Uniaxial compression analysis of glassy polymer networks using digital image correlation Polymer Testing 29: doi: Horii H, Nemat-Nasser S (1986) Brittle Failure in Compression: Splitting, Faulting and Brittle-ductile Transition Philosophical Transactions of the Royal Society of London Series A, Mathematical and Physical Sciences 319 (1549) The Royal Society:
103 Hucka V, Das B (1974) Brittleness determination of rocks by different methods International Journal of Rock Mechanics and Mining Sciences & Geomechanics Abstracts 11: doi: Hudson JA, Brown ET, Fairhurst C (1971) Optimizing the control of rock failure in servo-controlled laboratory tests Rock mechanics 3: doi: /bf Hudson JA, Brown ET, Fairhurst C (1974) Shape of the complete stress-strain curve for rock : Hudson, JA Univ. Minnesota, Minneapolis, USA Brown, ET James Cook Univ. Queensland, AUS Fairhurst, C Univ. Minnesota, Minneapolis, USA Symposium. In Stability of rock slopes. 8F, 2T, 14R. 13TH SYMPOSIUM ON ROCK MECHANICS ASCE, NEW YORK, 1972, P International Journal of Rock Mechanics and Mining Sciences & Geomechanics Abstracts 11:A6 doi: ISRM (1981) Rock characterization testing and monitoring ISRM suggested methods. Oxford Jansen DC, Shah S (1997) Effect of Length on Compressive Strain Softening of Concrete Journal of Engineering Mechanics 123:25-35 doi:doi: /(asce) (1997)123:1(25) Jansen DC, Shah SP, Rossow EC (1995) Stress-Strain Results of Concrete from Circumferential Strain Feedback Control Testing Materials Journal 92 doi: /9774 Kahraman S (2002) Correlation of TBM and drilling machine performances with rock brittleness Engineering Geology 65: doi: /s (01) Kidybiński A (1981) Bursting liability indices of coal International Journal of Rock Mechanics and Mining Sciences & Geomechanics Abstracts 18: doi: Kumar R, Sharma KG, Varadarajan A (2010) Post-peak response of some metamorphic rocks of India under high confining pressures International 102
104 Journal of Rock Mechanics and Mining Sciences 47: doi: Labuz JF, Biolzi L (2007) Experiments with rock: Remarks on strength and stability issues International Journal of Rock Mechanics and Mining Sciences 44: doi: Markeset G, Hillerborg A (1995) Softening of concrete in compression Localization and size effects Cement and Concrete Research 25: doi: Martin C, Chandler N The progressive fracture of Lac du Bonnet granite. In: International Journal of Rock Mechanics and Mining Sciences & Geomechanics Abstracts, vol 6. Elsevier, pp Martin CD (1997) Seventeenth Canadian Geotechnical Colloquium: The effect of cohesion loss and stress path on brittle rock strength Canadian Geotechnical Journal 34: doi: /t Munoz H, Taheri A, Chanda EK (2016a) Pre-Peak and Post-Peak Rock Strain Characteristics During Uniaxial Compression by 3D Digital Image Correlation Rock Mechanics and Rock Engineering:1-14 doi: /s y Munoz H, Taheri A, Chanda EK (2016b) Rock Drilling Performance Evaluation by an Energy Dissipation Based Rock Brittleness Index Rock Mechanics and Rock Engineering:1-13 doi: /s Song H, Zhang H, Kang Y, Huang G, Fu D, Qu C (2013) Damage evolution study of sandstone by cyclic uniaxial test and digital image correlation Tectonophysics 608: doi: Sutton MA, Orteu JJ, Schreier H (2009) Image Correlation for Shape, Motion and Deformation Measurements. Springer US, Taheri A, Tani K (2008) Use of down-hole triaxial apparatus to estimate the mechanical properties of heterogeneous mudstone International Journal of Rock Mechanics and Mining Sciences 45: doi: 103
105 Tarasov B, Potvin Y (2013) Universal criteria for rock brittleness estimation under triaxial compression International Journal of Rock Mechanics and Mining Sciences 59:57-69 doi: Tarasov BG, Potvin Y (2012) Absolute, relative and intrinsic rock brittleness at compression Transactions of the Institutions of Mining and Metallurgy, Section A: Mining Technology 121: Van Vliet M, Van Mier J (1995) Softening behaviour of concrete under uniaxial compression Vasconcelos G, Lourenço P, Alves C, Pamplona J (2009) Compressive Behavior of Granite: Experimental Approach Journal of Materials in Civil Engineering 21: doi:doi: /(asce) (2009)21:9(502) Watanabe K, Niwa J, Yokota H, Iwanami M (2004) Experimental study on stressstrain curve of concrete considering localized failure in compression Journal of Advanced Concrete Technology 2: Wawersik WR, Brace WF (1971) Post-failure behavior of a granite and diabase Rock mechanics 3:61-85 doi: /bf Wawersik WR, Fairhurst CA (1970) A Study of Brittle Rock Fracture in Laboratory Compression Experiments Int J Rock Mech Min Sci 7: Wong TF (1982) Micromechanics of faulting in westerly granite International Journal of Rock Mechanics and Mining Sciences & Geomechanics Abstracts 19:49-64 doi: Xue-bin W, Yi-shan P (2003) Effect of relative stress on post-peak uniaxial compression fracture energy of concrete J Wuhan Univ Technol-Mat Sci Edit 18:89-92 doi: /bf Yang G, Cai Z, Zhang X, Fu D (2015) An experimental investigation on the damage of granite under uniaxial tension by using a digital image correlation method Optics and Lasers in Engineering 73:46-52 doi: 104


106 LIST OF FIGURES a) 105
 Rock instrumentation (Massangis limestone) and")
 and b)")
107 b) Figure 2.1 a) Rock instrumentation (Massangis limestone) and rocks at the end of the test (Tuffeau limestone, Hawkesbury sandstone and Alvand granite) and b) servo-controlled closed-loop testing system and 3D DIC set up 106
108 Hawkesbury sandstone Class I Normalised axial stress, q/q peak End of test Axial-load control Axial-strain control Lateral-strain control Critical response Class I Class II Normalised axial strain, ε A /ε Apeak Figure 2.2 Normalised stress-strain relations of Hawkesbury sandstone under axial-load, axial-strain and lateral-strain control (the origin of the curves were shifted horizontally to not overcrowd the figure) 107
109 Axial stress, q (MPa) q peak = 33.0 (ε A average by LVDTs) ( ε L by lateral extensometer) ε L dε L /dt= ε A Axial & lateral strain ε A & ε L (x10-4 ) Time, t (s) a) (ε A average by LVDTs) 1 ( ε L by lateral extensometer) 1 Loading rate df/dt (kn/s) E-3 dε A /dt df/dt Peak stress occurrence dε L /dt= E-3 Axial and lateral strain rate dεa /dt & dε /dt L (x10-4 /s) 1E E Time, t (s) b) Figure 2.3 Typical time history of a) loading and strains and b) loading and strain rates in uniaxial compression tests (Hawkesbury sandstone) with lateralstrain control feedback 108
110 40 Strain gauge location A B D F LVDT Axial stress, q (MPa) Axial strain, ε A (x10-4 ) Figure 2.4 Typical stress-strain curves with axial strains obtained from external LVDT and strain gauges in Hawkesbury sandstone 109
111 Axial stress, q (MPa) 10 Tuffeau limestone q peak = 7.0 MPa 1/3q peak Axial strain, ε A (x10-4 ) E LVDT Axial stress, q (MPa) 30 E LVDT Savonniere limestone q peak = 24 MPa Axial strain, ε A (x10-4 ) Axial stress, q (MPa) 40 Hawkesbury sandstone q peak = 34 MPa E LVDT 1/3q peak Axial strain, ε A (x10-4 ) Axial stress, q (MPa) 100 Massangis limestone q peak = 84 MPa E LVDT Axial strain, ε A (x10-4 ) 110
112 Axial stress, q (MPa) 150 E LVDT Chassagne limestone q peak = 123 MPa Axial strain, ε A (x10-4 ) Axial stress, q (MPa) 150 Harcourt granite q peak = 143 MPa E LVDT Axial strain, ε A (x10-4 ) Axial stress, q (MPa) Alvand granite q peak = 182 MPa E LVDT Axial stress, q (MPa) E LVDT Rocheron limestone q peak = 215 MPa Axial strain, ε A (x10-4 ) Axial strain, ε A (x10-4 ) Figure 2.5 Typical complete stress-strain curves for different rocks under lateral strain-rate control 111
113 Tangent Young's modulus, E LVDT (GPa) Peak stress, q peak (MPa) Y=0.248X R 2 = a) Crack damage stress, q cd (MPa) Y=0.922X R 2 = Peak stress, q peak (MPa) 7 8 b) Figure 2.6 Pre-peak stress-strain quantities: a) tangent Young s modulus and b) crack damage stress relations with peak stress for different rock types. Numbers 1 to 8 refer to the rock type in Table
114 40 q cc = Crack closure q ci = Crack initiation q cd = Crack damage q peak = peak stress q peak 0.90q peak Axial stress, q (MPa) q cd = 0.67q peak q ci = 0.52q peak q cc = 0.29q peak Strain localisation 0.70q peak 0.60q peak 0.45q peak 0.15q peak 0.03q DIC-E1 DIC-E2 DIC-E0 peak Axial strain, ε A (x10-4 ) (a) 113

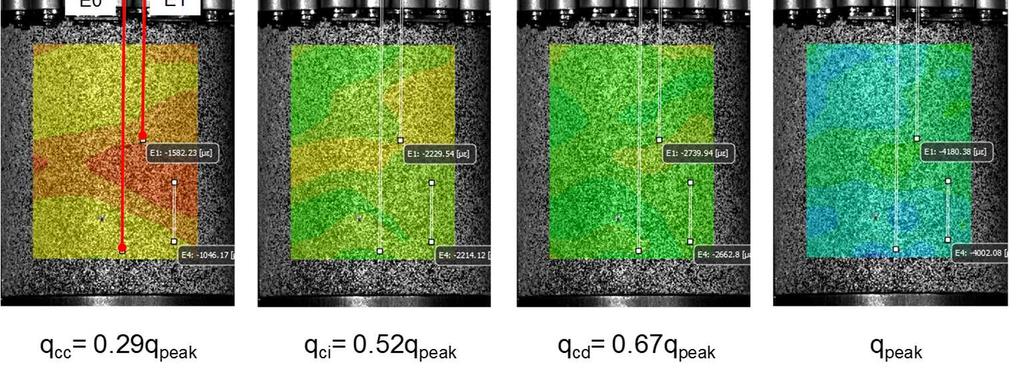
115 (b) 114
 Stress- strain curve and b) Field of axial strains")
*+ and ()*+ ) and c) post-peak regime (0.70 ()*+, 0.")
116 (c) Figure 2.7 a) Stress- strain curve and b) Field of axial strains in pre-peak regime (0.29 ()*+, 0.52 ()*+, 0.67 ()*+ and ()*+ ) and c) post-peak regime (0.70 ()*+, 0.60 ()*+, 0.45 ()*+ and 0.15 ()*+ ) of Hawkesbury sandstone 115
117 10 Tuffeau limestone q peak = 7.5 MPa q peak DIC LVDT Axial stress, q (MPa) 0.81q peak 0.70q peak 0.45q peak E 2 E 0 E 1 Unloading Axial strain, ε A (10-4 ) a) 116
 Stress- strain curve and b) Field of axial")
*+ and ()*+ ) and post-peak regime (0.")
118 b) Figure 2.8 a) Stress- strain curve and b) Field of axial strains developed in pre-peak regime (0.81 ()*+ and ()*+ ) and post-peak regime (0.70 ()*+ and 0.45 ()*+ ) of Tuffeau limestone 117


119 a) 118
120 40 Curve by E0 Class I 40 Curve by E(A) Class I Axial stress, q (MPa) 20 U total-e0 Class II Class I Class II Axial stress, q (MPa) 20 U total-e(a) Class II Class I Class II Axial strain, ε A (x10-4 ) Axial strain, ε A (x10-4 ) 40 Curve by E(B) Class I 40 Curve by E(C) Class I Axial stress, q (MPa) 20 U total-e(b) Class II Class I Class II Axial stress, q (MPa) 20 U total-e(c) Class II Axial strain, ε A (x10-4 ) Axial strain, ε A (x10-4 ) b) 119
121 0.15 Local fracture energy Total energy, U total (MPa) Average (by q vs E0) 0.00 E0 E(A) E(B) E(C) Local virtual extensometer c) Figure 2.9 a) Hawkesbury sandstone specimen and location of local virtual extensometers, b) Local stress-strain curves and c) Locally consumed energy by extensometers E(A), E(B) and E(C) and average consumed energy by E0 120
122 10 Axial stress, q (MPa) U pre E LVDT U post 1/3q peak E LVDT Axial strain, ε A (x10-4 ) a) 10 Axial stress, q (MPa) U pre E LVDT U e Axial strain, ε A (x10-4 ) b) 121
123 Elastic and pre-peak strain energy, U e and U pre (MPa) U total U e U post 5 6 Y=0.0021X R 2 = U pre Peak stress, q (MPa) 0.25 Post-peak and total strain energy, Upost and U (MPa) total c) Figure 2.10 a) and b) Strain energy of rock in compression and c) Strain energy quantities versus peak stress for different rocks. Numbers 1 to 8 refer to the rock type in Table
124 1.00 Plateau Brittleness index, B 1 (unity) Peak stress, q peak (MPa) a) 1.00 Plateau Brittleness index, B 1 (unity) Crack damage stress, q cd (MPa) b) 123
125 1.00 Plateau Brittleness index, B 1 (unity) Tangent Young's modulus, E LVDT (GPa) c) Figure 2.11 Brittleness index 0 relations with a a) peak stress, b) crack damage stress and c) tangent Young s modulus for different rock types. Numbers 1 to 8 refer to the rock type in Table
126 1.25 Plateau Brittleness index, B 2 (unity) Y=0.157X R 2 = Peak stress, q peak (MPa) 8 a) Plateau Brittleness index, B 2 (unity) Y=0.476X R 2 = Crack damage stress, q cd (MPa) b) 125
127 1.25 Plateau Brittleness index, B 2 (unity) Y=0.497X R 2 = Tangent Young's modulus, E LVDT (GPa) c) Figure 2.12 Brittleness index 2 relations with a) peak stress, b) crack damage stress and c) tangent Young s modulus for different rock types. Numbers 1 to 8 refer to the rock type in Table
128 1.0 Brittleness index, B 3 (unity) Y= 3.119X R 2 = Plateau Peak stress, q peak (MPa) a) 1.0 Brittleness index, B 3 (unity) Y= 2.917X R 2 = Plateau Crack damage stress, q cd (MPa) b) 127
129 1.0 1 Brittleness index, B 3 (unity) 0.5 Y= 1.319X R 2 = Plateau Tangent Young's modulus, E LVDT (MPa) c) Figure 2.13 Brittleness index c relations with a) peak stress, b) crack damage stress and c) tangent Young s modulus for different rock types. Numbers 1 to 8 refer to the rock type in Table
130 3 Brittleness index, B U-I (unity) Peak stress, q peak (MPa) 8 Y= 0.563e X R 2 = a) 3 Brittleness index, B U-I (unity) Crack damage stress, q cd (MPa) 7 8 Y= 0.581e X R 2 = b) 129
131 3 Brittleness index, B U-I (units) Y= e X R 2 = Tangent Young's modulus, E LVDT (GPa) c) Figure 2.14 Brittleness index j1l relations with a) peak stress, b) crack damage stress and c) tangent Young s modulus for different rock types. Numbers 1 to 8 refer to the rock type in Table
132 3 Brittleness index, B U-II (unity) Y= 0.832e X R 2 = Peak stress, q peak (MPa) a) 3 Brittleness index, B U-II (unity) Y= 0.847e X R 2 = Crack damage stress, q cd (MPa) b) 131
133 3 Brittleness index, B U-II (unity) Y= 0.792e X R 2 = Tangent Young's modulus, E LVDT (GPa) c) Figure 2.15 Brittleness index j1ll relations with a) peak stress, b) crack damage stress and c) tangent Young s modulus for different rock types. Numbers 1 to 8 refer to the rock type in Table
134 3 Brittleness index, B U-III (unity) Y= 0.853e X 6 4 R 2 = Peak stress, q peak (MPa) a) 3 Brittleness index, B U-III (unity) Y= 0.867e X R 2 = Crack damage stress, q cd (MPa) b) 133
135 3 Brittleness index, B U-III (unity) Y= 0.818e X R 2 = Tangent modulus, E LVDT (GPa) c) Figure 2.16 Brittleness index j1lll relations with a) peak stress, b) crack damage stress and c) tangent Young s modulus for different rock types. Numbers 1 to 8 refer to the rock type in Table
136 LIST OF TABLES Table 2.1 Rock types investigated and their physical properties Identification Rock name Rock type Origin Grain size Dry density (g/cm 3 ) Number 1 Tuffeau Limestone France Fine Savonniere Limestone France Fine Hawksbury Sandstone Australia Fine Massangis Limestone France Fine Chassagne Limestone France Fine Harcourt Granite Australia Medium Alvand Granite Iran Medium Rocheron Limestone France Fine
137 Table 2.2 Pre-peak stress-strain quantities for the rocks investigated Rock name Rock type ()*+ (MPa) & (MPa) ()*+ / & IJK (GPa) Tuffeau Limestone Savoniere Limestone Hawksebury Sandstone Massangis Limestone Chassagne Limestone Harcourt Granite Alvand Granite Rocheron Limestone
138 Table 2.3 Pre-peak and post-peak stress-strain quantities for the rocks investigated Rock name Rock type 1'T (x10-4 ) 1) (x10-4 ) (T) (MPa) ) (MPa) ()*+ (MPa) (-UL (MPa) L-L*. (MPa) Tuffeau Limestone Savoniere Limestone Hawksebury Sandstone Massangis Limestone Chassagne Limestone Harcourt Granite Alvand Granite Rocheron Limestone
139 Table 2.4 Brittleness indices for the rocks investigated Rock name Rock type 0 2 c j1l j1ll j1lll Tuffeau Limestone Savoniere Limestone Hawksebury Sandstone Massangis Limestone Chassagne Limestone Harcourt Granite Alvand Granite Rocheron Limestone
140 STATEMENT OF AUTHORSHIP 139
141 ROCK CUTTING CHARACTERISTICS ON SOFT-TO-HARD ROCKS UNDER DIFFERENT CUTTER INCLINATIONS H. Munoz 1, A. Taheri 2, E. Chanda 3 1 Deep Exploration Technologies Cooperative Research Centre DET CRC, Export Park, Adelaide Airport, SA 5950, Australia and School of Civil, Environmental & Mining Engineering, The University of Adelaide, SA 5005, Australia, Ph: , Fax: , henry.munozprincipe@adelaide.edu.au (corresponding author) 2 Senior Lecturer, School of Civil, Environmental & Mining Engineering, The University of Adelaide, SA 5005, Australia, Ph: , Fax: , abbas.taheri@adelaide.edu.au 3 Associate Professor, School of Civil & Environmental & Mining Engineering, The University of Adelaide, SA 5005, Australia, Ph: , Fax: , emmanuel.chanda@adelaide.edu.au KEYWORDS Cutting performance, intrinsic specific energy, back-rake angle, compressive strength INTRODUCTION Rock drilling and cutting is essential in the mining industry. Rock characterisation and classification methods have been proposed to assess drilling or cutting performance (Altindag 2009; Hoseinie et al. 2008; Hoseinie et al. 2009; Kahraman 2003; Yarali and Soyer 2011). However, a generalised method to relate rock characteristics to rock cutting performance has not yet been 140
142 developed. This is due to the complexity of interactions among the variables involved in the cutting process encompassing not only rock properties, but also the nature of cutting. Cost-effective drilling is achievable by allocating the available gross energy towards the cutting action and, at the same time, reducing systematically that energy consumed in frictional processes inherent to tool-rock interactions. A set of optimum drilling parameters (i.e. the optimum weight and torque on the bit) is essential to produce the optimum drilling rate and attain higher efficiency. In this instance, extra energy may be required if the weight and torque on the bit are significantly different from their optimum values making the drilling process less efficient. Several attempts have been made to assess drilling performance by correlating different rock properties with the drilling rate. For instance, rock texture, grain size, Unconfined Compressive Strength (UCS), Mohs hardness and rock mass structural parameters have been used to build a number of drillability indices (Altindag 2003; Altindag 2009; Hoseinie et al. 2008). However, not only rock properties, but also different sets of drilling parameters (weight and torque on the bit) and drilling techniques have an impact on the drilling performance and efficiency of the process as noticed by (Detournay and Defourny 1992; Detournay et al. 2008; Taheri et al. 2016; Teale 1965). Through tool-rock interaction laws, it was found that Specific Energy (}) accounts for both the energy consumed in rock cutting and the energy consumed in friction between the tool and the rock or in mechanical energy losses outside the rock (Detournay and Defourny 1992; Teale 1965). The concept of specific energy (}) in rock drilling was introduced by Teale (Teale 1965) as the work done to excavate a unit volume of rock. In this manner, the cutting response of PDC (Polycrystalline Diamond Compact) bits derives from a combination of two major actions (Detournay and Defourny 1992): i) a pure cutting action and ii) a frictional action due to the cutter wear-flat area. The energy consumed in a pure cutting action of rock is measured by the intrinsic specific energy () attainable at the cutting point (Detournay and Defourny 1992; Detournay et al. 2008; Franca 2010; Franca et al. 2015). The magnitude of the 141
143 intrinsic specific energy depends entirely on the nature of the rock (Detournay and Defourny 1992; Teale 1965), the surrounding pressure on the rock surface (Detournay and Atkinson 2000) and the drilling technique being used (Detournay et al. 2008; Franca 2010; Franca et al. 2015). Quantities of consumed energy higher than the intrinsic specific energy represent the energy consumed by frictional processes. The intrinsic specific energy () quantifies the maximum cutting efficiency associated with the optimum cutting force (Detournay and Defourny 1992; Detournay et al. 2008; Franca 2010; Franca et al. 2015) and it has become useful to estimate rock strength. In this regard, it has been found that approximately equals to Unconfined Compressive Strength (UCS) of rock in drilling experiments with PDC bits (Detournay et al. 2008) and roller-cone bits (Franca 2010). In addition, this finding has been supported by a significant number of cutting tests with a single PDC cutter when the back-rake angle of the cutter (~) is 15 degrees (Richard et al. 2012), see Figure 3.1 for the definition of back-rake angle. A literature survey indicates that there are very few studies on effect of cutting parameters on the intrinsic specific energy value. To investigate the magnitude of the intrinsic specific energy and its relation with the geometry of the cutting and peak strength of rock, cutting experiments with a single PDC were carried out on different rock types at different back-rake angles, i.e. ~ of 15, 30 and 45 degrees. Additionally, the stress-strain parameters of the rocks were obtained by performing a series of uniaxial compressive tests. ROCK CUTTING MECHANISM Rock cutting induces two modes of failure in the rock depending on the depth of cut,, which are plastic yielding and fracture mode of failure (Lin and Zhou 2013; Lin and Zhou 2015; Richard et al. 2012). At relatively shallow depths of cut, plastic yield mode of failure is dominant and material failure is governed by yield strength (i.e. strength-related failure mechanism). On the other hand, when the depth of cut is relatively deep, fracture mode of failure 142
144 dominates and therefore material failure is governed by its fracture properties (i.e. fracture-related failure mechanism). In these instances, UCS and fracture toughness,, become relevant to characterise plastic yield and fracture mode of failure in cutting, respectively. Lin and Zhou (Lin and Zhou 2013; Lin and Zhou 2015) demonstrated that rock cutting is well described by Bazant s size effect law (SEL) for quasibrittle materials, such as concrete and rocks (Bažant 1984). SEL is expressed as a function of the nominal stress =( R U ) ()*+ & and the depth of cut,, where ( U R ) ()*+ is the peak cutting force and & is the cutter width, see Figure 3.1 for the geometry and nomenclature of the cutting test. In the case of rock cutting, they found that linear elastic fracture mechanics (LEFM) is relevant asymptotically to cutting data when cutting is relatively deep. In the present study it is anticipated that the cutting experiments were carried out at depths of cut smaller than 0.5 mm in compliance with plastic yield mode of failure. EXPERIMENTAL STUDY A series of uniaxial compressive tests and cutting tests using a single PDC (Polycrystalline Diamond Compact) cutter were carried out. Uniaxial compressive tests were conducted at The University of Adelaide and cutting tests were performed at the Australian Resource Research Centre (ARRC) CSIRO- Perth facilities. The experimental work details are summarised in Table 3.1. ROCKS INVESTIGATED Rock types including limestone (Tuffeau), sandstone (Mountain Gold, Hawkesbury), phyllite (Brukunga) and basalt (Mantina) were investigated. The rocks were sourced from several mines and quarries in France and Australia. Table 3.2 lists the rocks investigated and their physical and mechanical properties including grain size, uniaxial compressive strength (UCS) and Young s modulus () on average. The rock samples correspond to fine grain size having densities ranging from 1.5 to 2.7 g/cm 3 and uniaxial compressive strengths ranging from 9 to 249 MPa. 143
145 UNIAXIAL COMPRESSIVE TESTS To study the stress-strain characteristics of the rocks under uniaxial compressive tests, in total 26 samples were prepared from coring rock blocks listed in Table 3.2. The diameter of cores was 42 mm and their aspect ratio (the ratio diameter to length) was maintained at 2.4. Visual inspection shows that sample diameters were more than 10 to 20 times bigger than rock grains size. Each rock was tested at least three times and consistent results were obtained from UCS tests on each rock. Axial and lateral deformations induced by axial load on the rock samples were measured locally by either: i) a pair of axial and lateral strain gauges (FLA and FLA manufactured by Tokyo Sokki Kenkyujo Co.) attached directly to the surface of the rocks in axial and lateral directions, respectively, or ii) direct-contact axial and lateral extensometers (632.12F20-series manufactured by MTS Systems Co.). In addition, the axial deformation was measured externally by a pair of LVDTs (Linear variable displacement transducers). Local measurement devices are free from bedding errors (Taheri and Tani 2008) and therefore, in this study, local axial and lateral deformations measured were used. Axial deformation feedback signal was used to control the axial loading keeping a constant axial deformation rate equal to 0.04 mm/min. For this purpose, a closed-loop servo-controlled loading machine stiff enough to allow the elastic energy not to accumulate in the testing machine was used. The testing machine has a loading capacity of 1000 kn. In all the tests, no additional frictionreducing layers in contact between the specimens and the loading platen were used. In this case, the platen was in direct contact with the specimens. CUTTING TESTS WITH A SINGLE PDC In total 45 PDC cutting tests were carried out on the rocks to investigate the magnitude of the intrinsic specific energy,. The tests were conducted following a standard practice suggested by Richard et al. (Richard et al. 2012). The cutting device used in this experiment was manufactured by Epslog SA. 144
146 This machine is equipped with a load sensor having a loading capacity of 3000 N with ±1 N of sensitivity which measures the tangential ( R U ) and normal ( R ƒ ) components of the cutting force acting on the cutter (see Figure 3.1). The cutting machine is controlled by a computer program and the data is stored into a computer by a data acquisition system. A consistent cut was applied to the lateral surface of the rock samples by means of a rectangular cutter (sharp cutter) of width & equal to 10 mm. In the tests, the cutter ran along a length about 10 cm under a prescribed constant velocity of 4 mm/s and at constant depth of cut,. The depth of cut in the tests varied from 0.1 to 0.5 mm with steps of constant increments of 0.1 mm, in general. The surface of the rocks was carefully prepared by preliminary cuts to achieve an even and smooth surface prior to setting the prescribed depth of cut and start the test. By doing so, it was assured the formation of a groove having constant cross-section area (i.e. constant & ) at constant in each test. Each cutting run was performed strictly over a fresh surface on the rock. Furthermore, the formation of a deep U-type groove due to successive cuts over a same spot was not allowed, so the effect of sidewall friction (cutter-groove), that may cause an additional increase in values, e.g. (Richard et al. 2010), was eliminated. To investigate the influence of increasing the inclination of the backrake angle ~ of the cutter in the magnitude of the intrinsic specific energy, the cutting tests were performed at three different back-rake angles of 15, 30 and 45 degrees. TEST RESULTS AND DISCUSSION ROCK STRENGTH CHARACTERISTICS The failure pattern of the rock samples at the end of the compressive tests consisted predominantly of a single-shear plane, although additional minor axial cracks also were noticed in the specimens. In pre-peak regime, the threshold stresses for fracture damage associated with crack closure ( && ), crack initiation ( &' ), crack damage ( & ) and peak stress ( ()*+ ) were identified from the typical 145
147 stress-strain curves in accordance with Martin and Chandler (Martin and Chandler 1994). Young s modulus () of the rocks were extracted from the linear-elastic portion of the stress-strain curves limited by && and &'. The linear elastic behaviour of the rocks was considered to take place after the end of an initial loading stage where existing micro-cracks in the samples, if any, are closed. Table 3.2 summarises the average values of ()*+ (i.e. UCS) and Young s moduli of the rocks. INTRINSIC SPECIFIC ENERGY FROM PDC CUTTING Figure 3.2 depicts a sample of the cutting force histories at a prescribed depth of cut of 0.2 mm on a Mantina basalt. In this figure, cutting force versus cutter advancement for three different cutting conditions, i.e. at different backrake angles of 15, 30 and 30 degrees, are presented. The shallow cut history shows a relatively smaller amplitude oscillation in front of the cutter. The intrinsic specific energy,, then can be obtained using the following expression (Richard et al. 2012): = R U & (1) R Where, U represents the average force on steady cutting conditions,, is the depth of the cut and &, represents the cutter width ( & of 10 mm). The cutting response of the PDC cutter on the intact rocks was characterised by a R R linear scaling regime between U and or U and &, as shown in Figure 3.3 and Figure 3.4. Figure 3.3 shows the summary results for the case when the rocks are cut by the cutter positioned at a back-rake angle of 15 degrees. The plots between R U and show in general non-zero intercepts of the linear fitting. This behaviour may be associated to the presence of friction caused by cutter wear as explained by Zhou and Lin (Zhou and Lin 2013). Figure 3.4 shows the plots R between or U and & for the rocks that were cut by the cutter positioned at back-rake angles of 15, 30 and 45 degrees. Again, these plots show in general non-zero intercepts of the linear fitting and it seems that the intercept of cutting 146
148 force was reduced in the case when the back-rake angle was 30 or 45 degrees. Therefore, the amount of friction decreases with an increase in rake angle. Table 3.3 summaries the values of intrinsic specific energy which were obtained from the slope of the linear fitting in R U & plot showed in Figure 3.4. For the case of rocks cut at a back-rake angle of 15 degrees, the magnitude of varied from 9 to 220 J/cm 3 which is in good agreement with the magnitude of UCS of the rocks. This result is supporting previous findings by other researchers, e.g. (Richard et al. 2010; Richard et al. 2012) as shown in Figure 3.5 by a linear correlation. Figure 3.6 shows that the intrinsic specific energy values increase by a factor from about 1.2 to 1.7 and 1.9 to 2.3 times, on average, when the back-rake angle of the cutter is increased to 30 and 45 degrees, respectively, in contrast to the case when rocks are cut at 15 degrees back-rake angle (see Table 3.3). In this case exceeds UCS values. CONCLUSIONS A series of cutting tests using a single PDC (Polycrystalline Diamond Compact) cutter at three different back-rake angles and uniaxial compressive tests were carried out on different rock types including limestone, sandstones, phyllite and basalt to quantify the intrinsic specific energy and strain energy. The experiment results show that, in general, the magnitude of intrinsic specific energy, i.e. the energy to cut unit volume of rock, is increased as the inclination of the cutter increases from 15 to 30 and 45 degrees, i.e. the back-rake angle, from 15 to 30 and 45 degrees, leads to a higher demand of the energy to cut the same amount of rock. The intrinsic specific energy from PDC was found to correlate well with the UCS of rock when the back-rake angle of the cutting is 15 degrees. 147
149 ACKNOWLEDGEMENT The work has been supported by the Deep Exploration Technologies Cooperative Research Centre whose activities are funded by the Australian Government's Cooperative Research Centre Programme. This is DET CRC Document 2016/825. REFERENCES Altindag R (2003) Correlation of specific energy with rock brittleness concepts on rock cutting Journal of the South African Institute of Mining and Metallurgy 103: Altindag R (2009) Assessment of some brittleness indexes in rock-drilling efficiency Rock Mechanics and Rock Engineering 43: doi: /s x Bažant Z (1984) Size Effect in Blunt Fracture: Concrete, Rock, Metal Journal of Engineering Mechanics 110: doi:doi: /(asce) (1984)110:4(518) Detournay E, Atkinson C (2000) Influence of pore pressure on the drilling response in low-permeability shear-dilatant rocks International Journal of Rock Mechanics and Mining Sciences 37: doi: Detournay E, Defourny P (1992) A phenomenological model for the drilling action of drag bits International journal of rock mechanics and mining sciences & geomechanics abstracts 29:13-23 doi: / (92) Detournay E, Richard T, Shepherd M (2008) Drilling response of drag bits: Theory and experiment International Journal of Rock Mechanics and Mining Sciences 45: doi: /j.ijrmms Franca LFP (2010) Drilling Action of Roller-Cone Bits: Modeling and Experimental Validation Journal of Energy Resources Technology 132: doi: /
150 Franca LFP, Mostofi M, Richard T (2015) Interface laws for impregnated diamond tools for a given state of wear International Journal of Rock Mechanics and Mining Sciences 73: doi: Hoseinie SH, Aghababaei H, Pourrahimian Y (2008) Development of a new classification system for assessing of rock mass drillability index (RDi) International Journal of Rock Mechanics and Mining Sciences 45:1-10 doi: /j.ijrmms Hoseinie SH, Ataei M, Osanloo M (2009) A new classification system for evaluating rock penetrability International Journal of Rock Mechanics and Mining Sciences 46: doi: /j.ijrmms Kahraman s (2003) Performance analysis of drilling machines using rock modulus ratio The Journal of The South African Institute of Mining and Metallurgy 108: Lin J-S, Zhou Y (2013) Can scratch tests give fracture toughness? Engineering Fracture Mechanics 109: doi: /j.engfracmech Lin J-S, Zhou Y (2015) Rebuttal: Shallow wide groove scratch tests do not give fracture toughness Engineering Fracture Mechanics 133: doi: Martin C, Chandler N The progressive fracture of Lac du Bonnet granite. In: International Journal of Rock Mechanics and Mining Sciences & Geomechanics Abstracts, vol 6. Elsevier, pp Richard T, Coudyzer C, Desmentte S (2010) Influence of groove geometry and cutter inclination in rock cutting. Paper presented at the 44th US Rock Mechanics Symposium and 5th U.S.-Canada Rock Mechanics Symposium, Salt Lake City, UT, USA, Richard T, Dagrain F, Poyol E, Detournay E (2012) Rock strength determination from scratch tests Engineering Geology : doi: /j.enggeo
151 Taheri A, Qao Q, Chanda E (2016) Drilling Penetration Rate Estimation using Rock Drillability Characterization Index Journal of The Institution of Engineers (India): Series D:1-12 doi: /s Taheri A, Tani K (2008) Use of down-hole triaxial apparatus to estimate the mechanical properties of heterogeneous mudstone International Journal of Rock Mechanics and Mining Sciences 45: doi: Teale R (1965) The concept of specific energy in rock drilling Int J Rock Mech Mining Sc 2:57-73 Yarali O, Soyer E (2011) The effect of mechanical rock properties and brittleness on drillability Scientific Research and Essays 6: Zhou Y, Lin J-S (2013) On the critical failure mode transition depth for rock cutting International Journal of Rock Mechanics and Mining Sciences 62: doi: 150

152 LIST OF FIGURES Figure 3.1 PDC cutting test at shallow depth of cut 151
153 Mantina basalt F C s (average) Back-rake angle F C s (N) 1000 θ= 45 o θ= 15 o θ= 30 o 500 Steady-state cutting Cutter advance (mm) Figure 3.2 Cutting force, U R, versus cutting advancement along the rock surface for Mantina basalt at a prescribed depth of cut of 0.2 mm 152
154 Mountain Gold UCS= 35 F C s (N) ε= ε= 9 J/cm 3 Tuffeau UCS= 9 MPa d (mm) 1000 Mantina UCS= 249 MPa F C s (N) 500 ε= 221 J/cm 3 Brukunga UCS= 103 Hawksbury UCS= 45 ε= 88 ε= d (mm) Figure 3.3 a) Cutting force, U R, versus depth of cut,, for the rocks investigated and respective intrinsic specific energy values 153
155 100 Tuffeau limestone θ= 45 o, ε= 19 θ= 30 o, ε= 11 F C s (N) 50 1 ε θ= 15 o, ε= w c d (mm 2 ) a) 400 θ= 45 o, ε= 97 F C s (N) 200 θ= 30 o, ε= 57 θ= 15 o, ε= 42 Hawkesbury sandstone w c d (mm 2 ) b) 154
156 1000 θ= 45 o, ε= 205 θ= 30 o, ε= 151 F C s (N) 500 θ= 15 o, ε= 88 Brukunga phylite w c d (mm 2 ) c) 1200 θ= 45 o, ε= 495 θ= 15 o, ε= 221 F C s (N) 600 θ= 30 o, ε= 314 Mantina basalt w c d (mm 2 ) d) Figure 3.4 Cutting force, U R, versus constant cross-section area & for different back-rake angles for the rocks investigated 155
157 300 y= x Intrinsic Specific Energy, ε (J/cm 3 ) Literature q peak (MPa) This study y= 0.882x R 2 = Figure 3.5 Intrinsic specific energy for a back-rake angle of 15 degrees versus unconfined compressive strength 156
158 Intrinsic Specific Energy (J/cm 3 ) Mantina Brukunga Hawksbury Mountain Gold Tuffeau Back-rake Angle (degrees) Figure 3.6 Intrinsic specific energy relation with the back-rake angle for the rocks investigated 157
159 LIST OF TABLES Table 3.1 Experimental program Test type Rock name Rock type Rock source Number of tests Total tests Tuffeau Limestone France 15 PDC Cutting Mountain Gold Sandstone Australia 15 Hawksbury Sandstone Australia Brukunga Phyllite Australia 15 Mantina Basalt Australia 15 Compressive All above All above France, 3, 4 or 5 26 loading Australia per rock 158
160 Table 3.2 List of rock types investigated and their physical and mechanical properties Rock name Rock type Number of UCS tests Grain size Dry density (g/cm 3 ) Young s modulus (GPa) UCS (MPa) Tuffeau Limestone 4 Fine Mountain Gold Sandstone 4 Fine Hawksbury Sandstone 5 Fine Brukunga Phyllite 5 Fine Mantina Basalt 5 Fine
161 Table 3.3 List of rock types investigated and their Intrinsic Specific Energy Intrinsic specific energy () (J/cm 3 ) Rock name Rock type PDC cutter ~ = 15 degrees ~= 30 degrees ~= 45 degrees Tuffeau Limestone Mountain Gold Sandstone Hawksbury Sandstone Brukunga Phyllite Mantina Basalt
162 STATEMENT OF AUTHORSHIP 161
163 ROCK DRILLING PERFORMANCE EVALUATION BY AN ENERGY DISSIPATION BASED ROCK BRITTLENESS INDEX H. Munoz 1, A. Taheri 2, E. K. Chanda 3 1 Deep Exploration Technologies Cooperative Research Centre DET CRC, Export Park, Adelaide Airport, SA 5950, Australia, and School of Civil, Environmental & Mining Engineering, The University of Adelaide, SA 5005, Australia, Ph: , Fax: , henry.munozprincipe@adelaide.edu.au (corresponding author) 2 Senior Lecturer, School of Civil, Environmental & Mining Engineering, The University of Adelaide, SA 5005, Australia, Ph: , Fax: , abbas.taheri@adelaide.edu.au 3 Associate Professor, School of Civil & Environmental & Mining Engineering, The University of Adelaide, SA 5005, Australia, Ph: , Fax: , emmanuel.chanda@adelaide.edu.au ABSTRACT In order to reliably estimate drilling performance both tool-rock interaction laws along with a proper rock brittleness index are required to be implemented. In this study the performance of a single PDC (Polycrystalline Diamond Compact) cutter cutting and different drilling methods including PDC rotary drilling, roller-cone rotary drilling and percussive drilling were investigated. To investigate drilling performance by rock strength properties, laboratory PDC cutting tests were performed on different rocks to obtain cutting parameters. In addition, results of laboratory and field drilling on different rocks found elsewhere in literature were used. Laboratory and field cutting and drilling 162
164 test results were coupled with values of a new rock brittleness index proposed herein and developed based on energy dissipation withdrawn from the complete stress-strain curve in uniaxial compression. To quantify cutting and drilling performance, the intrinsic specific energy in rotary-cutting action, i.e. the energy consumed in pure cutting action, and drilling penetration rate values in percussive action were used. The results show that the new energy-based brittleness index successfully describes the performance of different cutting and drilling methods and therefore is relevant to assess drilling performance for engineering applications. KEYWORDS Brittleness index, uniaxial compression, energy dissipation, cutting performance, drilling performance INTRODUCTION Rock drilling is an essential task in mining engineering and deep exploration industry. In this sense, drilling performance is one of the most important parameters to take into account when evaluating project feasibility and economy. Equipment type and specifications is strongly dependent on predicting the performance of the cutting tool in the field. In this sense, several attempts have been made to assess drilling performance by correlating different rock mechanical and physical properties with the drilling penetration rate. For instance, unconfined compressive strength (UCS) has been determined as the dominant rock property in penetration rate prediction for rotary drills (Kahraman 1999) and among rock properties, uniaxial compressive strength, Brazilian tensile strength, point load strength and Schmidt hammer value have been determined as the dominant rock properties affecting the penetration rate of percussive drills (Kahraman et al. 2003). In this same manner, force-indentation curves of indentation tests have been deemed relevant develop a drillability index for the prediction of penetration rates of rotary blast-hole drills and rock formations mechanical and physical properties (Kahraman et al. 2000). Furthermore, rock texture, grain size, density, P-wave velocity, unconfined 163
165 compressive strength, Mohs hardness and rock mass structural parameters have been used to build a number of drillability indices (Altindag 2003; Altindag 2009; Hoseinie et al. 2008; Taheri et al. 2016). A generalised method to relate drilling performance with rock strength characteristics has not been developed yet. This is due to the complexity of interactions among the variables involved in the drilling process encompassing not only rock properties, but also the nature of drilling. Therefore, not only rock properties, but also different sets of drilling forces acting on rock as well as drilling method all have impacts on the drilling performance (Detournay and Defourny 1992; Detournay et al. 2008; Franca 2010; Franca 2011; Franca et al. 2015; Hustrulid and Fairhurst 1971b; Teale 1965). In this view, by coupling relevant drilling parameters with relevant rock properties, a reliable drilling performance prediction method can be developed. On one hand, to predict rock drilling performance and optimisation of drilling operation, tool-rock interaction laws, i.e. the relations between forces acting on the tool in contact with rock, are essential (Detournay and Defourny 1992; Detournay et al. 2008; Franca 2010; Franca 2011; Franca et al. 2015; Hustrulid and Fairhurst 1971a; Hustrulid and Fairhurst 1972a; Hustrulid and Fairhurst 1971b; Hustrulid and Fairhurst 1972b). For instance, through tool-rock interaction laws, it was found that during rotary drilling, the Specific Energy (}), the work done to excavate a unit volume of rock (Teale 1965), accounts for both energy consumed in rock cutting and energy consumed in friction between the tool and the rock (Detournay and Defourny 1992; Teale 1965). In this instance, the energy consumed in pure cutting action of rock is measured by the intrinsic specific energy () attainable at the cutting point (Detournay and Defourny 1992; Detournay et al. 2008; Franca 2010; Franca et al. 2015). The intrinsic specific energy quantifies the maximum cutting efficiency associated with the optimum cutting force and its magnitude depends on the nature of the rock (Detournay and Defourny 1992; Teale 1965), the surrounding pressure on the rock (Detournay and Atkinson 2000) and the drilling technique being used (Detournay et al. 2008; Franca 2010; Franca et al. 2015). In the case of 164
166 percussive drilling, tool-rock interactions are focused mostly in the prediction of the penetration rate and the optimum thrust. Experimental results with wedgeshaped cutter percussive bits show that tool-rock interaction can be simulated by linear relationships in an idealised force penetration curve for percussive action and percussive penetration rate (Franca 2011; Hustrulid and Fairhurst 1971a; Hustrulid and Fairhurst 1972a; Hustrulid and Fairhurst 1971b; Hustrulid and Fairhurst 1972b). On the other hand, rock brittleness is a concept yet to be investigated as there is not a unique criterion able to describe rock brittleness quantitatively nor consensus about the most suitable and reliable brittleness index to apply to different rock engineering works encountered in the field. For instance, previously a number of different criteria to assess rock brittleness have been developed upon pre-peak stress-strain characteristics in uniaxial compression experiments including ratios between elastic to plastic strain (Hucka and Das 1974) as well as strain-energy relations (Hucka and Das 1974; Kidybiński 1981). However, those criteria are insufficient in order to describe unambiguously a scale of brittleness to ductility of rock (Munoz et al. 2016; Tarasov and Potvin 2013; Tarasov and Randolph 2011). In the same manner, some brittleness indices which are defined upon rock compressive strength, UCS, and tensile strength, TS, (Altindag 2002; Hucka and Das 1974; Kahraman 2002), cannot describe a scale of brittleness to ductility of rock (Tarasov and Potvin 2013). This is mainly because, rock failure behaviour cannot be described by a ratio between compressive and tensile strength and, generally, compressive and tensile strength can be obtained from each other. In addition, those brittleness indices cannot correlate well with the rock compressive strength. Figure 4.1 shows uniaxial compressive-to-tensile-strength brittleness indices defined as 0 (Altindag 2002), 2 (Hucka and Das 1974) and c (Altindag 2002), see expressions below, plotted against the respective rock uniaxial compressive strength values. In this figure, data found in the literature elsewhere (Howarth 1987; Paone et al. 1969; Schmidt 1972; Selim and Bruce 1970) is plotted. 165
167 0 = jr K 2 = jr 1K jr ik (1) (2) c = jr K 2 [MPaxMPa] (3) As it may be seen in Figure 4.1, in general, brittleness indices, 0 and 2 are not able to describe a scale of brittleness with rock compressive strength increasing, i.e. a soft rock may have the same brittleness 0 and 2 as a hard rock. Thus, if 0 and 2 are used to assess drilling performance of either rotary or percussive drilling, it can be expected to obtained no sound relationships between 0 and 2 and drilling parameters for instance the drilling penetration rate, as demonstrated in previous studies (Altindag 2009; Altindag 2010). Although c shows a better correlation with the drilling penetration rate (Altindag 2009; Altindag 2010), the foundation of brittleness c gives conflicting results to describe rock brittle to ductile scale (Tarasov and Potvin 2013). The discussion presented above, demonstrated that in order to predict drilling performance successfully, firstly tool-rock interaction laws should be implemented to quantify drilling. In this respect, it was found that there are very few studies that consider tool-rock interaction to characterise drilling performance. Secondly, a proper brittleness index is required to describe rock failure characteristics in drilling. As a result, the present study aims at evaluating drilling performance by taking into account both the drilling response from toolrock interaction laws and by defining a new energy-based rock brittleness index that considers rock failure behaviour which is able to describe an ambiguous brittleness scale from ductile to brittle. In this study, the performance of two major mechanical drilling methods, namely rotary drilling and percussive drilling, are investigated against rock brittleness capacity by the new energy-based brittleness index. The intrinsic specific energy and rate of penetration, as two main drilling performance 166
168 parameters, were coupled with rock brittleness. To validate this proposal, cutting experiments with a single PDC cutter were carried out on different rock types. In addition, independent rotary drilling as well as percussive drilling results from laboratory and field tests from the literature were used. NEW ENERGY-BASED BRITTLENESS INDEX A recently developed brittleness index by Munoz et al. (Munoz et al. 2016) upon fracture strain-energy quantities withdrawn from the area under complete stress-strain curve of rocks in uniaxial compressive tests is proposed herein to study drilling performance by rock brittleness capacity. This brittleness index takes into account post-peak instability in uniaxial compression as postpeak instability of rock during compression can be treated as a manifestation of rock brittleness (Tarasov and Randolph 2011). That is, an increase in the postpeak energy indicates an increase of stability (i.e. a decrease in brittleness). In the same manner, a dramatic decrease of post-peak energy indicates less stability of the failure process (i.e. an increase in brittleness). Pre-peak and post-peak energy relations are the basis of the proposed brittleness index. Pre-peak energy is considered to dissipate due to micro cracking during the loading process up to the peak (Daniel C. Jansen and Edwin 1995; Jansen and Shah 1997). On the other hand, energy dissipated in post-peak regime represents that energy dissipated during coalescence of micro fractures initiated before peak stress and energy dissipated in the localised zone (i.e. the damaged zone), which encompasses deformations associated with the formation and coalescence of distributed longitudinal cracks and deformations at the localised zone (Bažant 1989; Jansen and Shah 1997; Markeset and Hillerborg 1995). In this framework, the total fracture energy ( L-L*. ) comprises of pre-peak energy ( (T) ) and postpeak energy ( (T) ) and it is expressed by the following expression: L-L*. = (T) + (-UL (4) Pre-peak energy per unit volume of rock is estimated to be the area under the stress-strain curve enclosed by loading the specimen up to the peak stress 167
169 and then unloading it completely. The unloading path was assumed to be linear having a slope equal to HVWX (i.e. the tangent Young s modulus measured by external LVDTs) as shown in Figure 4.2a. On the other hand, post-peak energy was calculated taking into account the area under the post-peak stress-inelastic strain. That is, the area under the unloaded pre-peak stress-strain curve (assuming that unloading curve s Young s modulus, Eun, is equal to loading curve s Young s modulus, ELVDT) and under the post-peak stress-inelastic strain as shown in Figure 4.2a. Herein, the post-peak fracture energy was defined until a post-peak stress level equal to about one third of the peak stress, i.e ()*+, a stress level where the stress-strain curve is terminated by drawing a linear unloading following a slope equal to HVWX (Daniel C. Jansen and Edwin 1995; Jansen and Shah 1997). In addition, an elastic energy ( ) ) at the peak stress was calculated by the following equation (see Figure 4.2b for the notation of ) ). ) = jr ^ 24 _`ab (5) Different rock types, sourced from different quarries in France, Australia and Iran, including five limestones, a sandstone and two granites, which are presented in Table 4.1 (UCS is ranging between 7 to 215 MPa), were tested in order to obtain the energies quantities involved during compression in a series of uniaxial compressive tests under quasi-static monotonic loading conditions. The compressive tests complied with the application of a prescribed constant lateral strain-rate of 2x10⁻⁶ /s as a feedback signal to control the axial load which was found to be a suitable loading rate to measure the complete stress-strain response for the rocks presented in Table 4.1 as shown in Figure 4.2c. Figure 4.2d shows the relationship of energies quantities L-L*. and ) with the respective UCS of the studied rocks. This figure shows that ) clearly increases in a linear fashion with an increase in UCS. The total energy L-L*., however, increases first and then decreased as UCS increases. This trend complies with low energy enclosed in the stress-strain curve of rocks with higher strength that behave following class I-II or class II behaviour as shown in Figure 4.2c. To 168
170 quantify failure characteristics of different rocks, the following energy-based brittleness index is proposed; j1l = j [ j mnm\o (6) As can be seen in Figure 4.3, unlike a number of brittleness indices including 0, 2 and c proposed in previous studies (Altindag 2009; Altindag 2010), the proposed brittleness index j1l is able to describe properly a monotonic and unambiguous scale of brittleness and brittleness relations with increasing rock strength (i.e. UCS). Furthermore, brittleness index j1l describes a monotonic and unambiguous scale of brittleness with increasing prepeak strength parameters such as crack damage strength and tangent Young s modulus of rock. This outcome becomes relevant in order to better understand material brittleness associated with the progressive fracture process characterised by the typical threshold damage stresses and the elasticity parameters. The brittleness index j1l scale indicates that a higher brittleness index means that rock is more brittle which corresponds to higher strength rocks. From Figure 4.3 a non-linear relationship having a coefficient of correlation, k 2, of between the brittleness index j1l and UCS can be established by the following expression: j1l =0.563 M.MMstjR (7) The expression above is used to calculate brittleness index of different rocks investigated in this study from their UCS values. PDC CUTTING PERFORMANCE CUTTING EXPERIMENTS CONDUCTED IN THE PRESENT STUDY Rock cutting induces either plastic yielding or fracture mode of failure in the rock depending on the depth of cut,, (Lin and Zhou 2013; Lin and Zhou 2015; Richard et al. 2012). This is, at relatively shallow depths of cut, plastic yield mode of failure is dominant and material failure is governed by yield strength (i.e. strength-related failure mechanism). On the other hand, when the 169
171 depth of cut is relatively deep, fracture mode of failure dominates and therefore material failure is governed by its fracture properties (i.e. fracture-related failure mechanism). In these instances, unconfined compressive strength, UCS, and fracture toughness,, become relevant to characterise plastic yield and fracture mode of failure in cutting, respectively. Lin and Zhou (Lin and Zhou 2013; Lin and Zhou 2015) demonstrated that rock cutting is well described by Bazant s size effect law (SEL) for quasi-brittle materials, such as concrete and rocks (Bažant 1984). SEL is expressed as a function of the nominal stress = ( R U ) ()*+ & and the depth of cut,, where ( R U ) ()*+ is the peak cutting force and & is the cutter width, see Figure 4.4 for the geometry and nomenclature of the cutting test. In this view, a series of cutting experiments using a single PDC (Polycrystalline Diamond Compact) cutter under steady cutting conditions were carried out at depths of cut smaller than 0.5 mm in compliance with plastic yield mode of failure. In doing so, as shown in Table 2.2, different rock types (UCS is ranging from 9 to 249 MPa) including a limestone (i.e. Tuffeau), three sandstones (i.e. Castlegate, Mountain Gold and Hawkesbury), a phyllite (i.e. Brukunga) and a basalt (i.e. Mantina), which were sourced from several mines and quarries in France and Australia, were used. The cutting tests were performed at the Australian Resource Research Centre (ARRC), CSIRO-Perth facilities. The cutting tests were conducted following a standard practice suggested in a previous research (Richard et al. 2012). The cutting device used in the experiment (manufactured by Epslog SA) is equipped with a load sensor which measures the tangential ( U R ) and normal ( ƒ R ) components of the cutting force acting on the cutter (see Figure 4.4). The cutting machine is controlled by a computer program and the data is stored into a computer by a data acquisition system. A consistent cut was applied to the surface of the rock samples by means of a rectangular cutter (i.e. a sharp cutter) of width & equal to 10 mm. In the tests, the cutter ran along a length of 10 cm under a prescribed constant velocity 170
172 of 4 mm/s and at a constant depth of cut,. The rocks were cut at a back-rake angle ~ of 15 degrees in all the tests. The depth of cut,, in the tests varied from 0.1 to 0.5 mm with steps of constant increments of 0.1 mm, in general. The surface of the rocks was carefully prepared by preliminary cuts to achieve an even and smooth surface prior to setting the prescribed depth of cut and start the cutting test. By doing so, it was assured the formation of a groove having constant cross-section area (i.e. a constant & ) at constant in each test. Each cutting run was performed strictly over a fresh surface on the rock. Furthermore, the formation of a deep U-type groove due to successive cuts over a same spot was not allowed, so the effect of sidewall friction (cutter-groove), that may cause an additional increase in the intrinsic specific energy spent in cutting the rock () was eliminated (Richard et al. 2010). INTRINSIC SPECIFIC ENERGY FROM PDC CUTTING The intrinsic specific energy,, from PDC cutting can be obtained using the following expression (Richard et al. 2012): = R U & (8) R Where, U represents the average force on steady cutting conditions,, is the depth of the cut and &, represents the cutter width ( & of 10 mm). The cutting response of the PDC cutter on the intact rocks presented in R Table 4.2 was characterised by a linear scaling regime between U and, as R shown in Figure 4.5a. The plot between U and shows non-zero intercepts in all the tests. This behaviour may be associated to the presence of friction caused by cutter wear (Zhou and Lin 2013). Table 4.2 summaries the values of intrinsic specific energy () which were obtained from the slope of the linear fitting in the R U & plot. The values of varied from 9 to 220 J/cm 3 for the rocks in Table 4.2 and they are in good agreement with the magnitude of the UCS of their respective rocks. This result is supporting previous findings by other researchers (Richard et al. 2010; Richard et al. 2012) where the intrinsic specific energy increases with an increase in compressive strength. Rock failure governed by 171
173 plastic yield mode (i.e. strength-related failure mechanism) is demonstrated in Figure 4.5b through Bazant s size effect law (SEL) where cutting data at relatively shallow depths of cut, in this case smaller than 0.5 mm, falls into plastic yielding region. INTRINSIC SPECIFIC ENERGY AND BRITTLENESS INDEX Figure 4.6 shows the relationship between the intrinsic specific energy () from the cutting tests and the brittleness index j1l. The values of j1l were calculated for the rocks from their respective UCS values as summarised in Table 4.2 (see the values of UCS and j1l in Table 4.2). From this figure, a strong correlation between the intrinsic specific energy and the proposed energybased brittleness index was found. That is, a correlation coefficient k 2 of was yielded by a logarithmic fitting in the form of =158 ( l1j )+90. In Figure 4.6, the intrinsic specific energy, which increases with an increase in compressive strength, obviously shows an increasing trend in a nonlinear fashion with increasing j1l as high strength rocks show a higher brittleness capacity by higher j1l values. ROTARY DRILLING PERFORMANCE DRILLING EXPERIMENTS FROM LITERATURE Independent drilling data found elsewhere in the literature was used to study the relationship between the intrinsic specific energy in drilling with the proposed brittleness index j1l. In doing so, small-diameter PDC rotary drilling tests at atmospheric pressure (Stavropoulou 2006) on three marble rocks (i.e. Gioia, Cervaiole and Dionysios) were re-examined to calculate the values of intrinsic specific energy and brittleness index, j1l. Table 4.3 lists these rocks and their respective strength parameters. In this case, the small-diameter drilling experiments were conducted using a PDC bit with a diameter of 5 mm with a clearance angle 10 degrees. The back-rake angle ~ in the tests was equal to 30 degrees. 172
174 In addition, rotary drilling experiments at atmospheric pressure with roller-cone bits (Franca 2010) on two limestones (i.e. Tuffeau and Savonniere) and two sandstones (i.e. Castlegate and Mountain Gold) were re-examined to withdraw the values of intrinsic specific energy from the drilling performance and brittleness index j1l from rock compressive strength, respectively. Table 4.4 lists these rocks and their respective strength parameters. In this table, the tensile strength (TS) values for Tuffeau, Savonniere, Castlegate and Mountain Gold were obtained after conducting a series of Brazil tests (Suggested methods for determining tensile strength of rock materials 1978) as part of the present study. The drilling experiments in this case were conducted with an in-house designed drilling rig having a bit assembly consisting of a roller-cone bit (i.e. an insert bit IADC 531 of 2 1/2 and non-insert bit IADC 321 of 2 15/16), a shaft, and a sophisticated anvil. Finally, additional rotary drilling experiments of roller-cone bits conducted on a sandstone (i.e. Kimachi), an andesite (i.e. Shinkomatsu), and a granite (i.e. Sori (A)) reported by Karasawa et al. (Karasawa et al. 2002a; Karasawa et al. 2002b) presented in Table 4.4 were also re-examined. In this case, all the drilling tests were performed at atmospheric pressure using milledtooth bits (i.e. IADC 221S of 98.4 mm) and insert-tooth bits (i.e. IADC 537X of mm). Franca (Franca 2010) reports the details and analysis of the experimental data obtained by Karasawa et al. (Karasawa et al. 2002a; Karasawa et al. 2002b) on the drilling response to obtain the respective intrinsic specific energy. INTRINSIC SPECIFIC ENERGY FROM ROTARY DRILLING The cutting response of PDC (Polycrystalline Diamond Compact) bits, used in a rotary drilling, derives from a combination of two major actions (Detournay and Defourny 1992): i) a pure cutting action and ii) a frictional action due to the cutter wear-flat area. The energy consumed in a pure cutting action of rock is measured by the intrinsic specific energy () attainable at the cutting point (Detournay and Defourny 1992; Detournay et al. 2008; Franca 2010; Franca et al. 2015). In this instance, drilling efficiency is increased when the energy 173
175 consumed by the frictional forces are minimised at the optimum weight and torque on the bit to produce the optimum depth of cut. Quantities of consumed energy higher than the intrinsic specific energy represent the energy consumed by frictional processes. The drilling response of PDC drag bits is characterised by a linear relation between weight, torque on the bit and depth of cut per revolution (Detournay and Defourny 1992; Detournay et al. 2008). Then, the PDC bit response in terms of the Specific Energy is given by the following expression: }= L =(1 ˆ (~+ ))+ Š (9) Where } is the specific energy, and are the normalised weight and torque on the bit, respectively, is the depth of cut per revolution, is the coefficient of friction in the wear flat area of a blunt cutter of the bit, and is the intrinsic specific energy. Following this approach, the values of intrinsic specific energy for the marble rocks undergoing the small-diameter rotary drilling action in Table 4.3 were calculated. From Table 4.3, it can be seen that the values of intrinsic specific energy varied from 88 to 125 MPa and are in reasonable agreement with the respective values of UCS of the rocks. This result is supporting previous findings by others (Detournay and Defourny 1992; Detournay et al. 2008) showing that the magnitude of intrinsic specific energy is very similar to the UCS. The drilling action of roller-cone bits can be considered as a combination of two distinct processes: indentation and cutting actions (Franca 2010). In the case of rotary drilling with roller-cone bits, bit-rock interaction laws are based on the approach initially developed for PDC drag bits as explained above. In this framework, energy dissipation at the bit-rock interaction can be considered as a combination of three independent processes: pure cutting action, pure indentation action, and frictional contact along the wear flat rock interface (Franca 2010), then the drilling response in this cases is given in terms of the Specific Energy presented as follows: 174
176 }= L =(1 )+ Š (10) Where is a number that characterises the ratio of the cutting-indentation strength to the intrinsic specific energy. Following this approach, Table 4.4 summarises the intrinsic specific energy values for the limestone and sandstone rocks undergoing roller-cone drilling action obtained by Franca (Franca 2010). In addition, this table includes the intrinsic specific energy values obtained from the experimental data reported by Karasawa et al. (Karasawa et al. 2002a; Karasawa et al. 2002b) on Kimachi sandstone, Shinkomatsu andesite, and Sori (A) granite analysed and reported by Franca (Franca 2010). These results are also included in Table 4.4. From Table 4.4, it can be seen that the values of intrinsic specific energy for these different rock types varied from 14 to 168 MPa and they have values very similar in magnitude to the UCS of their respective rocks. INTRINSIC SPECIFIC ENERGY AND BRITTLENESS INDEX Analysis on the correlations of the intrinsic specific energy and other brittleness indices previously proposed to study the drilling performance including 0, 2 and c, extracted from the data set (i.e. from UCS and TS) presented in Table 4.3 and Table 4.4, indicates that there is not any notable correlations between the intrinsic specific energy from the drilling experiments with brittleness indices 0, 2 and c as shown in Figure 4.7 Intrinsic specific energy and its relation with the brittleness index a) 0, b) 2 and c) c from rotary drilling tests. In this view, it is examined in this section whether the new brittleness index j1l can be reasonably correlated with the drilling parameters obtained from rotary drilling. Figure 4.8 Intrinsic specific energy from rotary drilling tests and its relation with the brittleness index j1l shows the relationship between the intrinsic specific energy from Table 4.3 and Table 4.4 and their respective brittleness index j1l. Here, j1l values were calculated from the UCS quantities of the respective rocks and they are presented in Table 4.3 and Table 4.4. Figure 4.8 shows that there exists a sound correlation between the intrinsic 175
177 specific energy from roller-cone rotary drilling and PDC small-diameter rotary drilling and the proposed energy-based brittleness index j1l. A logarithmic fitting in the form of =169 ( l1j )+101, with a coefficient of correlation k 2 of were obtained which supports this statement. It is noteworthy that PDC single cutter cutting tests results also lie in a logarithmic fitting curve close to that obtained for the drilling tests results as shown in Figure 4.8. Furthermore, similar to the results with PDC single cutter tests presented earlier, in Figure 4.8, the intrinsic specific energy, which increases with increasing compressive strength, obviously increases in a non-linear fashion with j1l as high strength rocks show a higher brittleness capacity by higher j1l values. PERCUSSIVE DRILLING PERFORMANCE DRILLING EXPERIMENTS FROM LITERATURE In the case of percussive drilling, tool-rock interactions are mostly focused on the prediction of the penetration rate and selection of the optimum thrust (Franca 2011; Hustrulid and Fairhurst 1971a; Hustrulid and Fairhurst 1972a; Hustrulid and Fairhurst 1971b; Hustrulid and Fairhurst 1972b). To examine the application of the proposed brittleness index j1l in assessing the percussive drilling performance, independent data set from percussive drilling tests carried out in field conditions on a wide variety of rocks with a wide range of uniaxial compressive strength values ranging from 69 to 418 MPa, reported by Schmidt (Schmidt 1972), was used. Here, percussive drilling performance is given in terms of the rate of penetration. Table 4.5 shows the strength parameters of the rocks and their respective rate of penetration (PR) obtained under bit diameter of mm (H-thread carbide bit), operating pressure of 690 kpa, piston weight of 2 kg and air-type flushing. PENETRATION RATE AND BRITTLENESS INDEX In this section, first brittleness indices 0, 2 and c, proposed in previous studies, and their relations with the penetration rate PR were examined. 176
178 These brittleness indices were extracted from the data set presented in Table 4.5 by Schmidt (Schmidt 1972). Results of similar analysis can be found in the literature elsewhere (Altindag 2009). The results of this analysis are presented in Figure 4.9. It can be seen in this figure that, 0 and 2 show no correlation with the penetration rate. In addition, c does not show a correlation as good as j1l does with the penetration rate as it is demonstrated later in Figure Table 4.5 reports the values of the brittleness index j1l calculated from the respective values of UCS of the rocks. Figure 4.10a shows the plot penetration rate PR versus the brittleness index j1l. This figure shows that there is a reasonable correlation between the penetration rate PR and the proposed energy-based brittleness index j1l. This correlation is stronger than others presented in Figure 4.9. An exponential fitting in the form of Œk= 1M.s j1l which yielded a coefficient of correlation k 2 of In Figure 4.10a, in general, the penetration capacity given by the penetration rate of the rocks decreases non-linearly with an increase in brittleness index j1l (i.e. with an increase in compressive strength of the rocks). This is mainly because penetration rate in stronger rocks drops and stronger rocks have higher j1l values. In order to improve the correlation between penetration rate PR and j1l data, the penetration rate values were normalised with respect to the uniaxial compressive strength, i.e. by dividing the penetration rate by the respective UCS of rocks producing the normalised penetration rate PRN = PR/UCS. This normalisation has also been proposed and used in previous studies on the application of brittleness index to predict drilling performance (Altindag 2009; Altindag 2010). The results of normalisation, in Figure 4.10b, show that the normalised penetration rate values PRN decreases non-linearly as the brittleness j1l increases and a correlation coefficient k 2 of was yielded with an exponential fitting of Œk = zz j1l. Brittleness indices 0, 2 and c and their relations with the penetration rate normalised PRN were also examined 177
179 (results are not shown here). In this respect, 0 and 2 were not able to produce any correlation and c did not show a correlation as good as j1l did with the normalised penetration rate data. CONCLUSIONS In this study drilling performance is evaluated by rock brittleness capacity. In this respect, to reliably estimate drilling performance both tool-rock interaction laws along with a proper brittleness index should be implemented. Therefore, tool-rock interaction laws together with a new brittleness index able to picture both an ambiguous brittleness scale from ductile to brittle and brittleness scale with rock strength were implemented. This new brittleness index j1l, which is based on the relation of the energy dissipation quantities withdrawn from the complete stress-strain curve in uniaxial compression, was deemed to be relevant to this purpose. The performance of PDC (Polycrystalline Diamond Compact) singlecutter cutting tests and different drilling methods including PDC rotary drilling, roller-cone rotary drilling and percussive drilling were investigated against rock brittleness capacity. PDC single-cutter cutting experiments were carried out on different rock types. In addition, independent rotary as well as percussive drilling results from laboratory and field tests, found in the literature, were used. To quantify cutting and drilling performance, the intrinsic specific energy, which is the energy consumed in pure cutting action, and drilling penetration rate values were implemented. The results show that the new energy-based brittleness index j1l successfully describes the performance of the studied cutting and drilling methods. In addition, the performance of several brittleness indices which are proposed based on relations between compressive and tensile strength, i.e. 0, 2 and c, were investigated and compared with the proposed brittleness index j1l. These brittleness indices, however, are not able to quantify rock failure behaviour and cannot correlate well with rock strength. As a result, no 178
180 correlation was found between brittleness 0 and 2 with either cutting or drilling performance parameters. Brittleness index c, showed some correlation with drilling performance parameters, however, in all drilling cases, c showed weaker correlations with drilling performance parameters as compared to the correlations obtained by j1l. The brittleness index j1l proposed in the present study offered the strongest correlation with the drilling performance, either case cutting, rotary or percussive drilling. Therefore, the new energybased brittleness index is deemed to be relevant to assess drilling performance by rock brittleness capacity. ACKNOWLEDGEMENT The work has been supported by the Deep Exploration Technologies Cooperative Research Centre whose activities are funded by the Australian Government's Cooperative Research Centre Programme. This is DET CRC Document 2016/169. Special thanks to Dr L Franca from (formerly) the Australian Resource Research Centre (ARRC), CSIRO Perth, for facilitating the cutting experiments, the fruitful discussions and providing some rock samples. REFERENCES Altindag R (2002) The evaluation of rock brittleness concept on rotary blast hole drills Journal-South African Institute of Mining and Metallurgy 102:61-66 Altindag R (2003) Correlation of specific energy with rock brittleness concepts on rock cutting Journal of the South African Institute of Mining and Metallurgy 103: Altindag R (2009) Assessment of some brittleness indexes in rock-drilling efficiency Rock Mechanics and Rock Engineering 43: doi: /s x Altindag R (2010) Reply to the Discussion by Yagiz on Assessment of Some Brittleness Indexes in Rock-Drilling Efficiency by Altindag, Rock Mechanics and Rock Engineering, DOI: /s x Rock mechanics and rock engineering 43:
181 Bažant Z (1984) Size Effect in Blunt Fracture: Concrete, Rock, Metal Journal of Engineering Mechanics 110: doi:doi: /(asce) (1984)110:4(518) Bažant Z (1989) Identification of strain softening constitutive relation from uniaxial tests by series coupling model for localisation Cement and Concrete Research 19: Detournay E, Atkinson C (2000) Influence of pore pressure on the drilling response in low-permeability shear-dilatant rocks International Journal of Rock Mechanics and Mining Sciences 37: doi: Detournay E, Defourny P (1992) A phenomenological model for the drilling action of drag bits International journal of rock mechanics and mining sciences & geomechanics abstracts 29:13-23 doi: / (92) Detournay E, Richard T, Shepherd M (2008) Drilling response of drag bits: Theory and experiment International Journal of Rock Mechanics and Mining Sciences 45: doi: /j.ijrmms Franca LFP (2010) Drilling Action of Roller-Cone Bits: Modeling and Experimental Validation Journal of Energy Resources Technology 132: doi: / Franca LFP (2011) A bit rock interaction model for rotary percussive drilling International Journal of Rock Mechanics and Mining Sciences 48: doi: /j.ijrmms Franca LFP, Mostofi M, Richard T (2015) Interface laws for impregnated diamond tools for a given state of wear International Journal of Rock Mechanics and Mining Sciences 73: doi: Hoseinie SH, Aghababaei H, Pourrahimian Y (2008) Development of a new classification system for assessing of rock mass drillability index (RDi) International Journal of Rock Mechanics and Mining Sciences 45:1-10 doi: /j.ijrmms
182 Howarth D The effect of pre-existing microcavities on mechanical rock performance in sedimentary and crystalline rocks. In: International Journal of Rock Mechanics and Mining Sciences & Geomechanics Abstracts, vol 4. Elsevier, pp Hucka V, Das B (1974) Brittleness determination of rocks by different methods International Journal of Rock Mechanics and Mining Sciences & Geomechanics Abstracts 11: doi: Hustrulid W, Fairhurst C A theoretical and experimental study of the percussive drilling of rock Part II force-penetration and specific energy determinations. In: International Journal of Rock Mechanics and Mining Sciences & Geomechanics Abstracts, 1971a. vol 4. Elsevier, pp Hustrulid W, Fairhurst C A theoretical and experimental study of the percussive drilling of rock part III experimental verification of the mathematical theory. In: International Journal of Rock Mechanics and Mining Sciences & Geomechanics Abstracts, 1972a. vol 3. Elsevier, pp Hustrulid WA, Fairhurst C (1971b) A theoretical and experimental study of the percussive drilling of rock part I theory of percussive drilling International Journal of Rock Mechanics and Mining Sciences & Geomechanics Abstracts 8: doi: Hustrulid WA, Fairhurst C (1972b) A theoretical and experimental study of the percussive drilling of rock Part IV application of the model to actual percussion drilling International Journal of Rock Mechanics and Mining Sciences & Geomechanics Abstracts 9: doi: ISRM (1978) Suggested methods for determining tensile strength of rock materials International Journal of Rock Mechanics and Mining Sciences & Geomechanics Abstracts 15: doi: 181
183 Jansen DC, Shah S (1997) Effect of Length on Compressive Strain Softening of Concrete Journal of Engineering Mechanics 123:25-35 doi:doi: /(asce) (1997)123:1(25) Jansen DC, Shah SP, Rossow EC (1995) Stress-Strain Results of Concrete from Circumferential Strain Feedback Control Testing Materials Journal 92 doi: /9774 Kahraman S (1999) Rotary and percussive drilling prediction using regression analysis International Journal of Rock Mechanics and Mining Sciences 36: doi: Kahraman S (2002) Correlation of TBM and drilling machine performances with rock brittleness Engineering Geology 65: doi: /s (01) Kahraman S, Balcı C, Yazıcı S, Bilgin N (2000) Prediction of the penetration rate of rotary blast hole drills using a new drillability index International Journal of Rock Mechanics and Mining Sciences 37: doi: Kahraman S, Bilgin N, Feridunoglu C (2003) Dominant rock properties affecting the penetration rate of percussive drills International Journal of Rock Mechanics and Mining Sciences 40: doi: Karasawa H, Ohno T, Kosugi M, Rowley JC (2002a) Methods to Estimate the Rock Strength and Tooth Wear While Drilling With Roller-Bits Part 1: Milled-Tooth Bits Journal of Energy Resources Technology 124:125 doi: / Karasawa H, Ohno T, Kosugi M, Rowley JC (2002b) Methods to Estimate the Rock Strength and Tooth Wear While Drilling With Roller-Bits Part 2: Insert Bits Journal of Energy Resources Technology 124:133 doi: / Kidybiński A (1981) Bursting liability indices of coal International Journal of Rock Mechanics and Mining Sciences & Geomechanics Abstracts 18: doi: 182
184 Lin J-S, Zhou Y (2013) Can scratch tests give fracture toughness? Engineering Fracture Mechanics 109: doi: /j.engfracmech Lin J-S, Zhou Y (2015) Rebuttal: Shallow wide groove scratch tests do not give fracture toughness Engineering Fracture Mechanics 133: doi: Markeset G, Hillerborg A (1995) Softening of concrete in compression Localization and size effects Cement and Concrete Research 25: doi: Munoz H, Taheri A, Chanda E (2016) Fracture energy-based brittleness index development and brittleness quantification by pre-peak strength parameters in rock uniaxial compression. Rock Mechanics and Rock Engineering doi: /s Paone J, Madson D, Bruce WE (1969) Drillability studies: laboratory percussive drilling. Bureau of Mines, Twin Cities, MN (USA). Twin Cities Mining Research Center, Richard T, Coudyzer C, Desmentte S (2010) Influence of groove geometry and cutter inclination in rock cutting. Paper presented at the 44th US Rock Mechanics Symposium and 5th U.S.-Canada Rock Mechanics Symposium, Salt Lake City, UT, USA, Richard T, Dagrain F, Poyol E, Detournay E (2012) Rock strength determination from scratch tests Engineering Geology : doi: /j.enggeo Schmidt RL (1972) Drillability studies: percussive drilling in the field REPORT OF INVESTIGATIONS 7684, 31 P, FIG, 10 TAB, 11 REF Selim AA, Bruce WE (1970) Prediction of penetration rate for percussive drilling REPORT OF INVESTIGATIONS 7396, JUNE, P, 13 TAB, 10 REF, APPEND Stavropoulou M (2006) Modeling of small-diameter rotary drilling tests on marbles International Journal of Rock Mechanics and Mining Sciences 43: doi: /j.ijrmms
185 Taheri A, Qao Q, Chanda E (2016) Drilling Penetration Rate Estimation using Rock Drillability Characterization Index Journal of The Institution of Engineers (India): Series D:1-12 doi: /s Tarasov B, Potvin Y (2013) Universal criteria for rock brittleness estimation under triaxial compression International Journal of Rock Mechanics and Mining Sciences 59:57-69 doi: Tarasov BG, Randolph MF (2011) Superbrittleness of rocks and earthquake activity International Journal of Rock Mechanics and Mining Sciences 48: doi: Teale R (1965) The concept of specific energy in rock drilling Int J Rock Mech Mining Sc 2:57-73 Zhou Y, Lin J-S (2013) On the critical failure mode transition depth for rock cutting International Journal of Rock Mechanics and Mining Sciences 62: doi: 184
186 LIST OF FIGURES 40 Brittleness index, B Unconfined compressive strength, UCS (MPa) a) 1.0 Brittleness index, B Unconfined compressive strength, UCS (MPa) b) 185
187 8000 Brittleness index, B 3 (MPa x MPa) Unconfined compressive strength, UCS (MPa) c) Figure 4.1 Relations between compressive-to-tensile brittleness indices a) 0, b) 2 and c) c with unconfined compressive strength. Data from literature (Howarth 1987; Paone et al. 1969; Schmidt 1972; Selim and Bruce 1970) 186
188 10 Axial stress, q (MPa) U pre E LVDT U post 1/3q peak E LVDT Axial strain, ε A (x10-4 ) a) 10 Axial stress, q (MPa) U pre E LVDT U e Axial strain, ε A (x10-4 ) b) 187
189 Axial stress, q (MPa) 10 Tuffeau limestone q peak = 7.0 MPa 1/3q peak Axial strain, ε A (x10-4 ) E LVDT Axial stress, q (MPa) 30 E LVDT Savonniere limestone q peak = 24 MPa Axial strain, ε A (x10-4 ) Axial stress, q (MPa) 40 Hawkesbury sandstone q peak = 34 MPa E LVDT 1/3q peak Axial strain, ε A (x10-4 ) Axial stress, q (MPa) 100 Massangis limestone q peak = 84 MPa E LVDT Axial strain, ε A (x10-4 ) c) 188
190 Axial stress, q (MPa) 150 E LVDT Chassagne limestone q peak = 123 MPa Axial strain, ε A (x10-4 ) Axial stress, q (MPa) 150 Harcourt granite q peak = 143 MPa E LVDT Axial strain, ε A (x10-4 ) Axial stress, q (MPa) Alvand granite q peak = 182 MPa E LVDT Axial stress, q (MPa) E LVDT Rocheron limestone q peak = 215 MPa Axial strain, ε A (x10-4 ) Axial strain, ε A (x10-4 ) c) (Continued) 189
191 Elastic strain energy, U e (MPa) 0.25 U total U e Y=0.0021X R 2 = Total strain energy, U total (MPa) Unconfined compressive strength, UCS (MPa) d) Figure 4.2 a) and b) Strain energy of rock in compression, c) typical complete stress-strain curves for different rocks under lateral strain-rate control and d) strain energy quantities with compressive strength for different rock types 190
192 3 Brittleness index, B U-I 2 1 Y= 0.563e X R 2 = Unconfined compressive strength, UCS (MPa) Figure 4.3 Brittleness index j1l relations with unconfined compressive strength for different rock types 191
 PDC cutting test at shallow depth of cut and b) geometry")
193 a) b) Figure 4.4 a) PDC cutting test at shallow depth of cut and b) geometry of cutting and forces acting on the PDC cutter 192
Experimental Assessment of Rock Cutting Characteristics by Strength-Driven Mechanism. H Munoz, A Taheri & E Chanda
 Experimental Assessment of Rock Cutting Characteristics by Strength-Driven Mechanism H Munoz, A Taheri & E Chanda AusIMM Africa Australia Technical Mining Conference, Jun 11-12 215 Adelaide, Australia
Butje Alfonsius Louk Fanggi
 AXIAL COMPRESSIVE BEHAVIOR OF FRP-CONCRETE-STEEL DOUBLE-SKIN TUBULAR COLUMNS Butje Alfonsius Louk Fanggi BEng and MEng (Structural Engineering) Thesis submitted to The University of Adelaide School of
Effect of 3D Stress States at Crack Front on Deformation, Fracture and Fatigue Phenomena
 Effect of 3D Stress States at Crack Front on Deformation, Fracture and Fatigue Phenomena By Zhuang He B. Eng., M. Eng. A thesis submitted for the degree of Doctor of Philosophy at the School of Mechanical
Simulation of the cutting action of a single PDC cutter using DEM
 Petroleum and Mineral Resources 143 Simulation of the cutting action of a single PDC cutter using DEM B. Joodi, M. Sarmadivaleh, V. Rasouli & A. Nabipour Department of Petroleum Engineering, Curtin University,
Rock Material. Chapter 3 ROCK MATERIAL HOMOGENEITY AND INHOMOGENEITY CLASSIFICATION OF ROCK MATERIAL
 Chapter 3 Rock Material In all things of nature there is something of the marvelous. Aristotle ROCK MATERIAL The term rock material refers to the intact rock within the framework of discontinuities. In
Module 5: Failure Criteria of Rock and Rock masses. Contents Hydrostatic compression Deviatoric compression
 FAILURE CRITERIA OF ROCK AND ROCK MASSES Contents 5.1 Failure in rocks 5.1.1 Hydrostatic compression 5.1.2 Deviatoric compression 5.1.3 Effect of confining pressure 5.2 Failure modes in rocks 5.3 Complete
Effect of intermediate principal stresses on compressive strength of Phra Wihan sandstone
 Rock Mechanics, Fuenkajorn & Phien-wej (eds) 211. ISBN 978 974 533 636 Effect of intermediate principal stresses on compressive strength of Phra Wihan sandstone T. Pobwandee & K. Fuenkajorn Geomechanics
Supplementary Uniaxial Compressive Strength Testing of DGR-3 and DGR-4 Core
 Technical Report Title: Document ID: Authors: Supplementary Uniaxial Compressive Strength Testing of DGR-3 and DGR-4 Core TR-08-39 B. Gorski, T. Anderson and D. Rodgers CANMET Mining and Mineral Sciences
DEM simulation of fracture process of inherently anisotropic rock under Brazilian test condition
 Title DEM simulation of fracture process of inherently anisotropic rock under Brazilian test condition Author(s) Kwok, CY; Duan, K Citation The 49th US Rock Mechanics / Geomechanics Symposium, San Francisco,
Modelling dynamic fracture propagation in rock
 University of Wollongong Research Online Faculty of Engineering and Information Sciences - Papers: Part B Faculty of Engineering and Information Sciences 2017 Modelling dynamic fracture propagation in
DEVELOPMENT OF AUTOMATIC CONTROL OF MULTI-STAGE TRIAXIAL TESTS AT THE UNIVERSITY OF MISKOLC
 Geosciences and Engineering, Vol. 2, No. 3 (2013), pp. 37 43. DEVELOPMENT OF AUTOMATIC CONTROL OF MULTI-STAGE TRIAXIAL TESTS AT THE UNIVERSITY OF MISKOLC BALÁZS CSUHANICS ÁKOS DEBRECZENI Institute of Mining
Application of a Helmholtz resonator excited by grazing flow for manipulation of a turbulent boundary layer
 Application of a Helmholtz resonator excited by grazing flow for manipulation of a turbulent boundary layer Farzin Ghanadi School of Mechanical Engineering The University of Adelaide South Australia, 5005
The Dynamics of Potassium in some. Australian soils
 The Dynamics of Potassium in some Australian soils Serhiy Marchuk In fulfilment of the degree of DOCTOR OF PHILOSOPHY Soil Science Group School of Agriculture, Food and Wine The University of Adelaide
The effect of discontinuities on strength of rock samples
 The effect of discontinuities on strength of rock samples T Szwedzicki 1 and W Shamu 2 ABSTRACT The mechanical properties of rock samples of identical lithological composition may vary significantly due
-SQA-SCOTTISH QUALIFICATIONS AUTHORITY HIGHER NATIONAL UNIT SPECIFICATION GENERAL INFORMATION MECHANICAL ENGINEERING PRINCIPLES: STATICS AND DYNAMICS
 -SQA-SCOTTISH QUALIFICATIONS AUTHORITY HIGHER NATIONAL UNIT SPECIFICATION GENERAL INFORMATION -Unit Number- 2550727 -Superclass- -Title- RC MECHANICAL ENGINEERING PRINCIPLES: STATICS AND DYNAMICS -----------------------------------------
Three-Dimensional Failure Criteria Based on the Hoek Brown Criterion
 Rock Mech Rock Eng () 45:989 99 DOI.7/s6--77- ISRM SUGGESTED METHOD Three-Dimensional Failure Criteria Based on the Hoek Brown Criterion Stephen Priest Published online: 8 July Ó Springer-Verlag List of
Numerical modeling of standard rock mechanics laboratory tests using a finite/discrete element approach
 Numerical modeling of standard rock mechanics laboratory tests using a finite/discrete element approach S. Stefanizzi GEODATA SpA, Turin, Italy G. Barla Department of Structural and Geotechnical Engineering,
Ground Support in Mining and Underground Construction
 Ground Support in Mining and Underground Construction Proceedings of the Fifth International Symposium on Ground Support 28-30 September 2004, Perth, Western Australia Edited by Ernesto Villaescusa Yves
Project PAJ2 Dynamic Performance of Adhesively Bonded Joints. Report No. 3 August Proposed Draft for the Revision of ISO
 NPL Report CMMT(A)81 Project PAJ2 Dynamic Performance of Adhesively Bonded Joints Report No. 3 August 1997 Proposed Draft for the Revision of ISO 11003-2 Adhesives - Determination of Shear Behaviour of
Rock Cutting Analysis Employing Finite and Discrete Element Methods
 Journal of Mechanics Engineering and Automation 6 (2016) 100-108 doi: 10.17265/2159-5275/2016.02.006 D DAVID PUBLISHING Rock Cutting Analysis Employing Finite and Discrete Element Methods Carla Massignani
Cite this paper as follows:
 Cite this paper as follows: Naughton P.J. and O Kelly B.C. 2001. An overview of the University College Dublin hollow cylinder apparatus. Proceedings of the 14th Young European Geotechnical Engineer s Conference,
SHEAR STRENGTH OF SOIL UNCONFINED COMPRESSION TEST
 SHEAR STRENGTH OF SOIL DEFINITION The shear strength of the soil mass is the internal resistance per unit area that the soil mass can offer to resist failure and sliding along any plane inside it. INTRODUCTION
Lecture #2: Split Hopkinson Bar Systems
 Lecture #2: Split Hopkinson Bar Systems by Dirk Mohr ETH Zurich, Department of Mechanical and Process Engineering, Chair of Computational Modeling of Materials in Manufacturing 2015 1 1 1 Uniaxial Compression
Rock Mechanics Laboratory Tests for Petroleum Applications. Rob Marsden Reservoir Geomechanics Advisor Gatwick
 Rock Mechanics Laboratory Tests for Petroleum Applications Rob Marsden Reservoir Geomechanics Advisor Gatwick Summary A wide range of well established and proven laboratory tests are available for petroleum
Application of a transversely isotropic brittle rock mass model in roof support design
 University of Wollongong Research Online Coal Operators' Conference Faculty of Engineering and Information Sciences 2012 Application of a transversely isotropic brittle rock mass model in roof support
FLAC3D analysis on soil moving through piles
 University of Wollongong Research Online Faculty of Engineering - Papers (Archive) Faculty of Engineering and Information Sciences 211 FLAC3D analysis on soil moving through piles E H. Ghee Griffith University
Brittle Deformation. Earth Structure (2 nd Edition), 2004 W.W. Norton & Co, New York Slide show by Ben van der Pluijm
, 2004 W.W. Norton & Co, New York Slide show by Ben van der Pluijm") Lecture 6 Brittle Deformation Earth Structure (2 nd Edition), 2004 W.W. Norton & Co, New York Slide show by Ben van der Pluijm WW Norton, unless noted otherwise Brittle deformation EarthStructure (2 nd
Lecture 6 Brittle Deformation Earth Structure (2 nd Edition), 2004 W.W. Norton & Co, New York Slide show by Ben van der Pluijm WW Norton, unless noted otherwise Brittle deformation EarthStructure (2 nd
STRESS DROP AS A RESULT OF SPLITTING, BRITTLE AND TRANSITIONAL FAULTING OF ROCK SAMPLES IN UNIAXIAL AND TRIAXIAL COMPRESSION TESTS
 Studia Geotechnica et Mechanica, Vol. 37, No. 1, 2015 DOI: 10.1515/sgem-2015-0003 STRESS DROP AS A RESULT OF SPLITTING, BRITTLE AND TRANSITIONAL FAULTING OF ROCK SAMPLES IN UNIAXIAL AND TRIAXIAL COMPRESSION
Adhesive Joints Theory (and use of innovative joints) ERIK SERRANO STRUCTURAL MECHANICS, LUND UNIVERSITY
 ERIK SERRANO STRUCTURAL MECHANICS, LUND UNIVERSITY") Adhesive Joints Theory (and use of innovative joints) ERIK SERRANO STRUCTURAL MECHANICS, LUND UNIVERSITY Wood and Timber Why I m intrigued From this to this! via this Fibre deviation close to knots and
Adhesive Joints Theory (and use of innovative joints) ERIK SERRANO STRUCTURAL MECHANICS, LUND UNIVERSITY Wood and Timber Why I m intrigued From this to this! via this Fibre deviation close to knots and
PHYSICO-MECHANICAL PROPERTIES OF ROCKS LECTURE 2. Contents
 PHYSICO-MECHANICAL PROPERTIES OF ROCKS LECTURE 2 Contents 2.1 Introduction 2.2 Rock coring and logging 2.3 Physico-mechanical properties 2.3.1 Physical Properties 2.3.1.1 Density, unit weight and specific
MEMORANDUM SUBJECT: CERTIFICATE IN ROCK MECHANICS PAPER 1 : THEORY SUBJECT CODE: COMRMC MODERATOR: H YILMAZ EXAMINATION DATE: OCTOBER 2017 TIME:
 MEMORANDUM SUBJECT: CERTIFICATE IN ROCK MECHANICS PAPER 1 : THEORY EXAMINER: WM BESTER SUBJECT CODE: COMRMC EXAMINATION DATE: OCTOBER 2017 TIME: MODERATOR: H YILMAZ TOTAL MARKS: [100] PASS MARK: (60%)
Pullout Tests of Geogrids Embedded in Non-cohesive Soil
 Archives of Hydro-Engineering and Environmental Mechanics Vol. 51 (2004), No. 2, pp. 135 147 Pullout Tests of Geogrids Embedded in Non-cohesive Soil Angelika Duszyńska, Adam F. Bolt Gdansk University of
Critical Borehole Orientations Rock Mechanics Aspects
 Critical Borehole Orientations Rock Mechanics Aspects By R. BRAUN* Abstract This article discusses rock mechanics aspects of the relationship between borehole stability and borehole orientation. Two kinds
RESIDENTIAL SATISFACTION IN THE CHANGING URBAN FORM IN ADELAIDE: A COMPARATIVE ANALYSIS OF MAWSON LAKES AND CRAIGBURN FARM, SOUTH AUSTRALIA
 RESIDENTIAL SATISFACTION IN THE CHANGING URBAN FORM IN ADELAIDE: A COMPARATIVE ANALYSIS OF MAWSON LAKES AND CRAIGBURN FARM, SOUTH AUSTRALIA by Michael Chadbourne BEPM (Hons) University of Adelaide Thesis
On characterising fracture resistance in mode-i delamination
 9 th International Congress of Croatian Society of Mechanics 18-22 September 2018 Split, Croatia On characterising fracture resistance in mode-i delamination Leo ŠKEC *, Giulio ALFANO +, Gordan JELENIĆ
ROCK MASS CHARATERISATION: A COMPARISON OF THE MRMR AND IRMR CLASSIFICATION SYSTEMS. G P Dyke AngloGold Ashanti 1
 ROCK MASS CHARATERISATION: A COMPARISON OF THE MRMR AND IRMR CLASSIFICATION SYSTEMS AngloGold Ashanti 1 Synopsis The MRMR Classification System was developed specifically for mining applications, namely
FRACTURE IN HIGH PERFORMANCE FIBRE REINFORCED CONCRETE PAVEMENT MATERIALS
 FRACTURE IN HIGH PERFORMANCE FIBRE REINFORCED CONCRETE PAVEMENT MATERIALS ERIK DENNEMAN A thesis submitted in partial fulfilment of the requirements for the degree of PHILOSOPHIAE DOCTOR (ENGINEERING)
Failure and Failure Theories for Anisotropic Rocks
 17th international Mining Congress and Exhibition of Turkey- IMCET 2001, 2001, ISBN 975-395-417-4 Failure and Failure Theories for Anisotropic Rocks E. Yaşar Department of Mining Engineering, Çukurova
Origin of Overpressure and Pore Pressure Prediction in Carbonate Reservoirs of the Abadan Plain Basin
 Origin of Overpressure and Pore Pressure Prediction in Carbonate Reservoirs of the Abadan Plain Basin Vahid Atashbari Australian School of Petroleum The University of Adelaide This thesis is submitted
ENGINEERING GEOLOGY AND ROCK ENGINEERING
 1 ENGINEERING GEOLOGY AND ROCK ENGINEERING HANDBOOK NO. 2 Norwegian Group for Rock Mechanics (NBG) www.bergmekanikk.com Prepared in co-operation with Norwegian Tunnelling Society (NFF) Issued in 2000 SECRETARIAT:
Pre-failure Deformability of Geomaterials. Hsin-yu Shan Dept. of Civil Engineering National Chiao Tung University
 Pre-failure Deformability of Geomaterials Hsin-yu Shan Dept. of Civil Engineering National Chiao Tung University Strain Levels Strain at failure Sand Clay Rock Distribution of strain of soil in the field
EFFECT OF SHEAR REINFORCEMENT ON FAILURE MODE OF RC BRIDGE PIERS SUBJECTED TO STRONG EARTHQUAKE MOTIONS
 EFFECT OF SHEAR REINFORCEMENT ON FAILURE MODE OF RC BRIDGE PIERS SUBJECTED TO STRONG EARTHQUAKE MOTIONS Atsuhiko MACHIDA And Khairy H ABDELKAREEM SUMMARY Nonlinear D FEM was utilized to carry out inelastic
Behaviour of Blast-Induced Damaged Zone Around Underground Excavations in Hard Rock Mass Problem statement Objectives
 Behaviour of Blast-Induced Damaged Zone Around Underground Excavations in Hard Rock Mass Problem statement Blast-induced damaged zone can affect the affect stability and performance of tunnel. But, we
Mechanical properties 1 Elastic behaviour of materials
 MME131: Lecture 13 Mechanical properties 1 Elastic behaviour of materials A. K. M. B. Rashid Professor, Department of MME BUET, Dhaka Today s Topics Deformation of material under the action of a mechanical
Loading capacity of yielding connections used in steel arch roadway supports
 Ground Support 2013 Y. Potvin and B. Brady (eds) 2013 Australian Centre for Geomechanics, Perth, ISBN 978-0-9806154-7-0 https://papers.acg.uwa.edu.au/p/1304_31_horyl/ Loading capacity of yielding connections
DESIGN OF AN ULTRA-SPEED LAB-SCALE DRILLING RIG FOR SIMULATION OF HIGH SPEED DRILLING OPERATIONS IN HARD ROCKS. *V. Rasouli, B.
 DESIGN OF AN ULTRA-SPEED LAB-SCALE DRILLING RIG FOR SIMULATION OF HIGH SPEED DRILLING OPERATIONS IN HARD ROCKS *V. Rasouli, B. Evans Department of Petroleum Engineering, Curtin University ARRC Building,
Strength, creep and frictional properties of gas shale reservoir rocks
 ARMA 1-463 Strength, creep and frictional properties of gas shale reservoir rocks Sone, H. and Zoback, M. D. Stanford University, Stanford, CA, USA Copyright 21 ARMA, American Rock Mechanics Association
1.103 CIVIL ENGINEERING MATERIALS LABORATORY (1-2-3) Dr. J.T. Germaine Spring 2004 LABORATORY ASSIGNMENT NUMBER 6
 Dr. J.T. Germaine Spring 2004 LABORATORY ASSIGNMENT NUMBER 6") 1.103 CIVIL ENGINEERING MATERIALS LABORATORY (1-2-3) Dr. J.T. Germaine MIT Spring 2004 LABORATORY ASSIGNMENT NUMBER 6 COMPRESSION TESTING AND ANISOTROPY OF WOOD Purpose: Reading: During this laboratory
1.103 CIVIL ENGINEERING MATERIALS LABORATORY (1-2-3) Dr. J.T. Germaine MIT Spring 2004 LABORATORY ASSIGNMENT NUMBER 6 COMPRESSION TESTING AND ANISOTROPY OF WOOD Purpose: Reading: During this laboratory
Experimental study of mechanical and thermal damage in crystalline hard rock
 Experimental study of mechanical and thermal damage in crystalline hard rock Mohammad Keshavarz Réunion Technique du CFMR - Thèses en Mécanique des Roches December, 3 nd 2009 1 Overview Introduction Characterization
Deformability Modulus of Jointed Rocks, Limitation of Empirical Methods and Introducing a New Analytical Approach
 University of Wollongong Research Online Coal Operators' Conference Faculty of Engineering and Information Sciences 2016 Deformability Modulus of Jointed Rocks, Limitation of Empirical Methods and Introducing
Long-Term Strength Degradation Testing of DGR-3 and DGR-4 Core
 Technical Report Title: Document ID: Authors: Long-Term Strength Degradation Testing of DGR-3 and DGR-4 Core TR-08-36 B. Gorski, T. Anderson and B. Conlon CANMET Mining and Mineral Sciences Laboratories,
Assessment of rock slope stability using remote sensing technique in the Gold Coast area, Australia
 Assessment of rock slope stability using remote sensing technique in the Gold Coast area, Australia Author Gratchev, Ivan, Shokouhi, A., Kim, Dong Hyun, Stead, D., Wolter, A. Published 2013 Conference
CHAPTER 3 EXPERIMENTAL STUDY
 Experimental Study 42 CHAPTER 3 EXPERIMENTAL STUDY 3.1. INTRODUCTION The experimental study that has been carried out in this thesis has two main objectives: 1. Characterise the concrete behaviour in mode
Using the Timoshenko Beam Bond Model: Example Problem
 Using the Timoshenko Beam Bond Model: Example Problem Authors: Nick J. BROWN John P. MORRISSEY Jin Y. OOI School of Engineering, University of Edinburgh Jian-Fei CHEN School of Planning, Architecture and
Module 9 : Foundation on rocks. Content
 FOUNDATION ON ROCKS Content 9.1 INTRODUCTION 9.2 FOUNDATION TYPES ON ROCKS 9.3 BEARING CAPCITY- SHALLOW FOUNDATION 9.3.1 Ultimate bearing capacity 9.3.2 Safe bearing pressure 9.3.3 Estimation of bearing
Earthquake-resistant design of indeterminate reinforced-concrete slender column elements
 Engineering Structures 29 (2007) 163 175 www.elsevier.com/locate/engstruct Earthquake-resistant design of indeterminate reinforced-concrete slender column elements Gerasimos M. Kotsovos a, Christos Zeris
A modified model of a single rock joint s shear behavior in
 This paper is accepted for publication in the International Journal of Mining Science and Technology A modified model of a single rock joint s shear behavior in limestone specimens Dindarloo Saeid R a*,
Analysis of Controlling Parameters for Shear behavior of Rock Joints with FLAC3D
 International Journal of Structural and Civil Engineering Research Vol. 5, No. 1, February 2016 Analysis of Controlling Parameters for Shear behavior of Rock Joints with FLAC3D Prasoon Tiwari and Hakan
Flin Flon Mining Belt
 EOSC433: Geotechnical Engineering Practice & Design Lecture 7: Stress Analysis around Underground Openings 1 of 40 Erik Eberhardt UBC Geological Engineering EOSC 433 (2007) Flin Flon Mining Belt Since
Introduction and Background
 Introduction and Background Itasca Consulting Group, Inc. (Itasca) has been participating in the geomechanical design of the underground 118-Zone at the Capstone Minto Mine (Minto) in the Yukon, in northwestern
Size Effects In the Crushing of Honeycomb Structures
 45th AIAA/ASME/ASCE/AHS/ASC Structures, Structural Dynamics & Materials Conference 19-22 April 2004, Palm Springs, California AIAA 2004-1640 Size Effects In the Crushing of Honeycomb Structures Erik C.
Geomechanical Characterization of a Montney Equivalent Outcrop
 Is (MPa) Geomechanical Characterization of a Montney Equivalent Outcrop Scott H McKean, Mason MacKay, Dr. Jeffrey Priest University of Calgary Summary A variety of geomechanical tests (point load strength,
Evaluation of in-plane orthotropic elastic constants of paper and paperboard
 Evaluation of in-plane orthotropic elastic constants of paper and paperboard T. Yokoyama and K. Nakai Department of Mechanical Engineering, Okayama University of Science - Ridai-cho, Okayama 7-5, Japan
Seismic Evaluation of Tailing Storage Facility
 Australian Earthquake Engineering Society 2010 Conference, Perth, Western Australia Seismic Evaluation of Tailing Storage Facility Jonathan Z. Liang 1, David Elias 2 1 Senior Geotechnical Engineer, GHD
Strain-Based Design Model for FRP-Confined Concrete Columns
 SP-230 57 Strain-Based Design Model for FRP-Confined Concrete Columns by N. Saenz and C.P. Pantelides Synopsis: A constitutive strain-based confinement model is developed herein for circular concrete columns
Research Article Experimental Investigation on Creep Deformation Behavior of Medium-strength Marble Rock
 Research Journal of Applied Sciences, Engineering and Technology 7(2): 311-315, 2014 DOI:10.19026/rjaset.7.256 ISSN: 2040-7459; e-issn: 2040-7467 2014 Maxwell Scientific Publication Corp. Submitted: April
CHAPTER 8 SUMMARY, CONCLUSIONS AND RECOMMENDATIONS
 CHAPTER 8 SUMMARY, CONCLUSIONS AND RECOMMENDATIONS 8.1 SUMMARY This thesis aimed to investigate the mechanisms behind valley closure and upsidence over unmined coal and old longwall panels using UDEC.
Seismic analysis of horseshoe tunnels under dynamic loads due to earthquakes
 University of Wollongong Research Online Coal Operators' Conference Faculty of Engineering and Information Sciences 2010 Seismic analysis of horseshoe tunnels under dynamic loads due to earthquakes Navid
THE USE OF CUSUMS AS A TOOL TO AID IN THE INTERPRETATION OF SLOPE MONITORING DATA WITH SPECIFIC EXAMPLES FROM AN OPERATING OPEN PIT MINE
 THE USE OF CUSUMS AS A TOOL TO AID IN THE INTERPRETATION OF SLOPE MONITORING DATA WITH SPECIFIC EXAMPLES FROM AN OPERATING OPEN PIT MINE W.Sarunic 1 and P.A.Lilly 2 1 Snowden Mining Industry Consultants,
BioMechanics and BioMaterials Lab (BME 541) Experiment #5 Mechanical Prosperities of Biomaterials Tensile Test
 Experiment #5 Mechanical Prosperities of Biomaterials Tensile Test") BioMechanics and BioMaterials Lab (BME 541) Experiment #5 Mechanical Prosperities of Biomaterials Tensile Test Objectives 1. To be familiar with the material testing machine(810le4) and provide a practical
BioMechanics and BioMaterials Lab (BME 541) Experiment #5 Mechanical Prosperities of Biomaterials Tensile Test Objectives 1. To be familiar with the material testing machine(810le4) and provide a practical
Interpretation of Pile Integrity Test (PIT) Results
 Results") Annual Transactions of IESL, pp. 78-84, 26 The Institution of Engineers, Sri Lanka Interpretation of Pile Integrity Test (PIT) Results H. S. Thilakasiri Abstract: A defect present in a pile will severely
Annual Transactions of IESL, pp. 78-84, 26 The Institution of Engineers, Sri Lanka Interpretation of Pile Integrity Test (PIT) Results H. S. Thilakasiri Abstract: A defect present in a pile will severely
Laboratory 4 Bending Test of Materials
 Department of Materials and Metallurgical Engineering Bangladesh University of Engineering Technology, Dhaka MME 222 Materials Testing Sessional.50 Credits Laboratory 4 Bending Test of Materials. Objective
The Mine Geostress Testing Methods and Design
 Open Journal of Geology, 2014, 4, 622-626 Published Online December 2014 in SciRes. http://www.scirp.org/journal/ojg http://dx.doi.org/10.4236/ojg.2014.412046 The Mine Geostress Testing Methods and Design
AVOIDING FRACTURE INSTABILITY IN WEDGE SPLITTING TESTS BY MEANS OF NUMERICAL SIMULATIONS
 Damage, Avoiding fracture Fracture instability and Fatigue in wedge splitting tests by means of numerical simulations XIV International Conference on Computational Plasticity. Fundamentals and Applications
(Refer Slide Time: 02:18)
") Geology and Soil Mechanics Prof. P. Ghosh Department of Civil Engineering Indian Institute of Technology Kanpur Lecture 40 Shear Strength of Soil - C Keywords: Shear strength of soil, direct shear test,
Geology and Soil Mechanics Prof. P. Ghosh Department of Civil Engineering Indian Institute of Technology Kanpur Lecture 40 Shear Strength of Soil - C Keywords: Shear strength of soil, direct shear test,
Impact and Crash Modeling of Composite Structures: A Challenge for Damage Mechanics
 Impact and Crash Modeling of Composite Structures: A Challenge for Damage Mechanics Dr. A. Johnson DLR Dr. A. K. Pickett ESI GmbH EURO-PAM 99 Impact and Crash Modelling of Composite Structures: A Challenge
Numerical investigation of EDZ development around a deep polymetallic ore mine
 Paper No. 198 ISMS 2016 Numerical investigation of EDZ development around a deep polymetallic ore mine Mountaka Souley a *, Marwan Al Heib a, Vincent Renaud a a INERIS, c/o Ecole des Mines de Nancy, Campus
Double punch test for tensile strength of concrete, Sept (70-18) PB224770/AS (NTIS)
 PB224770/AS (NTIS)") Lehigh University Lehigh Preserve Fritz Laboratory Reports Civil and Environmental Engineering 1969 Double punch test for tensile strength of concrete, Sept. 1969 (70-18) PB224770/AS (NTIS) W. F. Chen
Lehigh University Lehigh Preserve Fritz Laboratory Reports Civil and Environmental Engineering 1969 Double punch test for tensile strength of concrete, Sept. 1969 (70-18) PB224770/AS (NTIS) W. F. Chen
SIZE EFFECTS IN THE COMPRESSIVE CRUSHING OF HONEYCOMBS
 43rd AIAA/ASME/ASCE/AHS/ASC Structures, Structural Dynamics, and Materials Con 22-25 April 2002, Denver, Colorado SIZE EFFECTS IN THE COMPRESSIVE CRUSHING OF HONEYCOMBS Erik C. Mellquistand Anthony M.
Successful Construction of a Complex 3D Excavation Using 2D and 3D Modelling
 University of Wollongong Research Online Coal Operators' Conference Faculty of Engineering and Information Sciences 2015 Successful Construction of a Complex 3D Excavation Using 2D and 3D Modelling Yvette
Geotechnical & Mining Engineering Services
 Geotechnical & Mining Engineering Services Southwest Research Institute San Antonio, Texas A s an independent, nonprofit research and development organization, Southwest Research Institute (SwRI ) uses
5. STRESS CONCENTRATIONS. and strains in shafts apply only to solid and hollow circular shafts while they are in the
 5. STRESS CONCENTRATIONS So far in this thesis, most of the formulas we have seen to calculate the stresses and strains in shafts apply only to solid and hollow circular shafts while they are in the elastic
ME 2570 MECHANICS OF MATERIALS
 ME 2570 MECHANICS OF MATERIALS Chapter III. Mechanical Properties of Materials 1 Tension and Compression Test The strength of a material depends on its ability to sustain a load without undue deformation
Effect of buttress on reduction of rock slope sliding along geological boundary
 Paper No. 20 ISMS 2016 Effect of buttress on reduction of rock slope sliding along geological boundary Ryota MORIYA *, Daisuke FUKUDA, Jun-ichi KODAMA, Yoshiaki FUJII Faculty of Engineering, Hokkaido University,
Three-Dimensional simulation for the rock fragmentation induced by TBM with GFEM
 Recent Advances in Rock Engineering (RARE 2016) Three-Dimensional simulation for the rock fragmentation induced by TBM with GFEM XY Xu, XH Tang and QS Liu School of Civil Engineering, Wuhan University,
Rock slope failure along non persistent joints insights from fracture mechanics approach
 Rock slope failure along non persistent joints insights from fracture mechanics approach Louis N.Y. Wong PhD(MIT), BSc(HKU) Assistant Professor and Assistant Chair (Academic) Nanyang Technological University,
Constitutive Model for High Density Polyethylene to Capture Strain Reversal
 Constitutive Model for High Density Polyethylene to Capture Strain Reversal Abdul Ghafar Chehab 1 and Ian D. Moore 2 1 Research Assistant, GeoEngineering Centre at Queen s RMC, Queen s University, Kingston,
FIRST INTERNATIONAL SEMINAR DEEP AND HIGH STRESS MINING 6-8 NOVEMBER 2002 PERTH, AUSTRALIA. Potential. T. Wiles Mine Modelling Pty Ltd, Australia
 FIRST INTERNATIONAL SEMINAR ON DEEP AND HIGH STRESS MINING 6-8 NOVEMBER 22 PERTH, AUSTRALIA Loading System Stiffness A Parameter to Evaluate Rockburst Potential T. Wiles Mine Modelling Pty Ltd, Australia
ROCK MASS CHARACTERISATION IN ENGINEERING PRACTICE
 Paul MARINOS NTUA, School of Civil Engineering, 9 Iroon Polytechniou str., Athens, 157 80, Greece, e-mail : marinos@central.ntua.gr ROCK MASS CHARACTERISATION IN ENGINEERING PRACTICE 1. INTRODUCTION The
Pillar strength estimates for foliated and inclined pillars in schistose material
 Pillar strength estimates for foliated and inclined pillars in schistose material L.J. Lorig Itasca Consulting Group, Inc., Minneapolis, MN, USA A. Cabrera Itasca S.A., Santiago, Chile ABSTRACT: Pillar
Research Article EffectsofCyclicLoadingontheMechanicalPropertiesofMature Bedding Shale
 Advances in Civil Engineering Volume 218, Article ID 8985973, 9 pages https://doi.org/1.1155/218/8985973 Research Article EffectsofCyclicLoadingontheMechanicalPropertiesofMature Bedding Shale Yintong Guo,
Mechanical Properties of Materials
 Mechanical Properties of Materials Strains Material Model Stresses Learning objectives Understand the qualitative and quantitative description of mechanical properties of materials. Learn the logic of
FCP Short Course. Ductile and Brittle Fracture. Stephen D. Downing. Mechanical Science and Engineering
 FCP Short Course Ductile and Brittle Fracture Stephen D. Downing Mechanical Science and Engineering 001-015 University of Illinois Board of Trustees, All Rights Reserved Agenda Limit theorems Plane Stress
Defining the role of elastic modelling in underground mine design
 Underground Design Methods 2015 Y Potvin (ed.) 2015 Australian Centre for Geomechanics, Perth, ISBN 978-0-9924810-3-2 https://papers.acg.uwa.edu.au/p/1511_03_barsanti/ Defining the role of elastic modelling
UNDRAINED SHEAR STRENGTH OF SOFT CLAY REINFORCE WITH SINGLE 16MM DIAMETER ENCAPSULATED BOTTOM ASH COLUMN NABILAH BINTI MD MASHOD FAKEH
 1 UNDRAINED SHEAR STRENGTH OF SOFT CLAY REINFORCE WITH SINGLE 16MM DIAMETER ENCAPSULATED BOTTOM ASH COLUMN NABILAH BINTI MD MASHOD FAKEH B. ENG (HONS.) CIVIL ENGINEERING UNIVERSITI MALAYSIA PAHANG 1 UNIVERSITI
BIAXIAL STRENGTH INVESTIGATION OF CFRP COMPOSITE LAMINATES BY USING CRUCIFORM SPECIMENS
 BIAXIAL STRENGTH INVESTIGATION OF CFRP COMPOSITE LAMINATES BY USING CRUCIFORM SPECIMENS H. Kumazawa and T. Takatoya Airframes and Structures Group, Japan Aerospace Exploration Agency 6-13-1, Ohsawa, Mitaka,
In Situ Triaxial Tests
 Page No.: 1 More than 40 years have passed since, with all due urgency, STINI and MÜLLER pointed out the absolute necessity of conducting large-scale tests in engineering geology and rock mechanics. The
Finite Element Analysis of FRP Debonding Failure at the Tip of Flexural/Shear Crack in Concrete Beam
 Marquette University e-publications@marquette Civil and Environmental Engineering Faculty Research and Publications Civil and Environmental Engineering, Department of 12-1-2013 Finite Element Analysis
The design of a formula student front impact attenuator
 The design of a formula student front impact attenuator J.M.J. Schormans MT 10.06 Supervisors: dr. ir. Varvara Kouznetsova Eindhoven University of Technology Department of Mechanical Engineering Computational
Geotechnical data from optical and acoustic televiewer surveys
 Geotechnical data from optical and acoustic televiewer surveys by Farrin De Fredrick MAusIMM, Senior Geotechnical Engineer; Ta Nguyen AIG, Geotechnical Engineer; Clive Seymour MAusIMM, Principal; and Gary