Temporal and spatial variation in temperature experienced by macrofauna at main endeavour Hydrothermal vent field
|
|
|
- Rachel Carr
- 5 years ago
- Views:
Transcription
1 1 Deep Sea Research Part I: Oceanographic Research Papers ember 2015, Volume 106, Pages Elsevier Ltd. All rights reserved. Achimer Temporal and spatial variation in temperature experienced by macrofauna at main endeavour Hydrothermal vent field Lee Raymond W 1, Robert Katleen 2, Matabos jolaine 3, Bates Amanda E 4, iper S.Kim 5 1 School of Biological Sciences, Washington State University, Pullman, WA 99164, USA 2 National Oceanography Centre, University of Southampton Waterfront Campus, Southampton SO14 3ZH, UK 3 Institut Carnot Ifremer EDROME, Centre de Bretagne, REM/EEP, Laboratoire Environnement Profond, F Plouzané, France 4 Ocean and Earth Science, National Oceanography Centre Southampton, University of Southampton, Southampton SO14 3ZH, UK 5 Ocean Networks Canada, University of Victoria and School of Earth and Ocean Sciences and Biology Department, University of Victoria, Victoria, British Columbia V8Y 2Y2, Canada Abstract : A significant focus of hydrothermal vent ecological studies has been to understand how species cope with various stressors through physiological tolerance and biochemical resistance. Yet, the environmental conditions experienced by vent species have not been well characterized. This objective requires continuous observations over time intervals that can capture environmental variability at scales that are relevant to animals. We used autonomous temperature logger arrays (four roughly parallel linear arrays of 12 loggers spaced every cm) to study spatial and temporal variations in the thermal regime experienced by hydrothermal vent macrofauna at a diffuse flow vent. Hourly temperatures were recorded over eight months from 2010 to 2011 at Grotto vent in the Main Endeavour vent field on the Juan de Fuca Ridge, a focus area of the Ocean Networks Canada cabled observatory. The conspicuous animal assemblages in video footage contained Ridgeia piscesae tubeworms, gastropods (primarily Lepetodrilus fucensis), and polychaetes (polynoid scaleworms and the palm worm Paralvinella palmiformis). Two dimensional spatial gradients in temperature were generally stable over the deployment period. The average temperature recorded by all arrays, and in some individual loggers, revealed distinctive fluctuations in temperature that often corresponded with the tidal cycle. We postulate that this may be related to changes in bottom currents or fluctuations in vent discharge. A marked transient temperature increase lasting over a period of days was observed in il While the distributions and behavior of Juan de Fuca Ridge vent invertebrates may be partially constrained by environmental temperature and temperature tolerance, except for the one transient high-temperature event, observed fluid temperatures were generally similar to the thermal preferences for some species, and typically well below lethal temperatures for all species. Average temperatures of the four arrays ranged from 4.1 to 11.0 C during the deployment, indicating that on an hourly timescale the temperature conditions in this tubeworm community were fairly moderate and stable. The generality of these findings and behavioural responses of vent organisms to predictable rhythmicity and non-periodic temperature shifts are areas for further investigation. Please note that this is an author-produced PDF of an article accepted for publication following peer review. The definitive publisher-authenticated version is available on the publisher Web site.
2 2 Highlights Spatial and temporal temperature variations experienced by vent macrofauna were studied. Fluctuations in temperature often corresponded with the tidal cycle. Temperatures were typically well below lethal temperatures for all species. Keywords : Hydrothermal vents, Community ecology, Thermal biology, Endeavour, Time-series 1. Introduction The physical and chemical environment at deep-sea hydrothermal vents is generally considered to be extreme, but the precise conditions encountered by endemic vent organisms are not well characterized. However, the potential for high environmental variability, both spatial and temporal, is remarkable, since at centimeter to meter scales, temperature can range from over 300 C (undiluted vent fluid) to 2 C (ambient bottom temperature), and hydrothermal discharge zones are often turbulent. Compounding the challenges related to extreme and variable temperatures are the associated chemical stressors in the vent fluids including: elevated acidity, CO2, sulfide, anoxia, and metal ions. Higher temperature habitats tend to have a greater intensity and variability of these chemical stressors; however, this correlation can be complex. For example, ratios of Please note that this is an author-produced PDF of an article accepted for publication following peer review. The definitive publisher-authenticated version is available on the publisher Web site.
3 4 temperature to chemical concentrations are not constant, and can vary within and between sites (Le Bris et al., 2006; Luther et al., 2012). Adaptations of vent animals to tolerate extreme conditions have long been a focus of physiological studies (Childress and Fisher, 1992), but their ability to adjust to or tolerate high environmental variability is less well characterized. Body temperature broadly affects functioning and homeostasis since metabolic rate and other biochemical processes are generally temperature dependent. Even short-term exposure to high temperature can impair macromolecular structure and function (reviewed in Hochachka, 2002). Consequently, the characteristics of high temperature extremes experienced by vent organisms are important dimensions of their thermal niche. These properties of the vent thermal habitat have been difficult to characterize, but recent deployments of spatial arrays of temperature loggers are beginning to reveal biologically relevant temperature patterns (Bates et al., 2005, 2013; Robert et al., 2012). Ecological dynamics in space and time at deep-sea vents have been an active area of investigation, and relate to the variability of the physical and chemical environment. Distinct species assemblages exhibiting patchy distributions are a general characteristic of vent communities that can reflect spatial patterns of physical and chemical conditions (Sarrazin et al., 1999). Clear patterns of macrofaunal species succession and evolving hydrothermal conditions have been observed on sulfide edifices, and around newly emerged vents following seafloor volcanic eruptions, on the Juan de Fuca Ridge (cus et al., 2009) as well as on the East Pacific Rise (Mullineaux et al., 2003; Shank et al., 1998). Chemical, substratum, and community relationships have also been documented in the Lau Basin (Podowski et al., 2009; Sen et al., 2013).
4 5 Thermal tolerance differences between species, observed in pressurized aquarium studies (e.g. Bates et al., 2010; Lee, 2003; Shillito, 2006), appear to correlate with distributions in nature. Vent animals also exhibit behavioral and locomotory responses to temperature (Bates et al., 2013). On the Juan de Fuca Ridge where the present study was conducted, and at other vent systems, the most conspicuous mobile fauna are predominantly small (generally <2 cm) polychaetes and gastropods (Sarrazin and iper, 1999). In pressurized aquaria, the upper thermal limits of these species correlate with likely habitat temperature, and one species, Paralvinella sulfincola, exhibits the highest documented thermal limit for a marine animal (Lee, 2003). Short term (<24 h) in situ two dimensional temperature measurements, coupled with observations of animal behavior, indicate that vent species are active over wide temperature ranges, with a highly mobile predatory/deposit feeding polynoid scaleworm exhibiting spatial displacement patterns that were independent of temperature (Robert et al., 2012). In contrast, temperature affected activity in P. sulfincola, which inhabits temporary tubes and grazes on adjacent surfaces (Bates et al., 2013). Both of these studies used short-term deployments of thermal arrays. High frequency temperature dynamics typical of vent habitats at longer time scales have not been well characterized. This study sought to investigate long-term spatial and temporal temperature patterns in a diffuse flow habitat colonized by macrofauna at Grotto Vent in the Main Endeavour field on the Juan de Fuca Ridge using temperature logger arrays. Endeavour is presently an area of focus for current and future instrument deployments of the NEPTUNE cabled observatory operated by Ocean Networks Canada. This study deployed multiple temperature logger arrays for 8 months, to characterize the thermal
5 6 environment of sulfide edifice surfaces colonized by vent invertebrates. Temperature data, recorded hourly, were analyzed to identify spatial gradients, and characterize their stability and relationship to species patterns. We also explored the dataset for evidence of rhythmicity and transient extreme events, both of which could influence animal physiology and behaviour. 2. Materials and Methods 2.1 Study Site Grotto Vent is in the Main Endeavour vent field (Depth: 2200 m, Lat: 'N Lon: 'W). This is a site of focused observations by instruments connected to a cabled observatory (Ocean Networks Canada, NEPTUNE observatory; and was previously designated as an Integrated Study Site by the U.S. Ridge Interdisciplinary Global Experiments (RIDGE) program. It is also located within the boundaries of the Endeavour Hydrothermal Vents ine Protected Area, managed by the Canadian Department of Fisheries and Oceans. Several Ocean Networks Canada instruments are deployed at Grotto Vent, and a site representative of the diffuse flow animal community was selected for deployment of arrays of temperature loggers. The site was colonized by Ridgeia piscesae tubeworm aggregations with associated mixed gastropods and polychaetes within community types III, IV, and VI described by Sarrazin et al., (1997) and Sarrazin and iper (1999). Also present were tufts of filamentous bacteria and areas of detritus. Buccinid snails were abundant peripheral to the tubeworms.
6 7 2.2 Deployment Four linear arrays were deployed in the late summer of 2010 (deployed September; data logging started ember) using the ROV ROPOS and recovered using the ROV JASON in y Twelve loggers were attached to galvanized steel chain with regular spacing (10-12 cm). Not all loggers were recovered, and some loggers failed. The four logger chains were placed roughly parallel to each other (Figure 1), laid out from the upper part of the tubeworm aggregations and sloping downwards to the base. In this way, the loggers would provide coverage across the community from the shimmering water area upslope, across the tubeworm bushes and associated fauna, to the substratum that was sparsely populated by animals or covered by visible bacterial filaments. 2.3 Loggers and Data Analysis Temperature loggers consisted of ibutton thermochrons (Maxim DS1922L; 0.5 C rated precision) set to record every 60 minutes. These loggers were deployed in cylindrical titanium pressure housings with 2.5 cm outer diameter (OD) x 3.8 cm height. The temperature output of the thermochrons was checked against laboratory temperature before and after deployment. The loggers recorded known bottom water temperature of 2 C during recovery.
7 8 Data recovered from the temperature loggers were used to characterize temporal and spatial temperature variations in the fluids typical of the dominant faunal assemblage. For spatial analysis, the position of each logger was marked in the digital images taken from the ROV. A feature class with the positions of individual loggers and temperature was created in ArcMap. A two-dimensional temperature map for specific time points was generated using the inverse distance weighted (IDW) interpolation of the Spatial Analyst toolbox. To estimate the spectral density of the temperature time series, we used the function spec.pgram which calculates the periodogram using a fast Fourier transform. The resulting periodogram was smoothed using modified Daniell smoothers in R (R Core Team, 2013). Widths were equal to 3 and 6, or as required depending on which periodograms are included, i.e., the periodogram is a fluctuating estimate of the spectrum with high variance, and smoothing provides a stable estimate. To test for periodicity corresponding to tides in different subsections of the times series for different loggers, we independently analyzed each block of 89 hours (corresponding to approximately one half of a lunar week) for each logger. This time interval allowed us to align our observations to the tidal cycle. When we selected shorter or longer time periods, models failed to converge. Testing for a significant lag term for subsections of mean temperature data therefore allowed us to assess how much of each record displayed significant fluctuations with a periodicity that would be predicted from a tidal signal (a significant peak at 6.1 hours was identified using spectral analysis). We thus compared a generalized least squares model (response = temperature, predictor = time) without and with a moving average autocorrelation term (class corarma with a
8 9 lag of six hours). If including the autocorrelation term (phi) returned a significantly reduced AIC (Akaike information criterion) score, we recorded the phi value at lag six for this model (positive values indicate a positive autocorrelation, while the reverse is true for negative values). In cases where including an autocorrelation term did not improve the model fit, phi was assigned a value of zero, thus representing no correlation for the given time period of interest. 2.4 Image analysis To assess community composition and changes in fauna distribution, snapshots were extracted from the submersible video after the array deployment in September 2010 and prior to recovery in y A limitation is that camera angles could not be duplicated between years due to the use of different ROVs. For each year, we selected 3 pictures, featuring different angles when possible in order to mitigate bias related to the perspective. Image J (Schneider et al., 2012) was used to calculate the surface area occupied by the different animal assemblages relative to an area in the image delineated using the temperature loggers as reference points. Assemblages were identified following Sarrazin et al. (1997) and Sarrazin & iper (1999). Relative surface was calculated in order to account for different total surface areas among pictures, and averaged over the three images. A paired Wilcoxon test was used to detect significant differences in surfaces occupied between the 2 years for each assemblage in R (R Core Team, 2013).
 roughly parallel to each other.")
9 10 Figure 1 - Grotto animal assemblage September Temperature loggers can be seen attached to the steel chain running from top to bottom (linear series of loggers) roughly parallel to each other. The logger linear arrays are designated from left to right by color: Y=yellow array; B=blue array, G=green array, O=orange array. The loggers are numbered from 1 to 12 with 1 corresponding to the bottom most logger and 12 to the top most logger. Logger ID corresponds to this numbering system and the color of the array. For example, G12 is the upper most logger on the green colored linear array. Communities III, IV, VI are outlined and were identified following Sarrazin et al. (1997) and Sarrazin and iper (1999) as: community III - primarily paralvinellid polychaetes (P. palmiformis) and limpets (L. fucensis), IV primarily tubeworms (R. piscesae) and limpets, VI- longer tubeworms. Smaller tubeworms (SR; possibly juveniles), bacterial mat (BM) and bare substratum (S) are also outlined.
10 11 3. Results 3.1 Temperature logger array position Examination of the images from September 2010 following deployment showed that the upper part of the four arrays overlaid a mixed assemblage of tubeworms, polychaetes including paralvinellids, and gastropods (Figure 1), located on a slight slope. A dome-shaped collecting funnel (white object in Figure 1) leading to an automated fluid sampler (not visible) was also at the top of this area. Peripheral to the tubeworm aggregations were detritus, buccinid snails, and sea spiders (pycnogonids). Light-colored patches on the right side at the lower end of two arrays appeared to be mats of filamentous bacteria. The arrays were color coded from left to right: yellow (Y), blue (B), green (G), orange (O). The temperature data are accessible through the Ocean Networks Canada data portal within the Main Endeavour field data set ( In the data portal, the arrays are listed as: Temperature Array Temperature chain X where X=1, 2, 3, 4 (1=Y, 2=B, 3=G, 4=O). Conditions in the lower (down slope) area of the O array on the far right corroded the galvanized steel chain, preventing recovery of the individual temperature loggers since they became unattached. Consequently, only loggers from the upper half of the O array were recovered. Subsequent array deployments in this assemblage using stainless steel chain or Kevlar rope have avoided such degradation (Lee, pers. obs.).
11 12 Figure 2. Assemblages coverage observed in 2010 and The area analyzed is denoted by the area of outlines shown in Figure 1. Assemblages III, IV, VI outlined in Figure 1 were identified following Sarrazin et al. (1997) and Sarrazin and iper (1999) as: community III - primarily paralvinellid polychaetes (P. palmiformis) and limpets (L. fucensis), IV primarily tubeworms (R. piscesae) and limpets, VI- longer tubeworms (also called V-LF in Sarrazin and iper (1999)). Smaller tubeworms (possibly juveniles), bacterial mat, and bare substratum are as outlined in Figure Animal community coverage The extents of different animal assemblages (described in Sarrazin et al., 1997; Sarrazin and iper, 1999) are outlined in Figure 1, and the relative coverages within the total outlined area are given in Figure 2. The predominant community based on relative surface area was community VI consisting of long tubeworms. The upslope area was comprised of communities III and IV, while the area downslope from the tubeworms consisted of smaller tubeworms, bacterial mat, and bare substratum. No obvious changes in each community s coverage occurred between the years except for a decrease in the area occupied by R. piscesae juveniles (Figure 2). Wilcoxon tests revealed no significant
12 13 differences in relative coverage by any of the different identified communities, or the occurrence of light-colored bacterial mats, between the beginning and end of the deployment. However, the analysis involved a small image sample size (3 photos x 2 time points), limited resolution of the analyzed video frames, and it was not possible to duplicate camera angles between 2011 and Although the relative areas of the communities did not appear to change, the vertical extent may have increased. Portions of middle sections of the Y and B arrays had settled into or were slightly grown over by the tubeworm clump and were partially obscured with limpets. Growth and migration of animals over G was not evident. Much of O was highly overgrown with tubeworms and limpets and not visible during attempted recovery. 3.3 Temperature data Averaged hourly temperatures for all loggers on each of the 4 arrays are shown in Figure 3. Each array spanned the extent of the tubeworm community. The Y array exhibited the warmest average over the course of the deployment, ranging from 8 to 16 C (overall average C; 1 SD, n=6414 records for each logger). The G and O arrays were fairly stable, averaging C and C, respectively. The B array was intermediate with 8 C averages during the first half of the deployment and 4-6 C during second half (overall average C). The data set from all 4 arrays consists of 38 temperature logger records. Differences in temperature along individual arrays were most pronounced in the warmest, Y array. Average temperature for individual loggers on the Y array over the

13 14 entire deployment ranged from ambient bottom temperature (2 C) to 29 C. Two loggers were close to ambient bottom temperature, with averages of C and C. Five loggers were intermediate, averaging between 3.7 to 14 C. The 3 warmest loggers were either at the top or bottom of the array and averaged: C, C, and C. From single time points, it was evident that there were occasionally strong temperature differences between adjacent loggers on the arrays. Differences between adjacent logger pairs in the warmest (Y) array were as high as 20 C. Average differences between adjacent Y array loggers were 3.4 to 10 C. Only two Y loggers were Figure 3 - Average temperature records from all loggers in each of 4 arrays from figure 1.A: Average hourly temperature from all loggers for each array. The trace colors correspond to the array: yellow (Y), blue (B), green (G), orange (O). B: Maximum temperature in the measurement area from any logger in the 4 arrays. Boxed area corresponds to a temperature anomaly that began in il 2011.
14 15 generally similar with an average difference of 0.6 C. Differences between adjacent loggers of C degrees were common (11% of data), and differences of less than <2 C were also very common (27%). In a cooler (G) array, the average difference between adjacent loggers was generally 0.5 to 1 C. Three logger pairs had greater average differences of 1.7, 1.9, and 3.6 C. Short term 24 hour temporal variability of individual loggers was generally in the range of 2-10 C (difference between minimum and maximum over a 24 hour period). For example, in the Y array, over one day, one logger (deployment average temperature of 14.0 C) from the upper end of the array exhibited high variability, with an average range of C. The warmest loggers (Y and B arrays; >10 C) did not exhibit a correlation between average temperature and standard deviation, although as a general rule, the standard deviation was larger for loggers with an average temperature above 5 C (Appendix A1). Substantial differences in temperature could also be exhibited from one hour to the next. The three loggers at the top of the Y and B arrays occasionally exhibited absolute between-hour differences in the range of 6 to 14 C. 3.4 il 2011 temperature anomaly Examination of temperature across the entire deployment for events or general trends revealed one anomaly beginning on il 22, During other periods, there were shifts and trends in the warmer Y and B arrays, but there was no coherence between the arrays. However, a transient temperature spike on il 22 was evident in average data for both the Y and B arrays (Figure 3 upper panel). This spike consisted of a rise


.")

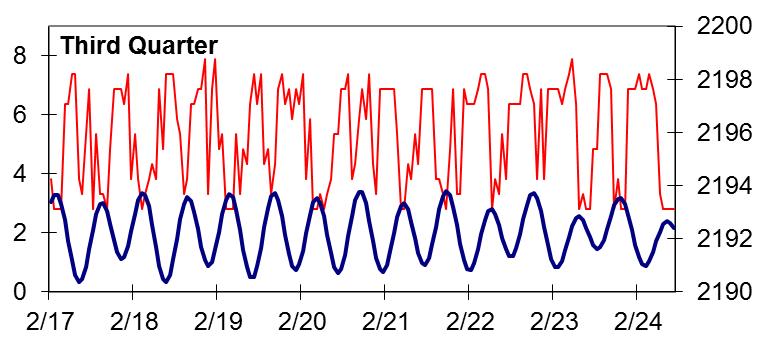
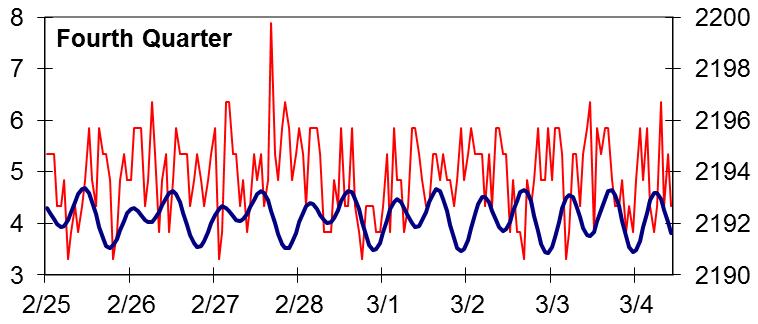
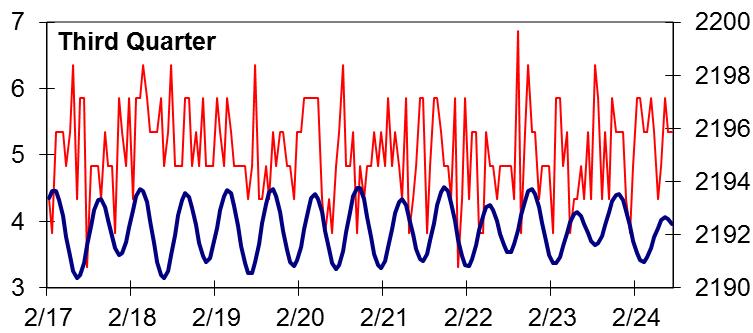
15 16 over 20 hours followed by a decline over the subsequent 200 hours. Maximum temperatures in the arrays went up to 45 C which is above the thermal maximum of several of the animal species observed in deployment images (Bates et al., 2010). Across the arrays, the average temperature warmed by 2 C, and 25% of the average increase could be attributed to a single logger. The temperature increase was localized to two consistently warm areas on the left side of the deployment. It is noteworthy that there was a seafloor volcanic eruption, and accompanying seismic activity, to the south of Endeavour at Axial volcano from il 6-12, 2011 that was followed by temperature changes (Dziak et al., 2012). The NEPTUNE observatory Endeavour segment seismometers were not yet operational during the early months of Pressure Figure 4 Average temperature from all loggers during the ch lunar cycle. Red lines are average temperature. Blue lines are pressure recorded by an Ocean Networks Canada bottom pressure recorder. 3.5 Shifts in temperature correlated with tidal cycle Examination of average temperature data from all arrays revealed periodicity that appears to coincide with tidal patterns. When plotted against pressure data collected from an
16 17 Ocean Networks Canada bottom pressure recorder (M. Heesemann, ONC; personal communication), there were periods when temperature shifts were correlated with tidal pressure. An example is shown for the ch lunar cycle in Figure 4 where high temperature is inversely correlated to pressure. Some individual logger records also exhibited this same pattern (example given in Appendix A2) while others exhibited temperatures that positively correlated to pressure. Correlation was not exhibited in all individual loggers (example given in Appendix A2). Whether the correlation with tidal pressure is present in the entire 8 month data set and all loggers was addressed by testing the following: (1) Periodicity in logger records over the entire deployment (spectral analysis; Figure 5, Appendix A3), (2) Patterns of temperature shifts in loggers in each lunar cycle (heat maps; Figure 6), (3) Identification of dates when individual loggers exhibited periodicity in phase or out of phase with tidal pressure (autocorrelation lag phi analysis; Figure 7). Spectral analysis of the average temperature data for all loggers from the entire deployment shows periodicity every 25.85, 12.43, 8.39 and 6.10 hours (Figure 5). Periodicity was also present in the temperature records of individual loggers (Appendix A3).
17 18 Figure 5 Periodogram of the hourly mean temperature of all loggers for the entire deployment. Blue bar represents 95% confidence interval. Relative temperatures and tidal pressures are shown as two color coded heat maps (Figure 6) for two selected loggers with high (G10) and low (G12) autocorrelation. These two examples were similar to other loggers from the deployment that exhibited comparable degrees of correlation (Figure 7). In the figure 6 heat maps, the cyclical nature of the tidal pressure can be discerned from the coherent bands of low tide (blue) and high tide (red).
18 19 The heat map (Figure 6) provides a means of visualizing the entire data set. The data for the 8 months are aligned by lunar quarter. The tidal temperature cycle appears in the heat map temperature columns, as horizontal bands corresponding to periods of high tide and low tide. For logger G10 data (upper heat map), an example of loggers exhibiting higher autocorrelation consistent with the tidal period, there is some coherence in the periods when relative temperature is high versus low. This logger is an example where temperature was inversely correlated with tidal pressure. This corresponds to a negative phi value (Figure 7) and the inverse relationship can be observed in the raw temperature records (e.g., Appendix A2). The heat map temperature columns exhibit discernable patterns where the horizontal bands of lower temperature (blue) correspond with horizontal bands of higher tidal pressure (red) in the pressure columns. Conversely, in the logger G12 heat map (lower heat map), such bands were generally not evident. Examination of the average logger temperature for the entire dataset suggests positive and negative correlation with tidal pressure that is less evident (Figure 7; Appendix A4).
19 20 Logger G10 high diel correlation, Phi values generally <0 First lunar quarter Second lunar quarter Third lunar quarter Fourth lunar quarter Temperature Pressure Temperature Pressure Temperature Pressure Temperature Pressure Month Day 7 Day 6 Day 5 Day 4 Day 3 Day 2 Day 1 Percentile Temperature Colder Warmer Tide Low High Figure 6 Relative temperature and tidal pressure for two example temperature loggers (G10 and G12) for the entire deployment. Data for each monthly lunar cycle are separated by lunar quarter. Color coding is based on the percentile of values for each single lunar quarter. Blue color is lower percentile; Red color is higher percentile. Loggers are from the G (green) array in the upper part of the deployment. Logger G12 low diel pattern, low Phi value First lunar quarter Second lunar quarter Third lunar quarter Fourth lunar quarter Month Temperature Pressure Temperature Pressure Temperature Pressure Temperature Pressure Day 6 Day 5 Day 4 Day 7 Day 3 Day 2 Day 1 e entire deployment suggests correlation with tidal pressure over the entire dataset Percentile Temperature Colder Warmer Tide Low High
20 21 Y1 Y2 Y3 Y4 Y5 Y9 Y10 Y11 Y12 G1 G2 G3 G5 G6 G7 G8 G9 G10 G11 G12 B2 B3 B6 B7 B8 B9 B10 B11 B12 O8 O9 O10 O11 O12 ave max ave temp ( C ) Phi <-0.2 <0 0 >0 Figure 7 Autocorrelation analysis of temperature records from each logger, the average of all loggers, and the maximum measured temperature. Phi values greater than or less than zero indicate that there is autocorrelation with a lag of 6 hours corresponding to the tidal cycle. Logger G10 is shown as an example in Figure 6. This logger exhibited many periods with a phi <0 indicating that temperature was inversely correlated with tidal pressure. Loggers exhibiting red squares in the heat map had periods where temperature was positively correlated with tidal pressure. Y, G, B, O refer to the color codes from Figure 1 for the 4 arrays. Not all of the O loggers were recovered (see text), and no data were obtained for Y6-8, G4, and B1. Autocorrelation could not be conducted on Y6, Y7, B4, B5 (average temperatures: 2.8, 2.3, 2.4, 2.3 C) since there was very little temperature variation in those records (thus the models would not converge).
21 22 To determine whether shifts in temperature correlated with tides are common throughout the temperature record, we tested for autocorrelation at a lag of six hours (corresponding with the tidal cycle) in successive time periods of ~½ a lunar week. Autocorrelation analysis for all individual loggers is shown as a heat map in Figure 7. Time periods of no autocorrelation (phi=0) appear as white bands. Time periods with blue shading represent periods of elevated temperature in association with dropping tidal pressure. Loggers also exhibited time periods where lower temperature was associated with dropping pressure (Red; phi >0). The percentage of periods where phi=0 was 22.1%. The majority of periods (57.4%) had a phi<0, while 20.5% had a phi>0. In plots of temperature vs. tidal pressure, correlations or absence of correlation were consistent with calculated phi values. For example, logger G12 in ruary exhibited a phi of 0 except for one time interval, while G10 exhibited a phi<0 for all time intervals in ruary. This is in agreement with the presence or absence of an apparent tidal signal in the plots of temperature vs. tidal pressure (Appendix A2). 3.6 Spatial 2D Two dimensional maps based on the array data showed distinct zones of cooler and warmer water that were generally consistent over the entire deployment. In the upper left, there appeared to be two warmer zones associated with the tubeworm clumps close to the top of the animal assemblage (Figure 8). There was a significant gap in the center of the deployment, so the interpolation was conducted separately for the right and left sides of the deployment. There was a warmer zone around the bacterial mat on the lower left. The right side was generally cooler with a slightly warmer spot associated with

22 23 tubeworms on the far right. The areas with tubeworms in warmer fluids corresponded with the presence of aggregations of limpets. Figure 8 - Average temperature from each month of the deployment for all loggers. Map generated in ArcMap using inverse distance weighting 4. Discussion As we develop approaches for characterizing the physico-chemical niches of vent species in both space and time, open questions include the extent to which the environmental instability creates physiological stress for animals, and affects species patterns. An understanding of temperature niches is emerging from studies that map faunal distribution in relation to temperature, in combination with experimental studies of
23 24 thermal tolerance. Under controlled conditions, vent animals exhibit behaviors demonstrating thermal preferences and upper thermal tolerance limits (Bates et al., 2010; Lee, 2003; Shillito, 2006). Some recent studies have combined faunal maps with physical and chemical mapping using geographic information systems (Podowski et al., 2009). This latter approach provides insight into the combined influence of temperature and chemical factors on species distributions, and permits the development of hypotheses about physico-chemical niches. Even so, long-term continuous observations of vent habitat conditions are few, so that our understanding of organism-environment relationships is mostly limited to what can be interpreted from snap shot spatial surveys or short-term studies. Given the dynamic nature of the vent environment (Le Bris et al., 2006; Moore et al., 2009; Nees et al., 2009; Urcuyo et al., 2003), there is considerable interest in combining long-term, continuous records of habitat features and physicochemical conditions with observations of faunal distributions. 4.1 Environmental stability While vent systems are typified as being among the most variable on the planet over short time-scales, the thermal patterns observed in this study were generally stable over several months, and qualitatively more stable than expected based on prior experience with short-term temperature variability recorded using submersible-deployed probes during dives (Bates et al 2005). Averages of all loggers from each linear array (Figure 3), did suggest that temperature often oscillated around steady average values. However, temperature data from individual loggers, or limited subsets of loggers, did not
24 25 necessarily display synchronized or similar oscillation patterns, and intra-hourly variation was not measured. The large number of loggers made it possible to assess whether stability of the environment at the time and spatial scales that were measured was a general pattern. The spatial temperature pattern also appeared to be relatively stable. Warm areas on the left side of the deployment corresponded with the location of the upper end of the tubeworm clumps and the bacterial mat area between the two tubeworm clusters at the lower end. This may be facilitated in part by diffusion and channeling of hydrothermal discharge by tubeworm clumps (Tsurumi and Tunnicliffe, 2003). The spatial pattern suggests that the tubeworms on the left side of the deployment were situated over a source of warm water that percolated upward and was also diverted to exit at the bacterial mat area between the clusters. One of the few recoverable loggers from the right side of the deployment recorded elevated temperatures, suggesting that there may have been higher temperatures (and greater vent fluid influence) on this side of the tubeworm bushes as well. While the diffuse flow vent conditions studied here were generally stable, hydrothermal discharge can be highly variable, and punctuated by perturbations related to geological factors such as seafloor volcanic eruptions and seismic events. It is notable that only a single thermal event occurred during the deployment, starting on il 22, Data suggest that this event resulted from increased vent discharge from two of the persistent hot spots, creating a transient wave of warmer water in the community. In general, within the time frame of our observations from this study and later deployments, such events appear to be rare and exceptional. Temperature changes of similar
25 26 magnitude were not observed in temperature array data from (Lee, unpublished), While the two dimensional characterization of the temperatures characteristic of diffuse vent fluids colonized by macrofauna involved a large number of loggers, the resolution is still limited by the spacing of the loggers and the 1-hour logging interval. The titanium housings of the loggers buffer rapid temperature fluctuations, so we cannot rule out transient temperature extremes outside the range reported. Small-scale spatial patterns are also potentially unresolved. Previous mapping studies over short time periods with loggers placed in a grid with 5 cm spacing, showed that average differences of up to 20 C can be recorded by adjacent loggers (Robert et al., 2012). If the loggers become covered by fauna or settle into tubeworm bushes, recorded temperatures could be affected (e.g. Bates et al., 2005). In the present study, general community composition and distributions at the end of the deployment showed little difference from the beginning. A digital still camera and a more extensive temperature logger array have been deployed at this same site since The resulting faunal and temperature time-series will enable detailed study of faunal responses to temperature change events and longer term trends. 4.2 Thermal biology Our findings reveal that hydrothermal habitats can be stable on time scales of months, and, with the exception of the transient il temperature spike, temperatures above 40 C which are lethal to animals were not recorded. This result supports an
26 27 emerging notion that vent animals may be adapted for the conditions presented by cooler fluids, while maintaining the capacity to escape extreme fluid conditions if necessary. Laboratory experiments in pressurized aquaria have shown that the upper thermal limits for motile gastropods and polychaetes from these sites are generally above 30 C (range C) (Bates et al., 2010). Localized or transient temperatures above 30 C were present, but the results from this study indicate that temperatures were generally less than 20 C and well below thermal limits. Our findings are also consistent with results from other vent communities (as reviewed in Bates et al 2005). Temperatures associated with vent faunal communities in the Lau Basin were well below animal tolerance limits (Sen et al., 2013). Nevertheless, temperature variability at sublethal levels may be an important indicator of associated chemical changes and resultant potential influences on animal behavior, physiological costs, and growth of microbial food sources. Within the assemblage types III, IV, and VI (Sarrazin and iper, 1999), there are numerous mobile invertebrate species that exhibit thermal preferences in laboratory experiments. According to the 2-D temperature maps, much of the habitat was within the thermal preference ranges of the gastropods and scaleworms (although temperatures greater than 40 C were occasionally observed), but not the paralvinellid polychaetes. The preferred temperature of the gastropods is in the range of 5-13 C based on experiments in pressurized aquaria (Bates et al., 2010), and similar preferences have been observed in in situ experiments (Bates et al., 2005). Specifically, the abundant gastropods Lepetodrilus fucensis, Depressigyra globulus, and Provanna variabilis (assemblage type III to V generally) select on average 7.7, 12.7, and 5.5 C respectively in experiments. Temperatures preferred by individuals ranged from , ,
27 28 and C respectively. Individual D. globulus and P. variabilis do not aggregate into conspicuous clumps, but are generally found associated with L. fucensis, so likely encounter the same temperature ranges as L. fucensis. Palm worms Paralvinella palmiformis (assemblage type II to IV generally) identified by their distinctive red branchiae were present in the limpet clumps, but have previously been found to have a thermal preference of 20 C and a considerably higher thermal tolerance (48 C) compared with the gastropods (Bates et al., 2010). While it appears that the palm worms were in areas much cooler than their preferred temperature, we cannot rule out that they aren t aggregated around small jets of warm water that would not have been resolved by our mapping. Buccinid snails are found in peripheral areas away from vent flow but also in assemblage type III, and exhibit a thermal preference of 5.7 C. Scaleworms (represented by multiple polynoid species in the deployment) have exhibited a thermal preference of 10.8 C in laboratory experiments. The finding that habitat temperature is fairly stable at or below preferred temperatures raises questions as to why vent animals have the ability to withstand high temperatures. Bates et al. (2010) showed that selected temperature correlated with critical thermal maximum, with species that have a higher thermal maximum selecting higher temperatures. They postulated that vent animals were playing it safe by selecting lower temperatures than non-vent animals as a response to a stochastic thermal environment (Bates et al., 2010). But, at the spatial and time scales of measurements in this study, lethal temperatures were generally not detected. Behavioral responses of animals monitored using a camera as part of the cabled observatory will provide critical information to resolve this question.
28 Tidal effects Apparent tidal fluctuations in ambient temperature could affect the ecology of vent animals and may be a predictable feature of their environment. The data from this deployment show apparent tidal rhythms in temperature, which when mapped suggest an expansion and contraction of the warm water plumes within the community. Scheirer et al. (2006) previously suggested that such temporary thermal plumes can move or oscillate around vent faunal communities. A tidal component to these patterns is supported by spectral analysis as well as by intervals where we could directly observe strong congruence between temperature and tidal pressure. Tidal modulation of diffuse flow vent temperatures has been previously reported at Juan de Fuca Ridge vents (Tivey et al., 2002), and in low temperature areas around animal communities at vents on the East Pacific Rise (Scheirer et al., 2006). Tidal periodicity was also observed in records from temperature loggers associated with the TEMPO-mini camera system, located at a nearby site on Grotto edifice (Cuvelier et al., 2014). Tidal patterns in vent fluid temperatures could be related to effects of changing hydrostatic pressure on vent discharge, or to tidally driven changes in strength and direction of local bottom currents, which may shift plumes of warm water or facilitate different degrees of mixing with bottom water (Tivey et al. 2002). Tidal patterns can be observed in data from the Benthic and Resistivity Sensors (BARS; M. Lilley, U. Washington), deployed in a nearby >300 C black smoker vent on the Grotto edifice. BARS data are available on the Ocean Networks Canada data portal.
29 30 Elevated but sublethal temperature conditions might be stressful for vent organisms since higher temperatures are often correlated with reduced oxygen availability or increased concentrations of toxins such as hydrogen sulfide. A tidal cycle may allow organisms to tolerate higher temperature niches (and concomitant vent influenced conditions) by providing regular respite from stressful temperature/chemical conditions. A study by Tunnicliffe et al. (1990) identified tidal patterns of tubeworm plume retraction/extension and suggested a relationship to oxygen demand (Tunnicliffe et al., 1990). More recently, the Cuvelier et al. (2014) study on Grotto with the Tempo-mini camera documented a similar periodicity in tubeworm plume retraction and extension that could be the consequence of changing sulphide and oxygen levels and/or requirements. 5. Conclusions Multiple temperature logger arrays provided a means of discerning spatial and temporal patterns in the temperature of diffuse flow environments that could potentially be missed by fewer loggers, or more commonly, by point measurements with a single sensor. We conclude that, despite variability at small temporal and spatial scales and in individual loggers, on average the environment at this diffuse-flow hydrothermal site was generally stable. Thermal conditions were moderate, suggesting that lethal thermal stress may not be commonly encountered by vent animals. Tidal rhythmicity was a common
30 31 and predictable feature of the environment. The factors causing this periodicity, such as tidal effects on fluid flow and temperature and tidally driven currents, are presently being elucidated. Acknowledgements: We thank the scientists, crew, and personnel of the R/V Atlantis, R/V Thomas G. Thompson, ROV Jason, and ROV ROPOS for making the deployments and recoveries possible. We are also grateful to in Cornec for his help in image processing. This work was supported by Ocean Networks Canada and NSF OCE to RL. References Cited Bates, A.E., Bird, T.J., Robert, K., Onthank, K.L., Quinn, G.P., iper, S.K., Lee, R.W., Activity and positioning of eurythermal hydrothermal vent sulphide worms in a variable thermal environment. J. Exp.. Biol. Ecol. 448, doi: /j.jembe Bates, A.E., Lee, R.W., Tunnicliffe, V., Lamare, M.D., Deep-sea hydrothermal vent animals seek cool fluids in a highly variable thermal environment. Nat. Commun. 1, 1 6. doi: /ncomms1014 Bates, A., Tunnicliffe, V., Lee, R., Role of thermal conditions in habitat selection by hydrothermal vent gastropods.. Ecol. Prog. Ser. 305, doi: /meps Childress, J.J., Fisher, C.R., The biology of hydrothermal vent animals: physiology, biochemistry, and autotrophic symbioses. Oceanogr.. Biol. Annu. Rev. 30, Cuvelier, D., Legendre, P., Laes, A., Sarradin, P.-M., Sarrazin, J., Rhythms and Community Dynamics of a Hydrothermal Tubeworm Assemblage at Main Endeavour Field A Multidisciplinary Deep-Sea Observatory Approach. PLoS ONE 9, e doi: /journal.pone Dziak, R.P., Haxel, J.H., Bohnenstiehl, D.R., Chadwick, W.W., Nooner, S.L., Fowler, M.J., Matsumoto, H., Butterfield, D.A., Seismic precursors and magma ascent before the il 2011 eruption at Axial Seamount. Nat. Geosci. 5, doi: /ngeo1490 Hochachka, P.W., Biochemical adaptation: mechanism and process in physiological evolution. Oxford University Press, New York.
31 32 Le Bris, N., Govenar, B., Le Gall, C., Fisher, C.R., Variability of physico-chemical conditions in 9 50 N EPR diffuse flow vent habitats.. Chem. 98, doi: /j.marchem Lee, R.W., Thermal tolerances of deep-sea hydrothermal vent animals from the Northeast Pacific. Biol. Bull. 205, Luther, G., Gartman, A., Yücel, M., Madison, A., Moore, T., Nees, H., Nuzzio, D., Sen, A., Lutz, R., Shank, T., Fisher, C., Chemistry, Temperature, and Faunal Distributions at Diffuse-Flow Hydrothermal Vents: Comparison of Two Geologically Distinct Ridge Systems. Oceanography 25, doi: /oceanog cus, J., Tunnicliffe, V., Butterfield, D.A., Post-eruption succession of macrofaunal communities at diffuse flow hydrothermal vents on Axial Volcano, Juan de Fuca Ridge, Northeast Pacific. Deep Sea Res. Part II Top. Stud. Oceanogr. 56, doi: /j.dsr Moore, T.S., Shank, T.M., Nuzzio, D.B., Luther, G.W., Time-series chemical and temperature habitat characterization of diffuse flow hydrothermal sites at 9 50 N East Pacific Rise. Deep Sea Res. Part II Top. Stud. Oceanogr. 56, doi: /j.dsr Mullineaux, L.S., Peterson, C.H., Micheli, F., Mills, S.W., Successional mechanism varies along a gradient in hydrothermal fluid flux at deep-sea vents. Ecol. Monogr. 73, doi: / Nees, H.A., Lutz, R.A., Shank, T.M., Luther, G.W., Pre- and post-eruption diffuse flow variability among tubeworm habitats at 9 50 north on the East Pacific Rise. Deep Sea Res. Part II Top. Stud. Oceanogr. 56, doi: /j.dsr Podowski, E.L., Moore, T.S., Zelnio, K.A., Luther, G.W., Fisher, C.R., Distribution of diffuse flow megafauna in two sites on the Eastern Lau Spreading Center, Tonga. Deep Sea Res. Part Oceanogr. Res. Pap. 56, doi: /j.dsr R Core Team, The R Project for Statistical Computing [WWW Document]. URL (accessed ). Robert, K., Onthank, K.L., iper, S.K., Lee, R.W., Small-scale thermal responses of hydrothermal vent polynoid polychaetes: Preliminary in situ experiments and methodological development. J. Exp.. Biol. Ecol , doi: /j.jembe Sarrazin, J., iper, S., Biological characteristics of a hydrothermal edifice mosaic community.. Ecol. Prog. Ser. 185, doi: /meps Sarrazin, J., iper, S., Massoth, G., Legendre, P., Physical and chemical factors influencing species distributions on hydrothermal sulfide edifices of the Juan de Fuca Ridge, northeast Pacific.. Ecol. Prog. Ser. 190, doi: /meps Sarrazin, J., Robigou, V., iper, S., Delaney, J., Biological and geological dynamics over four years on a high-temperature sulfide structure at the Juan de Fuca Ridge hydrothermal observatory.. Ecol. Prog. Ser. 153, doi: /meps153005
32 33 Scheirer, D.S., Shank, T.M., Fornari, D.J., Temperature variations at diffuse and focused flow hydrothermal vent sites along the northern East Pacific Rise. Geochem. Geophys. Geosystems 7. doi: /2005gc Schneider, C.A., Rasband, W.S., Eliceiri, K.W., NIH Image to ImageJ: 25 years of image analysis. Nat. Methods 9, doi: /nmeth.2089 Sen, A., Becker, E.L., Podowski, E.L., Wickes, L.N., Ma, S., Mullaugh, K.M., Hourdez, S., Luther, G.W., Fisher, C.R., Distribution of mega fauna on sulfide edifices on the Eastern Lau Spreading Center and Valu Fa Ridge. Deep Sea Res. Part Oceanogr. Res. Pap. 72, doi: /j.dsr Shank, T.M., Fornari, D.J., Von Damm, K.L., Lilley, M.D., Haymon, R.M., Lutz, R.A., Temporal and spatial patterns of biological community development at nascent deep-sea hydrothermal vents (9 50 N, East Pacific Rise). Deep Sea Res. Part II Top. Stud. Oceanogr. 45, doi: /s (97) Shillito, B., Temperature resistance studies on the deep-sea vent shrimp Mirocaris fortunata. J. Exp. Biol. 209, doi: /jeb Tivey, M.K., Bradley, A.M., Joyce, T.M., Kadko, D., Insights into tide-related variability at seafloor hydrothermal vents from time-series temperature measurements. Earth Planet. Sci. Lett. 202, doi: /s x(02) Tsurumi, M., Tunnicliffe, V., Tubeworm-associated communities at hydrothermal vents on the Juan de Fuca Ridge, northeast Pacific. Deep Sea Res. Part Oceanogr. Res. Pap. 50, doi: /s (03) Tunnicliffe, V., Garrett, J.F., Johnson, H.P., Physical and biological factors affecting the behaviour and mortality of hydrothermal vent tubeworms (vestimentiferans). Deep Sea Res. Part Oceanogr. Res. Pap. 37, doi: / (90)90031-p Urcuyo, I.A., Massoth, G.J., ian, D., Fisher, C.R., Habitat, growth and physiological ecology of a basaltic community of Ridgeia piscesae from the Juan de Fuca Ridge. Deep Sea Res. Part Oceanogr. Res. Pap. 50, doi: /s (03)00061-x Highlights Spatial and temporal temperature variations experienced by vent macrofauna were studied. Fluctuations in temperature often corresponded with the tidal cycle. Temperatures were typically well below lethal temperatures for all species.
33 34 Appendix A1 Relationship between average temperature recorded by all individual loggers and the standard deviation. Average is from the full 8 month deployment


")

34 35 Appendix A2 Logger G10 from the ruary 2011 lunar cycle high correspondence with tidal signal Pressure (mbar) Logger G10 from the ruary 2011 lunar cycle high correspondence with tidal signal Pressure (mbar) Logger G12 from the ruary 2011 lunar cycle low correspondence with tidal signal
Deep Sea Communities: Diversity of the Deep A Classroom Activity for Ocean Gazing Episode #29: A 60-ton wakeup call
 Deep Sea Communities: Diversity of the Deep A Classroom Activity for Ocean Gazing Episode #29: A 60-ton wakeup call Written by: Breea Govenar, Woods Hole Oceanographic Institution Edited by: Lisa Lawrence,
Role of thermal conditions in habitat selection by hydrothermal vent gastropods
 MARINE ECOLOGY PROGRESS SERIES Vol. 305: 1 15, 2005 Published December 23 Mar Ecol Prog Ser OPEN ACCESS FEATURE ARTICLE Role of thermal conditions in habitat selection by hydrothermal vent gastropods Amanda
East Pacific Rise. Hydrothermal vent ecology - Larval supply, colonization, and community development. Biogeography of hydrothermal vent fauna
 149 sites visually confirmed as active hydrothermal vents Hydrothermal vent ecology - Larval supply, colonization, and community development Presented by: Stace Beaulieu InterRidge Coordinator and Research
General Oceanography Geology 105 Expedition 14 Dive & Discover Explorations of the Seafloor See Due Date in Greensheet or in Module Area of Canvas
 General Oceanography Name Geology 105 Expedition 14 Dive & Discover Explorations of the Seafloor See Due Date in Greensheet or in Module Area of Canvas Expedition Objective: In this expedition, we will
Habitat Associations in Gastropod Species at East Pacific Rise Hydrothermal Vents (9 50 N)
") Reference: Biol. Bull. 212: 185 194. (June 2007) 2007 Marine Biological Laboratory Habitat Associations in Gastropod Species at East Pacific Rise Hydrothermal Vents (9 50 N) SUSAN W. MILLS 1, *, LAUREN
Reference: Biol. Bull. 212: 185 194. (June 2007) 2007 Marine Biological Laboratory Habitat Associations in Gastropod Species at East Pacific Rise Hydrothermal Vents (9 50 N) SUSAN W. MILLS 1, *, LAUREN
Earth / Environmental Science. Ch. 14 THE OCEAN FLOOR
 Earth / Environmental Science Ch. 14 THE OCEAN FLOOR The Blue Planet Nearly 70% of the Earth s surface is covered by the global ocean It was not until the 1800s that the ocean became an important focus
Image courtesy Lau ISS Scientists. Donna Blackman, current chair of the R2K Steering Committee Scripps Institution of Oceanography
 Image courtesy Lau ISS Scientists Donna Blackman, current chair of the R2K Steering Committee Scripps Institution of Oceanography 1 meter Endeavour hydrothermal vent chimneys, Juan de Fuca Ridge An integrated,
The physiological condition of the hydrothermal vent mussel, Bathymodiolus thermophilus at two sites on the East Pacific Rise
 The physiological condition of the hydrothermal vent mussel, Bathymodiolus thermophilus at two sites on the East Pacific Rise Joanne E. Glanville The Pennsylvania State University Mentors: Breea Govenar
General Oceanography Geology 105 Expedition 8 Plate Boundaries Beneath the Sea Complete by Thursday at 11:00 PM
 General Oceanography Geology 105 Expedition 8 Plate Boundaries Beneath the Sea Complete by Thursday at 11:00 PM Name Expedition Objectives Learn about the types of plate boundaries and their key characteristics
May 07- June 02 John McDonough: Ocean Exploration An Investigation of the Deep Coral Lophellia pertusa in the Northern Gulf of Mexico
 ALVIN REPORTS 2006 May 07- June 02 John McDonough: Ocean Exploration An Investigation of the Deep Coral Lophellia pertusa in the Northern Gulf of Mexico Quantifying Elemental Fluxes and Fluid Origins at
Describe methods to be used to undertake the activity:
 3 Marine scientific research Alteration, extension or removal of a permitted marine structure Prospecting Discharge of sediments from iron sand prospecting and exploration Exploration Incidental discharge
IMPORTANT FACTS HYDROTHERMAL VENTS OCCUR WHERE HIGH TEMPERATURE WATER IS COMING INTO THE OCEANS. First discovered in 1977 by Bob Ballard.
 HYDROTHERMAL VENTS IMPORTANT FACTS HYDROTHERMAL VENTS OCCUR WHERE HIGH TEMPERATURE WATER IS COMING INTO THE OCEANS. First discovered in 1977 by Bob Ballard. HOW THEY WORK * COLD OVERLYING SEAWATER PENETRATES
Growth and longevity of the tubeworm Ridgeia piscesae in the variable diffuse flow habitats of the Juan de Fuca Ridge
 Vol. 344: 143 157, 2007 doi: 10.3354/meps06710 MARINE ECOLOGY PROGRESS SERIES Mar Ecol Prog Ser Published August 23 Growth and longevity of the tubeworm Ridgeia piscesae in the variable diffuse flow habitats
THE ROLE OF OCEAN OBSERVATORIES IN CLIMATE CHANGE MONITORING, MULTI-HAZARD EARLY WARNING AND DISASTER RISK REDUCTION
 THE ROLE OF OCEAN OBSERVATORIES IN CLIMATE CHANGE MONITORING, MULTI-HAZARD EARLY WARNING AND DISASTER RISK REDUCTION Tania L. Insua, Moran, K., De Leo, F., Sastri, A., Heesemann, M., Dewey, R. UNOOSA Conference
Temporal trends in vent fluid iron and sulfide chemistry following the 2005/2006 eruption at East Pacific Rise, N
 Volume 14, Number 4 17 April 2013 doi:10.1002/ggge.20088 ISSN: 1525-2027 Temporal trends in vent fluid iron and sulfide chemistry following the 2005/2006 eruption at East Pacific Rise, 9 50 0 N Mustafa
BIOLOGICAL OCEANOGRAPHY
 BIOLOGICAL OCEANOGRAPHY AN INTRODUCTION 0 ^ J ty - y\ 2 S CAROL M. LALLI and TIMOTHY R. PARSONS University of British Columbia, Vancouver, Canada PERGAMON PRESS OXFORD NEW YORK SEOUL TOKYO ABOUT THIS VOLUME
General Oceanography Geology 105 Expedition 8 Plate Boundaries Beneath the Sea
 General Oceanography Geology 105 Expedition 8 Plate Boundaries Beneath the Sea Name Not attempting to answer questions on expeditions will result in point deductions on course workbook (two or more blank
Fluid-Rock Interactions and the Sub-Seafloor Biosphere
 Fluid-Rock Interactions and the Sub-Seafloor Biosphere BACKGROUND DATA Examples of Key Scientific Questions (OOI Science Plan) Scientific Priorities (San Juan Meeting) Example ORION Experiments (San Juan
Arctic Ocean Biology. from the surface to the deep sea
 Arctic Ocean Biology from the surface to the deep sea Christina Bienhold Helmholtz Max Planck Research Group for Deep Sea Ecology and Technology cbienhol@mpi-bremen.de ACCESS Summerschool, Bremen, Germany
Non-NDSF Vehicle Science Reports
 Non-NDSF Vehicle Science Reports Control Vehicle Debbie Kelley Presenter (if no SIO rep present) Control Vehicle Heavy lift capability of 1300 kg at 5000 m with sub-meter control on package placement Contact:
Week 3 Intro to Hydrothermal Activity and Event Plumes (aka Megaplumes) from Submarine Eruptions
 from Submarine Eruptions") Week 3 Intro to Hydrothermal Activity and Event Plumes (aka Megaplumes) from Submarine Eruptions Hydrothermal Processes overview General comments vent types: Focused flow, diffuse flow chronic plumes over
Week 3 Intro to Hydrothermal Activity and Event Plumes (aka Megaplumes) from Submarine Eruptions Hydrothermal Processes overview General comments vent types: Focused flow, diffuse flow chronic plumes over
Fine-scale Survey of Right and Humpback Whale Prey Abundance and Distribution
 DISTRIBUTION STATEMENT A: Approved for public release; distribution is unlimited. Fine-scale Survey of Right and Humpback Whale Prey Abundance and Distribution Joseph D. Warren School of Marine and Atmospheric
Deep Trouble! Common Problems for Ocean Observatories - Eos
 Deep Trouble! Common Problems for Ocean Observatories Ocean Observing Infrastructure and Sensing Technical Lessons Learned and Best Practices; Moss Landing, California, 23 25 September 2016 Members of
2015: A YEAR IN REVIEW F.S. ANSLOW
 2015: A YEAR IN REVIEW F.S. ANSLOW 1 INTRODUCTION Recently, three of the major centres for global climate monitoring determined with high confidence that 2015 was the warmest year on record, globally.
Chapter 7 Benthic deep-sea carbonates: reefs and seeps
 Chapter 7 Benthic deep-sea carbonates: reefs and seeps Carbonates are formed across most latitudes and they are not restricted to shallow water but are also found in all but the deepest abyssal and hadal
Commonwealth of the Northern Mariana Islands Passive Acoustic Monitoring Site SAI2 Saipan Island, East Side
 Commonwealth of the Northern Mariana Islands Passive Acoustic Monitoring Site SAI2 Saipan Island, East Side Ecological Acoustic Recorder (EAR) 20-May-2007 to 15-Aug-2008 Level 1 Analysis of Passive Acoustic
Hydrothermal Chemistry/ Reverse Weathering. Marine Chemistry Seminar
 Hydrothermal Chemistry/ Reverse Weathering Marine Chemistry Seminar 1974 Drever, The Sea Chapter 10:The Magnesium Problem 1979 Edmonds et al., Ridge Crest Hydrothermal Activity and the Balances of Major
OCEAN/ESS 410. Lab 10. Geological Mapping of the East Pacific Rise
 Lab 10. Geological Mapping of the East Pacific Rise In this map you are going to be working with GeoMapApp to look at a very high resolution bathymetry map of the East Pacific Rise and at photographs taken
Abstract The most scientifically diverse and technologically advanced component of the National Science Foundations
 AXIAL SEAMOUNT - WIRED AND RESTLESS: A Cabled Submarine Network Enables Real-time, Tracking of a Mid-Ocean Ridge Eruption and Live Video of an Active Hydrothermal System Juan de Fuca Ridge, NE Pacific
POST CABLE INSTALLATION THERMAL MONITORING PROGRAM LONG ISLAND REPLACEMENT CABLE PROJECT NORWALK, CT OSI JOB# 08ES069
 28 July 2009 Mark D. Driscoll, M.S. Senior Water Resources Scientist. 888 Worcester Street, Suite 2 Wellesley, MA 02482 SUBJECT: FINAL REPORT POST CABLE INSTALLATION THERMAL MONITORING PROGRAM LONG ISLAND
Ed Ross 1, David Fissel 1, Humfrey Melling 2. ASL Environmental Sciences Inc. Victoria, British Columbia V8M 1Z5
 Spatial Variability of Sea Ice Drafts in the Continental Margin of the Canadian Beaufort Sea from a Dense Array of Moored Upward Looking Sonar Instruments Ed Ross 1, David Fissel 1, Humfrey Melling 2 1
A dual sensor device to estimate fluid flow velocity at diffuse hydrothermal vents
 Please note that this is an author-produced PDF of an article accepted for publication following peer review. The definitive publisher-authenticated version is available on the publisher Web site Deep
Managing Impacts of Deep-seA resource exploitation - the MIDAS project. Phil Weaver Seascape Consultants Romsey, UK
 Managing Impacts of Deep-seA resource exploitation - the MIDAS project Phil Weaver Seascape Consultants Romsey, UK Seas at Risk workshop, Brussels 5 th November 2014 Total number of ISA Contractors Number
NEW SEAFLOOR INSTALLATIONS REQUIRE ULTRA-HIGH RESOLUTION SURVEYS
 NEW SEAFLOOR INSTALLATIONS REQUIRE ULTRA-HIGH RESOLUTION SURVEYS Donald Hussong (Fugro Seafloor Surveys, Inc.) dhussong@fugro.com Fugro Seafloor Surveys, Inc., 1100 Dexter Avenue North (Suite 100), Seattle,
A - Piton de la Fournaise activity
 OVPF-IPGP August 2018 Page 1/7 Monthly bulletin of the Piton de la Fournaise Volcanological Observatory ISSN ISSN 2610-5101 A - Piton de la Fournaise activity PITON DE LA FOURNAISE (VNUM #233020) Latitude:
UNOLS DeSSC Meeting December 14, 2014 DeSSC New-Users Program Introductions Part 2
 University-National Oceanographic Laboratory System ~UNOLS ~ Deep Submergence Science Committee Meeting UNOLS DeSSC Meeting December 14, 2014 DeSSC New-Users Program Introductions Part 2 AIDA FAROUGH Looking
Winds and Global Circulation
 Winds and Global Circulation Atmospheric Pressure Winds Global Wind and Pressure Patterns Oceans and Ocean Currents El Nino How is Energy Transported to its escape zones? Both atmospheric and ocean transport
PHYSICAL PROPERTIES TAHOE.UCDAVIS.EDU 8
 PHYSICAL PROPERTIES 8 Lake surface level Daily since 1900 Lake surface level varies throughout the year. Lake level rises due to high stream inflow, groundwater inflow, and precipitation directly onto
Biological long-term experiments in 2500 m water depth at the LTER observatory HAUSGARTEN
 Biological long-term experiments in 2500 m water depth at the LTER observatory HAUSGARTEN T. Soltwedel, C. Hasemann, M. Jacob, I. Schewe Alfred-Wegener-Institut Helmholtz-Zentrum für Polar- und Meeresforschung
Final Report for DOEI Project: Bottom Interaction in Long Range Acoustic Propagation
 Final Report for DOEI Project: Bottom Interaction in Long Range Acoustic Propagation Ralph A. Stephen Woods Hole Oceanographic Institution 360 Woods Hole Road (MS#24) Woods Hole, MA 02543 phone: (508)
A dual sensor device to estimate fluid flow velocity at diffuse hydrothermal vents 4 5
 1 Instruments and methods 2 3 A dual sensor device to estimate fluid flow velocity at diffuse hydrothermal vents 4 5 J. Sarrazin a, *, P. Rodier a, M.K. Tivey b, H. Singh b, A. Schultz c, P.M. Sarradin
7. Deep Sea Reducing Habitats. Deep-Sea Reducing Habitats
 7. Deep Sea Reducing Habitats History of Deep Sea Exploration Discovery of hydrothermal vents Hydrothermal Vents Living in reducing environments Chemosynthesis Life history strategies Other Reducing Habitats
Benthic Deep Ocean Zone. By: Amanda, Alyssa, Mason, and Skai
 Benthic Deep Ocean Zone By: Amanda, Alyssa, Mason, and Skai The Benthic Zone The darkest, deepest, and best part of the ocean Benthic Zone Basic Info The Benthic Zone is located at the bottom of the ocean,
Mozambique. General Climate. UNDP Climate Change Country Profiles. C. McSweeney 1, M. New 1,2 and G. Lizcano 1
 UNDP Climate Change Country Profiles Mozambique C. McSweeney 1, M. New 1,2 and G. Lizcano 1 1. School of Geography and Environment, University of Oxford. 2.Tyndall Centre for Climate Change Research http://country-profiles.geog.ox.ac.uk
Studying the Ocean Using Live Data
 Studying the Ocean Using Live Data Overview The Argo buoy project is a major oceanographic study that harnesses the power of automated unmanned buoys traveling the world s oceans (http://www.argo.ucsd.edu/).
Seafloor Spreading and Paleomagnetism Activity
 Name: PART A: Ocean Bottom Profile Background: Seafloor spreading is the hypothesis that the sea floor moves sideways away from the crest of the mid- ocean ridge. It is estimated that 20 volcanic eruptions
Offshore Video Survey and Oceanographic Analysis: Georges Bank to the Chesapeake project
 Non-Technical Synopsis of the Offshore Video Survey and Oceanographic Analysis: Georges Bank to the Chesapeake project Executive Summary Dave Bethoney Kristin Kleisner Mark Anderson Changsheng Chen Bradley
Hydrothermal vents from the Azores
 Hydrothermal vents from the Azores Ana Colaço Center of IMAR from University of Azores Departement of Oceanography and Fisheries 1 Hydrothermal vents are zones of fluid expulsion from the sea floor, normally
2. Explain why there are these two predominate elevations. (Hint: think about isostasy and the type of materials we used to demonstrate buoyancy).
.") IDS 102 Plate Tectonics Questions Part I: Observations- Four maps of world are positioned around the room. Answer the questions associated with each map and record your general observations about the maps.
IDS 102 Plate Tectonics Questions Part I: Observations- Four maps of world are positioned around the room. Answer the questions associated with each map and record your general observations about the maps.
EVALUATING HEAT FLOW AS A TOOL FOR ASSESSING GEOTHERMAL RESOURCES
 PROCEEDINGS, Thirtieth Workshop on Geothermal Reservoir Engineering Stanford University, Stanford, California, January 31-February 2, 2005 SGP-TR-176 EVALUATING HEAT FLOW AS A TOOL FOR ASSESSING GEOTHERMAL
Blue and Fin Whale Habitat Modeling from Long-Term Year-Round Passive Acoustic Data from the Southern California Bight
 DISTRIBUTION STATEMENT A. Approved for public release; distribution is unlimited. Blue and Fin Whale Habitat Modeling from Long-Term Year-Round Passive Acoustic Data from the Southern California Bight
Shape of the seafloor. Shape of the seafloor. Shape of the seafloor. Shape of the seafloor. Shape of the seafloor. Shape of the seafloor
 Multibeam echo sounders - Research vessel Scripps Institution of Oceanography R/V Roger Revelle depth Source: Scripps Institution of Oceanography http://woodshole.er.usgs.gov/project-pages/caribbean/movie1.html
EVALUATION OF ALGORITHM PERFORMANCE 2012/13 GAS YEAR SCALING FACTOR AND WEATHER CORRECTION FACTOR
 EVALUATION OF ALGORITHM PERFORMANCE /3 GAS YEAR SCALING FACTOR AND WEATHER CORRECTION FACTOR. Background The annual gas year algorithm performance evaluation normally considers three sources of information
OIMB GK12 CURRICULUM HYDROTHERMAL VENT FORMATION
 5 th Grade 60 minutes HYDROTHERMAL VENT FORMATION Adapted from For Sea Oregon Science Content Standards: 5.2 Interaction and Change: Force, energy, matter, and organisms interact within living and nonliving
Submersible investigation of unconfirmed western Miami Terrace habitat
 Submersible investigation of unconfirmed western Miami Terrace habitat Prepared By: Brian K. Walker, Ph.D. Nova Southeastern University Oceanographic Center 6/08/2015 On June 5, 2015 Nova Southeastern
The North Atlantic Oscillation: Climatic Significance and Environmental Impact
 1 The North Atlantic Oscillation: Climatic Significance and Environmental Impact James W. Hurrell National Center for Atmospheric Research Climate and Global Dynamics Division, Climate Analysis Section
Marine Heat Flow Measurements Information Brochure
 Marine Heat Flow Measurements Information Brochure 5 1 2 3 4 5 5 6 7 8 5 9 10 11 12 13 14 5 15 16 17 18 19 20 21 5 22 0 200 400 600 800 1000 1200 1400 1600 Time (s) What is the use of heat flow measurements?
Nova Scotia Department of Fisheries and Aquaculture. Environmental Monitoring Program Summary
 Nova Scotia Department of Fisheries and Aquaculture Environmental Monitoring Program Summary 2015 Table of Contents 1 Environmental Monitoring Program Overview... 1 2 2015 EMP... 5 2.1 Level I... 5 2.1.1
Archimer
 Please note that this is an author-produced PDF of an article accepted for publication following peer review. The definitive publisher-authenticated version is available on the publisher Web site Marine
Earthquakes. Earthquakes are caused by a sudden release of energy
 Earthquakes Earthquakes are caused by a sudden release of energy The amount of energy released determines the magnitude of the earthquake Seismic waves carry the energy away from its origin Fig. 18.1 Origin
Lecture 13. Hydrothermal Circulation
 Lecture 13. Hydrothermal Circulation The discovery of hot springs on the ocean floor during the 1970s was one of the most exciting events in the history of oceanography. Although hydrothermal activity
SEA-FLOOR SPREADING. In the 1950 s and early 1960 s detailed study of the oceans revealed the following surprising information:-
 SEA-FLOOR SPREADING In the 1950 s and early 1960 s detailed study of the oceans revealed the following surprising information:- Detailed bathymetric (depth) studies showed that there was an extensive submarine
HIGH RESOLUTION SEDIMENT DYNAMICS IN SALT-WEDGE ESTUARIES
 HIGH RESOLUTION SEDIMENT DYNAMICS IN SALT-WEDGE ESTUARIES Philip Orton, Dept. of Environmental Science and Engineering, Oregon Graduate Institute Douglas Wilson, Dept. of Environmental Science and Engineering,
Homework 5: Background Ocean Water Properties & Stratification
 14 August 2008 MAR 110 HW5: Ocean Properties 1 Homework 5: Background Ocean Water Properties & Stratification The ocean is a heterogeneous mixture of water types - each with its own temperature, salinity,
The Physical Context for Thin Layers in the Coastal Ocean
 The Physical Context for Thin Layers in the Coastal Ocean David M. Fratantoni Physical Oceanography Department Woods Hole Oceanographic Institution Woods Hole, MA 02543 phone: (508) 289-2908 fax: (508)
JP1.7 A NEAR-ANNUAL COUPLED OCEAN-ATMOSPHERE MODE IN THE EQUATORIAL PACIFIC OCEAN
 JP1.7 A NEAR-ANNUAL COUPLED OCEAN-ATMOSPHERE MODE IN THE EQUATORIAL PACIFIC OCEAN Soon-Il An 1, Fei-Fei Jin 1, Jong-Seong Kug 2, In-Sik Kang 2 1 School of Ocean and Earth Science and Technology, University
Full file at
 Essentials of Oceanography, 10e (Trujillo/Keller) Chapter 2 Plate Tectonics and the Ocean Floor Match the term with the appropriate phrase. You may use each answer once, more than once or not at all. A)
Detecting general patterns in fish movement from the analysis of fish tagging data
 18 th World IMACS / MODSIM Congress, Cairns, Australia 13-17 July 2009 http://mssanz.org.au/modsim09 Detecting general patterns in fish movement from the analysis of fish tagging data Daphney Dagneaux,
SIO 210: Data analysis
 SIO 210: Data analysis 1. Sampling and error 2. Basic statistical concepts 3. Time series analysis 4. Mapping 5. Filtering 6. Space-time data 7. Water mass analysis 10/8/18 Reading: DPO Chapter 6 Look
Eurasian Snow Cover Variability and Links with Stratosphere-Troposphere Coupling and Their Potential Use in Seasonal to Decadal Climate Predictions
 US National Oceanic and Atmospheric Administration Climate Test Bed Joint Seminar Series NCEP, Camp Springs, Maryland, 22 June 2011 Eurasian Snow Cover Variability and Links with Stratosphere-Troposphere
Characteristics of the Deep- Sea environment II. Malcolm Clark
 Characteristics of the Deep- Sea environment II Malcolm Clark 4 th Regional Training Workshop, Environmental Perspectives of Deep Sea Mineral Activities, Nadi, Fiji. December 2013 Bathyal and Abyssal regions-the
PSc 201 Chapter 3 Homework. Critical Thinking Questions
 PSc 201 Chapter 3 Homework Critical Thinking Questions 1. (adapted from text) Seawater is denser than fresh water. A ship moving from the Atlantic Ocean into the Great Lakes goes from seawater to fresh
Near-surface Measurements In Support of Electromagnetic Wave Propagation Study
 DISTRIBUTION STATEMENT A. Approved for public release; distribution is unlimited. Near-surface Measurements In Support of Electromagnetic Wave Propagation Study Qing Wang Meteorology Department, Naval
Evolution and Life in the Ocean
 Characteristics of All Living Things Contain matter in a highly organized state Capture, store and transmit energy; all organisms require energy Capable of reproduction Change through time and adapt to
Expedition Dates and Ports 13 July 2013 to 26 July 2013, Astoria, OR to Astoria, OR (mobilization: July 2013, demobilization July 2013)
") Précis for R/V Atlantis/ROV Jason II Expedition AT25-04: Hydrogeologic, Geochemical, and Microbiological Experiments in Young Ocean Crust of the Northeastern Pacific Ocean Using Subseafloor Observatories
Précis for R/V Atlantis/ROV Jason II Expedition AT25-04: Hydrogeologic, Geochemical, and Microbiological Experiments in Young Ocean Crust of the Northeastern Pacific Ocean Using Subseafloor Observatories
Succession: ecological processes structuring vent communities
 Succession: ecological processes structuring vent communities tshank@whoi.edu Collaborators S. Beaulieu, K. Buckman, C. Cary K. Ding, J. Eisen, D. Fornari, A. Fusaro, B. Govenar, S. Humphris G. Luther,
Hydrothermal Vents. "oases. of life." Evolution Physiology Biodiversity. Barbara Zimmermann, Kirstin Claußen, Ulrich Markmann
 Hydrothermal Vents "oases of life." Evolution Physiology Biodiversity Barbara Zimmermann, Kirstin Claußen, Ulrich Markmann Hydrothermal vents are geysers on the seafloor. They continuously spew super-hot,
Objectives: Describe the structure of the ocean floor. Describe light intensity and temperature characteristics at different ocean depths.
 Ocean Structure Virtual Lab What are some characteristics of the ocean and the ocean floor? Earths highest mountains, deepest valleys, and flattest plains are found not on land but under the ocean. Beyond
Form 4 of Schedule 5 of the Exclusive Economic Zone and Continental Shelf (Environmental Effects Permitted Activities) Regulations 2013
 Regulations 2013") FORM 4 Permitted activities: Post-activity report Form 4 of Schedule 5 of the Exclusive Economic Zone and Continental Shelf (Environmental Effects Permitted Activities) Regulations 2013 How to use this
FORM 4 Permitted activities: Post-activity report Form 4 of Schedule 5 of the Exclusive Economic Zone and Continental Shelf (Environmental Effects Permitted Activities) Regulations 2013 How to use this
Near-Field Sturgeon Monitoring for the New NY Bridge at Tappan Zee. Quarterly Report October 1 December 31, 2014
 Near-Field Sturgeon Monitoring for the New NY Bridge at Tappan Zee Quarterly Report October 1 December 31, 2014 Prepared by AKRF, Inc. 7250 Parkway Drive, Suite 210 Hanover, MD 21076 for New York State
Marine Science and Oceanography
 Marine Science and Oceanography Marine geology- study of the ocean floor Physical oceanography- study of waves, currents, and tides Marine biology study of nature and distribution of marine organisms Chemical
OPTIMISING THE TEMPORAL AVERAGING PERIOD OF POINT SURFACE SOLAR RESOURCE MEASUREMENTS FOR CORRELATION WITH AREAL SATELLITE ESTIMATES
 OPTIMISING THE TEMPORAL AVERAGING PERIOD OF POINT SURFACE SOLAR RESOURCE MEASUREMENTS FOR CORRELATION WITH AREAL SATELLITE ESTIMATES Ian Grant Anja Schubert Australian Bureau of Meteorology GPO Box 1289
A Seafloor Spreading Event Captured by Seismometers
 A Seafloor Spreading Event Captured by Seismometers M. Tolstoy, 1 * J. P. Cowen, 2 E. T. Baker, 3 D. J. Fornari, 4 K. H. Rubin, 5 T. M. Shank, 4 F. Waldhauser, 1 D. R. Bohnenstiehl, 1 D. W. Forsyth, 6
Dynamics of Boundary Currents and Marginal Seas
 Dynamics of Boundary Currents and Marginal Seas W. E. Johns University of Miami, RSMAS/MPO 4600 Rickenbacker Causeway, Miami, Florida 33149-1098 Phone (305)361-4054; fax: (305)361-4696; email: wjohns@rsmas.miami.edu
The Sea Floor. Chapter 2
 The Sea Floor Chapter 2 Geography of the Ocean Basins World ocean is the predominant feature on the Earth in total area Northern Hemisphere = 61% of the total area is ocean. Southern Hemisphere = about
THE NEPTUNE CABLED OCEAN OBSERVATORY: OVERVIEW AND SCIENTIFIC OBJECTIVES
 THE NEPTUNE CABLED OCEAN OBSERVATORY: OVERVIEW AND SCIENTIFIC OBJECTIVES Adam Zielinski 1, Chris R. Barnes 2*, Mairi Best 2, Brian Bornhold 2, Kim Juniper 2, Peter Phibbs 2 and Benoit Pirenne 2 1 Department
Breakthrough underwater technology holds promise for improved local tsunami warnings
 Breakthrough underwater technology holds promise for improved local tsunami warnings J. Paros 1, E. Bernard 2, J. Delaney 3, C. Meinig 2, M. Spillane 2, P. Migliacio 1, L. Tang 2, W. Chadwick 4, T. Schaad
Magnetotelluric and Seismic Investigation of Arc Melt Generation, Delivery, and Storage beneath Okmok Volcano
 Magnetotelluric and Seismic Investigation of Arc Melt Generation, Delivery, and Storage beneath Okmok Volcano PIs Ninfa Bennington (U. Wisconsin-Madison) and Kerry Key (Scripps Institution of Oceanography)
Biological and geological dynamics over four years on a high-temperature sulfide structure at the Juan de Fuca Ridge hydrothermal observatory
 MARINE ECOLOGY PROGRESS SERIES Mar Ecol Prog Ser Published July 10 Biological and geological dynamics over four years on a high-temperature sulfide structure at the Juan de Fuca Ridge hydrothermal observatory
Supplementary Materials
 Supplementary Materials S1 : Mixing lines used for calculation of the end-member composition of the Fatu Kapa fluids. S2 : Modified after Von Damm et al. (1991). Plot of the molality of dissolved SiO 2
SUPPLEMENTARY INFORMATION
 SUPPLEMENTARY INFORMATION Supplementary Information for Survival of mussels in extremely acidic waters on a submarine volcano Verena Tunnicliffe *, Kimberley T.A. Davies, David A. Butterfield, Robert W.
Renewable Energy Development and Airborne Wildlife Conservation
 Whitepaper ECHOTRACK TM RADAR ACOUSTIC TM SURVEILLANCE SYSTEM Renewable Energy Development and Airborne Wildlife Conservation Renewable energy developers must meet regulatory requirements to mitigate for
Salmon Aquaculture Environmental Monitoring Data Report. Results of Sampling Program for Year Clayton Rd., RR #1 Sidney, BC V8L 5P6
 Salmon Aquaculture Environmental Monitoring Data Report Results of Sampling Program for Year 2002 by Cindy Wright 1, Bernie Taekema 2, Brenda Burd 1, and Eric McGreer 2 1 Ecostat Research Ltd. 1040 Clayton
Definition: Plate tectonics: the theory that the earth s surface consists of a mosaic of internally rigid plates that move relative to each other
 Chapter 2 Plate tectonics Definition: Plate tectonics: the theory that the earth s surface consists of a mosaic of internally rigid plates that move relative to each other Plate boundaries: zones of faulting
Signature 55 Long Range Current Profiler Data from a Short Deployment Lee Gordon Doppler Ltd. January 7, 2015 This report presents
 Signature 55 Long Range Current Profiler Data from a Short Deployment Lee Gordon Doppler Ltd. lee@dopplerltd.com January 7, 215 This report presents and evaluates data collected by a Nortek Signature 55
Scarred limpets at hydrothermal vents: evidence of predation by deep-sea whelks
 Mar Biol (2007) 152:129 133 DOI 10.1007/s00227-007-0669-1 RESEARCH ARTICLE Scarred limpets at hydrothermal vents: evidence of predation by deep-sea whelks Janet R. Voight Julia D. Sigwart Received: 9 January
The California current is the eastern boundary current that lies to the west of
 I. INTORDUCTION A. California Current System The California current is the eastern boundary current that lies to the west of North America. The California current flows from north, Washington, to south,
PICES W3 [D-504], Sep 22, 2017, 11:40-12:05
![PICES W3 [D-504], Sep 22, 2017, 11:40-12:05](/thumbs/79/79974722.jpg "PICES W3 [D-504], Sep 22, 2017, 11:40-12:05") PICES W3 [D-504], Sep 22, 2017, 11:40-12:05 Individual-based model of chub mackerel (Scomber japonicus) covering from larval to adult stages to project climate-driven changes in their spatial distribution
PICES W3 [D-504], Sep 22, 2017, 11:40-12:05 Individual-based model of chub mackerel (Scomber japonicus) covering from larval to adult stages to project climate-driven changes in their spatial distribution
BIOGRAPHICAL SKETCH. DelWayne R. Bohnenstiehl Lamont-Doherty Earth Observatory of Columbia University 61 Route 9W, Box 1000, Palisades, NY 10964
 Updated May, 2005 BIOGRAPHICAL SKETCH DelWayne R. Bohnenstiehl Lamont-Doherty Earth Observatory of Columbia University 61 Route 9W, Box 1000, Palisades, NY 10964 Phone: (845) 365-8382 (work) E-mail: del@ldeo.columbia.edu
The MARS Deep-Sea Observatory in Monterey Bay
 The MARS Deep-Sea Observatory in Monterey Bay Yanwu Zhang, James Bellingham, Gene Massion, Craig Dawe, Steve Etchemendy, and Christopher Scholin Monterey Bay Aquarium Research Institute Monterey Bay Aquarium