Horizontal Stress. US Stress Regimes: In the eastern United States:
|
|
|
- Damon Booth
- 5 years ago
- Views:
Transcription
1 Horizontal Stress 1. In the last 30 years, horizontal stress has been recognized as a major component of ground control problems. 2. In general, the horizontal stresses found in coal mines are caused by global platetectonic forces. US Stress Regimes: In the eastern United States: 1. The magnitude of the maximum horizontal stress is typically 2 to 3 times greater than the vertical stress. 2. The maximum horizontal stress is usually 40% greater than the minimum. 3. The maximum horizontal is typically oriented E to NE.
2 Near the earth s surface, stream valleys, outcrops, faults, etc. can influence the direction and magnitude of the horizontal stress. Three factors determine the degree to which horizontal stress will affect ground control: 1. Roof Type 2. Entry Orientation 3. Longwall Orientation 1. Roof Type: a. Weak rock is more susceptible to horizontal stress damage. b. Also, thin laminations greatly reduces a roof s ability to resist horizontal stress. 2. Entry Orientation: a. Entries that are aligned parallel to the maximum horizontal stress will suffer less damage. b. Entries that are perpendicular to the maximum horizontal stress will suffer the most damage.
3 3. Longwall Orientation: a. Longwall gobs create zones of stress concentration and stress relief, as determined by: 1) Panel Orientation 2) Retreat Direction 3) Panel Sequencing
4 Panel Orientation: 1. Based on three-dimensional modeling, the optimum angle for minimum horizontal stress in the headgate is = 160 or 20 from outby the headgate. 2. Worst case horizontal stress is = 70 Stress Window: 1. Mining towards a previous gob can create a Stress Window where the horizontal stress is concentrated in a small area between two gobs.
5 Stress Indicators: 1. Compressive-type roof failures 2. Directionality of roof falls 3. Headgate ground control problems Direction Indicators: 1. Elongation of roof falls 2. Direction of tensile cracks 3. Direction of roof bolt hole offsets 4. Direction of striations in fall area 5. Cutter direction across intersections Stress Control: 1. Change Panel Orientation 2. Change Extraction Sequence 3. Reduce Entry Width 4. Angled Crosscuts 5. Three-way Intersections? 6. Artificial Support High Strength, Yield 7. Sacrificial Entries Failed or Caved
6 (Problem Horizontal Stress) - You are planning a mine in the Illinois basin. You suspect that the horizontal stress field is oriented N85E. Please sketch the: north arrow, stress field, optimum panel orientation for minimum horizontal stress on the headgate, best side for the second panel in the sequence. N85E 20 N65E N85E 20 S75E
7 Hemispherical Projections and Stereonets By Keith A. Heasley Hemispherical Projection Hemispherical Projection a method of representing and analyzing the three-dimensional relationships between planes and lines in a twodimensional diagram. 1

8 Hemispherical Projection Great Circle the intersection of a 3D plane and the surface of a sphere. Pole A line perpendicular to the plane and passing through the center of the sphere. Hemispherical Projection 2
9 Hemispherical Projection The great circle and the pole are typically projected on to a horizontal plane from the lower hemisphere a Lower-Hemisphere Projection Hemispherical Projection 3
 and their poles, and analyze the planes.")
10 Stereographic Projection Stereonet Used to help plot the planes (great circles) and their poles, and analyze the planes. Stereonet 4
 Use tracing paper and a pin in the center of the stereonet.")
11 A Plane on a Stereonet A plane in space, can be represented as the direction of dip and the dip For instance, 230 /50 It can be plotted as the Great Circle and/or Pole. Plotting a Plane 1) Use tracing paper and a pin in the center of the stereonet. 2) Mark the north point, center and circumference on the tracing paper. 5
 Rotate the tracing paper to locate the dip direction along the East-West axis of the stereonet.")
12 Plotting a Plane 3) Measure and mark the dip direction on the perimeter of the tracing paper. 130 /50 in this case. Plotting a Plane 4) Rotate the tracing paper to locate the dip direction along the East-West axis of the stereonet. 6
13 Plotting a Plane 5) Count from the perimeter the dip, and draw in the Great Circle. Plotting a Plane 6) Continue counting 90 degrees more and mark the Pole. 7

14 Plotting a Plane 7) Rotate the tracing paper back to North. Analyzing 2 Planes The stereonet can be used to analyze the intersection of two planes. 8
15 Analyzing 2 Planes 1) Mark the great circles and poles from the two planes on the tracing paper. 130 /50 and 250 /30 in this case. Analyzing 2 Planes 2) Rotate the intersection point of the 2 planes to the East-West axis. 9
16 Analyzing 2 Planes 4) Rotate the tracing paper back to the true North position. Analyzing 2 Planes 5) The trend, direction, of the line of intersection is the azimuth of the line between the point of intersection of the great circles and the center of the stereo net (201 ). 10
17 Discontinuity Data The Stereonet can be used to plot and analyze large quantities of discontinuity data using plots of the poles. Discontinuity Data Using contours, the mean and dispersion of preferred joint sets can be analyzed. 11
18 3.6 The Hemispherical Projection Hemispherical projection of a plane The hemispherical projection is a method of representing and analyzing the threedimensional relations between planes and lines on a two-dimensional diagram. It has long been a widely used tool in the field of structural geology and has recently found increasing use for solving engineering problems. The basis of the method and its classic geological applications are described by Phillips (1971). Rock engineering applications are described in detail by Goodman (1976), Hoek and Brown (1980), Priest (1980, 1985) and Hoek and Bray (1981). Application of the technique to the problem of structurally controlled failures around underground mining excavations will be discussed in Chapter 9. Imagine a sphere which is free to move in space so that it can be centered on an inclined plane as illustrated in Figure The intersection of the plane and the surface of the sphere is a great circle, shown at the perimeter of the shaded area in Figure A line perpendicular to the plane and passing through the center of the sphere intersects the sphere at two diametrically opposite points called the poles of the plane. Figure 3.22 The great circle and its poles which define the orientation of the plane.
19 Because the great circle and the pole representing the plane appear on both the upper and lower parts of the sphere, only one hemisphere need be used to plot and manipulate structural data. In rock mechanics, the lower-hemisphere projection is almost always used. The upperhemisphere projection is often used in textbooks on structural geology and can be used for rock mechanics studies if required (for example, Goodman, 1976). The hemispherical projection provides a means of representing the great circle and pole shown in Figure 3.22 on a horizontal plane. As shown in Figure 3.23, this is achieved by connecting all points on the great circle and the pole with the zenith or point at which a vertical through the centre of the sphere intersects the top of the sphere. The hemispherical projections of the great circle and the pole are then given by the intersections of these projection lines with the horizontal plane. Figure 3.23 Stereographic projection of a great circle and its pole on to the horizontal plane from the lower reference hemisphere. The projection shown in Figure 3.23 is known as the stereographic, Wulff, or equal-angle projection. In this projection, any circle on the reference hemisphere projects as a circle on the plane of the projection. This is not the case for an alternative projection known as the Lambert, Schmidt or equal-area projection. The latter projection is better suited than the equal-angle projection for use in the analysis of discontinuity orientation data, to be discussed in section The equal-angle projection has an advantage in terms of the solution of some engineering
20 problems and so will be used here. Most of the constructions to be used are the same for both types of projection. The plotting of planes and their poles is carried out with the aid of a stereonet such as that shown in Figure The great circles representing planes of constant dip are constructed as circular arcs centered on extensions of the east-west axis of the net. The stereonet also contains a series of small circles centered on extensions of the north-south axis. The angle between any two points on a great circle is determined by counting the small circle divisions along the great circle between the two points concerned. Figure 3.24 Meridional stereographic or equal area net. Appendix A sets out the detailed steps required to construct the great circle and pole of a plane using a stereonet such as that shown in Figure This procedure involves centering a piece of tracing paper over the stereonet with a drawing pin, marking the north point, marking the dip direction of the discontinuity measured around the periphery of the net from the north
21 point, rotating the tracing paper so that the dip direction coincides with either the east or the west direction on the stereonet, measuring the dip of the discontinuity by counting great circles from the periphery of the net, and drawing in the appropriate great circle. The pole is plotted by counting a further 90 along the east-west axis from the great circle with the tracing paper still in the rotated position. Figure 3.25 shows the great circle and pole of a plane having a dip of 50 and a dip direction of 230. Appendix A also sets out the steps required to carry out a number of other manipulations. In practice these manipulations are carried out using computer programs. The manual methods are presented here to aid the development of the reader s understanding. Further details are given by Priest (1985, 1992). Figure 3.25 Stereographic projection of the great circle and pole of the plane 230 / Plotting and analysis of discontinuity orientation data An elementary use of the stereo graphic projection is the plotting and analysis of field measurements of discontinuity orientation data. If the poles of planes rather than great circles are plotted, the data for large numbers of discontinuities can be rapidly plotted on one diagram and contoured to give the preferred or mean orientations of the dominant discontinuity sets and a measure of the dispersion of orientations about the mean. Field data may be plotted using a stereonet such as that shown in Figure 3.24 and the method for plotting poles to planes given in Appendix A. However, it is slightly more convenient to use a suitably annotated polar net such as that shown in Figure Using this net, the tracing paper on which the data are to be plotted does not have to be rotated in the east-west position to plot each pole, as it has to be in the procedure described in Appendix A. A piece of tracing paper is centered over the net using a drawing pin, the north point is marked, and the poles are plotted using the dip directions given in bold in Figure 3.26 (the dip direction of the plane 180 ) and measuring the dips from the center of the net along the appropriate dip direction lines. Figure 3.27 shows a plot of poles to 351 individual discontinuities whose orientations were measured at a particular field site. Different symbols have been used for three different types of discontinuity - joints, bedding planes and a fault. The fault has a dip direction of 307 and a dip of 56. Contours of pole concentrations may be drawn for the joints and bedding planes to give
22 Figure 3.26 Polar stereographic net used for plotting poles of geological planes. Figure 3.27 Plot of poles of 351 discontinuities (after Hoek and Brown, 1980).
23 an indication of the preferred orientations of the various discontinuity sets present. Because of the basic principle of its construction, the equal-area projection is best suited to contouring. However, Hoek and Brown (1980) found that provided a suitable counting net (see below) is used, the equal-angle projection can be used to give results that are almost identical with those given by the equal-area method. The essential tool required for pole contouring is a counting net which divides the surface of the reference hemisphere into a number of equal areas. Figure 3.28 shows a counting net containing 100 equal areas for use with the polar stereographic net shown in Figure The most convenient way of using the counting net is to prepare a transparent overlay of it and to centre this overlay on the pole plot by means of a pin through the centre of the net. A piece of tracing paper is mounted on top of the overlay, pierced by the centre pin but fixed by a piece of adhesive tape so that it cannot rotate with respect to the pole plot. Hence one has a sandwich in which the transparent counting net can rotate freely between the pole plot and the piece of tracing paper which are fixed together. Figure 3.28 Counting net used in conjunction with the polar stereographic net shown in Figure 3.26 The first step in the analysis is to count all the poles on the net. This is done by keeping the counting net in a fixed position and counting the number of poles falling within each counting cell. These numbers are noted in pencil on the tracing paper at the centre of each cell. In the case of the data shown in Figure 3.27, the pole count will be 350 since the single fault is treated separately and should not be included in the pole population. Once the total pole population has been established, the numbers of poles which make up different percentages of the total are calculated. The counting net is now rotated to center the densest pole concentrations in counting cells and so the maximum percentage pole concentrations are determined. By further small rotations
24 of the counting net, the contours of decreasing percentage which surround the maximum pole concentrations can be established. Figure 3.29 shows the contours of pole concentrations determined in this way for the data shown in Figure The central orientations of the two major joint sets are 347/22 and 352/83, and that of the bedding planes is 232/81. Figure 3.29 Contours of pole concentrations for the data plotted in Figure The data from which contours of pole concentrations are drawn are usually biased in the manner illustrated by Figure 3.13 and discussed in section When the data are collected from a single borehole or scanline, it will be necessary to correct the observed pole concentrations to account for the fact that the numbers of discontinuities of a given set intersected will depend on the relative orientations of the set and the borehole or scanline. The correction most widely used is that developed by Terzaghi (1965). In the general case, the number of observations within a given counting area must be weighted by a factor 1/cos where is the angle between the borehole axis or the scan line and the normal to the discontinuity. In practice, this correction is generally made only for 70 (Goodman, 1976). For > 70, the Terzaghi correction is not reliable and so the data should be discarded or an alternative approach used. Most universities, research establishments, consulting organizations and mining companies now use computers to plot and contour discontinuity orientation data. For example see Mahtab et al. (1972) and Priest (1985, 1992). The Terzaghi correction described above may be applied as a routine step in such programs. When orientation data have been obtained from boreholes or scan lines of similar length oriented in at least three different directions at a site, it is not necessary to apply the Terzaghi correction to a plot of the combined data if discontinuity frequency is not being considered. In this case, it may be necessary to use the procedure given in Appendix A for rotating data from one plane to another if the data are given with respect to the borehole axis rather than as correctly oriented data.
25 Appendix A - Basic Constructions Using The Hemispherical Projection A.1 Projection of a line The construction described here is used to represent the orientations in space of lines such as the normals to planes or force vectors. The orientation of a line in space is represented by its trend and plunge. The plunge of the line, β (- 90 β 90 ), is the acute angle, measured in a vertical plane, between the line and the horizontal. A line directed in a downward sense has a positive plunge; a line directed upwards has a negative plunge. The trend of the line, (0 360 ), is the azimuth, measured by clockwise rotation from north, of the vertical plane containing the line. The trend is measured in the direction of the plunge. Thus the downwards directed and upwards directed ends of a line have trends that differ by 180. The trend and plunge of a line are analogous to the dip direction and dip of a plane. They are also represented by a three-digit number (trend) and a two-digit number (plunge) separated by a slash, e.g. 045/73. The following steps are used to plot the equatorial or meridional projection of a line: (1) Locate a piece of tracing paper over the meridional net (Figure 3.24) by means of a center pin. Mark the north point and the center and circumference of the net on the tracing paper. When a large number of stereographic analyses are to be carried out, it is useful to prepare several sheets of tracing paper on which the north point and the center and circumference of the circle have been marked. (2) Using the gradations around the perimeter of the net, mark the azimuth corresponding to the trend of the line. (This procedure is illustrated in Figure A.1a for the comparable case of the dip direction of a plane.) (3) Rotate the tracing paper about the center pin until this mark lies on the east-west diameter of the net. (4) Count from the perimeter of the net, along the diameter, the required plunge angle. Mark and label the point using some convenient notation. (5) Rotate the tracing paper so that the north point is returned to its home position. Figure A.1 Plotting the great circle and pole to a plane on the meridional projection.
26 A.2 Projection of the great circle and pole to a plane The construction used to plot the equatorial or meridional projections of the great circle and pole of the plane 130/50 is illustrated in Figure A.1. The following steps are used: (1) Locate a piece of tracing paper over the meridional net (Figure 3.24) by means of a center pin. Mark the north point and the center and circumference of the net. (2) Measure off the dip direction (130 ) clockwise from the north point around the perimeter of the net and mark this direction on the tracing paper (Figure A.1a). Alternatively, measure = 40 from the north point and mark in the strike line, shown dashed in Figure A.la. (3) Rotate the tracing about the center pin until the dip direction lies on the east-west diameter of the net. (4) Count from the perimeter of the net, along the east-west diameter, the dip (50 ) and trace in the great circle passing through this point (Figure A.1b). (5) Plot the pole to the plane by counting a further 90 along the east-west diameter with the dip direction still aligned with the east-west axis (Figure A.1b). Alternatively, the pole may be plotted as the projection of the line 310/40 using the construction described in section A.1. (6) Rotate the tracing paper so that the north point is returned to its home position. The final appearance of the stereographic projection of the great circle and pole to the plane 130/50 is shown in Figure A.1c. A.3 Determination of the line of intersection of two planes Figure A.2 illustrates the construction used to determine the trend and plunge of the line of intersection of the two planes 130/50 and 250/30. (1) Plot the great circle and pole of the plane 130/50 on tracing paper, using the procedure described in section A.2. (2) With the north point on the tracing paper in its home position, mark the dip direction of the second plane (250 ). (3) Rotate the tracing paper about the center pin until the dip direction lies on the east-west diameter. This is most conveniently done in this case by aligning the dip direction (250 ) with the west (270 ) point. (4) Plot the great circle and pole to the plane 250/30 using the procedure described in section A.2, this time counting the dip (30 ) along the west-east diameter from its western end. Figure A.2a shows the appearance of the plot with the north point returned to its home position. (5) Rotate the tracing about the center pin until the intersection of the two great circles which defines the line of intersection of the two planes, lies on the west-east diameter of the net (Figure A.2b). (6) The plunge of the line of intersection is measured as 21 by counting along the west-east axis from the 270 point to the great circle intersection (Figure A.2b). In other problems, it may be more convenient to align the intersection point with the east-west diameter on the eastern side of the net and count the plunge from the east or 90 point. (7) With the tracing in this position, the poles of the two planes lie on the same great circle (Figure A.2b). This provides an alternative means of locating the line of intersection as the pole to the great circle passing through the poles to the two planes. (8) Rotate the tracing to return the north point to its home position.
27 Figure A.2 Determining the trend and plunge of the line of intersection of two planes. (9) Draw a straight line through the center of the net and the point of intersection of the two great circles, to the perimeter of the net. This line defines the trend of the line of intersection, measured as 201 clockwise from the north point (Figure A.2c). A.4 Determination of the angle between two lines in a plane Figure A.3 illustrates the construction used to determine the angle between lines with orientations 240/54 and 140/40 in the plane containing the two lines. If these lines are the normals to two planes, then the construction may be used to deter- mine the angle between the two planes. (1) Plot the projections of the two lines using the procedure described in section A.1. These points are marked A and B in Figure A.3a. (2) Rotate the tracing about the center point until points A and B lie on the same great circle of the stereonet (Figure A.3b). The dip and dip direction of the plane which contains the two lines are measured from the stereonet as 60 and 200, respectively. (3) The angle between the lines is found to be 64 by counting the small circle divisions between A and B along the great circle (Figure A.3b). A.5 Determination of dip direction and true dip A common problem encountered in mapping geological features underground is the determination of the orientation of a feature from the orientations of the traces made by the intersection of the feature with the boundaries of an excavation. Figure A.4 illustrates the steps involved in the determination of the true dip and dip direction of a discontinuity plane in a simple case. A square tunnel has vertical side walls which trend in the direction 140 to 320. The apparent dip of a discontinuity where it intersects the side wall is 40 SE. The same discontinuity intersects the horizontal roof of the tunnel in a line trending The construction uses the following steps:
28 Figure A.3 Determining the angle between two lines. Figure A.4 Determining the dip direction and true dip of a plane.
29 (1) On a piece of tracing paper located over the meridional net, mark the trends of the tunnel side wall ( ) and the intersection of the discontinuity with the horizontal roof ( ) (Figure A.4a). By definition, the latter line represents the strike of the discontinuity. (2) Rotate the tracing so that the line lies on the east-west diameter of the net. (3) Count off the apparent dip (40 ) from the perimeter of the net along the east-west diameter, and mark the point T (Figure A.4b). (4) Rotate the tracing so that the line, defining the strike of the discontinuity, lies on the north-south diameter of the net. (5) With the tracing in this position, draw in the great circle on which the line of apparent dip, T, lies (Figure A.4c). (6) The true dip of the discontinuity which, by definition, is at right angles to the strike of the plane, is measured as 44 from the periphery of the net along the east-west diameter (Figure A.4c). Mark in the line of true dip. (7) Rotate the tracing so that the north point is in the home position. (8) Read the dip direction, clockwise from the north point, as 110 (Figure A.4d). The problem solved in Figure A.4 was simplified by the fact that an observation could be made of the intersection of the discontinuity with a horizontal plane. In the more general case, the dip direction and true dip of a plane can be found if the trend and plunge of its line of intersection with two planes are known. The projections of these two lines are plotted on the meridional net as described in section A.1. Since both of these lines lie in the plane of the discontinuity, the plane must be given by the great circle that passes through the two points. A.6 Rotation about an inclined axis In many problems encountered in structural geology and in geological data collection for rock mechanics purposes, it becomes necessary to rotate poles and lines about an axis that is inclined to the plane of the projection. Such problems arise particularly in the interpretation of data obtained from non-vertical and non-parallel boreholes. It is usual to measure the apparent dips and dip directions of discontinuities intersecting the core with respect to a reference line marked on the core and assumed to be vertical and, say, aligned with the north point. If the borehole is inclined and true orientation of the reference line is known, it is necessary, in the general case, to carry out rotations about both vertical and horizontal axes to orient correctly the reference line and the poles to the discontinuities intersected by the drill core. Rotations of points may be conveniently carried out on the stereographic projection using the small circles centered on the north and south poles of the net. However, if the small circles are to be used to achieve rotation about an inclined axis, it is necessary to first apply an auxiliary rotation to bring the axis of rotation into a horizontal position. After the required rotation has been effected, the auxiliary rotation must be reversed to bring the axis back to its original orientation. Full details of the concepts and procedures used are given by Priest (1985). Figure A.5 shows the construction used to determine the orientation of a line of initial orientation 339/51, after rotation about an axis of orientation 236/37, by 124 in an anticlockwise direction looking down the axis. The grid markings on the net have been omitted from Figure A.5 in the interest of clarity. The following steps are used in this construction:
30 Figure A.5 Rotation about an inclined axis. (1) Locate a piece of tracing paper over the meridional net by means of a center pin and mark the north point and the center and circumference of the net. (2) Plot the projections of the axis of rotation, A, and the line to be rotated, L, drawing a small arrow around A indicating the direction of the required rotation. (3) Rotate the tracing on the center pin so that A lies on the west-east diameter of the net. (4) Rotate the axis to the horizontal by moving A through 37 to A' on the perimeter of the net. At the same time, L must be rotated through 37 along a small circle to L'. (5) Rotate the tracing on the center pin to bring A' to the north point of the net. (6) Rotate L' through the prescribed angle (124 ) by moving it along a small circle in the direction indicated by the small direction arrow near A'. After a rotation of 49, the point leaves the perimeter of the net and re-enters at a position diametrically opposite, to complete the remaining 75 of rotation to point L'r. (7) Rotate the tracing on the center pin to bring A' back to the west point. (8) Reverse the auxiliary rotation by moving L'r along a small circle by 37 in the opposite direction to the initial auxiliary rotation, to the point Lr. (9) Measure the trend and plunge of the rotated point, Lr, as 072 and 30, respectively. If the axis of rotation, A, has a high plunge, it is more convenient to rotate this axis to the center of the projection in the auxiliary rotation, rather than to the perimeter. As before, during this auxiliary rotation, all other points are rotated along small circles by the same amount and in the same direction as A. When the auxiliary rotation has been completed, the specified rotation is achieved by moving the point through a circular arc centered on the center of the projection. The auxiliary rotation is then reversed and the orientation of the rotated line read off.
31
32 Rock Quality Designation (RQD) - RQD is an index used to quantify the quality of the rock mass. The RQD is the percentage of core that is 100 mm (4 in) or greater in length. The ISRM recommends N-size core (54 mm dia.). RQD (%) Core Quality Excellent Good Fair Poor <25 Very Poor Sample Test Question #14 - RQD. Given the drawing below of three 7-ft sections of rock drill core, the Rock Quality Designation (RQD) in percent is most nearly? first row = second row = third row = Total = 16.5 RQD = / 21 = 79% or 80% Note: This would be Good quality rock!
33 Rock Mass Rating (RMR) Rock Mass Rating (RMR) The RMR is a Geomechanical Classification system for use in design. It runs from with 100 being the best rock. The RMR quantifies six rock parameters 1. Uniaxial compressive strength 2. Rock Quality Designation (RQD) 3. Spacing of discontinuities 4. Condition of discontinuities 5. Ground water conditions 6. Orientation of discontinuities. To Obtain a RMR Rating: 1. Use Table 6.9, Section A to obtain the sum of the ratings for the 5 parameters. 2. Use Table 6.9, Section B and Table 6.10 to adjust the rating for discontinuity strike and dip. 3. Use Table 6.9, Section C to classify the rock based on the rating. To Use the RMR Rating: 1. Figure 6.4 and Table 6.9, section D give stand-up times and stable spans for tunnels and chambers. 2. Support Loads can be determined from equations 6.3 and Selection of Roof Supports can be determined from Table Deformation Modulus can be determined from equations 6.5a and 6.5b. 5. Cohesion and Friction Angle can be determined from Table 6.9, section D. \
34 Rock Mass Rating (RMR) Classification System Problem:

35 Rock Mass Rating (RMR) Classification System Table 6.9, Section A
36 Rock Mass Rating Classification System Table 6.9, Sections B, C, and D.


37 Rock Mass Rating (RMR) Classification System Figure 6.4 Stand-Up Time: Rock Mass Rating (RMR) Classification System Table 6.10
38 Rock Mass Rating (RMR) Classification System Table 6.11
39
40 Details of the Rock Mass Rating (RMR ) System: The Geomechanics Classification or the rock mass rating (RMR) system was developed by Bieniawski in This engineering classification of rock masses, utilizes the following six parameters, all of which are measurable in the field and can also be obtained from borehole data: a) Uniaxial compressive strength of intact rock material; b) Rock quality designation (RQD); c) Spacing of discontinuities; d) Condition of discontinuities; e) Groundwater conditions; f) Orientation of discontinuities. To apply the geomechanics classification, the rock mass along the tunnel route is divided into a number of structural regions, i.e., zones in which certain geological features are more or less uniform within each region. The above six classification parameters are determined for each structural region from measurements in the field and entered into the standard input data sheet as shown in Chapter 5 (Fig. 5.17). The geomechanics Classification is presented in Table 6.9. In Section A of Table 6.9, the first five parameters are grouped into five ranges of values. Since the various parameters are not equally important for the overall classification of a rock mass, importance ratings are allocated to the different value ranges of the parameters, a higher rating indicating better rock mass conditions. These ratings were determined from 49 case histories (Bieniawski, 1976). Once the classification parameters are determined; the importance ratings are assigned to each parameter according to Table 6.9, Section A. In this respect, the typical rather than the worst conditions are evaluated. Furthermore, it should be noted that the importance ratings, which are given for discontinuity spacings, apply to rock masses having three sets of discontinuities. Thus, when only two sets of discontinuities are present, a conservative assessment is obtained. After the importance ratings of the classification parameters are established, the ratings for the five parameters listed in Section A of Table 6.9 are summed to yield the basic rock mass rating for the structural region under consideration. At this stage, the influence of the strike and dip of discontinuities is included by adjusting the basic rock mass rating according to Section B of Table 6.9. This step is treated separately because the influence of discontinuity orientation depends upon engineering application, e.g., tunnel (mine), slope, or foundation. It will be noted that the 'value' of the parameter 'discontinuity orientation' is not given in quantitative terms but by qualitative descriptions such as 'favorable'. To facilitate a decision whether strike and dip orientations are favorable or not, reference should be made to Table 6.10, which is based on studies by Wickham, Tiedemann, and Skinner (1972). In the case of civil engineering projects, an adjustment for discontinuity orientations will suffice. For mining applications, other adjustments may be called for such as the stress at depth or a change in stress (Kendorski et at., 1983). After the adjustment for discontinuity orientations, the rock mass is classified according to Section C of Table 6.9, which groups the final (adjusted) rock mass ratings (RMR) into five rock mass classes. Note that the rock mass classes are in groups of twenty ratings each.
41 Next, Section D of Table 6.9 gives the practical meaning of each rock mass class by relating it to specific engineering problems. In the case of tunnels and chambers, the output from the Geomechanics Classification is the stand-up time and the maximum stable rock span for a given rock mass rating, as depicted in Figure 6.4. Support load can be determined from the Geomechanics Classification as (Unal, 1983): 100 RMR P B 100 h t where: P is the support load; B is the tunnel width in meters; RMR is the rock mass rating from the Geomechanics Classification; is the density of the rock, kg/m 3; and, ht is the rock load height in meters (6.3) 100 RMR h t B (6.4) 100 The variation of the rock-loads from equation (6.3) for various rock classes as a function of roof span is presented in Figure 6.5. The Geomechanics Classification provides guidelines for the selection of roof support to ensure long-term stability of various rock mass classes, as given in Table These guidelines depend on such factors as the depth below surface (in situ stress), tunnel size and shape, and the method of excavation. It should be noted that the support measures given in Table 6.11 represent the permanent and not the primary support. Hence, additional concrete lining is not required for structural purposes. However, to ensure full structural stability it is recommended that tunnel monitoring during construction be undertaken to provide a check on stabilization of rock movements. The Geomechanics Classification has been used extensively in mining, particularly in the United States. Initially, Laubscher and Taylor (1976) applied the Geomechanics Classification in asbestos mines in Africa specifically to assess cavability of ore, while Ferguson (1979) extended this classification to mining tunnels and haulages. Since mining is a dynamic process, additional adjustments to the classification parameters were introduced, such as in-situ stresses, as shown in Table Most recently, the Geomechanics Classification was applied to coal mining in the United States (Bieniawski et at, 1980, Newman, 1981, Unal, 1983) and in India (Ghose and Raju, 1981) as well as to hard rock mining in the USA (Cummings et al., 1982, Kendorski et at, 1983). Further details of mining applications are given in Chapter 10 both for hard-rock mining and coal mining. The Geomechanics Classification is also applicable to rock foundations (Bieniawski and Orr, 1976) and slopes (Steffen, 1976). This is a useful feature that can assist with the design of slopes near the tunnel portal as well as allow estimates of the deformability of foundations for such structures as bridges and dams.
42 In the case of rock foundations, the rock mass rating (RMR) from the Geomechanics Classification has been related (Bieniawski, 1978) to the in situ modulus of deformation in the manner shown in Figure The following correlation was obtained: E M 2 RMR 100 (6.5a) where Em is the in situ modulus of deformation in GPa and RMR > 50. Most recently, Serafim and Pereira (1983) provided many results in the range RMR < 50 and proposed a new correlation: E M 10 RMR (6.5b) In the case of rock slopes, the output is given in Section of Table 6.9 as the cohesion and friction of the rock mass. These output values were based on the data compiled by Hoek and Bray (1977). The validity of the output from the Geomechanical Classification to rock slopes was tested by Steffen (1976)) who analyzed 35 slopes or which 20 had failed. He used the Geomechanical Classification to obtain the average values of cohesion and friction angle and then calculated the safety factor based on slope design charts by Hoek and Bray (1977).
43 Rock Mass Classification - The Q-System (Q) The Q-system of rock mass classification was developed in Norway in 1974 by Barton, Lien and Lunde, all of the Norwegian Geotechnical Institute. Its development represented a major contribution to the subject of rock mass classification for a number of reasons: the system was proposed on the basis of an analysis of some 200 tunnel case histories from Scandinavia, it is a quantitative classification system, and it is an engineering system enabling the design of tunnel supports. The Q-system is based on a numerical assessment of the rock mass quality using six different parameters: a) RQD, b) number of joint sets, c) roughness of the most unfavorable joint or discontinuity, d) degree of alteration or filling along the weakest joint, e) water inflow, and f) stress condition. The above six parameters are grouped into three quotients to give the overall rock mass quality Q as follows: Q RQD J * J J n r a J w * SRF RQD Rock Quality Designation J J J J n r a w Joint set number Joint roughness number Joint alteration number Joint water reduction number SRF Stress Reduction Factor In Table 6.13, the numerical values of each of the above parameters are interpreted as follows: The first two parameters represent the overall structure of the rock mass, and their quotient is a relative measure of the block size. The quotient of the third and the fourth parameters is said to be an indicator of the interblock shear strength (of the joints). The fifth parameter is a measure of water pressure, while the sixth parameter is a measure of: a) loosening load in the case of shear zones and clay bearing rock, b) rock stress in competent rock, and c) squeezing and swelling loads in plastic incompetent rock. This sixth parameter is regarded as the 'total stress' parameter. The quotient of the fifth and the sixth parameters describes the 'active stress'. Barton et al. (1974) consider the parameters, Jn, Jr, and Ja, as playing a more important role than joint orientation, and if joint orientation had been included, the classification would have
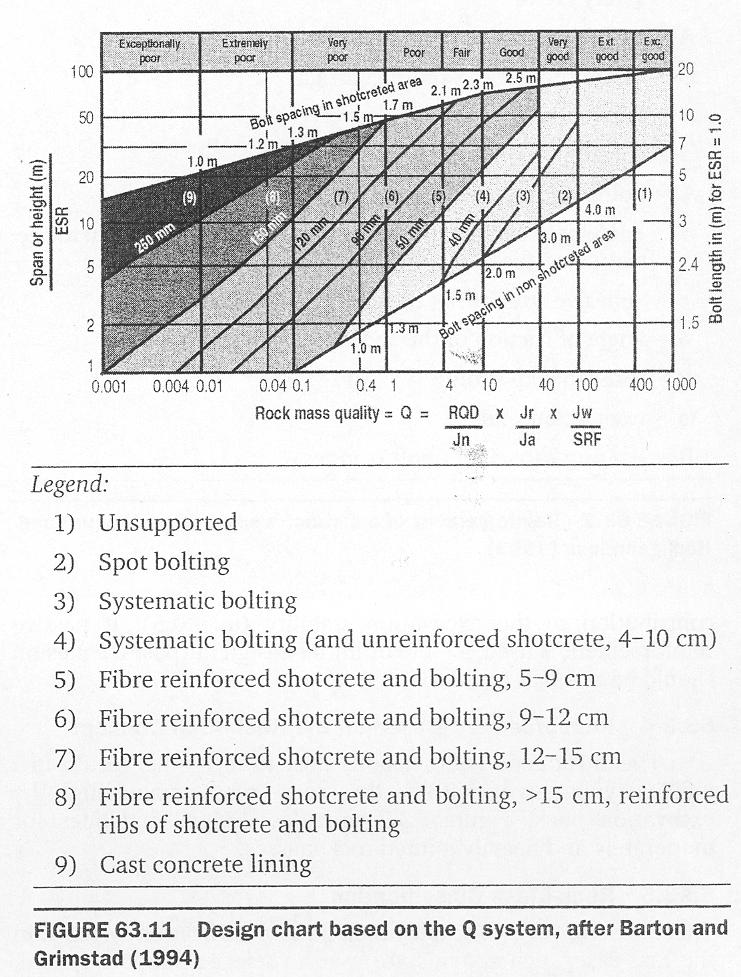
44 been less general. However, orientation is implicit in parameters Jr and Ja, because they apply to the most unfavorable joints. The Q value is related to tunnel support requirements by defining the equivalent dimensions of the excavation. This equivalent dimension, which is a function of both the size and the purpose of the excavation, is obtained by dividing the span, diameter, or the wall height of the excavation by a quantity called the excavation support ratio (ESR). Thus, Equivalentdimension Excavationspan,diameter,or height (meters) ESR The ESR is related to the use for which the excavation is intended and the degree of safety demanded, as shown below. Excavation category ESR No. of cases A. Temporary mine openings B. Vertical shafts: Circular section rectangular/square section C. Permanent mine openings, water tunnels for hydropower (excluding high-pressure penstocks), pilot tunnels, drifts, and headings for large excavations D. Storage rooms, water treatment plants, minor highway and railroad tunnels, surge chambers, access tunnels. E. Power stations, major highway or railroad tunnels, civil defense chambers, portals, intersections F. Underground nuclear power stations, railroad stations, factories The relationship between the index Q and the equivalent dimension of an excavation determines the appropriate support measures. Barton et al. (1974) provide 38 support categories which give estimates of permanent support. For temporary support determination, either Q is increased to 5Q or ESR is increased to 1.5 ESR. For selection of the support measures using the Q-system, the reader should consult the original paper by Barton et al. (1974) or the book by Hoek and Brown (1980). The maximum unsupported span can be obtained as follows: Maximum span (unsupported) = 2(ESR)Q 0.4 (6.7)
45 The relationship between the Q value and the permanent support pressure Proof is calculated from the following equation: Proof Q J r If the number of joint sets is less than three, the equation is expressed as: (6.8) P roof J Q n J r (6.9)
46 Table Classification ratings for Q-system (after Barton, 1976) 1. Descriptions and ratings for the parameter RQD Rock quality designation (RQD, %) A. Very poor 0-25 B. Poor C. Fair D. Good E. Excellent Note: (i) Where RQD is reported or measured as 10, (including 0) a nominal value of 10 is used to evaluate Q. (ii) RQD intervals of 5, i.e. 100, 95, 90, etc. are sufficiently accurate. 2. Descriptions and ratings for the parameter J n Joint set number (J n ) A. Massive, no or few joints B. One joint set 2 C. One joint set plus random 3 D. Two joint sets 4 E. Two joint sets plus random 6 F. Three joint sets 9 G. Three joint sets plus random 12 H. Four or more joint sets, random, heavily jointed, "sugar-cube" etc. 15 J. Crushed rock, earthlike 20 Note: (i) For intersections use (3.0 x J n ) (ii) For portals use (2.0 x J n ) 3. Descriptions and ratings for the parameter J r Joint roughness number a) Rock wall contact and b) Rock wall contact before 10cm shear (J r ) A. Discontinuous joints 4 B. Rough or irregular, undulating 3 C. Smooth, undulating 2 D. Slickensided, undulating 1.5 E. Rough or irregular, planar 1.5 F. Smooth, planar 1.0 G. Slickensided, planar 0.5 Note: (i) Descriptions refer to small scale features and intermediate scale features, in that order. c) No rock wall contact when sheared H. Zone containing clay minerals thick enough to prevent rock wall contact 1.0 J. Sandy, gravelly or crushed zone thick enough to prevent rock wall contact 1.0 Note: (ii) Add 1.0 if the mean spacing of the relevant joint set is greater than 3 m. (iii) J r = 0.5 can be used for planar slickensided joints having lineations, provided the lineations are orientated for minimum strength.
47 Table 6.13 (continued) 4. Descriptions and ratings for the parameter J a Joint alteration number (J a ) ( r ) a) Rock wall contact (approx.) A. Tightly healed, hard, non-softening, impermeable filling i.e. quartz or epidote 0.75 (-) B. Unaltered joint walls, surface staining only 1.0 (25-35 ) C. Slightly altered joint walls. Non-softening mineral coatings, sandy particles, clay-free disintegrated rock tec. 2.0 (25-30 ) D. Silty-, or sandy-clay coatings, small clay fraction (non-soft.) 3.0 (20-25 ) E. Softening or low friction clay mineral coatings, i.e. kaolinite or mica. Also chlorite, talc, gypsum, graphite etc., and small quantities of swelling clays. 4.0 (8-16 ) b) Rock wall contact before 10cm shear F. Sandy particles, clay-free disintegrated rock etc. 4.0 (25-30 ) G. Strongly over-consolidated non-softening clay mineral fillings (continuous, but < 5 mm thickness) 6.0 (16-24 ) H. Medium or low over-consolidation, softening, clay mineral fillings (continuous but < 5 mm thickness) 8.0 (12-16 ) J. Swelling-clay fillings, i.e. montmorillonite (continuous, but < 5mm thickness). Value of J a depends on percent of swelling clay-size particles, and access to water etc (6-12 ) c) No rock wall contact when sheared K. Zones or bands of disintegrated or crushed rock and clay (see 6,8,or G, H, J for description of clay condition) 8-12 (6-24 ) L. Zones or bands of silty- or sandy-clay, small clay fraction (non-softening) 5.0 (-) M. Thick, continuous zones or bands of clay (see G, H, J for 10,13 description of clay condition) or (6-24 ) 5. Descriptions and ratings for the parameter J w Joint water reduction factor (J w ) Approx. water pres. (kg/cm2) A. Dry excavations or minor inflow, i.e. < 5 I/min. locally 1.0 < 1 B. Medium inflow or pressure, occasional outwash of joint fillings C. Large inflow or high pressure in competent rock with unfilled joints D. Large inflow or high pressure, considerable outwash of joint fillings E. Exceptionally high inflow or water pressure at blasting, decaying with time > 10 F. Exceptionally high inflow or water pressure continuing without noticeable decay > 10 Note: (i) Factors C to F are crude estimates. Increase J w if drainage measures are installed. (ii) Special problems caused by ice formation are not considered. 6. Description and ratings for parameter SRF Stress reduction factor (SRF) a) Weakness zones intersecting excavation, which may cause loosening of rock mass when tunnel is excavated. A. Multiple occurrences of weakness zones containing clay or chemically disintegrated rock, very loose surrounding rock (any depth) 10 B. Single weakness zones containing clay or chemically disintegrated rock (depth of excavation 50m) 5
48 Table 6.13 (continued) C. Single weakness zones containing clay or chemically disintegrated rock (depth of excavation > 50 m) 2.5 D. Multiple shear zones in competent rock (clay-free), loose surrounding rock (any depth) 7.5 E. Single shear zones in competent rock (clay-free) (depth of excavation 50m) 5.0 F. Single shear zones in competent rock (clay-free) (depth of excavation > 50m) 2.5 G. Loose open joints, heavily jointed or 'sugar cube' etc. (any depth) 5.0 Note: (i) Reduce these values of SRF by 25-50% if the relevant shear zones only influence but do not intersect the excavation. b) Competent rock, rock stress problems c / 1 t / 1 (SRF) H. Low stress, near surface > 200 > J. Medium stress K. High stress, very tight structure (usually favorable to stability, may be unfavorable for wall stability) L. Mild rockburst (massive rock) M. Heavy rock burst (massive rock) < 2.5 < Note: (ii) For strongly anisotropic virgin stress field (if measured): when 5 1 / 3 10, reduce c and t to 0.8 c and 0.8 t. When 1 / 3 > 10, reduce c and t to 0.6 c and 0.6 t, where: c = unconfined compression strength, and, t = tensile strength (point load) and 1 and 3 are the major and minor principal stresses. (iii) Few case records available where depth of crown below surface is less than span width. Suggest SRF increase from 2.5 to 5 for such cases (see H). c) Squeezing rock: plastic flow of incompetent rock under the influence of high rock pressure (SRF) N. Mild squeezing rock pressure 5-10 O. Heavy squeezing rock pressure d) Swelling rock: chemical swelling activity depending on presence of water P. Mild swelling rock pressure 5-10 R. Heavy swelling rock pressure Additional notes on the use of Table 6.13 When making estimates of the rock mass quality (Q) the following guidelines should be followed, in addition to the notes listed above: 1. When borecore is unavailable, RQD can be estimated from the number of joints per unit volume, in which the number of joints per meter for each joint set are added. A simple relation can be used to convert this number to RQD for the case of clay-free rock masses: RQD = J v (approx.) Where: J v = total number of joints per m 3 ; (RQD = 100 for J v < 4.5) 2. The parameter J n representing the number of joint sets will often be affected by foliation, schistocity, slately cleavage or bedding etc. If strongly developed these parallel 'joints' should obviously be counted as a complete joint set. However, if there are few 'joints' visible, or only occasional breaks in borecore due to these features, then it will be more appropriate to count them as 'random joints' when evaluating J n. 3. The parameters J r and J a (representing shear strength) should be relevant to the weakest significant joint set or clay filled discontinuity in the given zone. However, if the joint set or discontinuity with the minimum value of (J r /J a ) is favorably oriented for stability, then a second, less favorably oriented joint set or discontinuity may sometimes be of more significance, and its higher value of J r /J a should be used when evaluating Q. The value of (J r /J a ) should in fact relate to the surface most likely to allow failure to initiate.
49 4. When a rock mass contains clay, the factor SRF appropriate to loosening loads should be evaluated. In such cases the strength of the intact rock is of little interest. However, when jointing is minimal and clay is completely absent the strength of the intact rock may become the weakest link, and the stability will then depend on the ratio rock-stress/rock-strength. 5. The compressive and tensile strengths ( c and t ) of the intact rock should be evaluated in the saturated condition if this is appropriate to present or future in situ conditions. A very conservative estimate of strength should be made for those rocks that deteriorate when exposed to moist or saturated conditions.
50
An introduction to the Rock Mass index (RMi) and its applications
 and its applications") Reference: A. Palmström, www.rockmass.net An introduction to the Rock Mass index (RMi) and its applications by Arild Palmström, Ph.D. 1 Introduction Construction materials commonly used in civil engineering
Reference: A. Palmström, www.rockmass.net An introduction to the Rock Mass index (RMi) and its applications by Arild Palmström, Ph.D. 1 Introduction Construction materials commonly used in civil engineering
Underground Excavation Design Classification
 Underground Excavation Design Underground Excavation Design Classification Alfred H. Zettler alfred.zettler@gmx.at Rock Quality Designation Measurement and calculation of RQD Rock Quality Designation index
COMPARING THE RMR, Q, AND RMi CLASSIFICATION SYSTEMS
 COMPARING THE RMR, Q, AND RMi CLASSIFICATION SYSTEMS PART 2: CORRELATIONS OF THE THREE SYSTEMS by Arild Palmström, Ph.D. RockMass AS, Oslo, Norway In Part 1, it was shown how the input parameters to the
Quantitative Classification of Rock Mass
 Quantitative Classification of Rock Mass Description of Joints: Orientation, Persistence, Roughness, Wall Strength, Aperture, Filling, Seepage, Number of sets, Block size, spacing. ISRM commission s i
HANDBOOK. Using the Q-system. Rock mass classification and support design
 HANDBOOK Using the Q-system Rock mass classification and support design Oslo, April 2013 For further information on this handbook please contact: NGI Postboks 3930 Ullevål Stadion 0806 OSLO Norway www.ngi.no
NNN99. Rock Engineering for the Next Very Large Underground Detector. D. Lee Petersen CNA Consulting Engineers
 NNN99 Rock Engineering for the Next Very Large Underground Detector D. Lee Petersen Overview Rock engineering 101 Cavern size & shape Construction methods Feasibility Historical projects Numerical modeling
Session 3: Geology and Rock Mechanics Fundamentals
 Session 3: Geology and Rock Mechanics Fundamentals Geotechnical Engineering Appreciation Course (Jointly organised by IES Academy and GeoSS) Dr Zhou Yingxin, Senior Principal Engineer, DSTA Adjuct Associate
Empirical Design in Geotechnical Engineering
 EOSC433: Geotechnical Engineering Practice & Design Lecture 5: Empirical Design (Rock Mass Classification & Characterization) 1of 42 Erik Eberhardt UBC Geological Engineering EOSC 433 (2013) Empirical
Open Pit Rockslide Runout
 EOSC433/536: Geological Engineering Practice I Rock Engineering Lecture 5: Empirical Design & Rock Mass Characterization 1of 46 Erik Eberhardt UBC Geological Engineering EOSC 433 (2017) Open Pit Rockslide
MEMORANDUM SUBJECT: CERTIFICATE IN ROCK MECHANICS PAPER 1 : THEORY SUBJECT CODE: COMRMC MODERATOR: H YILMAZ EXAMINATION DATE: OCTOBER 2017 TIME:
 MEMORANDUM SUBJECT: CERTIFICATE IN ROCK MECHANICS PAPER 1 : THEORY EXAMINER: WM BESTER SUBJECT CODE: COMRMC EXAMINATION DATE: OCTOBER 2017 TIME: MODERATOR: H YILMAZ TOTAL MARKS: [100] PASS MARK: (60%)
Best practice rock engineering handbook for other mines
 Safety in Mines Research Advisory Committee Final Report Best practice rock engineering handbook for other mines T R Stacey Research Agency : SRK Consulting Project Number : OTH 602 Date : December 2001
Instructional Objectives. Why use mass classification? What is rock mass classification? 3 Pillars of empirical design and rock mass classification
 GE 6477 DISCONTINUOUS ROCK 5. Rock Mass Classification and Empirical Design Dr. Norbert H. Maerz Missouri University of Science and Technology (573) 341-6714 norbert@mst.edu Instructional Objectives 1.
rock mass structure characteristics accurate and precise
 Introduction Geotechnical data provides information on rock mass and structure characteristics which will be relied upon for slope and underground design at the Back River deposits. It is important that
Kinematic Analysis Underground Wedges
 EOSC433: Geotechnical Engineering Practice & Design Supplementary Notes: Wedge Volume Calculation 1 of 16 Erik Eberhardt UBC Geological Engineering EOSC 433 Kinematic Analysis Underground Wedges The minimum
Collection and use of geological data in rock engineering
 Published in ISRM News Journal, 997, pp. - Collection and use of geological data in rock engineering by Arild Palmström "I see almost no research effort being devoted to the generation of the basic input
LAB 1: ORIENTATION OF LINES AND PLANES
 LAB 1: ORIENTATION OF LINES AND PLANES Read the introductory section, chapter 1, pages 1-3, of the manual by Rowland et al (2007) and make sure you understand the concepts of bearing, strike, dip, trend,
Application of Core Logging Data to generate a 3D Geotechnical Block Model
 Application of Core Logging Data to generate a 3D Geotechnical Block Model Engineering Geology and Innovation: Research Infrastructure - Sustainable Development (I.A.E.G) Eleftheria Vagkli, M.Sc. Senior
Huaman A., Cabrera J. and Samaniego A. SRK Consulting (Peru) Introduction ABSTRACT
 Introduction ABSTRACT") Managing and validating limited borehole geotechnical information for rock mass characterization purposes experience in Peruvian practice for open pit mine projects Huaman A., Cabrera J. and Samaniego
Managing and validating limited borehole geotechnical information for rock mass characterization purposes experience in Peruvian practice for open pit mine projects Huaman A., Cabrera J. and Samaniego
Rock mass classification systems
 Authors: Syed Muntazir Abbas (TU Bergakademie Freiberg, Geotechnical Institute, and National Centre of Excellence in Geology, University of Peshawar) & Prof. Dr. habil. Heinz Konietzky (TU Bergakademie
ROCK SLOPE STABILITY ANALYSES
 Chapter 5 ROCK SLOPE STABILITY ANALYSES 5.1 ROCK MASS CLASSIFICATION In a mountainous region, construction of road corridor requires original and modified slopes to be stable (Sharma et al. 2013). The
Structurally controlled instability in tunnels
 Structurally controlled instability in tunnels Introduction In tunnels excavated in jointed rock masses at relatively shallow depth, the most common types of failure are those involving wedges falling
Interactive 3D Sketchupbook
 THE UNIVERSITY OF SYDNEY - SCHOOL OF GEOSCIENCES Interactive 3D Sketchupbook Patrice F. Rey CHAPTER 1 Orienting Planes and Lines 1 Interactive 1.1 Strike, dip and dip direction In a 3D space, planar surfaces
Determination of stope geometry in jointed rock mass at Pongkor Underground Gold Mine
 Volume 5, Number 2, April 2009, pp.63-68 [TECHNICAL NOTES] Determination of stope geometry in jointed rock mass at Pongkor Underground Gold Mine Budi SULISTIANTO *, M. Safrudin SULAIMAN **, Ridho Kresna
Introduction and Background
 Introduction and Background Itasca Consulting Group, Inc. (Itasca) has been participating in the geomechanical design of the underground 118-Zone at the Capstone Minto Mine (Minto) in the Yukon, in northwestern
Evaluation of Structural Geology of Jabal Omar
 International Journal of Engineering Research and Development e-issn: 2278-067X, p-issn: 2278-800X, www.ijerd.com Volume 11, Issue 01 (January 2015), PP.67-72 Dafalla Siddig Dafalla * and Ibrahim Abdel
7. Foundation and Slope Stability
 The Asian Nuclear Safety Network 7. Foundation and Slope Stability (SER 2.5.4 & 2.5.5) Taek-Mo SHIM k147stm@kins.re.kr Korea Institute of Nuclear Safety Structural Systems and Site Evaluation Department
ENGINEERING GEOLOGY AND ROCK ENGINEERING
 1 ENGINEERING GEOLOGY AND ROCK ENGINEERING HANDBOOK NO. 2 Norwegian Group for Rock Mechanics (NBG) www.bergmekanikk.com Prepared in co-operation with Norwegian Tunnelling Society (NFF) Issued in 2000 SECRETARIAT:
SYLLABUS AND REFERENCES FOR THE STRATA CONTROL CERTIFICATE. METALLIFEROUS MINING OPTION Updated November 1998
 CHAMBER OF MINES OF SOUTH AFRICA SYLLABUS AND REFERENCES FOR THE STRATA CONTROL CERTIFICATE METALLIFEROUS MINING OPTION Updated November 1998 1 PART 1 : THEORY 1.1 Basic principles of rock engineering
ROCK MASS PROPERTIES FOR TUNNELLING
 ROCK MASS PROPERTIES FOR TUNNELLING Robert Bertuzzi 2 nd November 2017 1 Driver Estimating the strength and deformation characteristics of a rock mass for tunnel design is generally based on empiricism
Excavation method in Goushfill mine
 International Journal of Engineering and Technology, 2 (3) (2013) 225-229 Science Publishing Corporation www.sciencepubco.com/index.php/ijet Excavation method in Goushfill mine Masoud Cheraghi Seifabad*,
Rock-Quality Study at Tunnel Site in the Kameng Hydro-Electric Project, Bichom, Arunachal Pradesh, India
 Open access e-journal Earth Science India, eissn: 0974 8350 Vol. 9 (I), January, 2016, pp. 21-28 http://www.earthscienceindia.info/ Rock-Quality Study at Tunnel Site in the Kameng Hydro-Electric Project,
25th International Conference on Ground Control in Mining
 ANALYTICAL INVESTIGATION OF SHAFT DAMAGES AT WEST ELK MINE Tim Ross, Senior Associate Agapito Associates, Inc. Golden, CO, USA Bo Yu, Senior Engineer Agapito Associates, Inc. Grand Junction, CO, USA Chris
ENGINEERING GEOLOGY AND ROCK MECHANICS
 ENGINEERING GEOLOGY AND ROCK MECHANICS SKAA 2712 ENGINEERING PROPERTIES OF ROCK MASSES PROF. MADYA DR. EDY TONNIZAM BIN MOHAMAD DEPT. OF GEOTECHNICS AND TRANSPORTATION FACULTY OF CIVIL ENGINEERING UTM
Most Used Rock Mass Classifications for Underground Opening
 American J. of Engineering and Applied Sciences 3 (2): 403-411, 2010 ISSN 1941-7020 2010 Science Publications Most Used Rock Mass Classifications for Underground Opening Al-Jbori A ssim and Zhang Yong
Instructional Objectives
 GE 6477 DISCONTINUOUS ROCK 3. Description of Discontinuities Dr. Norbert H. Maerz Missouri University of Science and Technology (573) 341-6714 norbert@mst.edu Instructional Objectives 1. List the ISRM
SYLLABUS AND REFERENCES FOR THE STRATA CONTROL CERTIFICATE COAL MINING OPTION
 CHAMBER OF MINES OS SOUTH AFRICA SYLLABUS AND REFERENCES FOR THE STRATA CONTROL CERTIFICATE COAL MINING OPTION 1. PART 1 : THEORY 1.1 Basic principles of rock engineering 1.1.1 Terms, definitions and basic
Numerical modelling for estimation of first weighting distance in longwall coal mining - A case study
 University of Wollongong Research Online Coal Operators' Conference Faculty of Engineering and Information Sciences 2012 Numerical modelling for estimation of first weighting distance in longwall coal
1. classic definition = study of deformed rocks in the upper crust
 Structural Geology I. Introduction 1. classic definition = study of deformed rocks in the upper crust deformed includes translation, rotation, and strain (change of shape) All rocks are deformed in some
Rock slope rock wedge stability
 Engineering manual No. 28 Updated: 02/2018 Rock slope rock wedge stability Program: Rock stability File: Demo_manual_28.gsk The aim of the chapter of this engineering manual is to explain a rock slope
The effect of discontinuities on stability of rock blocks in tunnel
 International Journal of the Physical Sciences Vol. 6(31), pp. 7132-7138, 30 November, 2011 Available online at http://www.academicjournals.org/ijps DOI: 10.5897/IJPS11.777 ISSN 1992-1950 2011 Academic
Correlation between Rock mass rating, Q-system and Rock mass index based on field data
 Correlation between Rock mass rating, Q-system and Rock mass index based on field data Amine SOUFI, Lahcen BAHI, Latifa OUADIF, Jamal Eddine KISSAI Laboratory of Applied Geophysics, Geotechnics, Engineering
BLOCK SIZE AND BLOCK SIZE DISTRIBUTION
 Paper presented at the Workshop on "Reliablity of classification systems" in connection with the GeoEng000 conference, Melbourne, 8 November 000 BLOCK SIZE AND BLOCK SIZE DISTRIBUTION by Arild Palmström,
Structural Geology, GEOL 330 Fold mapping lab: Even folds get parasites Spring, 2012
 Structural Geology, GEOL 330 Name: Fold mapping lab: Even folds get parasites Spring, 2012 This exercise is meant to mimic a field experience in which you, the student, will measure beddingcleavage relationships
Relationship between RMR b and GSI based on in situ data
 Relationship between RMR b and GSI based on in situ data F. Ceballos Civil Engineer, Técnicas y Proyectos S.A. (TYPSA), Madrid, Spain. C. Olalla, R. Jiménez Professors, Technical University of Madrid,
Rock Mechanics and Seismology Laboratory
 CAEE 211 Geology Laboratory 6 Lab Date: 29 July 2016 Rock Mechanics and Seismology Laboratory Due Date: 5 August 2016 Attendance (based on signing): 30 points Submitting Student Name: Members of laboratory
EXAMINATION PAPER MEMORANDUM
 EXAMINATION PAPER MEMORANDUM SUBJECT: CERTIFICATE IN ROCK MECHANICS PAPER 3.1 : HARD ROCK TABULAR EXAMINER: PJ LE ROUX SUBJECT CODE: COMRMC EXAMINATION DATE: MAY 2015 TIME: MODERATOR: WM BESTER TOTAL MARKS:
Numerical analysis of K0 to tunnels in rock masses exhibiting strain-softening behaviour (Case study in Sardasht dam tunnel, NW Iran)
") International Research Journal of Applied and Basic Sciences 2013 Available online at www.irjabs.com ISSN 2251-838X / Vol, 4 (6): 1572-1581 Science Explorer Publications Numerical analysis of K0 to tunnels
International Research Journal of Applied and Basic Sciences 2013 Available online at www.irjabs.com ISSN 2251-838X / Vol, 4 (6): 1572-1581 Science Explorer Publications Numerical analysis of K0 to tunnels
Estimation of rock cavability in jointed roof in longwall mining
 University of Wollongong Research Online Coal Operators' Conference Faculty of Engineering and Information Sciences 2013 Estimation of rock cavability in jointed roof in longwall mining Alireza Jabinpoor
ROCK MASS CHARATERISATION: A COMPARISON OF THE MRMR AND IRMR CLASSIFICATION SYSTEMS. G P Dyke AngloGold Ashanti 1
 ROCK MASS CHARATERISATION: A COMPARISON OF THE MRMR AND IRMR CLASSIFICATION SYSTEMS AngloGold Ashanti 1 Synopsis The MRMR Classification System was developed specifically for mining applications, namely
Appendix 6 Geotechnical report
 Page 56 Appendix 6 Geotechnical report 1. Introduction The following provides an initial and preliminary description/assessment of the overall geology, the likely ground conditions and preliminary geotechnical
Causes of Dynamic Overbreak and Control Measures Taken at the Alborz Tunnel, Iran
 University of Wollongong Research Online Coal Operators' Conference Faculty of Engineering and Information Sciences 2015 Causes of Dynamic Overbreak and Control Measures Taken at the Alborz Tunnel, Iran
ROCK MASS CHARACTERISATION IN ENGINEERING PRACTICE
 Paul MARINOS NTUA, School of Civil Engineering, 9 Iroon Polytechniou str., Athens, 157 80, Greece, e-mail : marinos@central.ntua.gr ROCK MASS CHARACTERISATION IN ENGINEERING PRACTICE 1. INTRODUCTION The
Design of Support System and Stability Evaluation for Underground Workings of Gare Palma Coal Mine A Case Study
 AMSE JOURNALS-AMSE IIETA publication-2017-series: Modelling C; Vol. 78; N 3; pp 303-315 Submitted Sept. 20, 2017; Revised Jan. 04, 2018; Accepted Jan. 05, 2018 Design of Support System and Stability Evaluation
Correlation of Revised BQ System in China and the International Rock Mass Classification Systems
 Journal of Civil Engineering Research 2015, 5(2): 33-38 DOI: 10.5923/j.jce.20150502.03 Correlation of Revised BQ System in China and the Yan Rui-Xin, Shen Yan-Jun * School of Architecture and Civil Engineering,
Critical Borehole Orientations Rock Mechanics Aspects
 Critical Borehole Orientations Rock Mechanics Aspects By R. BRAUN* Abstract This article discusses rock mechanics aspects of the relationship between borehole stability and borehole orientation. Two kinds
Weak Rock - Controlling Ground Deformations
 EOSC 547: Tunnelling & Underground Design Topic 7: Ground Characteristic & Support Reaction Curves 1 of 35 Tunnelling Grad Class (2014) Dr. Erik Eberhardt Weak Rock - Controlling Ground Deformations To
1 of 57 Erik Eberhardt UBC Geological Engineering EOSC 433 (2017) 1. Yes, review of stress and strain but also
 1. Yes, review of stress and strain but also") EOSC433/536: Geological Engineering Practice I Rock Engineering Lecture 4: Kinematic Analysis (Wedge Failure) 1 of 57 Erik Eberhardt UBC Geological Engineering EOSC 433 (2017) Problem Set #1 - Debriefing
EOSC433/536: Geological Engineering Practice I Rock Engineering Lecture 4: Kinematic Analysis (Wedge Failure) 1 of 57 Erik Eberhardt UBC Geological Engineering EOSC 433 (2017) Problem Set #1 - Debriefing
Table of Contents Development of rock engineering 2 When is a rock engineering design acceptable 3 Rock mass classification
 Table of Contents 1 Development of rock engineering...1 1.1 Introduction...1 1.2 Rockbursts and elastic theory...4 1.3 Discontinuous rock masses...6 1.4 Engineering rock mechanics...7 1.5 Geological data
The importance of both geological structures and mining induced stress fractures on the hangingwall stability in a deep level gold mine
 The importance of both geological structures and mining induced stress fractures on the hangingwall stability in a deep level gold mine by G.B. Quaye and G. Guler* Synopsis The deep level gold mining environment
A new design approach for highway rock slope cuts based on ecological environment protection
 A new design approach for highway rock slope cuts based on ecological environment protection T. Lian-jin, Z. Li, W. Yunjie, W. Guang-yuan & Z. Yin-tao College of Architecture and Civil Engineering, Beijing
Geotechnical & Mining Engineering Services
 Geotechnical & Mining Engineering Services Southwest Research Institute San Antonio, Texas A s an independent, nonprofit research and development organization, Southwest Research Institute (SwRI ) uses
ON THE FACE STABILITY OF TUNNELS IN WEAK ROCKS
 33 rd 33 Annual rd Annual General General Conference conference of the Canadian of the Canadian Society for Society Civil Engineering for Civil Engineering 33 e Congrès général annuel de la Société canadienne
Building on Past Experiences Worker Safety
 EOSC433: Geotechnical Engineering Practice & Design Lecture 11: Rock Stabilization Principles 1 of 43 Erik Eberhardt UBC Geological Engineering EOSC 433 (2016) Building on Past Experiences Worker Safety
Geotechnical data from optical and acoustic televiewer surveys
 Geotechnical data from optical and acoustic televiewer surveys by Farrin De Fredrick MAusIMM, Senior Geotechnical Engineer; Ta Nguyen AIG, Geotechnical Engineer; Clive Seymour MAusIMM, Principal; and Gary
PLANES OF WEAKNESS IN ROCKS, ROCK FRCTURES AND FRACTURED ROCK. Contents
 PLANES OF WEAKNESS IN ROCKS, ROCK FRCTURES AND FRACTURED ROCK Contents 7.1 Introduction 7.2 Studies On Jointed Rock Mass 7.2.1 Joint Intensity 7.2.2 Orientation Of Joints 7.2.3 Joint Roughness/Joint Strength
Received 9 February 2015; accepted 6 March 2015; published 12 March 2015
 Open Journal of Geology, 2015, 5, 92-105 Published Online March 2015 in SciRes. http://www.scirp.org/journal/ojg http://dx.doi.org/10.4236/ojg.2015.53009 Analysis of Geomechanical Properties in Terms of
 Rock Slope Analysis Small and Large Scale Failures Mode of Failure Marklands Test To establish the possibility of wedge failure. Plane failure is a special case of wedge failure. Sliding along
Geology 229 Engineering Geology. Lecture 7. Rocks and Concrete as Engineering Material (West, Ch. 6)
") Geology 229 Engineering Geology Lecture 7 Rocks and Concrete as Engineering Material (West, Ch. 6) Outline of this Lecture 1. Rock mass properties Weakness planes control rock mass strength; Rock textures;
Geology 229 Engineering Geology Lecture 7 Rocks and Concrete as Engineering Material (West, Ch. 6) Outline of this Lecture 1. Rock mass properties Weakness planes control rock mass strength; Rock textures;
THE VOUSSOIR BEAM REACTION CURVE
 THE VOUSSOIR BEAM REACTION CURVE Yossef H. Hatzor Ben-Gurion University, Department of Geological and Environmental Sciences Beer-Sheva, Israel, 84105 ABSTRACT: The influence of joint spacing (s) on the
In situ fracturing mechanics stress measurements to improve underground quarry stability analyses
 In situ fracturing mechanics stress measurements to improve underground quarry stability analyses Anna M. Ferrero, Maria R. Migliazza, Andrea Segalini University of Parma, Italy Gian P. Giani University
The effect of installation angle of rock bolts on the stability of rock slopes
 Journal of Novel Applied Sciences Available online at www.jnasci.org 2015 JNAS Journal-2015-4-1/67-71 ISSN 2322-5149 2015 JNAS The effect of installation angle of rock on the stability of rock slopes Mehran
Observational Methods and
 Observational Methods and NATM System for Observational approach to tunnel design Eurocode 7 (EC7) includes the following remarks concerning an observational method. Four requirements shall all be made
H.Öztürk & E.Ünal Department of Mining Engineering, Middle East Technical University, Ankara, Turkey
 17th International Mining Congress and Exhibition of Turkey- IMCET2001, 2001, ISBN 975-395-417-4 Estimation of Lining Thickness Around Circular Shafts H.Öztürk & E.Ünal Department of Mining Engineering,
Answers: Internal Processes and Structures (Isostasy)
") Answers: Internal Processes and Structures (Isostasy) 1. Analyse the adjustment of the crust to changes in loads associated with volcanism, mountain building, erosion, and glaciation by using the concept
Answers: Internal Processes and Structures (Isostasy) 1. Analyse the adjustment of the crust to changes in loads associated with volcanism, mountain building, erosion, and glaciation by using the concept
1. Rock Mechanics and mining engineering
 1. Rock Mechanics and mining engineering 1.1 General concepts Rock mechanics is the theoretical and applied science of the mechanical behavior of rock and rock masses; it is that branch of mechanics concerned
Ground support modelling involving large ground deformation: Simulation of field observations Part 1
 Ground Support 2016 E. Nordlund, T.H. Jones and A. Eitzenberger (eds) Ground support modelling involving large ground deformation: Simulation of field observations Part 1 D.Saiang, Luleå University of
Enhanced Subsurface Interpolation by Geological Cross-Sections by SangGi Hwang, PaiChai University, Korea
 Enhanced Subsurface Interpolation by Geological Cross-Sections by SangGi Hwang, PaiChai University, Korea Abstract Subsurface geological structures, such as bedding, fault planes and ore body, are disturbed
10. GEOTECHNICAL EXPLORATION PROGRAM
 Geotechnical site investigations should be conducted in multiple phases to obtain data for use during the planning and design of the tunnel system. Geotechnical investigations typically are performed in
The Mine Geostress Testing Methods and Design
 Open Journal of Geology, 2014, 4, 622-626 Published Online December 2014 in SciRes. http://www.scirp.org/journal/ojg http://dx.doi.org/10.4236/ojg.2014.412046 The Mine Geostress Testing Methods and Design
Ring Blasting Design Modeling and Optimization
 Ring Blasting Design Modeling and Optimization María Rocha, Rocha Blast Engineers, Spain & Roberto Laredo, Real Miners Consulting S.L., Spain Benjamín Cebrián, Blast-Consult S.L., Spain Abstract Ring blasting
Chapter 6 Bearing Capacity
 Chapter 6 Bearing Capacity 6-1. Scope This chapter provides guidance for the determination of the ultimate and allowable bearing stress values for foundations on rock. The chapter is subdivided into four
Influence of foliation on excavation stability at Rampura Agucha underground mine
 Recent Advances in Rock Engineering (RARE 2016) Influence of foliation on excavation stability at Rampura Agucha underground mine P Yadav, A Panda, M Sonam, B Banerjee, S Parihar, and DC Paneri Geotechnical
Rock parameters for blasting on the highway Split-Dubrovnik
 Rock Engineering in Difficult Ground Conditions Soft Rocks and Karst Vrkljan (ed) 2010 Taylor & Francis Group, London, ISBN 978-0-415-80481-3 Rock parameters for blasting on the highway Split-Dubrovnik
Estimates of rock mass strength and deformation modulus
 Discussion paper # 4 Estimates of rock mass strength and deformation modulus In the preliminary stages of a rock engineering design the need for approximate estimates of rock mass strength and deformation
LICENTIATE THESIS. Evaluation of rock mass strength criteria. Catrin Edelbro
 LICENTIATE THESIS Evaluation of rock mass strength criteria Catrin Edelbro Department of Civil and Environmental Engineering Division of Rock Mechanics BACKGROUND BACKGROUND Correct input data Reliable
Ground Support in Mining and Underground Construction
 Ground Support in Mining and Underground Construction Proceedings of the Fifth International Symposium on Ground Support 28-30 September 2004, Perth, Western Australia Edited by Ernesto Villaescusa Yves
Team Name. Name(s) SSSS Unome Geologic Mapping Test Packet p1
 SSSS Unome Geologic Mapping Test Packet p1") Scioly Summer Study Session 2018-2019 Geologic Mapping Test Packet Written by Unome Instructions 1) This test is based on the 2016 rules for Geologic Mapping. 2) This test is out of 115 points. Questions
Scioly Summer Study Session 2018-2019 Geologic Mapping Test Packet Written by Unome Instructions 1) This test is based on the 2016 rules for Geologic Mapping. 2) This test is out of 115 points. Questions
Stress and Strain. Stress is a force per unit area. Strain is a change in size or shape in response to stress
 Geologic Structures Geologic structures are dynamically-produced patterns or arrangements of rock or sediment that result from, and give information about, forces within the Earth Produced as rocks change
GROUND RESPONSE AND SUPPORT MEASURES FOR PIR PANJAL TUNNEL IN THE HIMALAYAS
 Ground IGC 2009, Response Guntur, and INDIA Support Measures for Pir Panjal Tunnel in the Himalayas GROUND RESPONSE AND SUPPORT MEASURES FOR PIR PANJAL TUNNEL IN THE HIMALAYAS K.S. Rao Professor, Department
Boreholes. Implementation. Boring. Boreholes may be excavated by one of these methods: 1. Auger Boring 2. Wash Boring 3.
 Implementation Boreholes 1. Auger Boring 2. Wash Boring 3. Rotary Drilling Boring Boreholes may be excavated by one of these methods: 4. Percussion Drilling The right choice of method depends on: Ground
A METHOD TO ESTIMATE THE TANGENTIAL STRESSES AROUND UNDERGROUND OPENINGS
 From Palmström A.: RMi a rock mass characterization system for rock engineering purposes. PhD thesis, Oslo University, Norway, 995, 400 p. APPENDIX 9 A METHOD TO ESTIMATE THE TANGENTIAL STRESSES AROUND
J. Paul Guyer, P.E., R.A.
 J. Paul Guyer, P.E., R.A. Paul Guyer is a registered mechanical engineer, civil engineer, fire protection engineer and architect with over 35 years experience in the design of buildings and related infrastructure.
Use of RMR to Improve Determination of the Bearing Resistance of Rock
 Creating Value Delivering Solutions Use of RMR to Improve Determination of the Bearing Resistance of Rock Scott Zang, P.E. Michael Baker Jr., Inc. ASD Design Q v allowable is a presumptive allowable bearing
GEOLOGIC STRUCTURE MAPPING using digital photogrammetry
 Digital photogrammetry provides a cost effective remote means of documenting a mapped rock face while allowing structural mapping to be conducte d from the photographs. Digital photogrammetry allows structural
Gotechnical Investigations and Sampling
 Gotechnical Investigations and Sampling Amit Prashant Indian Institute of Technology Gandhinagar Short Course on Geotechnical Investigations for Structural Engineering 12 14 October, 2017 1 Purpose of
MULTIVARIATE ANALYSIS OF BORE HOLE DISCONTINUITY DATA
 Maerz,. H., and Zhou, W., 999. Multivariate analysis of bore hole discontinuity data. Rock Mechanics for Industry, Proceedings of the 37th US Rock Mechanics Symposium, Vail Colorado, June 6-9, 999, v.,
Successful Construction of a Complex 3D Excavation Using 2D and 3D Modelling
 University of Wollongong Research Online Coal Operators' Conference Faculty of Engineering and Information Sciences 2015 Successful Construction of a Complex 3D Excavation Using 2D and 3D Modelling Yvette
Module 6: Stresses around underground openings. 6.2 STRESSES AROUND UNDERGROUND OPENING contd.
 LECTURE 0 6. STRESSES AROUND UNDERGROUND OPENING contd. CASE : When σ x = 0 For σ x = 0, the maximum tangential stress is three times the applied stress and occurs at the boundary on the X-axis that is
SITE INVESTIGATION 1
 SITE INVESTIGATION 1 Definition The process of determining the layers of natural soil deposits that will underlie a proposed structure and their physical properties is generally referred to as site investigation.
ANALYSIS OF A SLOPE FAILURE IN AN OPEN PIT MINE USING TSLOPE
 ANALYSIS OF A SLOPE FAILURE IN AN OPEN PIT MINE USING TSLOPE 1. Background In 1996 a slope failure occurred at the Round Hill open pit mine, operated by Macraes Mining Company Ltd. The failure as shown