RUPOK An Online Risk Tool for Road Network. Michal Bíl, Jan Kubeček, Rostislav Vodák
|
|
|
- Marian Sullivan
- 5 years ago
- Views:
Transcription
1 RUPOK An Online Risk Tool for Road Network Michal Bíl, Jan Kubeček, Rostislav Vodák

2 RUPOK Online application Interactive webmap Spatial database Includes Hazards, Vulnerabilities, Risks List of critical infrastructures


3 RUPOK
 RUPOK (www.rupok.")
4 A spatial database of road traffic interruptions Data on road traffic incidents Police Road administrators External systems Xml HTTP POST export The Integrated Traffic Information System for the Czech Republic Filters (works automatically) RUPOK ( CLIENT Spatial database


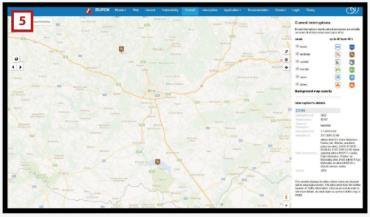
5 No. of interrupted road links Online data on traffic incidents We are able to monitor hazardous processes today Spatial databases provide online data on road closures Animation June 2013 flood Data source: NDIC Jan Feb Mar Apr Jun Jul Aug Sep Oct Nov Dec 2013 June 2013 flood


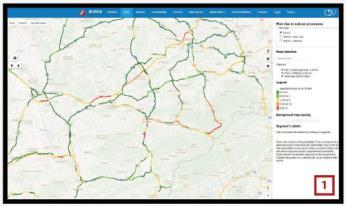
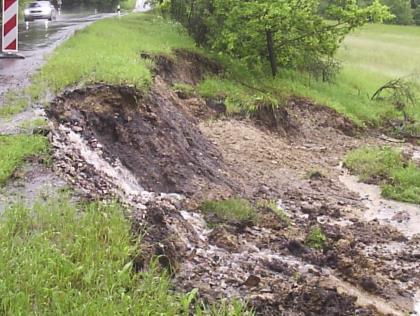
6 Computation of natural hazards along roads Combined Floods Landslides Snow


7 Computation of natural hazards along roads Combined Floods Landslides Snow

8 RUPOK - vulnerabilities DIRECT COSTS Motorway Costs in CZK Local road

9 RUPOK - vulnerabilities INDIRECT COSTS Detour time

10 RUPOK - vulnerabilities INDIRECT COSTS Traffic intensities


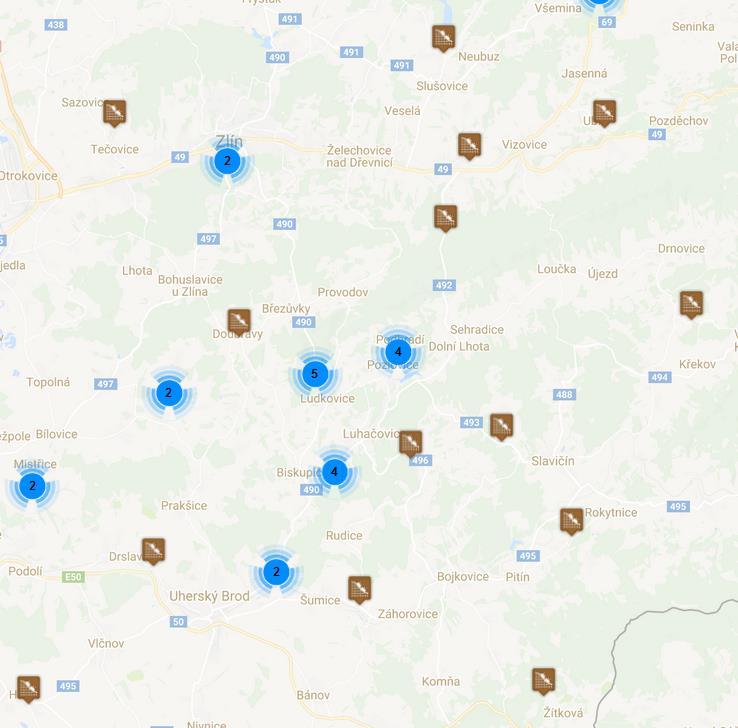
11 Cause of a road blockage RUPOK: Spatial database of road network interruptions ( present)
12 Landslide hazard on transportation links is directly related to A Exposure (spatial information from the official landslide database) B Recorded landslides (real events new traffic interruptions recorded by road administrators) C Regional landslide susceptibility (expert involved) D The road / railway link length


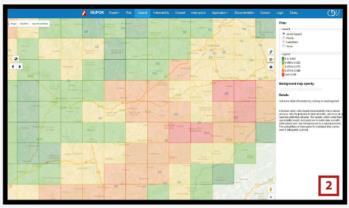
13 Exposure of transportation networks to landslides A Portion of road and railway sections within a landslide zone to all sections in the district [%] Roads Railways More than 50 % of transportation links in a given area are closer than 50 m to a landslide The values based on data from the spatial landslide database administered by the Czech Geological Survey

14 B Recorded landslides using online messages


15 Regions with higher susceptibility to landsliding C Geo-located data on traffic interruptions due to landsliding 7 Landslide susceptibility values as stated by an expert 1 5 Records within the red areas Landslides usually took place on natural slopes Records outside the red areas Landslides usually took place on road or railway embankments or rockfalls 10 Area with the highest landslide susceptibility


16 Transportation link length matters D The longer is a road link the higher is the landslide hazard (probability of a landslide occurrence along a link increases) The higher hazard due to the longer road link % % Road length: 13.6 km Road length: 6.7 km

17 Computation of natural hazards along roads A+B+C+D What is the probability of at least one traffic interruption caused by a landslide over the next year?


18 Visualization of landslide hazard along roads Generalized level Detailed level

19 Distribution of landslide hazard along roads for 3 periods Approx. 99 % of all road links The impacts of 1997 event


20 How reliable are the landslide hazard values? Landslide hazard will decrease over the following period Traffic interruptions are related to computed landslide hazard These links were not interrupted Underestimated landslide hazard (hazard close to 0, but the road interrupted twice)
21 Examples of landslide hazard
 Landslide hazard (%) Very low hazard, but a landslide occurred in the 3 rd")
 Very short road link A landslide occurred at an")
22 Landslide hazard values for 3 periods (1st , 2nd , 3rd ) Landslide hazard (%) Very low hazard, but a landslide occurred in the 3 rd period One landslide recorded No exposure to landslides The lowest regional landslide susceptibility (1) Very short road link A landslide occurred at an artificial slope
 Landslide hazard (%) Medium and constant hazard Three")
 Long road link Rockfalls on steep slopes")
23 Landslide hazard values for 3 periods (1st , 2nd , 3rd ) Landslide hazard (%) Medium and constant hazard Three landslides recorded No exposure to landslides The lowest regional landslide susceptibility (1) Long road link Rockfalls on steep slopes above the road
 Two landslides recorded only within the 1 st period Road exposed to landslides The highest regional landslide susceptibility (10) Long road")
24 Landslide hazard values for 3 periods (1st , 2nd , 3rd ) Landslide hazard (%) High but decreasing hazard Spatial data on landslides (official database) Two landslides recorded only within the 1 st period Road exposed to landslides The highest regional landslide susceptibility (10) Long road link
25 Issues related to state-wide landslide hazard computation State-wide coverage, but low detail (computations based on spatial data, no field works) Source of landsliding: natural or artificial slopes An automated system of traffic blockage data relies on filters which expect correctly written messages (some messages are not then received) Hazard values can be affected by one isolated extreme event
26 Summary A state-wide spatial database of road and railway traffic interruptions due to landsliding (RUPOK.CZ) Landslide hazard was computed for the entire Czech transportation network Data uncertainty even low landslide hazard does not mean that landsliding cannot occur at such places Transportation network administrators should be prepared for traffic blockages and should therefore focus on network resilience improvement as preventive measures
27 Related publications Andrášik, R., Bíl, M., Slovák, R. (2016). How (not) to work with small probabilities: Evaluating the individual risk of railway transport. Risk, Reliability and Safety: Innovating Theory and Practice Proceedings of the 26th European Safety and Reliability Conference, ESREL Bíl, M., Andrášik, R., Zahradníček, P., Kubeček, J., Sedoník, J., Štěpánek, P. (2016). Total water content thresholds for shallow landslides, Outer Western Carpathians. Landslides 13, Bíl, M., Vodák, R., Kubeček, J., Bílová, M., Sedoník, J., (2015): Evaluating Road Network Damage Caused by Natural Disasters in the Czech Republic between 1997 and Transportation Research Part A: Policy and Practice 80, Vodák, R., Bíl, M., Sedoník, J. (2015). Network robustness and random processes. Physica A 428, Bíl, M., Kubeček, J., Andrášik, R., (2014): An Epidemiological Approach to Determining the Risk of Road Damage due to Landslides. Nat Haz. 73 (4),

28 Related publications

29 Thank you RUPOK.CZ Questions? Michal Bíl
GAMINGRE 8/1/ of 7
 FYE 09/30/92 JULY 92 0.00 254,550.00 0.00 0 0 0 0 0 0 0 0 0 254,550.00 0.00 0.00 0.00 0.00 254,550.00 AUG 10,616,710.31 5,299.95 845,656.83 84,565.68 61,084.86 23,480.82 339,734.73 135,893.89 67,946.95
Technical note on seasonal adjustment for M0
 Technical note on seasonal adjustment for M0 July 1, 2013 Contents 1 M0 2 2 Steps in the seasonal adjustment procedure 3 2.1 Pre-adjustment analysis............................... 3 2.2 Seasonal adjustment.................................
1. INTRODUCTION. EXAMPLE OF SECHILIENNE ROCKFALL (France)
") FORM OSE POST-GRADUATE COURSE Landslide vulnerability and risk 1 FORM OSE POST-GRADUATE COURSE Landslide vulnerability and risk 2 FORM OSE POST-GRADUATE COURSE Landslide vulnerability and risk 3 Christophe
FORM OSE POST-GRADUATE COURSE Landslide vulnerability and risk 1 FORM OSE POST-GRADUATE COURSE Landslide vulnerability and risk 2 FORM OSE POST-GRADUATE COURSE Landslide vulnerability and risk 3 Christophe
Hazard assessment based on radar-based rainfall nowcasts at European scale The HAREN project
 Hazard assessment based on radar-based rainfall nowcasts at European scale The HAREN project Marc Berenguer, Daniel Sempere-Torres 3 OPERA radar mosaic OPERA radar mosaic: 213919 133 Precipitation observations
UNCLASSIFIED. Environment, Safety and Health (ESH) Report
 Report") Environment, Safety and Health (ESH) Report Perfect Days On a Perfect Day nobody is hurt, we receive no community complaints, we have no security breaches, we do not breach our environmental permit conditions,
Environment, Safety and Health (ESH) Report Perfect Days On a Perfect Day nobody is hurt, we receive no community complaints, we have no security breaches, we do not breach our environmental permit conditions,
Climatography of the United States No
 Month (1) Min (2) Month(1) Extremes Lowest (2) Temperature ( F) Lowest Month(1) Degree s (1) Base Temp 65 Heating Cooling 100 Number of s (3) Jan 63.9 39.3 51.6 86 1976 16 56.6 1986 20 1976 2 47.5 1973
Climatography of the United States No
 Temperature ( F) Month (1) Min (2) Month(1) Extremes Lowest (2) Lowest Month(1) Degree s (1) Base Temp 65 Heating Cooling 100 Number of s (3) Jan 32.8 21.7 27.3 62 1918 1 35.8 1983-24 1950 29 10.5 1979
Climatography of the United States No
 Climate Division: CA 4 NWS Call Sign: Month (1) Min (2) Month(1) Extremes Lowest (2) Temperature ( F) Lowest Month(1) Degree s (1) Base Temp 65 Heating Cooling 100 Number of s (3) Jan 55.6 39.3 47.5 77
Climatography of the United States No
 Climate Division: CA 5 NWS Call Sign: Month (1) Min (2) Month(1) Extremes Lowest (2) Temperature ( F) Lowest Month(1) Degree s (1) Base Temp 65 Heating Cooling 100 Number of s (3) Jan 56.6 36.5 46.6 81
Climatography of the United States No
 Climate Division: CA 1 NWS Call Sign: Month (1) Min (2) Month(1) Extremes Lowest (2) Temperature ( F) Lowest Month(1) Degree s (1) Base Temp 65 Heating Cooling 100 Number of s (3) Jan 57.9 38.9 48.4 85
Climatography of the United States No
 Climate Division: CA 5 NWS Call Sign: Month (1) Min (2) Month(1) Extremes Lowest (2) Temperature ( F) Lowest Month(1) Degree s (1) Base Temp 65 Heating Cooling 100 Number of s (3) Jan 44.8 25.4 35.1 72
Climatography of the United States No
 Climate Division: CA 4 NWS Call Sign: Month (1) Min (2) Month(1) Extremes Lowest (2) Temperature ( F) Lowest Month(1) Degree s (1) Base Temp 65 Heating Cooling 100 Number of s (3) Jan 49.4 37.5 43.5 73
Climatography of the United States No
 Climate Division: CA 6 NWS Call Sign: Month (1) Min (2) Month(1) Extremes Lowest (2) Temperature ( F) Lowest Month(1) Degree s (1) Base Temp 65 Heating Cooling 100 Number of s (3) Jan 69.4 46.6 58.0 92
Climatography of the United States No
 Climate Division: CA 6 NWS Call Sign: Month (1) Min (2) Month(1) Extremes Lowest (2) Temperature ( F) Lowest Month(1) Degree s (1) Base Temp 65 Heating Cooling 1 Number of s (3) Jan 67.5 42. 54.8 92 1971
Climatography of the United States No
 Climate Division: CA 4 NWS Call Sign: Month (1) Min (2) Month(1) Extremes Lowest (2) Temperature ( F) Lowest Month(1) Degree s (1) Base Temp 65 Heating Cooling 1 Number of s (3) Jan 58.5 38.8 48.7 79 1962
Climatography of the United States No
 Climate Division: CA 1 NWS Call Sign: Month (1) Min (2) Month(1) Extremes Lowest (2) Temperature ( F) Lowest Month(1) Degree s (1) Base Temp 65 Heating Cooling 1 Number of s (3) Jan 57.8 39.5 48.7 85 1962
Climatography of the United States No
 Climate Division: AK 5 NWS Call Sign: ANC Month (1) Min (2) Month(1) Extremes Lowest (2) Temperature ( F) Lowest Month(1) Degree s (1) Base Temp 65 Heating Cooling 90 Number of s (3) Jan 22.2 9.3 15.8
A More Comprehensive Vulnerability Assessment: Flood Damage in Virginia Beach
 A More Comprehensive Vulnerability Assessment: Flood Damage in Virginia Beach By Raj Shah GIS in Water Resources Fall 2017 Introduction One of the most obvious effects of flooding events is death. Humans
Climatography of the United States No
 Climate Division: ND 8 NWS Call Sign: BIS Month (1) Min (2) Month(1) Extremes Lowest (2) Temperature ( F) Lowest Month(1) Degree s (1) Base Temp 65 Heating Cooling 100 Number of s (3) Jan 21.1 -.6 10.2
Climatography of the United States No
 Climate Division: TN 1 NWS Call Sign: Month (1) Min (2) Month(1) Extremes Lowest (2) Temperature ( F) Lowest Month(1) Degree s (1) Base Temp 65 Heating Cooling 100 Number of s (3) Jan 47.6 24.9 36.3 81
Climatography of the United States No
 Climate Division: CA 5 NWS Call Sign: FAT Month (1) Min (2) Month(1) Extremes Lowest (2) Temperature ( F) Lowest Month(1) Degree s (1) Base Temp 65 Heating Cooling 1 Number of s (3) Jan 53.6 38.4 46. 78
Climatography of the United States No
 Climate Division: CA 6 NWS Call Sign: 1L2 N Lon: 118 3W Month (1) Min (2) Month(1) Extremes Lowest (2) Temperature ( F) Lowest Month(1) Degree s (1) Base Temp 65 Heating Cooling 1 Number of s (3) Jan 63.7
Climatography of the United States No
 Climate Division: CA 5 NWS Call Sign: BFL Month (1) Min (2) Month(1) Extremes Lowest (2) Temperature ( F) Lowest Month(1) Degree s (1) Base Temp 65 Heating Cooling 1 Number of s (3) Jan 56.3 39.3 47.8
Impacts of climate change on flooding in the river Meuse
 Impacts of climate change on flooding in the river Meuse Martijn Booij University of Twente,, The Netherlands m.j.booij booij@utwente.nlnl 2003 in the Meuse basin Model appropriateness Appropriate model
Climatography of the United States No
 Climate Division: TN 3 NWS Call Sign: BNA Month (1) Min (2) Month(1) Extremes Lowest (2) Temperature ( F) Lowest Month(1) Degree s (1) Base Temp 65 Heating Cooling 100 Number of s (3) Jan 45.6 27.9 36.8
Computing & Telecommunications Services
 Computing & Telecommunications Services Monthly Report September 214 CaTS Help Desk (937) 775-4827 1-888-775-4827 25 Library Annex helpdesk@wright.edu www.wright.edu/cats/ Table of Contents HEAT Ticket
Integrating Weather Forecasts into Folsom Reservoir Operations
 Integrating Weather Forecasts into Folsom Reservoir Operations California Extreme Precipitation Symposium September 6, 2016 Brad Moore, PE US Army Corps of Engineers Biography Brad Moore is a Lead Civil
Computing & Telecommunications Services Monthly Report January CaTS Help Desk. Wright State University (937)
") January 215 Monthly Report Computing & Telecommunications Services Monthly Report January 215 CaTS Help Desk (937) 775-4827 1-888-775-4827 25 Library Annex helpdesk@wright.edu www.wright.edu/cats/ Last
January 215 Monthly Report Computing & Telecommunications Services Monthly Report January 215 CaTS Help Desk (937) 775-4827 1-888-775-4827 25 Library Annex helpdesk@wright.edu www.wright.edu/cats/ Last
FORECAST-BASED OPERATIONS AT FOLSOM DAM AND LAKE
 FORECAST-BASED OPERATIONS AT FOLSOM DAM AND LAKE 255 237 237 237 217 217 217 200 200 200 0 163 131 Bridging the Gap163Conference 255 0 132 255 0 163 122 The Dana on Mission Bay San Diego, CA January 28,
Climatography of the United States No
 Climate Division: CA 5 NWS Call Sign: Elevation: 6 Feet Lat: 37 Month (1) Min (2) Month(1) Extremes Lowest (2) Temperature ( F) Lowest Month(1) Degree s (1) Base Temp 65 Heating Cooling 1 Number of s (3)
Climatography of the United States No
 Climate Division: CA 4 NWS Call Sign: Elevation: 2 Feet Lat: 37 Month (1) Min (2) Month(1) Extremes Lowest (2) Temperature ( F) Lowest Month(1) Degree s (1) Base Temp 65 Heating Cooling 1 Number of s (3)
Climatography of the United States No
 Climate Division: CA 4 NWS Call Sign: Elevation: 13 Feet Lat: 36 Month (1) Min (2) Month(1) Extremes Lowest (2) Temperature ( F) Lowest Month(1) Degree s (1) Base Temp 65 Heating Cooling 1 Number of s
Climatography of the United States No
 Climate Division: CA 5 NWS Call Sign: Elevation: 1,14 Feet Lat: 36 Month (1) Min (2) Month(1) Extremes Lowest (2) Temperature ( F) Lowest Month(1) Degree s (1) Base Temp 65 Heating Cooling 1 Number of
Climatography of the United States No
 Climate Division: CA 6 NWS Call Sign: LAX Elevation: 1 Feet Lat: 33 Month (1) Min (2) Month(1) Extremes Lowest (2) Temperature ( F) Lowest Month(1) Degree s (1) Base Temp 65 Heating Cooling 1 Number of
Prairie Climate Centre Prairie Climate Atlas. Visualizing Climate Change Projections for the Canadian Prairie Provinces
 Prairie Climate Centre Prairie Climate Atlas Visualizing Climate Change Projections for the Canadian Prairie Provinces Acknowledgements About Us Dr. Danny Blair Dr. Ian Mauro Ryan Smith, MSc Dr. Hank Venema
Climatography of the United States No
 Climate Division: CA 6 NWS Call Sign: TOA Elevation: 11 Feet Lat: 33 2W Temperature ( F) Month (1) Min (2) Month(1) Extremes Lowest (2) Lowest Month(1) Degree s (1) Base Temp 65 Heating Cooling 1 Number
In Centre, Online Classroom Live and Online Classroom Programme Prices
 In Centre, and Online Classroom Programme Prices In Centre Online Classroom Foundation Certificate Bookkeeping Transactions 430 325 300 Bookkeeping Controls 320 245 225 Elements of Costing 320 245 225
Climatography of the United States No
 No. 2 1971-2 Asheville, North Carolina 2881 COOP ID: 46646 Climate Division: CA 4 NWS Call Sign: 8W Month (1) Min (2) Month(1) Extremes Lowest (2) Temperature ( F) Lowest Month(1) Degree s (1) Base Temp
Climatography of the United States No
 No. 2 1971-2 Asheville, North Carolina 2881 COOP ID: 4792 Climate Division: CA 6 NWS Call Sign: Month (1) Min (2) Month(1) Extremes Lowest (2) Temperature ( F) Lowest Month(1) Degree s (1) Base Temp 65
Climatography of the United States No
 No. 2 1971-2 Asheville, North Carolina 2881 COOP ID: 43417 Climate Division: CA 4 NWS Call Sign: N Lon: 121 Month (1) Min (2) Month(1) Extremes Lowest (2) Temperature ( F) Lowest Month(1) Degree s (1)
End-To-End Approach in Early Warning: The Hong Kong Experience
 End-To-End Approach in Early Warning: The Hong Kong Experience M.C. Wong Hong Kong Observatory Hong Kong, China A container vessel collided with the Star Ferry pier during the passage of Typhoon Hope in
Climatography of the United States No
 No. 2 1971-2 Asheville, North Carolina 2881 COOP ID: 4795 Climate Division: CA 6 NWS Call Sign: SBA Month (1) Min (2) Month(1) Extremes Lowest (2) Temperature ( F) Lowest Month(1) Degree s (1) Base Temp
TMC Monthly Operational Summary
 TMC Monthly Operational Summary July 1 Bureau of Transportation Systems Management & Operations (TSMO) NH Department of Transportation s Mission Transportation excellence enhancing the quality of life
Time Series Analysis
 Time Series Analysis A time series is a sequence of observations made: 1) over a continuous time interval, 2) of successive measurements across that interval, 3) using equal spacing between consecutive
Climatography of the United States No
 No. 2 1971-2 Asheville, North Carolina 2881 COOP ID: 46175 Climate Division: CA 6 NWS Call Sign: 3L3 Elevation: 1 Feet Lat: 33 Month (1) Min (2) Month(1) Extremes Lowest (2) Temperature ( F) Lowest Month(1)
Climatography of the United States No
 No. 2 1971-2 Asheville, North Carolina 2881 COOP ID: 42713 Climate Division: CA 7 NWS Call Sign: Elevation: -3 Feet Lat: 32 Month (1) Min (2) Month(1) Extremes Lowest (2) Temperature ( F) Lowest Month(1)
Climatography of the United States No
 Month (1) Min (2) Month(1) Extremes Lowest (2) Temperature ( F) Lowest Month(1) Degree s (1) Base Temp 65 Heating Cooling 100 Number of s (3) 42.6 24.2 33.4 79 1950 25 44.2 1974-16 1994 19 18.8 1977 977
Euro-indicators Working Group
 Euro-indicators Working Group Luxembourg, 9 th & 10 th June 2011 Item 9.4 of the Agenda New developments in EuroMIND estimates Rosa Ruggeri Cannata Doc 309/11 What is EuroMIND? EuroMIND is a Monthly INDicator
Annual Average NYMEX Strip Comparison 7/03/2017
 Annual Average NYMEX Strip Comparison 7/03/2017 To Year to Year Oil Price Deck ($/bbl) change Year change 7/3/2017 6/1/2017 5/1/2017 4/3/2017 3/1/2017 2/1/2017-2.7% 2017 Average -10.4% 47.52 48.84 49.58
Climatography of the United States No
 Month (1) Min (2) Month(1) Extremes Lowest (2) Temperature ( F) Lowest Month(1) Degree s (1) Base Temp 65 Heating Cooling 100 Number of s (3) Jan 54.3 40.1 47.2 75 1998 17 53.0 1995 18 1949 11 41.7 1972
Public Disclosure Copy
 Public Disclosure Authorized LATIN AMERICA AND CARIBBEAN Dominica Social, Urban, Rural and Resilience Global Practice Global Practice IBRD/IDA Investment Project Financing FY 2014 Seq No: 7 ARCHIVED on
Climatography of the United States No
 Climate Division: CA 6 NWS Call Sign: Month (1) Min (2) Month(1) Extremes Lowest (2) Temperature ( F) Lowest Month(1) Degree s (1) Base Temp 65 Heating Cooling 100 Number of s (3) Jan 51.5 35.0 43.3 80
Integrated and Multi-Hazard Disaster Management
 GeoSmart Asia 2016: GI for Disaster Preparedness and Risk Reduction Bandung, Indonesia 12 October 2016 Integrated and Multi-Hazard Disaster Management Lim Choun Sian & Nurfashareena Muhamad Centre for
Climatography of the United States No
 Climate Division: CA 1 NWS Call Sign: Month (1) Min (2) Month(1) Extremes Lowest (2) Temperature ( F) Lowest Month(1) Degree s (1) Base Temp 65 Heating Cooling 100 Number of s (3) Jan 52.4 35.4 43.9 69
Climatography of the United States No
 Climate Division: CA 4 NWS Call Sign: Month (1) Min (2) Month(1) Extremes Lowest (2) Temperature ( F) Lowest Month(1) Degree s (1) Base Temp 65 Heating Cooling 100 Number of s (3) Jan 61.9 42.0 52.0 89
Climatography of the United States No
 Climate Division: CA 2 NWS Call Sign: Month (1) Min (2) Month(1) Extremes Lowest (2) Temperature ( F) Lowest Month(1) Degree s (1) Base Temp 65 Heating Cooling 100 Number of s (3) Jan 55.6 38.8 47.2 81
Climatography of the United States No
 Climate Division: CA 2 NWS Call Sign: Month (1) Min (2) Month(1) Extremes Lowest (2) Temperature ( F) Lowest Month(1) Degree s (1) Base Temp 65 Heating Cooling 100 Number of s (3) Jan 53.5 37.6 45.6 78
Climatography of the United States No
 Climate Division: CA 6 NWS Call Sign: Month (1) Min (2) Month(1) Extremes Lowest (2) Temperature ( F) Lowest Month(1) Degree s (1) Base Temp 65 Heating Cooling 100 Number of s (3) Jan 66.1 38.3 52.2 91
Climatography of the United States No
 Climate Division: CA 1 NWS Call Sign: Month (1) Min (2) Month(1) Extremes Lowest (2) Temperature ( F) Lowest Month(1) Degree s (1) Base Temp 65 Heating Cooling 1 Number of s (3) Jan 56.2 4.7 48.5 79 1962
Climatography of the United States No
 Climate Division: CA 1 NWS Call Sign: Month (1) Min (2) Month(1) Extremes Lowest (2) Temperature ( F) Lowest Month(1) Degree s (1) Base Temp 65 Heating Cooling 100 Number of s (3) Jan 50.2 31.2 40.7 65+
Climatography of the United States No
 Climate Division: CA 4 NWS Call Sign: Month (1) Min (2) Month(1) Extremes Lowest (2) Temperature ( F) Lowest Month(1) Degree s (1) Base Temp 65 Heating Cooling 100 Number of s (3) Jan 61.4 33.1 47.3 82+
Climatography of the United States No
 Climate Division: CA 5 NWS Call Sign: Month (1) Min (2) Month(1) Extremes Lowest (2) Temperature ( F) Lowest Month(1) Degree s (1) Base Temp 65 Heating Cooling 100 Number of s (3) 59.3 31.5 45.4 80 1976
Climatography of the United States No
 Climate Division: CA 7 NWS Call Sign: Month (1) Min (2) Month(1) Extremes Lowest (2) Temperature ( F) Lowest Month(1) Degree s (1) Base Temp 65 Heating Cooling 100 Number of s (3) 44.5 29.3 36.9 69 1951
Climatography of the United States No
 Climate Division: CA 2 NWS Call Sign: Month (1) Min (2) Month(1) Extremes Lowest (2) Temperature ( F) Lowest Month(1) Degree s (1) Base Temp 65 Heating Cooling 100 Number of s (3) 53.3 37.1 45.2 77 1962
Climatography of the United States No
 Climate Division: CA 2 NWS Call Sign: Month (1) Min (2) Month(1) Extremes Lowest (2) Temperature ( F) Lowest Month(1) Degree s (1) Base Temp 65 Heating Cooling 100 Number of s (3) 53.3 31.8 42.6 74+ 1975
Climatography of the United States No
 Climate Division: CA 2 NWS Call Sign: Month (1) Min (2) Month(1) Extremes Lowest (2) Temperature ( F) Lowest Month(1) Degree s (1) Base Temp 65 Heating Cooling 100 Number of s (3) 53.7 32.7 43.2 79 1962
Climatography of the United States No
 Climate Division: CA 6 NWS Call Sign: Month (1) Min (2) Month(1) Extremes Lowest (2) Temperature ( F) Lowest Month(1) Degree s (1) Base Temp 65 Heating Cooling 100 Number of s (3) 68.5 45.7 57.1 90 1971
Climatography of the United States No
 Climate Division: CA 7 NWS Call Sign: Month (1) Min (2) Month(1) Extremes Lowest (2) Temperature ( F) Lowest Month(1) Degree s (1) Base Temp 65 Heating Cooling 100 Number of s (3) 56.0 35.7 45.9 83 1975
Climatography of the United States No
 Climate Division: CA 7 NWS Call Sign: Month (1) Min (2) Month(1) Extremes Lowest (2) Temperature ( F) Lowest Month(1) Degree s (1) Base Temp 65 Heating Cooling 1 Number of s (3) 64.8 45.4 55.1 85 1971
Climatography of the United States No
 Climate Division: CA 7 NWS Call Sign: Month (1) Min (2) Month(1) Extremes Lowest (2) Temperature ( F) Lowest Month(1) Degree s (1) Base Temp 65 Heating Cooling 1 Number of s (3) 65.5 38.7 52.1 87 1962
Climatography of the United States No
 Climate Division: CA 7 NWS Call Sign: Month (1) Min (2) Month(1) Extremes Lowest (2) Temperature ( F) Lowest Month(1) Degree s (1) Base Temp 65 Heating Cooling 100 Number of s (3) 58.8 34.3 46.6 81+ 1948
Climatography of the United States No
 Climate Division: CA 7 NWS Call Sign: Month (1) Min (2) Month(1) Extremes Lowest (2) Temperature ( F) Lowest Month(1) Degree s (1) Base Temp 65 Heating Cooling 100 Number of s (3) 70.4 44.2 57.3 95 1971
TMC Monthly Operational Summary
 TMC Monthly Operational Summary March Bureau of Transportation Systems Management & Operations (TSMO) NH Department of Transportation s Mission Transportation excellence enhancing the quality of life in
Climatography of the United States No
 Climate Division: CA 4 NWS Call Sign: Month (1) Min (2) Month(1) Extremes Lowest (2) Temperature ( F) Lowest Month(1) Degree s (1) Base Temp 65 Heating Cooling 100 Number of s (3) Jan 56.4 43.6 50.0 77
Climatography of the United States No
 Climate Division: CA 7 NWS Call Sign: Month (1) Min (2) Month(1) Extremes Lowest (2) Temperature ( F) Lowest Month(1) Degree s (1) Base Temp 65 Heating Cooling 100 Number of s (3) Jan 54.4 36.9 45.7 77+
Climatography of the United States No
 Climate Division: SC 7 NWS Call Sign: CHS Month (1) Min (2) Month(1) Extremes Lowest (2) Temperature ( F) Lowest Month(1) Degree s (1) Base Temp 65 Heating Cooling 100 Number of s (3) Jan 58.9 36.9 47.9
Effects of climate change on landslide frequencies in landslide prone districts in Sri Lanka; Overview
 Effects of climate change on landslide frequencies in landslide prone districts in Sri Lanka; Overview T. D. Rathnaweera 1)., M. P. Palihawadana 2)., H. L. L. Rangana 3). and Dr. U. P. Nawagamuwa 4). Abstract
In Issue of International Sabo News Letter
 In Issue of International Sabo News Letter I had an opportunity to make a keynote speech on March 18 2003 at the session on Sedimentrelated Issues at the 3rd World Water Forum held in (Kyoto) Japan. Chairing
Average 175, , , , , , ,046 YTD Total 1,098,649 1,509,593 1,868,795 1,418, ,169 1,977,225 2,065,321
 AGRICULTURE 01-Agriculture JUL 2,944-4,465 1,783-146 102 AUG 2,753 6,497 5,321 1,233 1,678 744 1,469 SEP - 4,274 4,183 1,596 - - 238 OCT 2,694 - - 1,032 340-276 NOV 1,979-5,822 637 3,221 1,923 1,532 DEC
Average 175, , , , , , ,940 YTD Total 944,460 1,284,944 1,635,177 1,183, ,954 1,744,134 1,565,640
 AGRICULTURE 01-Agriculture JUL 2,944-4,465 1,783-146 102 AUG 2,753 6,497 5,321 1,233 1,678 744 1,469 SEP - 4,274 4,183 1,596 - - 238 OCT 2,694 - - 1,032 340-276 NOV 1,979-5,822 637 3,221 1,923 1,532 DEC
The AIR Severe Thunderstorm Model for the United States
 The AIR Severe Thunderstorm Model for the United States In 2011, six severe thunderstorms generated insured losses of over USD 1 billion each. Total losses from 24 separate outbreaks that year exceeded
Folsom Dam Water Control Manual Update Joint Federal Project, Folsom Dam
 Folsom Dam Water Control Manual Update Joint Federal Project, Folsom Dam Public Workshop May 28, 2015 Library Galleria 828 I Street, Sacramento, CA US Army Corps of Engineers BUILDING STRONG WELCOME &
ISO Lead Auditor Lean Six Sigma PMP Business Process Improvement Enterprise Risk Management IT Sales Training
 Training Calendar 2014 Public s (ISO LSS PMP BPI ERM IT Sales Training) www.excelledia.com (ISO, LSS, PMP, BPI, ERM, IT, Sales Public s) 1 Schedule Registration JANUARY FEBRUARY 2 days 26 JAN 27 JAN 3
Crop Monitoring in Europe WINTER CEREAL HARDENING IS PROGRESSING WELL. MARS BULLETIN Vol.20 No.12 (2012)
") ONLINE VERSION JRC68576 EUR 24736 EN ISSN 1831-9424 ISSN 1831-9793 Crop Monitoring in Europe MARS BULLETIN Vol.20 No.12 (2012) Issued: 17 December 2012 WINTER CEREAL HARDENING IS PROGRESSING WELL The last
ONLINE VERSION JRC68576 EUR 24736 EN ISSN 1831-9424 ISSN 1831-9793 Crop Monitoring in Europe MARS BULLETIN Vol.20 No.12 (2012) Issued: 17 December 2012 WINTER CEREAL HARDENING IS PROGRESSING WELL The last
Involvement of the Geological Survey of Slovenia in the field of natural hazard risk management
 Involvement of the Geological Survey of Slovenia in the field of natural hazard risk management Špela Kumelj, Mateja Jemec-Auflič, Jernej Jež, Tina Peternel, Blaž Milanič Geohazard group, GeoZS COMLAND
JRC MARS Bulletin Crop monitoring in Europe January 2016 Weakly hardened winter cereals
 Online version Issued: 25January 2016 r JRC MARS Bulletin Vol. 24 No 1 JRC MARS Bulletin Crop monitoring in Europe January 2016 Weakly hardened winter cereals A first cold spell is likely to have caused
How are adding integers and subtracting integers related? Work with a partner. Use integer counters to find 4 2. Remove 2 positive counters.
 . How are adding integers and subtracting integers related? ACTIVITY: Work with a partner. Use integer counters to find 4. Start with 4 positive counters. Remove positive counters. What is the total number
WHEN IS IT EVER GOING TO RAIN? Table of Average Annual Rainfall and Rainfall For Selected Arizona Cities
 WHEN IS IT EVER GOING TO RAIN? Table of Average Annual Rainfall and 2001-2002 Rainfall For Selected Arizona Cities Phoenix Tucson Flagstaff Avg. 2001-2002 Avg. 2001-2002 Avg. 2001-2002 October 0.7 0.0
Winter Season Resource Adequacy Analysis Status Report
 Winter Season Resource Adequacy Analysis Status Report Tom Falin Director Resource Adequacy Planning Markets & Reliability Committee October 26, 2017 Winter Risk Winter Season Resource Adequacy and Capacity
ISO Lead Auditor Lean Six Sigma PMP Business Process Improvement Enterprise Risk Management IT Sales Training
 Training Calendar 2014 Public s (ISO LSS PMP BPI ERM IT Sales Training) (ISO, LSS, PMP, BPI, ERM, IT, Sales Public s) 1 Schedule Registration JANUARY ) FEBRUARY 2 days 26 JAN 27 JAN 3 days 28 JAN 30 JAN
Statistical Models for Rainfall with Applications to Index Insura
 Statistical Models for Rainfall with Applications to April 21, 2008 Overview The idea: Insure farmers against the risk of crop failure, like drought, instead of crop failure itself. It reduces moral hazard
AASHTO Rigid Pavement Design
 AASHTO Rigid Pavement Design Dr. Antonis Michael Frederick University Notes Courtesy of Dr. Christos Drakos University of Florida 1. Introduction Empirical design based on the AASHO road test: Over 200
ISO Lead Auditor Lean Six Sigma PMP Business Process Improvement Enterprise Risk Management IT Sales Training
 Training Calendar 2014 Public s (ISO LSS PMP BPI ERM IT Sales Training) (ISO, LSS, PMP, BPI, ERM, IT, Sales Public s) 1 Schedule Registration JANUARY IMS ) FEBRUARY 2 days 26 JAN 27 JAN 3 days 28 JAN 30
Jayalath Ekanayake Jonas Tappolet Harald Gall Abraham Bernstein. Time variance and defect prediction in software projects: additional figures
 Jayalath Ekanayake Jonas Tappolet Harald Gall Abraham Bernstein TECHNICAL REPORT No. IFI-2.4 Time variance and defect prediction in software projects: additional figures 2 University of Zurich Department
2015 Fall Conditions Report
 2015 Fall Conditions Report Prepared by: Hydrologic Forecast Centre Date: December 21 st, 2015 Table of Contents Table of Figures... ii EXECUTIVE SUMMARY... 1 BACKGROUND... 2 SUMMER AND FALL PRECIPITATION...
DEPARTMENT OF THE ARMY MILITARY SURFACE DEPLOYMENT AND DISTRIBUTION COMMAND (SDDC) 1 SOLDIER WAY SCOTT AFB, IL 62225
 1 SOLDIER WAY SCOTT AFB, IL 62225") DEPARTMENT OF THE ARMY MILITARY SURFACE DEPLOYMENT AND DISTRIBUTION COMMAND (SDDC) 1 SOLDIER WAY SCOTT AFB, IL 62225 SDDC Operations Special Requirements Branch 1 Soldier Way Scott AFB, IL 62225 April
DEPARTMENT OF THE ARMY MILITARY SURFACE DEPLOYMENT AND DISTRIBUTION COMMAND (SDDC) 1 SOLDIER WAY SCOTT AFB, IL 62225 SDDC Operations Special Requirements Branch 1 Soldier Way Scott AFB, IL 62225 April
FEB DASHBOARD FEB JAN FEB MAR APR MAY JUN JUL AUG SEP OCT NOV DEC
 Positive Response Compliance 215 Compliant 215 Non-Compliant 216 Compliant 216 Non-Compliant 1% 87% 96% 86% 96% 88% 89% 89% 88% 86% 92% 93% 94% 96% 94% 8% 6% 4% 2% 13% 4% 14% 4% 12% 11% 11% 12% JAN MAR
Safety effects of lower speed limits during winter months
 Safety effects of lower speed limits during winter months Jaakko Klang Traffic Safety Engineer Centres for Economic Development, Transport and the Environment Finland 13.9.2018 1 1. Finland 13.9.2018 2
Science Standard 1: Students analyze monthly precipitation and temperature records, displayed in bar charts, collected in metric units (mm).
.") Title: Precipitation Patterns across the Globe NSF GK-12 Fellow: Terry Legg Type of Lesson: STEM Grade Level(s): 4 th - 7 th grade This activity can be tailored to older, more advanced students by having
Title: Precipitation Patterns across the Globe NSF GK-12 Fellow: Terry Legg Type of Lesson: STEM Grade Level(s): 4 th - 7 th grade This activity can be tailored to older, more advanced students by having
The AIR Severe Thunderstorm Model for Europe
 The AIR Severe Thunderstorm Model for Europe In 2013 Andreas was the costliest severe thunderstorm outbreak to ever strike Europe and it still is. If Andreas were to recur today, it would cause about EUR