THE CONGO-KALAHARI CRATONIC RELATIONSHIP: FROM RODINIA TO GONDWANA
|
|
|
- Juniper Shields
- 6 years ago
- Views:
Transcription
1 THE CONGO-KALAHARI CRATONIC RELATIONSHIP: FROM RODINIA TO GONDWANA By BRITTANY LYNN NEWSTEAD A THESIS PRESENTED TO THE GRADUATE SCHOOL OF THE UNIVERSITY OF FLORIDA IN PARTIAL FULFILLMENT OF THE REQUIREMENTS FOR THE DEGREE OF MASTER OF SCIENCE UNIVERSITY OF FLORIDA
2 2010 Brittany Lynn Newstead 2
3 To my parents, who have always believed in me 3
4 ACKNOWLEDGMENTS First and foremost I would like to thank my advisor, Dave Foster, for all of his help and wisdom throughout this process and for all he has taught me in the last two years. I would also like to thank my other committee members, Paul Mueller and Joe Meert, for their insightful comments and help along the way. Thanks to Ben Goscombe and Ben Mpani for all of their help in the field. And a special thanks to George Kamenov, without whom I would have no data. I thank all of my teachers over the years, without their lessons I would not be here. I thank my parents, brother and other family members for all of their support over the years. They taught me to think for myself and encouraged my endless curiosity. I also want to thank all of the friends near and far who have been with me throughout, especially Alex and Kelly, who kept me sane through the worst of it. I also thank everyone in the geology department, for all of the help and laughter. 4
5 TABLE OF CONTENTS page ACKNOWLEDGMENTS... 4 LIST OF TABLES... 7 LIST OF FIGURES LIST OF ABBREVIATIONS ABSTRACT CHAPTER 1 INTRODUCTION BACKGROUND Kalahari Craton Congo Craton Damara Orogeny METHODS Detrital Zircon Analysis Whole Rock Analysis RESULTS Detrital Zircon Geochronology Northern Foreland Zone Northern Zone Central Zone Southern Zone Southern Margin Zone Southern Foreland Zone Granitic Rocks Kaoko Belt Initial Hf Isotope Data Sm/Nd Analysis Common Pb Trace and Major Element Analysis DISCUSSION Detrital Zircon Analyses
6 Stratigraphic Comparison Nama Group Granitic Rocks Comparison by Structural Zone Kaoko Belt Comparison by Craton Source Terrains Congo Craton Kalahari Craton Proportions of Crustal Recycling Sedimentary Mixing CONCLUSION APPENDIX: GEOCHRONOLOGIC PROVINCES Kalahari Craton Interior Provinces Marginal Provinces Congo Craton Interior Provinces Marginal Provinces LIST OF REFERENCES BIOGRAPHICAL SKETCH
7 LIST OF TABLES Table page 4-1 U-Pb analysis common Pb corrected results for sample BDG06-91 from the Northern Foreland Zone, Congo Craton U-Pb analysis common Pb corrected results for sample DF09-26 from the Northern Zone, Congo Craton U-Pb analysis common Pb corrected results for sample DF09-30 from the Northern Zone, Congo Craton U-Pb analysis common Pb corrected results for sample DF09-37 from the Northern Zone, Congo Craton U-Pb analysis common Pb corrected results for sample DF09-43 from the Central Zone, Congo Craton U-Pb analysis common Pb corrected results for sample DF09-44 from the Central Zone, Congo Craton U-Pb analysis common Pb corrected results for sample CZ29 from the Central Zone, Congo Craton U-Pb analysis common Pb corrected results for sample CZ40 from the Central Zone, Congo Craton U-Pb analysis common Pb corrected results for sample CZ53b from the Central Zone, Congo Craton U-Pb analysis common Pb corrected results for sample CZ35 from the Central Zone, Congo Craton U-Pb analysis common Pb corrected results for sample DF06-22 from the Southern Zone, Congo Craton U-Pb analysis common Pb corrected results for sample SZ13 from the Southern Zone, Congo Craton U-Pb analysis common Pb corrected results for sample DF09-12a from the Southern Margin Zone, Kalahari Craton U-Pb analysis common Pb corrected results for sample DF09-04 from the Southern Margin Zone, Kalahari Craton U-Pb analysis common Pb corrected results for sample DF06-40 from the Southern Foreland Zone, Kalahari Craton
8 4-16 U-Pb analysis common Pb corrected results for sample DF06-41 from the Southern Foreland Zone, Kalahari Craton U-Pb analysis common Pb corrected results for sample DF06-46 from the Southern Foreland Zone, Kalahari Craton U-Pb analysis common Pb corrected results for sample DF06-45 from the Southern Foreland Zone, Kalahari Craton U-Pb analysis common Pb corrected results for sample DF06-44 from the Southern Foreland Zone, Kalahari Craton U-Pb analysis common Pb corrected results for sample DF06-43 from the Southern Foreland Zone, Kalahari Craton U-Pb analysis common Pb corrected results for sample DF06-18 from the Kaoko Belt U-Pb analysis common Pb corrected results for sample DF09-38 from the Kaoko Belt U-Pb analysis common Pb corrected results for sample DF09-39 from the Kaoko Belt U-Pb analysis common Pb corrected results for sample DF06-11 from the Kaoko Belt U-Pb analysis common Pb corrected results for sample DF06-17 from the Kaoko Belt U-Pb analysis common Pb corrected results for sample DF06-08 from the Kaoko Belt Lu-Hf analysis corrected results for sample DF09-26 from the Northern Zone, Congo Craton Lu-Hf analysis corrected results for sample DF09-30 from the Northern Zone, Congo Craton Lu-Hf analysis corrected results for sample DF09-43 from the Central Zone, Congo Craton Lu-Hf analysis corrected results for sample DF09-44 from the Central Zone, Congo Craton Lu-Hf analysis corrected results for sample CZ29 from the Central Zone, Congo Craton
9 4-32 Lu-Hf analysis corrected results for sample CZ53b from the Central Zone, Congo Craton Lu-Hf analysis corrected results for sample CZ35 from the Central Zone, Congo Craton Lu-Hf analysis corrected results for sample DF06-22 from the Southern Zone, Congo Craton Lu-Hf analysis corrected results for sample SZ13 from the Southern Zone, Congo Craton Lu-Hf analysis corrected results for sample DF09-12a from the Southern Margin Zone, Kalahari Craton Lu-Hf analysis corrected results for sample DF09-04 from the Southern Margin Zone, Kalahari Craton Lu-Hf analysis corrected results for sample DF06-40 from the Southern Foreland Zone, Kalahari Craton Lu-Hf analysis corrected results for sample DF06-41 from the Southern Foreland Zone, Kalahari Craton Lu-Hf analysis corrected results for sample DF06-45 from the Southern Foreland Zone, Kalahari Craton Lu-Hf analysis corrected results for sample DF06-44 from the Southern Foreland Zone, Kalahari Craton Lu-Hf analysis corrected results for sample DF06-43 from the Southern Foreland Zone, Kalahari Craton Lu-Hf analysis corrected results for sample DF06-18 from the Kaoko Belt Lu-Hf analysis corrected results for sample DF09-38 from the Kaoko Belt Lu-Hf analysis corrected results for sample DF09-39 from the Kaoko Belt Lu-Hf analysis corrected results for sample DF06-11 from the Kaoko Belt Lu-Hf analysis corrected results for sample DF06-17 from the Kaoko Belt Lu-Hf analysis corrected results for sample DF06-08 from the Kaoko Belt Sm/Nd corrected results for the Northern Zone of the Congo craton Sm/Nd corrected results for the Central Zone of the Congo craton
10 4-51 Sm/Nd corrected results for the Southern Zone of the Congo craton Sm/Nd corrected results for the Southern Margin Zone of the Kalahari craton Sm/Nd corrected results for the Naukluft Nappes of the Kalahari craton Sm/Nd corrected results for the Southern Foreland Zone of the Kalahari craton Sm/Nd corrected results for the Kaoko belt of the Congo craton Pb/Pb analysis data for the Northern Zone of the Congo craton Pb/Pb analysis data for the Central Zone of the Congo craton Pb/Pb analysis data for the Southern Zone of the Congo craton Pb/Pb analysis data for the Southern Margin Zone of the Kalahari craton Pb/Pb analysis data for the Naukluft Nappes of the Kalahari craton Pb/Pb analysis data for the Southern Foreland Zone of the Kalahari craton Pb/Pb analysis data for the Kaoko belt of the Congo craton Major oxide element analysis data for the Damara Orogen Trace element analysis data for the Damara Orogen
11 LIST OF FIGURES Figure page 1-1 Differing models of Rodinia Geologic map of the Damara Orogen in central Namibia Structural cross section of the Damara Orogen Stratigraphic column of the Damara Orogen with collected samples labeled Geologic maps of the Damara Orogen with the location of collection for all analyzed samples marked Zircon geochronology analysis for sample BDG06-91 from the Mulden Formation Zircon geochronology analysis for sample DF09-26 from the Kuiseb Schist Zircon geochronology analysis for sample DF09-30 from the Kuiseb Schist Zircon geochronology analysis for sample DF09-44 from the Nosib Group Zircon geochronology analysis for sample CZ29 from the Khan Formation Zircon geochronology analysis for sample CZ40 from the Rossing Formation Zircon geochronology analysis for sample CZ53b from the Tinkas Formation Zircon geochronology analysis for sample CZ35 from the Karibib Formation Zircon geochronology analysis for sample DF06-22 (SZ40) from the Kuiseb Schist in the Matchless Amphibolite Belt Zircon geochronology analysis for sample SZ13 from the Kuiseb Schist Zircon geochronology analysis for sample DF09-12a from the Hakos Formation Zircon geochronology analysis for sample DF09-04 from the Naos Diamictite Zircon geochronology analysis for sample DF06-40 from the Kuibis Formation Zircon geochronology analysis for sample DF06-41 from the Schwarzrand Subgroup
12 4-15 Zircon geochronology analysis for sample DF06-46 from the Schwarzrand Subgroup Zircon geochronology analysis for sample DF06-45 from the Fish River Formation Zircon geochronology analysis for sample DF06-44 from the Fish River Formation Zircon geochronology analysis for sample DF06-43 from the Fish River Formation Zircon geochronology analysis for sample DF09-37 from a granitic pluton in the Northern Zone Zircon geochronology analysis for sample DF09-43 from the grainitic gneissic basement of the Central Zone Zircon geochronology analysis for sample DF06-18 from the Hoanib River Group Zircon geochronology analysis for sample DF09-38 from the Ogden Mylonite Zircon geochronology analysis for sample DF09-39 from the Ogden Mylonite Zircon geochronology analysis for sample DF06-11 from the Coastal Terrane Zircon geochronology analysis for sample DF06-08 from the Khumib Terrane Zircon geochronology analysis for sample DF06-17 from the Hoanib River Formation Comprehensive plot of all epsilon Hf data for the Congo and Kalahari cratonic margins Comprehensive plot of all Sm-Nd Dm model ages against relative distance to the SZ-SMZ boundary Comprehensive plot of all epsilon Nd data for the Congo and Kalahari cratonic margins Plots of Pb/Pb data Bivariate oxide plots of major element data Spider diagrams of rare earth element data Detrital zircon U-Pb age populations from the Central Zone
13 5-2 Detrital zircon U-Pb age populations from the Northern Zone and Northern Foreland Zone Detrital zircon U-Pb age populations from the Southern Zone Detrital zircon U-Pb age populations from the Southern Margin Zone Detrital zircon U-Pb age populations from the Nama Group of the Southern Foreland Zone Hf isotope data for the Northern Zone on the Congo margin Hf isotope data for the Central Zone on the Congo Margin Hf isotope data for the Southern Zone on the Congo Margin Hf isotope data for the Southern Margin Zone on the Kalahari Margin Hf isotope data for the Nama Group in the Southern Foreland Zone on the Kalahari Margin Probability density plot of U-Pb age populations in all zones in the Congo cratonic margin Probability density plot of U-Pb age populations in all zones in the Kalahari cratonic margin Hf isotope data for the zones of the Congo cratonic margin Hf isotope data for the zones of the Kalahari cratonic margin Probability density plot of U-Pb age populations in the Kaoko belt Hf isotope data for the Kaoko belt on the Congo cratonic margin Probability density plot of U-Pb age populations in all zones Probability density plot of Lu-Hf DM model age populations in all zones Geologic map of southern Africa. Displays locations of source terrains
14 LIST OF ABBREVIATIONS APWP CHUR CZ DM KZ LA-MC-ICP-MS MSWD NFZ NZ REE SFZ SMZ SZ TRA XRF Apparent Polar Wander Paths Chondritic Uniform Reservoir Central Zone of the Damara Orogen, located on the Congo cratonic margin Depleted Mantle Kaoko Belt, located on the Congo cratonic margin Laser Ablation Multi-Collector Inductively Coupled Plasma Mass Spectrometry Mean Square Weighted Deviation Northern Foreland Zone of the Damara Orogen, located on the Congo cratonic margin Northern Zone of the Damara Orogen, located on the Congo cratonic margin Rare Earth Elements Southern Foreland Zone of the Damara Orogen, located on the Kalahari cratonic margin Southern Margin Zone of the Damara Orogen, located on the Congo cratonic margin Southern Zone of the Damara Orogen, located on the Kalahari cratonic margin Time Resolved Analysis X-Ray Fluorescence 14
15 Abstract of Thesis Presented to the Graduate School of the University of Florida in Partial Fulfillment of the Requirements for the Degree of Master of Science THE CONGO-KALAHARI CRATONIC RELATIONSHIP: FROM RODINIA TO GONDWANA Chair: David Foster Major: Geology By Brittany Lynn Newstead August 2010 Identification of Precambrian suture zones is difficult, in part, because Precambrian mobile belts typically lack Phanerozoic indicators of ocean closure such as ultra high pressure (UHP) rocks and ophiolites. Knowledge of the evolutionary paths of ancient cratons provides valuable insight into the progression of supercontinent cycles. Utilizing U-Pb and Hf analyses of detrital zircons from the Neoproterozoic Damara Belt, the orogenic belt between the Congo and Kalahari cratons in southern Africa, we compared the probable sources of detritus deposited on the margins of these continents and estimated the proportions of crustal recycling for past orogenic events. The sedimentary rocks of the Congo and Kalahari margin give distinctive zircon U-Pb age populations consistent with source terrains within the respective cratons. Detrital zircons from both cratons display U-Pb age populations at ca Ma, though the population contained in the samples collected along the Congo margin is proportionally larger, and minor populations are ca Ma. The Congo marginal strata also have a major age population at ca Ma, which the Kalahari marginal strata lack. The samples collected in the Damara foreland basin in the Nama Group on the Kalahari craton display a minor U-Pb age population at ca Ma and a major population 15
16 at ca. 500 Ma. The populations displayed by the Congo marginal strata are consistent with a variety of intracratonic sources, including exposed basement inliers: the Angola basement, the Kuene intrusive complex (anorthosite), the Orue metamorphic terrane and the Kibara magmatic belt. The populations displayed by zircons collected on the Kalahari margin are consistent with contributions from a variety of Kalahari sources including: the Rehoboth Inlier, the Namaqua and Natal provinces, and the Zimbabwe and Kaapvaal cratons. The provenance and source terrains were different for the Congo and Kalahari cratonic margins during most of the Neoproterozoic. Only in strata deposited in the latest Neoproterozoic-Cambrian, during the amalgamation of Gondwana, were the detrital zircon signatures of the Congo and Kalahari margins similar. These findings suggest that the Congo and Kalahari cratons were independent of one another prior to the Damara Orogeny and assembly of Gondwana. 16
17 CHAPTER 1 INTRODUCTION The cycle of accretion and breakup of supercontinents is a consequence of the ongoing geodynamic processes of plate tectonics and mantle convection. Defining the supercontinent cycle through geologic time is, therefore, critical for understanding the geodynamic processes of the Earth. The interactions between many continents and microcontinents in the Precambrian, however, are poorly resolved due, in part, to difficulties in distinguishing reactivated mobile belts or i ntracratonic basin inversion from sutures caused by the closure of oceanic basins. Sutures marking closure of typical Phanerozoic oceans display ophiolites, ultra-high pressure rocks, and other indicators that have been largely removed in Precambrian rocks due to orogeny, erosion and reactivation. Careful study and innovative interpretati ve methods, however, have allowed for the identification of ocean basin closure sutures that do not display these classic features (e.g. Burke et al., 2003). Knowledge of these ancient suture zones, including their juxtapositions to one another and their petrologic nature (oceanic or otherwise), is increasingly critical to our understanding of supercontinent evolution and the individual histories and evolutionary paths of ancient cratons. The Congo and Kalahari cratons, currently comprising much of southwestern Africa, once formed the core of the Gondwana supercontinent, yet much of their evolution prior to that remains unclear. Two conflicting hypotheses have been put forth concerning their Precambrian relationship. One model postulates that Congo and Kalahari were connected during and participated in Rodinia (Figure 1-1a), were separated by a small inland sea during rifting, and reconnected during the amalgamation of Gondwana (e.g., Kröner and Cordani, 2003; Hanson et al., 2004). This 17
18 model is based on the similarities in the tectonic and rift-drift sedimentary histories of the cratons. An alternate model suggests that the cratons existed independently at the time of Rodinia with no contact before the Damara orogen and the formation of Gondwana (Figure 1-1b) and one or both may not have been a component Rodinia at all (e.g., John et al., 2003; Tohver et al., 2006). Differences in paleomagnetic histories and similarities in the Neoproterozoic sequences from most continents discount the similar sedimentary and tectonic histories. In this study, we analyzed individual detrital zircon grains extracted from Neoproterozoic continent-derived, clastic, metasedimentary rocks that were originally deposited along the margins of the Congo and Kalahari cratons during and following continental rifting (or supercontinental breakup if the cratons were involved in Rodinia). Geochronologic and Hf-isotopic analysis of detrital zircon grains from samples collected within the Damara orogenic belt were used to define the provenance of the metasedimentary rocks currently on the cratonic margins. Distinct U-Pb age populations and Hf-isotope data reveal different sources and proportions of juvenile and recycled crust, suggesting contrasting evolutionary histories for the Congo and Kalahari cratons prior to the amalgamation of Gondwana in latest Neoproterozoic-Cambrian times. 18
 Inclusive model of Rodinia includes Archean cores of the Congo and")
 Exclusive model of Rodinia does not contain the Congo and or")
19 A B Figure 1-1. Models of Rodinia. A) Inclusive model of Rodinia includes Archean cores of the Congo and Kalahari cratons. Figure modified from Torsvik, B) Exclusive model of Rodinia does not contain the Congo and or Kalahari cratons. Figure modified from Meert and Torsvik,
20 CHAPTER 2 BACKGROUND The Gondwana supercontinent formed through a series of orogenic events including ocean basin closure, continental collision, and accretion. Many of the continental fragments that comprised Gondwana were previously part of the Rodinia supercontinent and/or related to Laurentia (e.g., Kröner and Cordani, 2003; Tohver et al., 2006). The relationship of the Congo and Kalahari cratons during this time, to each other and to Rodinia as a whole, is uncertain. Robust paleomagnetic data and clear stratigraphic and structural relationships indicate that Congo and Kalahari were connected when Gondwana was amalgamated at Ma (e.g., Meert, 2003; Gray et al., 2006; Johnson et al., 2006). Late Neoproterozoic paleomagnetic data is nonexistent for Kalahari and extremely limited for Congo, restricting our knowledge of the Congo-Kalahari relationship at that time. Kalahari Craton The Kalahari craton is composed of an Archaean nucleus partially encircled by accreted Paleoproterozoic and Mesoproterozoic age belts (Jacobs et al., 2008). The location of Kalahari within Rodinia remains unresolved. Powell and Pisarevsky (2002) proposed a model that placed Kalahari adjacent to Western Australia, where the timing of rifting is consistent with that observed in Kalahari. Their model, however, would require major rifting along the eastern, rather than the observed western, margin (Jacobs et al., 2008). Alternatively, Kalahari may have been attached to south-west Laurentia, along the Namaqua-Natal-Maud Belt (e.g., Kröner and Cordani, 2003; Jacobs et al., 2008; Li et al., 2008). The apparent polar wander paths (APWP) of Kalahari and Laurentia merge by ca Ma, which is consistent with the timing of 20
21 metamorphism along the Namaqua-Natal Belt in Kalahari and that of the Grenville Belt in southern Laurentia (Li et al., 2008). Congo Craton The Congo craton is composed of various Archaean blocks, including the Angola - Kasai block and the Tanzania craton, which were amalgamated and stabilized by the end of the Paleoproterozoic (De Waele et al., 2008). The Congo craton s participation in Rodinia is still a matter of debate. Rocks along the southern margin of the Congo craton, then attached to the São Francisco craton of Brazil, record tectono-magmatic events concurrent with the amalgamation of Rodinia (De Waele et al., 2008; Li et al., 2008). This magmatism may indicate that the Congo-São Francisco craton collided with, and became an integral part of, the Rodinia supercontinent. Paleomagnetic data are compatible with two different positions for the Congo-São Francisco craton within Rodinia (De Waele et al., 2008); it may have been adjacent to the Kalahari craton as part of Laurentia or sutured to the Amazonia-Rio de la Plata craton (Li et al., 2008). Both configurations, however, display either overlap with other (better constrained) cratons, or are incompatible with other geologic evidence in the area, possibly indicating that the Congo craton was not involved in Rodinia. Kröner and Cordani (2003) and De Waele et al. (2008) argue, based on paleomagnetic and stratigraphic data, that the Congo-São Francisco craton was an independent body of land. De Waele et al. (2009) show that the Irumide belt and Paleoproterozoic Bangweulu Block were attached to the southern margin of the Congo craton by the Mesoproterozoic. The timing of the Irumide orogeny and that of other Mesoproterozoic orogenic terrains, such as the Choma- Kaloma along the Kalahari cratonic margin and the Kibaran orogen along the Congo 21
22 margin, is consistent with the Congo and Kalahari cratons not having been juxtaposed in the Mesoproterozoic (De Waele et al., 2009). Damara Orogeny Rift magmatism at ca Ma on the margins of both the Congo-São Francisco and the Kalahari cratons, coupled with rift-drift sedimentation shortly thereafter, indicate that the Congo and Kalahari cratons were not connected following the rifting of Rodinia (Jacobs et al., 2008; Li et al., 2008). It is yet unresolved whether the Adamastor Ocean, floored by true ocean crust, separated them, or if a small rift caused the formation of an inland sea, the Khomas Sea, floored by continental or transitional crust (e.g., Prave, 1996; Dürr and Dingeldey, 1996; Kröner and Cordani, 2003). The cratons ultimately collided during the widespread Pan-African/Brasiliano orogenic event at Ma, forming the Damara-Lufilian-Zambezi Belt (Meert, 2003; Veevers, 2003). The formation of the Damara belt was contemporaneous with the final suturing of all major cratonic components in the amalgamation of Gondwana in the Cambrian. The Damara Orogen, the inland branch of which is termed the Damara Belt (Fig. 2-1), is a classic divergent orogen. It is dominated by its south-vergent zone, comprised of the schist fabrics of the Southern Zone and the thrust system of the Southern Margin Zone. There also exists a high temperature/low pressure metamorphic Central Zone dominated by granitic plutons and associated metamorphic rocks. The magmatism and structural asymmetry of the orogen suggest an Andean/Cordilleran style subduction zone existed prior to collision between 560 and 500 Ma (Gray et al., 2006; Figure 2-2). The major lithologic elements of the Damara Orogen are Archean and Proterozoic basement inliers, Neoproterozoic passive margin carbonates (Otavi facies), 22
23 Neoproterozoic deep water turbidites (Swakop facies), and Neoproterozoic-Cambrian foreland basin deposits (molasses) of northern and southern Namibia (Mulden and upper Nama groups, respectively; Figure 2-3). The several kilometers thick Neoproterozoic Damara Sequence is one of the most widespread units in the orogen. These Neoproterozoic and Cambrian sequences are intruded by Pan-African aged granitic plutons throughout the orogen. Deposition of the Damara Sequence occurred between ca. 770 and 600 Ma, effectively spanning the Neoproterozoic (Prave, 1996). It is composed of two major groups: 1) the basal Nosib group, dominated by rift-related siliciclastics such as quartzites, conglomerates and arenites, with a U-Pb and Pb-Pb age constraint at ca. 750 Ma (Prave, 1996), and 2) the overlying Otavi Group, composed of turbiditic greywacke, pelitic schists, psammites, and occasional mafic schists (Johnson et al., 2006). The Otavi Group contains two turbiditic carbonate formations, parts of which have been correlated with other formations interpreted to be ca Ma and ca. 700 Ma (Frimmel, 1995). The uppermost Otavi also contains the extensive Kuiseb Formation, dominated by turbiditic greywacke and pelitic schists. 23

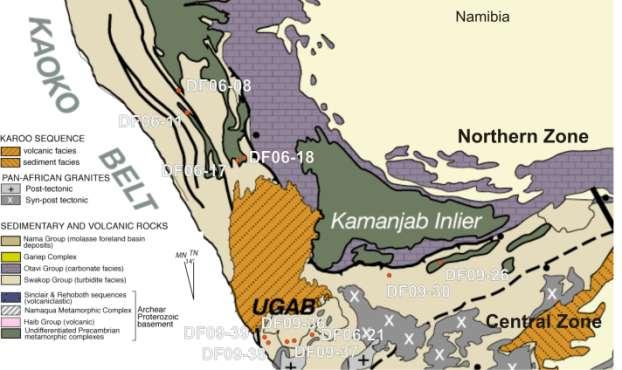
24 Figure 2-1. Geologic map of the Damara Orogen in central Namibia. Modified from Gray et al.,


25 Figure 2-2. Structural cross section of the Damara Orogen. Modified from Gray et al., A 25

 Stratigraphic column of the Kaoko Belt of the Damara Orogeny.")
26 B C Figure 2-3. Stratigraphic column of the Damara Orogen with collected samples labeled in appropriate strata. A) Stratigraphic column of the Kaoko Belt of the Damara Orogeny. B) Stratigraphic column of the Damara Belt of the Damara Orogeny. C) Stratigraphic column of the Gariep Belt of the Damara Orogeny. 26
27 CHAPTER 3 METHODS We collected samples of metasedimentary and igneous rocks from the Damara Belt and surrounding regions in 2006 and Approximately 35 samples were collected in 2006 and 50 samples were collected in Representative samples were chosen from all major stratigraphic groups along the former Neoproterozoic-Cambrian margins of the Congo and Kalahari cratons (Figure 3-1). A majority of the samples collected were metamorphosed sandstones (psammites) that were likely to have detrital zircon populations. A few pelitic samples were also collected for 40 Ar/ 39 Ar and Sm/Nd isotopic analysis. Samples were chosen for freshness and apparent mineralogical composition. Detrital Zircon Analysis U-Pb geochronology was conducted on detrital zircons from 15 samples of metasedimentary rock collected from strata deposited along the margin of the Congo craton and on 8 samples collected from strata deposited along the margin of the Kalahari craton. Samples were collected from a variety of structural/metamorphic zones across the Damara orogen between the cratons (Figure 2-3). Samples were collected from the following structural zones: the Northern Foreland Zone, the Northern Zone, the Central Zone, the Southern Zone, the Southern Margin Zone, the Southern Foreland Zone, and the Kaoko Belt. Analyses were also conducted on a granitic pluton from the Northern Zone and granitic gneissic basement from the Central Zone to investigate the zircon populations in potential source rocks for detrital zircons. U-Pb analyses of zircons were performed by LA-MC-ICP-MS following methods described herein. 206 Pb/ 238 U ages were used for grains displaying ages <1 Ga and 27
28 207 Pb/ 206 Pb ages were used for grains displaying ages >1 Ga. The analyses were plotted on conventional concordia diagrams and cumulative density diagrams using ISOPLOT (Ludwig, 1995) to assess discordance due to multistage Pb loss, metamorphism or mixing of growth zones and to determine source terrains. Discordant grains that plotted along reliable discordia were assumed to be of the upper intercept age and are included in probability plots as such. Discordant analyses that did not intersect the concordia curve or plot along discordia were generally removed from consideration and are not included in age populations plotted on histograms and cumulative probability plots because of the possibility of multiple stages of Pb loss and metamorphism and/or recrystallization. Lu-Hf isotope analysis was conducted on detrital zircons from 15 metasedimentary samples and two granitic samples collected from the Congo margin strata and on seven samples collected from the Kalahari craton margin strata. εhf values were calculated using the respective U-Pb ages of the adjacent laser ablation pits (DM and CHUR values as summarized by Mueller et al., 2008). The Hf isotope data along with the U-Pb ages were used to determine proportions of juvenile and recycled crust during orogenic and magmatic events on the cratons, and potentially discriminate between populations of zircons with similar U-Pb ages. Samples were purified by standard density separation methods to attain zircon concentrates and handpicked for mineral purity before being mounted in an epoxy block and polished to expose the central regions of the grains. U-Pb and Hf isotopic analyses were conducted at the University of Florida, Department of Geological Sciences, on a Nu Plasma multicollector inductively coupled plasma source mass spectrometer (MC- 28
29 ICP-MS) equipped with three ion counters and 12 Faraday detectors. Data calibration and drift corrections were based on multiple ablations of the reference zircons from the Duluth Gabbro (Paces and Miller, 1993) collected from the Forest Center location (FC- 1). Whole Rock Analysis Representative samples from throughout the region were also analyzed for trace element compositions on an Element2 HR-ICP-MS at the University of Florida, Department of Geological Sciences. Samples were powdered using agate coated cylinders to eliminate contamination. Quantification of the results was done by external calibration using a combination of appropriate United States Geological Survey (USGS) rock standards including andesite (AGV-1) and basalts (BCR-2 and BIR-1; as described in USGS reference material). Splits of the samples were sent for XRF whole-rock major element analysis to the Ontario Geological Survey in the Geoscience Laboratories. Radiogenic isotopic analyses were performed at the University of Florida, Department of Geological Sciences. Splits of approximately half of the sample powders used for Nd analysis were spiked with the 149 Sm/ 150 Nd Menlo Park isotopic spike. Nd and Pb were separated using standard chromatographic methods in a clean laboratory. Nd isotope measurements were conducted with the Nu-Plasma Time-Resolved Analysis (TRA) software. Calibration and drift corrections were based on repeated sampling of the JNdi-1 standard (described in Tanaka et al, 2000). Pb isotopic analyses were also conducted on the Nu Plasma MC-ICP-MS using the Tl analyzation technique described in Kamenov et al. (2004). 29
30 A B 30
 Samples collected in northern Namibia in the Northern Foreland Zone and Northern Zone. B) Samples collected in central Namibia from the Central Zone, Southern Zone and Southern Margin Zone.")
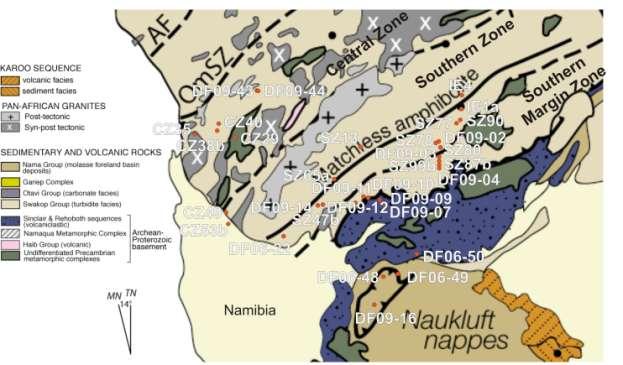
31 C Figure 3-1. Geologic maps of the Damara Orogen with the location of collection for all analyzed samples marked. A) Samples collected in northern Namibia in the Northern Foreland Zone and Northern Zone. B) Samples collected in central Namibia from the Central Zone, Southern Zone and Southern Margin Zone. C) Samples collected in southern Namibia from the Southern Fore land Zone. Map modified from Gray et al.,
32 CHAPTER 4 RESULTS Detrital Zircon Geochronology Northern Foreland Zone Sample BDG06-91 from the Mulden Formation (Table 4-1), which has an approximate stratigraphic age of 560 Ma (Hoffmann et al., 2004), contains four distinct clusters of concordant grains (Figure 4-1a). The concordant clusters occur at ca Ma, 950 Ma, Ma and 2600 Ma. Two grains plot along a discordia with a lower intercept of 220 ± 200 Ma and an upper intercept of 2568 ± 11 Ma (Figure 4-1b). Of the 40 grains sampled 15, or 38%, were concordant and 2, or 5%, plotted along a discordia. Probability density plots of concordant grains and the upper intercept ages of grains plotted along a discordia from BDG06-91 display age populations, in descending order of relative abundance, at ca. 2566, , , 1875, , 1010 and 910 Ma (Figure 4-1c). Northern Zone Sample DF09-26, from the basal member of the Kuiseb Schist in the Northern Zone (Table 4-2), has an approximate stratigraphic age of 615 Ma (Hoffmann et al., 2004). The U-Pb concordia plot displays two distinct clusters of concordant grains at ca Ma and Ma and individual concordant grains at ca and 1850 Ma (Figure 4-2a). Four of the discordant grains plot along a discordia with a lower intercept of 165 ± 110 Ma and an upper intercept of 1114 ± 24 Ma (Figure 4-2b). Of the 78 grains sampled 48, or 62%, were concordant and 4, or 5%, plotted along a discordia line. Probability density plots of concordant grains and the upper intercept ages of grains plotted along the discordia from sample DF09-26 display age populations, in 32
33 descending order of relative abundance, at ca. 1115, 1030, 620, 920, 690, 780, 745, 1880, 1760 and 840 Ma (Figure 4-2c). εhf values of select concordant grains range primarily between 0 and +10 with U-Pb ages mainly between 1140 and 600 Ma, except for a single outlying grain with a value of -3.6 and a U-Pb age of 1875 Ma (Table 4-27; Figure 4-2d). Lu-Hf DM model ages calculated from Hf ratios measured in sample DF09-26 range from ca Ma for most of the grains with a minor age range of ca to 2300 Ma (Figure 4-2e). Sample DF09-30 is from an upper section of the Kuiseb Schist in the Northern Zone (Table 4-3) and has a stratigraphic age of approximately 590 Ma (Hoffmann et al., 2004). The U-Pb concordia plot displays four discrete concordant points which occur at ca. 625 Ma, 1375 Ma, 1800 Ma and 2000 Ma (Figure 4-3a). The discordant grains are quite scattered but many plot along a discordia with an apparent lower intercept of 206 ± 210 Ma and an upper intercept of 1994 ± 13 Ma (Figure 4-3b). Of the 28 grains sampled 4, or 14%, were concordant and 10, or 36%, plotted along a discordia line. Probability density plots of concordant grains and the upper intercept ages of grains plotted along a discordia from sample DF09-30 display an age population at ca Ma and individual grain ages of ca. 625, 1380 and 1825 Ma (Figure 4-3c). εhf values of select concordant grains range primarily between -6 and -9 with U-Pb ages of ca Ma, except for two outlying grains with εhf values of +4 and +1 with U-Pb ages of 1381 and 1824 Ma, respectively (Table 4-28; Figure 4-3d). Lu-Hf DM model ages calculated from Hf ratios measured in concordant grains from sample DF09-30 display a major population at Ma and a minor age range at 1700 to 2200 Ma (Figure 4-3e). 33
34 Central Zone Sample DF09-44, from the Etusis Formation of the Nosib Group i n the Central Zone (Table 4-6), has an approximate stratigraphic age of 780 Ma (Hoffmann et al., 2004). This formation is in stratigraphic contact with the basement. The concordia diagram displays a single cluster of concordant grains at ca Ma and one concordant grain at ca Ma (Figure 4-4a). A majority of the discordant grains plot along a discordia with a lower intercept of 451 ± 45 Ma and an upper intercept of 1057 ± 11 Ma (Figure 4-4a) or along one with a lower intercept of 833 ± 250 Ma and an upper intercept of 2078 ± 39 Ma (Figure 4-4b). Of the 60 grains sampled 29, or 48%, were concordant and 24, or 40%, plotted along the discordia lines. A probability density plot of concordant grains and the upper intercept ages of grains plotted along the discordia from DF09-44 displays age populations, in descending order of relative abundance, at ca. 1050, 1020, and 945 Ma (Figure 4-4c). The population at 1050 Ma is more than twice as abundant as the one at 1020 Ma. εhf values of select concordant grains range primarily between -22 and -17 for grains with U-Pb ages of ca Ma, excepting two outlying grains with values of -3.2 and +0.5 and U-Pb ages of 2046 and 2078 Ma. respectively (Table 4-30; Figure 4-4d). Lu-Hf DM model ages calculated from Hf ratios measured in sample DF09-44, in descending order of abundance, display age ranges at ca , , , and 2500 Ma (Figure 4-4e). Sample CZ29 is from the Khan Formation of the Upper Nosib Group in the northern Central Zone (Table 4-7) and has an approximate stratigraphic age of 750 Ma (Hoffmann et al., 2004). The concordia plot displays two distinct clusters of concordant grains at ca Ma and Ma (Figure 4-5a). A majority of discordant 34
35 grains plot along a discordia line with a lower intercept of 212 ± 250 and an upper intercept of 1026 ± 26 Ma (Figure 4-5b). Of the 19 grains sampled 4, or 21 %, were concordant and 3, or 16%, plotted along the discordia line. Probability density plots of the concordant grains and the upper intercept ages of grains plotted along the discordia from CZ29 display age populations, in descending order of relative abundance, at ca. 1025, 2030 and 1010 Ma (Figure 4-5c). εhf values of four concordant grains with U-Pb ages of Ma range between -18 and -12 (Table 4-31; Figure 4-5d). Another concordant grain with a U-Pb age of 2030 Ma display εhf values of Lu-Hf DM model ages calculated from Hf ratios measured in sample CZ29 display populations at ca and 2450 Ma with a less abundant age range of 2000 to 2200 Ma (Figure 4-5e). Sample CZ40 is from the Rossing Formation in the Central Zone (Table 4-8) and has an approximate stratigraphic age of 740 Ma (Hoffmann et al., 2004). The concordia plot displays two distinct clusters of concordant grains at ca Ma and Ma and an individual concordant grain at ca Ma (Figure 4-6a). The only discordant grain plots slightly above the concordia at ca Ma. Of the 14 grains sampled 13, or 93 %, were concordant. Probability density plots of the concordant grains from CZ40 display age populations, in descending order of relative abundance, at ca , , , 800 and 2650 Ma (Figure 4-6b). Sample CZ53b, from the Tinkas Formation in the Upper Otavi Group in the southern Central Zone (Table 4-9), has an approximate stratigraphic age of 700 Ma (Hoffmann et al., 2004). The concordia plot of these data shows two clusters of concordant grains at ca and Ma (Figure 4-7a). One discordant grain plots along a discordia with a lower intercept of 833 ± 170 Ma and an upper intercept of 35
36 1106 ± 93 Ma (Figure 4-7b). Of the 110 grains sampled 63, or 57%, were concordant and 1, or 1%, plotted along the discordia line. Probability density plots of the concordant grains and the upper intercept ages of grains plotted along the discordia from CZ53b display age populations, in descending order of relative abundance, at ca. 640, 1050, 700, 1090, 760, 1145, 1000 and 890 Ma (Figure 4-7c). εhf values of select concordant grains range primarily between 0 and +13 with U-Pb ages ranging from ca to 630 Ma, excepting three outlying grains with εhf values ranging between -15 and -13 and U- Pb ages between ca and 980 Ma (Table 4-32; Figure 4-7d). Lu-Hf DM model ages calculated from Hf ratios measured in sample CZ53b display populations, in decreasing order of relative abundance, at ca , , , 1400, , 1350, and 2050 with a less abundant age range of 1600 to 2100 Ma (Figure 4-7e). Sample CZ35 is from the Karibib Formation of the Mulden Group in the northern Central Zone (Table 4-10) and has an approximate stratigraphic age of 600 Ma (Hoffmann et al., 2004). The concordia plot displays two distinct clusters of concordant grains at ca Ma and Ma and an individual concordant grain at ca Ma (Figure 4-8a). Of the 110 grains sampled 75, or 68%, were concordant. Probability density plots of concordant grains from CZ35 display age populations, in descending order of relative abundance, at ca. 745, 680, 1090, 1050, 1010, 975, 820, 2020, 1340 and 900 Ma (Figure 4-8c). Grains with U-Pb ages between ca and 630 Ma display εhf values of select concordant grains range primarily between -6 and +11, except three outlying grains with values ranging between -13 and -10 and U-Pb ages between ca and 700 Ma and one with a value of +27 and a U-Pb age of ca. 36
37 2025 Ma (Table 4-33; Figure 4-8d). Lu-Hf DM model ages calculated from Hf ratios measured in sample CZ35 display populations, in descending order of relative abundance, at ca , , 1150, 1200, 1350, and 1650 with less abundant age ranges from 1400 to 1800 and 2100 to 2300 Ma (Figure 4-8e). Southern Zone Sample DF06-22 (SZ40), with an approximate stratigraphic age of 635 Ma (Hoffmann, 1997), is from the Kuiseb Schist within the Matchless Amphibolite Belt in the Southern Zone (Table 4-11). The U-Pb concordia plot displays a wide spread of concordant grains with no distinct clustering (Figure 4-9a). A majority of the discordant grains plot along a discordia line with a lower intercept of 349 ± 110 Ma and an upper intercept of 1981 ± 26 Ma (Figure 4-9b). Of the 38 grains sampled 11, or 29%, were concordant and 5, or 13%, plotted along the discordia line. Probability density plots of the concordant grains and the upper intercept ages of grains plotted along the discordia from DF06-22 display age populations, in descending order of relative abundance, at ca. 1980, 2975, 515, 2125, 630, 725, 2530, 965 and 1775 Ma (Figure 4-9c). εhf values of select concordant grains range primarily between +3 and +11 with U-Pb ages from ca. 975 to 520 Ma and between -8 and +2 for grains with U-Pb ages between ca and 1960 Ma, excepting outlying grains with values of -13, -58 and +1.5 and U-Pb ages of 973, 2540 and 2980 Ma, respectively (Table 4-34; Figure 4-9d). Lu-Hf DM model ages calculated from Hf ratios measured in sample DF06-22 range from ca , , , and Ma (Figure 4-9e). Sample SZ13 is from the Kuiseb Formation of the Khomas Group in the northern Southern Zone (Table 4-12) and has an approximate stratigraphic age of 600 Ma (Hoffmann, 1997). The U-Pb concordia plot displays two distinct clusters of concordant 37
38 grains at ca Ma and Ma and two individual concordant grains at ca and 2025 Ma (Figure 4-10a-b). Several of the discordant grains plot along a discordia with a lower intercept of 650 ± 40 Ma and an upper intercept of 1411 ± 74 Ma (Figure 4-10c). Of the 108 grains sampled 37, or 34%, were concordant and 8, or 7%, plotted along the discordia line. Probability density plots of the concordant grains and the upper intercept ages of grains plotted along the discordia from SZ13 display age populations, in descending order of relative abundance, at ca. 675, , 1400, 950, 1060, 620, 1880 and 2040 Ma (Figure 4-10d). εhf values of select concordant grains range primarily between -6 and +9 for grains with U-Pb mainly between 1100 and 590 Ma and between +10 and +17 for grains with U-Pb ages of ca Ma (Table 4-35; Figure 4-10e). Outlying grains display εhf values of +26, +14, +23, -7 and +4 with U-Pb ages of 956, 1035, 1411, 1883 and 2043 Ma, respectively. Lu-Hf DM model ages calculated from Hf ratios measured in sample SZ13 display populations, in descending order of relative abundance, at ca. 1000, , , , 1100, , and Ma (Figure 4-10f). Southern Margin Zone Sample DF09-12a is from the Hakos Formation of the Kudis Subgroup in the Southern Margin Zone (Table 4-13) and has an approximate stratigraphic age of 680 Ma (Hoffmann, 1997). The U-Pb concordia diagram displays a single cluster of concordant grains at ca Ma and two concordant grains at ca Ma (Figure 4-11a). Many of the discordant grains plot along a discordia with a lower intercept of 388 ± 71 Ma and an upper intercept of 1901 ± 18 Ma (Figure 4-11b). Of the 68 grains sampled 42, or 62%, were concordant and 5, or 7%, plotted along the discordia line. Probability density plots of concordant grains and the upper intercept 38
39 ages of grains plotted along the discordia from DF09-12a display age populations, in descending order of relative abundance, at ca. 1900, 1235, 1200, 1345, 1040, 1120, 1485, 1280, 1570 and 1930 Ma (Figure 4-11c). εhf values of select concordant grains from sample DF09-12a range between -5 and +6 with U-Pb ages between ca and 1020 Ma (Table 4-36; Figure 4-11d). Lu-Hf DM model ages calculated from Hf ratios range, in order of relative abundance, from ca , , 1600, , 2000 and Ma (Figure 4-11e). Sample DF09-04, with an approximate stratigraphic age of 625 Ma (Hoffmann, 1997), is from the Naos Diamictite in the Southern Margin Zone (Table 4-14). The sample set contains two distinct clusters of concordant grains at ca Ma and Ma (Figure 4-12a). A majority of the discordant grains follow the curve of the concordia line but are slightly offset from it with no discordia line formed. Of the 60 grains sampled 41, or 68%, were concordant. Probability density plots of concordant grains and the upper intercept ages of grains plotted along the discordia from DF09-04 display age populations, in descending order of relative abundance, at ca. 1225, 1155, 1115, 1785, , 1880, 1260, 1300, , 1400, 1990, 1850, 1520 and 1915 Ma (Figure 4-12b). εhf values of select concordant grains range primarily between -2 and +3 with U-Pb ages primarily at ca Ma and one grain with an age of 1990 Ma, and one outlying grain with a value of -6.2 and a U-Pb age of 1262 Ma (Table 4-37; Figure 4-12d). Lu-Hf DM model ages calculated from Hf ratios measured in sample DF09-04 range between ca , and Ma (Figure 4-12e). Southern Foreland Zone Sample DF06-40 is from the Kuibis Formation of the Nama Group in the Southern Foreland Zone (Table 4-15) and has a stratigraphic age of approximately 600 Ma 39
40 (Hoffmann, 1997). The U-Pb concordia plot displays four distinct clusters of concordant grains at ca Ma, 1350 Ma, Ma, and 2600 Ma (Figure 4-13a). A majority of the discordant grains plot along three distinct discordia with lower intercepts of 643 ± 55, 795 ± 70 and 894 ± 99 Ma and upper intercepts of 2695 ± 12, 1392 ± 65 and 2166 ± 20 Ma, respectively (Figure 4-13b-c). Of the 60 grains sampled 17, or 28%, were concordant and 19, or 32%, plotted along the discordia lines. Probability density plots of the concordant grains and the upper intercept ages of grains plotted along the discordia from DF06-40 display age populations, in descending order of relative abundance, at ca. 2165, 2700, , 1085, , 2110, 2555 and 1895 Ma (Figure 4-13d). εhf values of select concordant grains from sample DF06-40 range between -10 and +9 with U-Pb age ranging from ca to 1085 Ma (Table 4-38; Figure 4-13e). Lu-Hf DM model ages calculated from Hf ratios range, in order of relative abundance, from ca , , and Ma (Figure 4-13f). Sample DF06-41 is from the Schwarzrand Subgroup of the Nama Group in the Southern Foreland Zone (Table 4-16) and has a stratigraphic age of approximately 580 Ma (Hoffmann, 1997). The U-Pb concordia plot displays three distinct clusters of concordant grains at Ma, Ma and 3300 Ma (Figure 4-14a). There is also an individual concordant grain at ca Ma. A majority of the discordant grains plot along two distinct discordia with lower intercepts of 496 ± 39 and 1806 ± 240 Ma and upper intercepts of 896 ± 99 and 2879 ± 88 Ma, respectively (Figure 4-14b-c). Of the 60 grains sampled 36, or 60%, were concordant and 11, or 18%, plotted along the discordia lines. Probability density plots of the concordant grains and the upper intercept 40
41 ages of grains plotted along the discordia from DF06-41 display age populations, in descending order of relative abundance, at ca. 2055, , , 2025, 1980, 1110, , 2840, 3400, 3335, 2565, , 2440, 2310 and 825 Ma (Figure 4-14d). εhf values of select concordant grains range primarily between -9 and +12 for grains displaying U-Pb ages ranging from 3336 to 833 Ma, excepting one outlying grain with a value of -14 and a U-Pb age of 900 Ma (Table 4-39; Figure 4-14e). Lu-Hf DM model ages calculated from Hf ratios measured in sample DF06-41 range, in descending order of relative abundance, from ca , , , , and Ma (Figure 4-14f). Sample DF06-46, from the Schwarzrand Subgroup of the Nama Group in the Southern Foreland Zone (Table 4-17), has an approximate stratigraphic age of 560 Ma (Hoffmann, 1997). The U-Pb concordia plot displays two clusters of concordant grains at ca. 600 Ma and 1000 Ma (Figure 4-15a). A majority of the discordant grains plot along a discordia with a lower intercept of 153 ± 52 Ma and an upper intercept of 1058 ± 11 Ma (Figure 4-15b). Of the 40 grains sampled 6, or 15%, were concordant and 10, or 25%, plotted along the discordia line. Probability density plots of concordant grains and the upper intercept ages of grains plotted along the discordia from DF06-46 display age populations, in descending order of relative abundance, at ca. 1060, 585 and 1025 Ma (Figure 4-15c). The population at ca Ma is more than twice as abundant as the one at ca. 585 Ma. Sample DF06-45, from the Fish River Formation in the Nama Group of the Southern Foreland Zone (Table 4-18), has an approximate stratigraphic age of 535 Ma (Hoffmann, 1997). The U-Pb concordia plot displays three distinct clusters of 41
42 concordant grains at ca Ma, Ma, and Ma (Figure 4-16ab). A majority of the discordant grains plot along a discordia with a lower intercept of 120 ± 49 Ma and an upper intercept of 1058 ± 14 Ma (Figure 4-16c). Of the 60 grains sampled 39, or 65%, were concordant and 6, or 10%, plotted along the discordia line. Probability density plots of the concordant grains and the upper intercept ages of grains plotted along the discordia from DF06-45 display age populations, in descending order of relative abundance, at ca. 540, 1055, 645, 2090, 2215, 865 and 940 Ma (Figure 4-16d). The population at ca. 540 Ma is approximately twice as abundant as the one at ca Ma. εhf values of select concordant grains range primarily between -8 and -2 for grains with U-Pb ages between ca. 650 and 1050 Ma excepting four outlying grains with εhf values of +2, +4, +8 and +1 with U-Pb ages of 535, 553, 1064 and 2223 Ma (Table 4-40; Figure 4-16e). Lu-Hf DM model ages calculated from Hf ratios measured in sample DF06-45 range, in descending order of relative abundance, from ca , , and Ma (Figure 4-16f). Sample DF06-44, from the Fish River Formation in the Nama Group of the Southern Foreland Zone (Table 4-19), has a stratigraphic age of approximately 530 Ma (Hoffmann, 1997). The U-Pb concordia plot displays two distinct clusters of concordant grains at ca Ma and Ma and two individual concordant grains at ca and 1950 Ma (Figure 4-17a-b). A majority of the discordant grains plot along a discordia with a lower intercept of 444 ± 20 Ma and an upper intercept of 1095 ± 10 Ma (Figure 4-17c). Of the 60 grains sampled 33, or 55%, were concordant and 7, or 12%, plotted along the discordia line. Probability density plots of the concordant grains and the upper intercept ages of grains plotted along the discordia from DF06-44 display age 42
43 populations, in descending order of relative abundance, at ca. 1100, 1045, 615, , 660, 730, 945, 1925 and 1480 Ma (Figure 4-17d). The population at ca Ma is approximately twice as abundant as the one at ca Ma. εhf values of select concordant grains range primarily between -10 and +16 for grains with U-Pb ages that range from ca to 520 Ma, excepting one outlying grain with a value of -23 and a U-Pb age of 954 Ma (Table 4-41; Figure 4-17e). Lu-Hf DM model ages calculated from Hf ratios measured in sample DF06-44 range, in descending order of relative abundance, from ca , , and Ma (Figure 4-17f). Sample DF06-43, from the Fish River Formation in the Nama Group of the Southern Foreland Zone (Table 4-20), has an approximate stratigraphic age of 525 Ma (Hoffmann, 1997). The data plotted on a conventional concordia plot show four distinct clusters of concordant grains at ca Ma, Ma, Ma, and Ma (Figure 4-18a-b). A majority of discordant grains plot along a discordia with a lower intercept of 302 ± 49 Ma and an upper intercept of 1087 ± 14 Ma (Figure 4-18c). Of the 60 grains sampled 30, or 50%, were concordant and 6, or 10%, plotted along the discordia line. Probability density plots of the concordant grains and the upper intercept ages of grains plotted along the discordia from DF06-43 display age populations, in descending order of relative abundance, at ca. 1085, 840, 1055, 550, 610, 1870 and 1930 Ma (Figure 4-18d). εhf values of select concordant grains range primarily between -7 and +12 for grains with U-Pb age ranging from ca to 560 Ma (Table 4-42; Figure 4-18e). Lu-Hf DM model ages calculated from Hf ratios measured in sample DF06-43 range, in descending order of relative abundance, from ca , , , , and Ma (Figure 4-18f). 43
44 Granitic Rocks Sample DF09-37, from a granitic pluton in the Northern Zone (Table 4-4), contains a single population of concordant grains at ca. 525 Ma on a U-Pb concordia diagram (Figure 4-19a). Several of the discordant grains plot along a discordia with a lower intercept of 41 ± 99 and an upper intercept of 604 ± 22 (Figure 4-19b-c). Of the 26 grains sampled 6, or 23%, were concordant and 6, or 23%, plotted along the discordia line. The weighted mean age of crystallization using 206 Pb/238 U for concordant grains from DF09-37 is ± 6.6 Ma with 95% confidence and an MSWD of 0.82 (N=6; Figure 4-19d). Sample DF09-43 is from the granitic gneiss basement rock of the Central Zone (Table 4-5), below the Nosib Group sample, DF The U-Pb concordia diagram displays a single cluster of concordant grains at ca Ma and one discrete concordant grain ca. 520 Ma (Figure 4-20a). A majority of the discordant grains plot along a discordia with a lower intercept of 277 ± 140 Ma, an upper intercept of 1036 ± 11 Ma and an MSWD of 2.8 (Figure 4-20b). Of the 70 grains sampled 48, or 69%, were concordant and 14, or 20%, plotted along the discordia line. The concordant grains from DF09-43 display a weighted mean age of crystallization of ± 2.2 Ma with 95% confidence and an MSWD of 1.2 using 207 Pb/206 Pb ages for grains with ages >1.0 Ga and 206 Pb/238 U for grains with ages <1.0 Ga (N=38; Figure 4-20c). εhf values of select concordant grains range primarily between -20 and -11 with U-Pb ages between ca and 1030 Ma, excepting three outlying grains with values of -22.5, and - 26 with U-Pb ages of ca. 1023, 1055 and 514 Ma, respectively (Table 4-29; Figure 4-20d). Lu-Hf DM model ages calculated from Hf ratios measured in sample DF
45 range, in descending order of relative abundance, from ca , , and Ma (Figure 4-20e). Kaoko Belt Sample DF06-18, from the Hoanib River Formation of the Nosib Group in the central Kaoko Belt (Table 4-21), has an approximate stratigraphic age of 770 Ma (Stanistreet and Charlesworth, 2001). The U-Pb concordia diagram displays three distinct clusters of concordant grains at ca Ma, Ma and 2600 Ma (Figure 4-21a). A majority of discordant grains plot along two discordia with lower intercepts of -403 ± 680 and -96 ± 290 Ma and upper intercepts of 1858 ± 18 and 2049 ± 8.5 Ma, respectively (Figure 4-21b). Of the 80 grains sampled 27, or 34%, were concordant and 7, or 9%, plotted along the discordia line. Probability density plots of the concordant grains and the upper intercept ages of grains plotted along the discordia from DF06-18 display age populations, in descending order of relative abundance, at ca. 2050, , 2625, 2085, 1210, 980, , 1090, 1115 and 800 Ma (Figure 4-21c). εhf values of select concordant grains range primarily between -18 and +4 for grains with U-Pb ages of 980 to 1225 Ma and between -7 and +3 for grains with U-Pb ages of 1855 to 2055 Ma (Table 4-43; Figure 4-21d). Outlying grains display εhf values of -26 and +3 with U-Pb ages of 811 and 1090 Ma, respectively. Lu-Hf DM model ages calculated from Hf ratios measured in sample DF06-18 range from ca , , , 2350 and Ma (Figure 4-21e). Sample DF09-38, from the Ogden Mylonite in the Coastal Terrain (Table 4-22), has an approximate stratigraphic age of 760 Ma (Goscombe and Gray, 2008). The U-Pb concordia diagram displays a single cluster of concordant grains at ca Ma and one concordant grain at ca Ma (Figure 4-22a). A majority of the discordant grains 45
46 plot along a discordia with a lower intercept of 518 ± 89 Ma and an upper intercept of ± 5.4 Ma (Figure 4-22a). Of the 59 grains sampled 40, or 68%, were concordant and 8, or 14%, plotted along the discordia line. Probability density plots of concordant grains and the upper intercept ages of grains plotted along the discordia from DF09-38 display age populations, in descending order of relative abundance, at ca , 1780 and 1435 Ma (Figure 4-22b). The population at Ma is more than 10 times more abundant than the 1780 Ma population. εhf values of select concordant grains from sample DF09-38 range between -8 and -2 with U-Pb ages primarily between ca and 1830 Ma, excepting one grain with a U-Pb age of 1440 Ma (Table 4-44; Figure 4-22c). Lu-Hf DM model ages calculated from Hf ratios display populations, in decreasing relative abundance, at ca , 2500, 2400, 2525 and Ma (Figure 4-22d). Sample DF09-39, from the Ogden Mylonite in the Coastal Terrain (Table 4-23), has an approximate stratigraphic age of 750 Ma (Goscombe and Gray, 2008). The U-Pb concordia diagram displays a single cluster of concordant grains at ca Ma (Figure 4-23a). A majority of the discordant grains plot along a discordia with a lower intercept of 562 ± 98 Ma and an upper intercept of ± 7.7 Ma (Figure 4-23a). Of the 41 grains sampled 8, or 20%, were concordant and 15, or 37%, plotted along the discordia line. A probability density plot of concordant grains and the upper intercept ages of grains plotted along the discordia from DF09-39 displays one age population at ca Ma (Figure 4-23b). εhf values of concordant grains from sample DF09-39 range between -3 and +1 for grains with U-Pb ages between ca and 2610 Ma, excepting one outlying grain with an εhf value of +9 and a U-Pb age of 2606 Ma (Table 46
47 4-45; Figure 4-23c). Lu-Hf DM model ages calculated from Hf ratios range, in descending order of relative abundance, from ca and Ma (Figure 4-23d). Sample DF06-11, from the eastern Coastal Terrane of the Kaoko Belt (Table 4-24), has an approximate stratigraphic age of 660 Ma (Goscombe and Gray, 2008). The U-Pb concordia diagram displays one cluster of concordant grains between ca. 600 and 900 Ma (Figure 4-24a). A majority of the discordant grains plot along a discordia with a lower intercept of -544 ± 180 Ma and an upper intercept of ± 8.1 Ma (Figure 4-24b). Of the 110 grains sampled 62, or 56%, were concordant and 8, or 7%, plotted along the discordia line. A probability density plot of the concordant grains and the upper intercept ages of grains plotted along the discordia from DF06-11 display age populations, in descending order of relative abundance, at ca. 815, 665, 765 and 790 Ma (Figure 4-24c). εhf values of select concordant grains from sample DF06-11 range between +2 and +10 with U-Pb ages of ca Ma (Table 4-46; Figure 4-24d). Lu- Hf DM model ages calculated from Hf ratios range, in order of decreasing relative abundance, from ca. 1025, 1075, 1100, and Ma (Figure 4-24e). Sample DF06-08, from the Khumib Terrane of the Swakop Group in the central Orogen Core (Table 4-26), has an approximate stratigraphic age of 600 Ma (Stanistreet and Charlesworth, 2001). The U-Pb concordia diagram displays three clusters of concordant grains at ca Ma, Ma and 1400 Ma (Figure 4-25a-b). A majority of the discordant grains plot along four separate discordia with lower intercepts of 579 ± 28, 344 ± 150, 34 ± 230, -374 ± 330 and 324 ± 130 Ma and upper intercepts of 1097 ± 33, 1044 ± 17, 1043 ± 20, 998 ± 19 and 1017 ± 13 Ma, respectively (Figure 4-25c). Of the 98 grains sampled 65, or 66%, were concordant and 9, or 9%, plotted along 47
48 the discordia line. Probability density plots of the concordant grains and the upper intercept ages of grains plotted along the discordia from DF06-08 display age populations, in descending order of relative abundance, at ca. 620, 1035, 1015, 575, 750, 1000, 1080, 1130, 1470, 1450, 910, 870 and 830 Ma (Fig. 4-25d). εhf values of select concordant grains range primarily between -6 and +12 with U-Pb ages ranging from ca to 625 Ma, excepting two outlying grains with εhf values -10 and and U-Pb ages of 605 and 1131 Ma, respectively (Table 4-48; Figure 4-25e). Lu-Hf DM model ages calculated from Hf ratios measured in sample DF06-08 range, in order of decreasing relative abundance, from ca. 1100, 1250, 1000, 1525, 1400, and Ma (Figure 4-25f). Sample DF06-17, from the Hoanib River Formation of the Swakop Group in the western Kaoko Belt (Table 4-25), has an approximate stratigraphic age of 600 Ma (Stanistreet and Charlesworth, 2001). The U-Pb concordia diagram displays two clusters of concordant grains at ca Ma and Ma (Figure 4-26a). A majority of discordant grains plot along two distinct discordia with lower intercepts of 1184 ± 78 and 693 ± 83 Ma and upper intercepts of 1937 ± 49 and 2085 ± 53 Ma, respectively (Figure 4-26b-c). Of the 49 grains sampled 14, or 29%, were concordant and 19, or 39%, plotted along the discordia line. Probability density plots of the concordant grains and of grains plotted along the discordia lines from DF06-17 display age populations, in descending order of relative abundance, at ca. 1730, 1755, 1705, 1825, 1835, 2075, 1620, 1670, 1780, 1230, 1215 and 1555 Ma (Figure 4-26d). In the probability density plots 207 Pb/ 206 Pb ages were used for grains plotted along the discordia with an upper intercept of 1937 ± 49 Ma, whereas the upper intercept age was 48
49 used for grains that plotted along the discordia line with an upper intercept of 2085 ± 53 Ma. εhf values of select concordant grains range primarily between -3 and 0 with U-Pb ages of ca Ma and range between +4 and +12 for grains with U-Pb ages of ca Ma, excepting one outlying grain with a value of +2 and a U-Pb age of 1232 Ma (Table 4-47; Figure 4-26e). Lu-Hf DM model ages calculated from Hf ratios measured in sample DF06-17 range, in decreasing order of relative abundance, from ca , and Ma (Figure 4-26f). Initial Hf Isotope Data εhf values of samples collected on the margin of the Congo craton plot primarily between 0 and +10 for grains with U-Pb ages of ca Ma, except fewer than 10 grains that plot between -10 and 0 and two grains with values of -26 (Figure 4-27). In contrast, samples collected on the margin of the Kalahari craton, in the Southern Foreland Zone, contain εhf values that lie primarily between -10 and +3 from ca Ma. There is a gap in the Kalahari data set at ca Ma with only two grains in that age range; whereas the Congo craton data set is continuous. Both cratons display a lack of grains with U-Pb ages between ca. 910 and 940 Ma and only a few data points are available. The grains with U-Pb ages between ca. 900 and 970 Ma collected on the Congo margin display εhf values that range from -5 to +9, except one grain with an εhf value of +26 and a U-Pb age of 955 Ma. Grains collected in the Congo margin displaying U-Pb ages of ca Ma display εhf values range between -15 to +7. The six grains collected in the Kalahari margin displaying U-Pb ages of ca Ma display εhf values of +11, +11, -3, -8, -14 and -23. The zircons from the Congo cratonic margin strata display εhf values ranging from to -12 and from 0 to +14, with a higher proportion of samples in the former range, for grains with U-Pb 49
50 ages between ca and 1100 Ma. The Kalahari cratonic margin samples exhibit εhf values primarily between -4 and +8 for grains with U-Pb ages between ca and 1100 Ma, except one grain with an εhf value of -10 and a U-Pb age of 1033 Ma and one with an εhf value of -7 and a U-Pb age of 1094 Ma. Grains with U-Pb ages from ca to 1150 Ma collected along the Congo cratonic margin have εhf values spread from -15 to -5 and from 0 to +12 with a higher proportion of positive values. εhf data for grains with U-Pb ages from 1150 to 1500 Ma collected in the Congo margin is sparse. Four grains with U-Pb ages of ca display εhf values of -7 to +1, a grain with a U-Pb age of 1339 Ma displays an εhf value of -13, another grain with a U-Pb age of 1381 Ma displays an εhf value of +4, six grains with U-Pb ages of 1411 Ma display εhf values of +10 to +15, one grain with a U-Pb age of 1411 Ma displays an εhf value of +23 and three grains with U-Pb ages of ca Ma display εhf values of -5.5 to The Kalahari margin strata display a more complete data set for grains with U-Pb ages between 1100 and 1600 Ma. εhf values for grains collected on the Kalahari margin with U-Pb ages from 1100 to 1170 Ma range between -1 and +7. Grains with U- Pb ages of ca display εhf values of -6 to +5, with a higher proportion of positive values than negative. Six grains have U-Pb ages between ca and 1475 Ma and display εhf values of -1 to +6. The Congo cratonic margin strata contain no grains with U-Pb ages between ca and 1825 Ma except for three grains at ca Ma with εhf values between -3 and 0 and one grain of the same age with an εhf value of +3. The Kalahari margin strata display a similar lack of U-Pb ages between ca and 1875 Ma. εhf values for the Congo cratonic margin with U-Pb ages between ca and 1970 Ma 50
51 primarily fall between -8 and -3, except for two grains with εhf values of -0.5 to +1 and U-Pb ages of ca Ma and two grains displaying εhf values of +1.7 and U-Pb ages of ca Ma. Samples collected in the Kalahari cratonic margin with U-Pb ages of ca to 1940 Ma display εhf values primarily between -9 and -2 while those displaying U-Pb ages of ca Ma display εhf values of -3 to +3. The Kalahari margin samples display εhf values of -9 to -1 for U-Pb ages of Ma and there is a single grain with a U-Pb age of 2223 Ma and an εhf value of +1. Data sets for both cratons are sparse for the Archean aged zircon grains, and most of the Archean grains analyzed were highly discordant with elevated common Pb. The Congo cratonic margin has three Archean zircons that display εhf values between 0 and -1 at ca Ma. The Kalahari cratonic margin contains two grains with U-Pb ages of ca Ma with εhf values of -1 to +2 and a grain with an εhf value of +3 and a U-Pb age of 2843 Ma. Sm/Nd Analysis Whole-rock Sm/Nd isotope data for 30 meta-pelitic and meta-semipelitic rocks from the Congo and Kalahari cratonic margins (Table 4-49 through Table 4-55) gave depleted mantle Sm-Nd DM model ages (DM values as summarized by Depaolo, 1981; CHUR values as summarized by Bouvier et al., 2008) between 1.4 and 2.8 Ga regardless of cratonic heritage (Figure 4-28). No significant variation could be discerned on either side of the boundary between the strata deposited along the Congo and Kalahari cratonic margins at the Southern Zone Southern Margin Zone (SZ-SMZ) boundary or due to the distance from the boundary; the pelitic and semipelitic strata deposited along the margins of these two craton cratons yield indistinguishable Nd isotopic data. εnd values at 625 Ma (Figure 4-29), a period of significant glaciation and 51
52 approximately when the strata were deposited, were statistically indistinguishable for the two different cratonic margins. The εnd values ranged from -21 to +6 on both the Congo and Kalahari margins. At the SZ-SMZ boundary the εnd values were primarily between -5 and 0 with only a few samples on the Kalahari side having εnd values between -10 and -5. There appears to be little variation of εnd values with stratigraphic age. Samples deposited at ca Ma on the cratonic margin of the Congo craton display εnd values that range primarily between -5 and -1. Syndepositional samples on the cratonic margin of the Kalahari craton display εnd values that range primarily between -9 and -6. Samples collected from formations deposited prior to ca. 650 Ma or subsequent to ca. 600 Ma display a wide range of εnd values that do not appear to correlate to their timing of deposition in any way. Common Pb Whole-rock Pb/Pb isotopic data was collected for 30 samples of metapelitic rock from the Congo and Kalahari cratonic margins (Table 4-56 to Table 4-62). Regressions of the common Pb data using 207 Pb/ 204 Pb versus 206 Pb/ 204 Pb (normalized to Abouchami et al., 2000 values) gave reference ages of /-890 Ma for the Kalahari Craton strata (Figure 4-30a) and /-1400 Ma for the Congo craton strata (Figure 4-30b). Therefore, the whole rock common lead values for strata deposited along both cratons are statistically indistinguishable. Trace and Major Element Analysis Major element analysis on 22 whole rock separates (Table 4-63) was typical of meta-pelites and meta-psammites, consistent with the rock types analyzed. As the same basic rock types were collected on both cratons, the similarity in major elements 52
53 was expected. Most major oxides ratios from strata derived from the cratons decrease linearly with increasing silica content (Figure 31). Ca, Na, and to a lesser extent P, K and Mn, show considerable scatter between 60 and 80% SiO 2, but still an overall decreasing trend with increasing silica. Trace element analyses on 31 whole rock powders (Table 4-64) show no significant variation in rare earth element (REE) compositions across cratons (normalized to Sun and McDonough, 1989 values). One quartzite sample displayed relative depletion overall, otherwise relative abundances were consistent. Such similarity was anticipated due to the rift-drift sedimentary histories common to both cratons. All samples display REE signatures typical of weathered metasedimentary rocks including relative abundance in the light REE with decreasing abundance in the heavy REE (Figure 4-32). All samples display a negative Eu anomaly, probably indicative of plagioclase fraction in the sources of most of the continental detritus. One sample (SZ80) also displays a positive Ce anomaly, possibly indicative of a ferromanganese nodule derived from chemical sediment. 53
54 Table 4-1. U-Pb (MC-ICP-MS) analysis common Pb corrected results for sample BDG06-91 from the Northern Foreland Zone, Congo Craton. Sample 207 Pb/ 1σ error 207 Pb/ 1σ 206 Pb/ 1σ 207 Pb/ 206 Pb 207 Pb/ 235 U* 206 Pb/ 238 U percent rho 206 Pb 235 U* error* 238 U error Age (Ma) Age (Ma) Age (Ma) discord. factor BDG06-91_ ± ± ± BDG06-91_2 R ± ± ± BDG06-91_3 R ± ± ± BDG06-91_ ± ± ± BDG06-91_ ± ± ± BDG06-91_ ± ± ± ± BDG06-91_ ± ± BDG06-91_ ± ± ± ± BDG06-91_9 R ± ± BDG06-91_10 R ± ± ± BDG06-91_11 R ± ± ± BDG06-91_12 R ± ± ± BDG06-91_13 R ± ± ± ± BDG06-91_14 R ± ± BDG06-91_ ± ± ± BDG06-91_16 R ± ± ± BDG06-91_ ± ± ± BDG06-91_18 R ± ± ± BDG06-91_ ± ± ± ± BDG06-91_20 R ± ± BDG06-91_21 R ± ± ±
55 Table 4-1. Continued BDG06-91_22 R ± ± ± BDG06-91_ ± ± ± BDG06-91_24 R ± ± ± BDG06-91_ ± ± ± BDG06-91_26 R ± ± ± BDG06-91_27 R ± ± ± ± BDG06-91_28 R ± ± BDG06-91_29 R ± ± ± BDG06-91_30 R ± ± ± BDG06-91_ ± ± ± BDG06-91_ ± ± ± ± 1282 ± BDG06-91_33 R ± BDG06-91_34 R ± ± ± BDG06-91_35 R ± ± ± BDG06-91_36 R ± ± ± BDG06-91_ ± ± ± BDG06-91_ ± ± ± BDG06-91_ ± ± ± BDG06-91_ ± ± ± R denotes samples removed due to high error and/or discordance. * 235 U values calculated from measured 238 U 55
56 Table 4-2. U-Pb (MC-ICP-MS) analysis common Pb corrected results for sample DF09-26 from the Northern Zone, Congo Craton. Sample 207 Pb/ 1σ error 207 Pb/ 1σ 206 Pb/ 1σ 207 Pb/ 206 Pb 207 Pb/ 235 U* 206 Pb/ 238 U percent 206 Pb 235 U* error* 238 U error Age (Ma) Age (Ma) Age (Ma) discord. rho factor DF09-26_ ± ± ± DF09-26_ ± ± ± DF09-26_ ± ± ± DF09-26_ ± ± ± DF09-26_ ± ± ± DF09-26_ ± ± ± DF09-26_ ± ± ± DF09-26_ ± ± ± DF09-26_ ± ± ± DF09-26_ ± ± ± DF09-26_ ± ± ± DF09-26_ ± ± ± DF09-26_ ± ± ± DF09-26_ ± ± ± DF09-26_16 R ± ± ± DF09-26_17 R ± ± ± DF09-26_18 R ± ± ± DF09-26_ ± ± ± DF09-26_ ± ± ± DF09-26_21 R ± ± ± DF09-26_ ± ± ± DF09-26_ ± ± ± DF09-26_ ± ± ± DF09-26_ ± ± ± DF09-26_ ± ± ± DF09-26_ ± ± ±
57 Table 4-2. Continued DF09-26_28 R ± ± ± DF09-26_29 R ± ± ± DF09-26_ ± ± ± DF09-26_ ± ± ± DF09-26_ ± ± ± DF09-26_33 R ± ± ± DF09-26_ ± ± ± DF09-26_35 R ± ± ± DF09-26_ ± ± ± DF09-26_ ± ± ± DF09-26_ ± ± ± DF09-26_ ± ± ± DF09-26_40 R ± ± ± DF09-26_ ± ± ± DF09-26_ ± ± ± DF09-26_43 R ± ± ± DF09-26_ ± ± ± DF09-26_ ± ± ± DF09-26_ ± ± ± DF09-26_ ± ± ± DF09-26_ ± ± ± DF09-26_ ± ± ± DF09-26_ ± ± ± DF09-26_ ± ± ± DF09-26_ ± ± ± DF09-26_ ± ± ± DF09-26_54 R ± ± ± DF09-26_55 R ± ± ±
58 Table 4-2. Continued. DF09-26_ ± ± ± DF09-26_ ± ± ± DF09-26_ ± ± ± DF09-26_ ± ± ± DF09-26_ ± ± ± DF09-26_ ± ± ± DF09-26_62 R ± ± ± DF09-26_ ± ± ± DF09-26_ ± ± ± DF09-26_ ± ± ± DF09-26_66 R ± ± ± DF09-26_ ± ± ± DF09-26_68 R ± ± ± DF09-26_ ± ± ± DF09-26_ ± ± ± DF09-26_71 R ± ± ± DF09-26_ ± ± ± DF09-26_ ± ± ± DF09-26_ ± ± ± DF09-26_ ± ± ± DF09-26_ ± ± ± DF09-26_ ± ± ± DF09-26_ ± ± ± DF09-26_ ± ± ± R denotes samples removed due to high error and/or discordance. * 235 U values calculated from measured 238 U 58
59 Table 4-3. U-Pb (MC-ICP-MS) analysis common Pb corrected results for sample DF09-30 from the Northern Zone, Congo Craton. Sample 207 Pb/ 1σ error 207 Pb/ 1σ 206 Pb/ 1σ 207 Pb/ 206 Pb 207 Pb/ 235 U* 206 Pb/ 238 U percent 206 Pb 235 U* error* 238 U error Age (Ma) Age (Ma) Age (Ma) discord. DF09-30_ ± ± ± DF09-30_ ± ± ± DF09-30_3 R ± ± ± DF09-30_ ± ± ± DF09-30_5 R ± ± ± DF09-30_ ± ± ± DF09-30_ ± ± ± DF09-30_8 R ± ± ± DF09-30_9 R ± ± ± DF09-30_10 R ± ± ± DF09-30_11 R ± ± ± DF09-30_12 R ± ± ± DF09-30_13 R ± ± ± DF09-30_ ± ± ± DF09-30_ ± ± ± DF09-30_ ± ± ± DF09-30_17 R ± ± ± DF09-30_ ± ± ± DF09-30_19 R ± ± ± DF09-30_ ± ± ± DF09-30_ ± ± ± DF09-30_22 R ± ± ± DF09-30_ ± ± ± DF09-30_24 R ± ± ± DF09-30_ ± ± ± rho factor 59
60 Table 4-3. Continued. DF09-30_ ± ± ± DF09-30_27 R ± ± ± DF09-30_28 R ± ± ± R denotes samples removed due to high error and/or discordance. * 235 U values calculated from measured 238 U Table 4-4. U-Pb (MC-ICP-MS) analysis common Pb corrected results for sample DF09-37 from the Northern Zone, Congo Craton. Sample 207 Pb/ 1σ error 207 Pb/ 1σ 206 Pb/ 1σ 207 Pb/ 206 Pb 207 Pb/ 235 U* 206 Pb/ 238 U percent 206 Pb 235 U* error* 238 U error Age (Ma) Age (Ma) Age (Ma) discord. DF09-37_ ± ± ± DF09-37_2 R ± ± ± DF09-37_3 R ± ± ± DF09-37_ ± ± ± DF09-37_ ± ± ± DF09-37_7 R ± ± ± DF09-37_8 R ± ± ± DF09-37_9 R ± ± ± DF09-37_10 R ± ± ± DF09-37_11 R ± ± ± DF09-37_12 R ± ± ± DF09-37_ ± ± ± DF09-37_14 R ± ± ± DF09-37_15 R ± ± ± DF09-37_ ± ± ± DF09-37_17 R ± ± ± DF09-37_18 R ± ± ± DF09-37_ ± ± ± rho factor 60
61 Table 4-4. Continued. DF09-37_ ± ± ± DF09-37_ ± ± ± DF09-37_22 R ± ± ± DF09-37_ ± ± ± DF09-37_ ± ± ± DF09-37_ ± ± ± DF09-37_ ± ± ± R denotes samples removed due to high error and/or discordance. * 235 U values calculated from measured 238 U Table 4-5. U-Pb (MC-ICP-MS) analysis common Pb corrected results for sample DF09-43 from the Central Zone, Congo Craton. Sample 207 Pb/ 1σ error 207 Pb/ 1σ 206 Pb/ 1σ error 207 Pb/ 206 Pb 207 Pb/ 235 U* 206 Pb/ 238 U percent 206 Pb 235 U* error* 238 U Age (Ma) Age (Ma) Age (Ma) discord. rho factor DF09-43_1 R ± ± ± DF09-43_2 R ± ± ± DF09-43_ ± ± ± DF09-43_ ± ± ± DF09-43_ ± ± ± DF09-43_ ± ± ± DF09-43_ ± ± ± DF09-43_8 R ± ± ± DF09-43_ ± ± ± DF09-43_ ± ± ± DF09-43_ ± ± ± DF09-43_ ± ± ± DF09-43_ ± ± ± DF09-43_ ± ± ± DF09-43_ ± ± ±
62 Table 4-5. Continued. DF09-43_16 R ± ± ± DF09-43_ ± ± ± DF09-43_ ± ± ± DF09-43_ ± ± ± DF09-43_ ± ± ± DF09-43_ ± ± ± DF09-43_ ± ± ± DF09-43_ ± ± ± DF09-43_ ± ± ± DF09-43_ ± ± ± DF09-43_ ± ± ± DF09-43_ ± ± ± DF09-43_ ± ± ± DF09-43_ ± ± ± DF09-43_ ± ± ± DF09-43_ ± ± ± DF09-43_ ± ± ± DF09-43_33 R ± ± ± DF09-43_ ± ± ± DF09-43_35 R ± ± ± DF09-43_ ± ± ± DF09-43_ ± ± ± DF09-43_ ± ± ± DF09-43_ ± ± ± DF09-43_ ± ± ± DF09-43_ ± ± ± DF09-43_ ± ± ± DF09-43_ ± ± ± DF09-43_ ± ± ±
63 Table 4-5. Continued. DF09-43_ ± ± ± DF09-43_ ± ± ± DF09-43_47 R ± ± ± DF09-43_ ± ± ± DF09-43_ ± ± ± DF09-43_ ± ± ± DF09-43_ ± ± ± DF09-43_ ± ± ± DF09-43_ ± ± ± DF09-43_ ± ± ± DF09-43_ ± ± ± DF09-43_ ± ± ± DF09-43_ ± ± ± DF09-43_ ± ± ± DF09-43_ ± ± ± DF09-43_ ± ± ± DF09-43_ ± ± ± DF09-43_ ± ± ± DF09-43_ ± ± ± DF09-43_ ± ± ± DF09-43_ ± ± ± DF09-43_ ± ± ± DF09-43_ ± ± ± DF09-43_ ± ± ± DF09-43_ ± ± ± R denotes samples removed due to high error and/or discordance. * 235 U values calculated from measured 238 U 63
64 Table 4-6. U-Pb (MC-ICP-MS) analysis common Pb corrected results for sample DF09-44 from the Central Zone, Congo Craton. Sample 207 Pb/ 1σ error 207 Pb/ 1σ 206 Pb/ 1σ error 207 Pb/ 206 Pb 207 Pb/ 235 U* 206 Pb/ 238 U percent 206 Pb 235 U* error* 238 U Age (Ma) Age (Ma) Age (Ma) discord. DF09-44_1 R ± ± ± DF09-44_ ± ± ± DF09-44_ ± ± ± DF09-44_ ± ± ± DF09-44_ ± ± ± DF09-44_ ± ± ± DF09-44_ ± ± ± DF09-44_ ± ± ± DF09-44_9 R ± ± ± DF09-44_ ± ± ± DF09-44_ ± ± ± DF09-44_ ± ± ± DF09-44_ ± ± ± DF09-44_ ± ± ± DF09-44_ ± ± ± DF09-44_ ± ± ± DF09-44_ ± ± ± DF09-44_18 R ± ± ± DF09-44_ ± ± ± DF09-44_ ± ± ± DF09-44_ ± ± ± DF09-44_22 R ± ± ± DF09-44_ ± ± ± DF09-44_ ± ± ± DF09-44_ ± ± ± DF09-44_ ± ± ± rho factor 64
65 Table 4-6. Continued. DF09-44_ ± ± ± DF09-44_ ± ± ± DF09-44_ ± ± ± DF09-44_ ± ± ± DF09-44_ ± ± ± DF09-44_ ± ± ± DF09-44_ ± ± ± DF09-44_ ± ± ± DF09-44_ ± ± ± DF09-44_ ± ± ± DF09-44_ ± ± ± DF09-44_ ± ± ± DF09-44_ ± ± ± DF09-44_ ± ± ± DF09-44_ ± ± ± DF09-44_ ± ± ± DF09-44_43 R ± ± ± DF09-44_ ± ± ± DF09-44_ ± ± ± DF09-44_ ± ± ± DF09-44_47 R ± ± ± DF09-44_ ± ± ± DF09-44_ ± ± ± DF09-44_ ± ± ± DF09-44_ ± ± ± DF09-44_52 R ± ± ± DF09-44_ ± ± ± DF09-44_ ± ± ±
66 Table 4-6. Continued. DF09-44_ ± ± ± DF09-44_ ± ± ± DF09-44_ ± ± ± DF09-44_ ± ± ± DF09-44_ ± ± ± DF09-44_ ± ± ± R denotes samples removed due to high error and/or discordance. * 235 U values calculated from measured 238 U Table 4-7. U-Pb (MC-ICP-MS) analysis common Pb corrected results for sample CZ29 from the Central Zone, Congo Craton. Sample 207 Pb/ 1σ error 207 Pb/ 1σ 206 Pb/ 1σ error 207 Pb/ 206 Pb 207 Pb/ 235 U* 206 Pb/ 238 U percent 206 Pb 235 U* error* 238 U Age (Ma) Age (Ma) Age (Ma) discord. CZ29_ ± ± ± CZ29_ ± ± ± CZ29_ ± ± ± CZ29_4 R ± ± ± CZ29_5 R ± ± ± CZ29_ ± ± ± CZ29_7 R ± ± ± CZ29_8 R ± ± ± CZ29_9 R ± ± ± CZ29_10 R ± ± ± CZ29_11 R ± ± ± CZ29_ ± ± ± CZ29_13 R ± ± ± CZ29_14 R ± ± ± CZ29_15 R ± ± ± CZ29_ ± ± ± CZ29_ ± ± ± rho factor 66
67 Table 4-7. Continued. CZ29_18 R ± ± ± CZ29_19 R ± ± ± R denotes samples removed due to high error and/or discordance. * 235 U values calculated from measured 238 U Table 4-8. U-Pb (MC-ICP-MS) analysis common Pb corrected results for sample CZ40 from the Central Zone, Congo Craton. Sample 207 Pb/ 1σ error 207 Pb/ 1σ 206 Pb/ 1σ error 207 Pb/ 206 Pb 207 Pb/ 235 U* 206 Pb/ 238 U percent 206 Pb 235 U* error* 238 U Age (Ma) Age (Ma) Age (Ma) discord. CZ40_ ± ± ± CZ40_ ± ± ± CZ40_3 R ± ± ± CZ40_ ± ± ± CZ40_ ± ± ± CZ40_ ± ± ± CZ40_ ± ± ± CZ40_ ± ± ± CZ40_ ± ± ± CZ40_ ± ± ± CZ40_ ± ± ± CZ40_ ± ± ± CZ40_ ± ± ± CZ40_ ± ± ± R denotes samples removed due to high error and/or discordance. * 235 U values calculated from measured 238 U rho factor 67
68 Table 4-9. U-Pb (MC-ICP-MS) analysis common Pb corrected results for sample CZ53b from the Central Zone, Congo Craton. Sample 207 Pb/ 1σ error 207 Pb/ 1σ 206 Pb/ 1σ error 207 Pb/ 206 Pb 207 Pb/ 235 U* 206 Pb/ 238 U percent 206 Pb 235 U* error* 238 U Age (Ma) Age (Ma) Age (Ma) discord. CZ53b_10 R ± ± ± CZ53b_ ± ± ± CZ53b_12 R ± ± ± CZ53b_ ± ± ± CZ53b_14RIM R ± ± ± CZ53b_14CORE R ± ± ± CZ53b_15 R ± ± ± CZ53b_16 R ± ± ± CZ53b_17 R ± ± ± CZ53b_ ± ± ± CZ53b_19 R ± ± ± CZ53b_20 R ± ± ± CZ53b_ ± ± ± CZ53b_22 R ± ± ± CZ53b_ ± ± ± CZ53b_ ± ± ± CZ53b_ ± ± ± CZ53b_ ± ± ± CZ53b_ ± ± ± CZ53b_28 R ± ± ± CZ53b_29 R ± ± ± CZ53b_30 R ± ± ± CZ53b_31 R ± ± ± CZ53b_ ± ± ± CZ53b_33 R ± ± ± CZ53b_34 R ± ± ± rho factor 68
69 Table 4-9. Continued. CZ53b_ ± ± ± CZ53b_36 R ± ± ± CZ53b_36 R ± ± ± CZ53b_ ± ± ± CZ53b_ ± ± ± CZ53b_ ± ± ± CZ53b_ ± ± ± CZ53b_41 R ± ± ± CZ53b_42 R ± ± ± CZ53b_ ± ± ± CZ53b_ ± ± ± CZ53b_45 R ± ± ± CZ53b_ ± ± ± CZ53b_ ± ± ± CZ53b_ ± ± ± ± CZ53b_49 R ± ± CZ53b_ ± ± ± CZ53b_ ± ± ± CZ53b_52 R ± ± ± CZ53b_ ± ± ± CZ53b_54 R ± ± ± CZ53b_55 R ± ± ± CZ53b_ ± ± ± CZ53b_ ± ± ± CZ53b_58 R ± ± ± CZ53b_ ± ± ± CZ53b_ ± ± ± CZ53b_ ± ± ±
70 Table 4-9. Continued. CZ53b_ ± ± ± CZ53b_ ± ± ± CZ53b_64 R ± ± ± CZ53b_ ± ± ± CZ53b_ ± ± ± CZ53b_ ± ± ± CZ53b_68 R ± ± ± CZ53b_69 R ± ± ± CZ53b_70 R ± ± ± CZ53b_71 R ± ± ± CZ53b_ ± ± ± CZ53b_73 R ± ± ± CZ53b_74 R ± ± ± CZ53b_ ± ± ± CZ53b_ ± ± ± CZ53b_ ± ± ± CZ53b_ ± ± ± CZ53b_ ± ± ± CZ53b_ ± ± ± CZ53b_ ± ± ± CZ53b_80CORE ± ± ± CZ53b_ ± ± ± CZ53b_ ± ± ± CZ53b_ ± ± ± CZ53b_ ± ± ± CZ53b_ ± ± ± CZ53b_ ± ± ± CZ53b_ ± ± ± CZ53b_ ± ± ±
71 Table 4-9. Continued. CZ53b_90 R ± ± ± CZ53b_91 R ± ± ± CZ53b_92 R ± ± ± CZ53b_ ± ± ± CZ53b_ ± ± ± CZ53b_ ± ± ± CZ53b_ ± ± ± CZ53b_97 R ± ± ± CZ53b_ ± ± ± CZ53b_99 R ± ± ± CZ53b_100 R ± ± ± CZ53b_101 R ± ± ± CZ53b_ ± ± ± CZ53b_103 R ± ± ± CZ53b_ ± ± ± CZ53b_105 R ± ± ± CZ53b_ ± ± ± CZ53b_ ± ± ± CZ53b_ ± ± ± CZ53b_109 R ± ± ± CZ53b_ ± ± ± CZ53b_111 R ± ± ± CZ53b_ ± ± ± CZ53b_ ± ± ± CZ53b_ ± ± ± CZ53b_115 R ± ± ± CZ53b_116 R ± ± ± R denotes samples removed due to high error and/or discordance. 71
72 Table U-Pb (MC-ICP-MS) analysis common Pb corrected results for sample CZ35 from the Central Zone, Congo Craton. Sample 207 Pb/ 1σ error 207 Pb/ 1σ 206 Pb/ 1σ error 207 Pb/ 206 Pb 207 Pb/ 235 U* 206 Pb/ 238 U percent 206 Pb 235 U* error* 238 U Age (Ma) Age (Ma) Age (Ma) discord. CZ35_ ± ± ± CZ35_ ± ± ± CZ35_ ± ± ± CZ35_ ± ± ± CZ35_5 R ± ± ± CZ35_ ± ± ± ± CZ35_7 R ± ± CZ35_ ± ± ± CZ35_9 R ± ± ± CZ35_10 R ± ± ± CZ35_ ± ± ± CZ35_ ± ± ± CZ35_ ± ± ± CZ35_ ± ± ± CZ35_15 R ± ± ± CZ35_ ± ± ± CZ35_17 R ± ± ± CZ35_18 R ± ± ± CZ35_ ± ± ± CZ35_ ± ± ± CZ35_ ± ± ± CZ35_ ± ± ± CZ35_ ± ± ± CZ35_24 R ± ± ± CZ35_ ± ± ± CZ35_ ± ± ± CZ35_ ± ± ± rho factor 72
73 Table Continued. CZ35_ ± ± ± CZ35_29 R ± ± ± CZ35_30 R ± ± ± CZ35_ ± ± ± CZ35_ ± ± ± CZ35_33 R ± ± ± CZ35_ ± ± ± CZ35_35 R ± ± ± CZ35_ ± ± ± CZ35_37 R ± ± ± CZ35_ ± ± ± CZ35_ ± ± ± CZ35_ ± ± ± CZ35_ ± ± ± CZ35_ ± ± ± CZ35_ ± ± ± CZ35_ ± ± ± CZ35_45 R ± ± ± CZ35_ ± ± ± CZ35_ ± ± ± CZ35_ ± ± ± CZ35_ ± ± ± CZ35_ ± ± ± CZ35_ ± ± ± CZ35_ ± ± ± CZ35_ ± ± ± CZ35_ ± ± ± CZ35_ ± ± ± CZ35_ ± ± ±
74 Table Continued. CZ35_ ± ± ± CZ35_58 R ± ± ± CZ35_59 R ± ± ± CZ35_ ± ± ± CZ35_ ± ± ± CZ35_ ± ± ± CZ35_ ± ± ± CZ35_ ± ± ± CZ35_65 R ± ± ± CZ35_66 R ± ± ± CZ35_ ± ± ± CZ35_ ± ± ± CZ35_69 R ± ± ± CZ35_ ± ± ± CZ35_ ± ± ± CZ35_ ± ± ± CZ35_73 R ± ± ± CZ35_74 R ± ± ± CZ35_ ± ± ± CZ35_ ± ± ± CZ35_ ± ± ± CZ35_78 R ± ± ± CZ35_ ± ± ± CZ35_ ± ± ± CZ35_ ± ± ± CZ35_ ± ± ± CZ35_ ± ± ± CZ35_ ± ± ± CZ35_ ± ± ±
75 Table Continued. CZ35_ ± ± ± CZ35_ ± ± ± CZ35_88 R ± ± ± CZ35_ ± ± ± CZ35_ ± ± ± CZ35_91 R ± ± ± CZ35_92 R ± ± ± CZ35_ ± ± ± CZ35_ ± ± ± CZ35_ ± ± ± CZ35_96 R ± ± ± CZ35_97 R ± ± ± CZ35_98 R ± ± ± ± CZ35_99 R ± ± CZ35_ ± ± ± CZ35_ ± ± ± CZ35_ ± ± ± CZ35_ ± ± ± CZ35_ ± ± ± CZ35_ ± ± ± CZ35_106 R ± ± ± CZ35_107 R ± ± ± ± CZ35_108 R ± ± CZ35_ ± ± ± CZ35_110 R ± ± ± R denotes samples removed due to high error and/or discordance. * 235 U values calculated from measured 238 U 75
76 Table U-Pb (MC-ICP-MS) analysis common Pb corrected results for sample DF06-22 from the Southern Zone, Congo Craton. Sample 207 Pb/ 1σ error 207 Pb/ 1σ 206 Pb/ 1σ 207 Pb/ 206 Pb 207 Pb/ 235 U* 206 Pb/ 238 U percent rho 206 Pb 235 U* error* 238 U error Age (Ma) Age (Ma) Age (Ma) discord. factor DF06-22_1 R ± ± ± DF06-22_ ± ± ± DF06-22_ ± ± ± DF06-22_ ± ± ± DF06-22_ ± ± ± DF06-22_ ± ± ± DF06-22_7 R ± ± ± DF06-22_8 R ± ± ± DF06-22_ ± ± ± DF06-22_11 R ± ± ± DF06-22_ ± ± ± DF06-22_13 R ± ± ± DF06-22_14 R ± ± ± DF06-22_15 R ± ± ± DF06-22_ ± ± ± DF06-22_17 R ± ± ± DF06-22_ ± ± ± DF06-22_19 R ± ± ± DF06-22_ ± ± ± DF06-22_ ± ± ± DF06-22_22 R ± ± ± DF06-22_ ± ± ± DF06-22_24 R ± ± ± DF06-22_25 R ± ± ±
77 Table Continued. DF06-22_26 R ± ± ± DF06-22_27 R ± ± ± DF06-22_28 R ± ± ± DF06-22_ ± ± ± DF06-22_30 R ± ± ± DF06-22_ ± ± ± DF06-22_32 R ± ± ± DF06-22_33 R ± ± ± DF06-22_34 R ± ± ± DF06-22_ ± ± ± DF06-22_36 R ± ± ± DF06-22_37 R ± ± ± DF06-22_38 R ± ± ± DF06-22_ ± ± ± R denotes samples removed due to high error and/or discordance. * 235 U values calculated from measured 238 U Table U-Pb (MC-ICP-MS) analysis common Pb corrected results for sample SZ13 from the Southern Zone, Congo Craton. Sample 207 Pb/ 1σ error 207 Pb/ 1σ 206 Pb/ 1σ 207 Pb/ 206 Pb 207 Pb/ 235 U* 206 Pb/ 238 U percent 206 Pb 235 U* error* 238 U error Age (Ma) Age (Ma) Age (Ma) discord. SZ13_1 R ± ± ± SZ13_ ± ± ± SZ13_ ± ± ± SZ13_ ± ± ± SZ13_ ± ± ± SZ13_ ± ± ± SZ13_7 R ± ± ± SZ13_ ± ± ± rho factor 77
78 Table Continued. SZ13_9 R ± ± ± SZ13_10 R ± ± ± SZ13_11 R ± ± ± SZ13_12 R ± ± ± SZ13_ ± ± ± SZ13_ ± ± ± SZ13_15 R ± ± ± SZ13_16 R ± ± ± SZ13_17 R ± ± ± SZ13_18 R ± ± ± SZ13_19 R ± ± ± SZ13_20 R ± ± ± SZ13_ ± ± ± SZ13_ ± ± ± SZ13_23 R ± ± ± SZ13_ ± ± ± SZ13_ ± ± ± SZ13_ ± ± ± SZ13_ ± ± ± SZ13_ ± ± ± SZ13_ ± ± ± SZ13_ ± ± ± SZ13_ ± ± ± SZ13_32 R ± ± ± SZ13_ ± ± ± SZ13_ ± ± ± SZ13_35 R ± ± ±
79 Table Continued. SZ13_ ± ± ± SZ13_37 R ± ± ± SZ13_38 R ± ± ± SZ13_39 R ± ± ± SZ13_40 R ± ± ± SZ13_41 R ± ± ± SZ13_ ± ± ± SZ13_43 R ± ± ± SZ13_ ± ± ± SZ13_45 R ± ± ± SZ13_46 R ± ± ± SZ13_ ± ± ± SZ13_ ± ± ± SZ13_49 R ± ± ± SZ13_50 R ± ± ± SZ13_ ± ± ± SZ13_52 R ± ± ± SZ13_ ± ± ± SZ13_ ± ± ± SZ13_55 R ± ± ± SZ13_56 R ± ± ± SZ13_ ± ± ± SZ13_ ± ± ± SZ13_59 R ± ± ± ± SZ13_60 R ± ± SZ13_61 R ± ± ± SZ13_62 R ± ± ±
80 Table Continued. SZ13_ ± ± ± SZ13_64 R ± ± ± SZ13_65 R ± ± ± SZ13_66 R ± ± ± ± SZ13_67 R ± ± SZ13_68 R ± ± ± SZ13_69 R ± ± ± SZ13_70 R ± ± ± SZ13_71 R ± ± ± SZ13_72 R ± ± ± SZ13_ ± ± ± SZ13_ ± ± ± SZ13_75 R ± ± ± SZ13_76 R ± ± ± SZ13_ ± ± ± SZ13_78 R ± ± ± SZ13_79 R ± ± ± SZ13_ ± ± ± SZ13_81 R ± ± ± SZ13_82 R ± ± ± SZ13_83 R ± ± ± ± SZ13_85 R ± ± SZ13_86 R ± ± ± SZ13_87 R ± ± ± SZ13_88 R ± ± ± SZ13_ ± ± ±
81 Table Continued. SZ13_90 R ± ± ± SZ13_91 R ± ± ± SZ13_92 R ± ± ± SZ13_93 R ± ± ± SZ13_ ± ± ± SZ13_95 R ± ± ± SZ13_ ± ± ± SZ13_ ± ± ± SZ13_98 R ± ± ± SZ13_ ± ± ± SZ13_ ± ± ± SZ13_101 R ± ± ± SZ13_102 R ± ± ± SZ13_103 R ± ± ± SZ13_104 R ± ± ± SZ13_ ± ± ± SZ13_ ± ± ± SZ13_ ± ± ± SZ13_ ± ± ± R denotes samples removed due to high error and/or discordance. * 235 U values calculated from measured 238 U 81
82 Table U-Pb (MC-ICP-MS) analysis common Pb corrected results for sample DF09-12a from the Southern Margin Zone, Kalahari Craton. Sample 207 Pb/ 1σ error 207 Pb/ 1σ 206 Pb/ 1σ error 207 Pb/ 206 Pb 207 Pb/ 235 U* 206 Pb/ 238 U percent rho 206 Pb 235 U* error* 238 U Age (Ma) Age (Ma) Age (Ma) discord. factor DF09-12a_ ± ± ± DF09-12a_ ± ± ± DF09-12a_3 R ± ± ± DF09-12a_ ± ± ± DF09-12a_5 R ± ± ± DF09-12a_6 R ± ± ± DF09-12a_7 R ± ± ± DF09-12a_ ± ± ± DF09-12a_ ± ± ± DF09-12a_ ± ± ± DF09-12a_ ± ± ± DF09-12a_ ± ± ± DF09-12a_13 R ± ± ± DF09-12a_ ± ± ± DF09-12a_ ± ± ± DF09-12a_ ± ± ± DF09-12a_ ± ± ± DF09-12a_18 R ± ± ± DF09-12a_ ± ± ± DF09-12a_20 R ± ± ± DF09-12a_ ± ± ± DF09-12a_ ± ± ± DF09-12a_ ± ± ± DF09-12a_24 R ± ± ± DF09-12a_25 R ± ± ± DF09-12a_ ± ± ±
83 Table Continued. DF09-12a_ ± ± ± DF09-12a_ ± ± ± DF09-12a_ ± ± ± DF09-12a_ ± ± ± DF09-12a_ ± ± ± DF09-12a_32 R ± ± ± DF09-12a_ ± ± ± DF09-12a_ ± ± ± DF09-12a_35 R ± ± ± DF09-12a_ ± ± ± DF09-12a_37 R ± ± ± DF09-12a_ ± ± ± DF09-12a_ ± ± ± DF09-12a_ ± ± ± DF09-12a_41 R ± ± ± DF09-12a_ ± ± ± DF09-12a_ ± ± ± DF09-12a_ ± ± ± DF09-12a_ ± ± ± DF09-12a_ ± ± ± DF09-12a_ ± ± ± DF09-12a_ ± ± ± DF09-12a_49 R ± ± ± DF09-12a_ ± ± ± DF09-12a_ ± ± ± DF09-12a_ ± ± ± DF09-12a_ ± ± ± DF09-12a_54 R ± ± ±
84 Table Continued. DF09-12a_55 R ± ± ± DF09-12a_ ± ± ± DF09-12a_ ± ± ± DF09-12a_58 R ± ± ± DF09-12a_59 R ± ± ± DF09-12a_ ± ± ± DF09-12a_ ± ± ± DF09-12a_62 R ± ± ± DF09-12a_ ± ± ± DF09-12a_ ± ± ± DF09-12a_ ± ± ± DF09-12a_ ± ± ± DF09-12a_67 R ± ± ± DF09-12a_68 R ± ± ± R denotes samples removed due to high error and/or discordance. * 235 U values calculated from measured 238 U Table U-Pb (MC-ICP-MS) analysis common Pb corrected results for sample DF09-04 from the Southern Margin Zone, Kalahari Craton. Sample 207 Pb/ 1σ error 207 Pb/ 1σ 206 Pb/ 1σ error 207 Pb/ 206 Pb 207 Pb/ 235 U* 206 Pb/ 238 U percent rho 206 Pb 235 U* error* 238 U Age (Ma) Age (Ma) Age (Ma) discord. factor DF09-04_ ± ± ± DF09-04_ ± ± ± DF09-04_ ± ± ± DF09-04_4 R ± ± ± DF09-04_ ± ± ± DF09-04_6 R ± ± ± DF09-04_ ± ± ± DF09-04_ ± ± ± DF09-04_ ± ± ±
85 Table Continued. DF09-04_ ± ± ± DF09-04_ ± ± ± DF09-04_ ± ± ± DF09-04_ ± ± ± DF09-04_ ± ± ± DF09-04_ ± ± ± DF09-04_ ± ± ± DF09-04_ ± ± ± DF09-04_ ± ± ± DF09-04_ ± ± ± DF09-04_ ± ± ± DF09-04_ ± ± ± DF09-04_ ± ± ± DF09-04_23 R ± ± ± DF09-04_ ± ± ± DF09-04_ ± ± ± DF09-04_26 R ± ± ± DF09-04_ ± ± ± DF09-04_28 R ± ± ± DF09-04_ ± ± ± DF09-04_ ± ± ± DF09-04_ ± ± ± DF09-04_32 R ± ± ± DF09-04_33 R ± ± ± DF09-04_34 R not sampled DF09-04_ ± ± ± DF09-04_ ± ± ± DF09-04_ ± ± ± DF09-04_ ± ± ±
86 Table Continued. DF09-04_ ± ± ± DF09-04_40 R ± ± ± DF09-04_ ± ± ± DF09-04_ ± ± ± DF09-04_43 R ± ± ± DF09-04_ ± ± ± DF09-04_ ± ± ± DF09-04_ ± ± ± DF09-04_ ± ± ± DF09-04_48 R ± ± ± DF09-04_49 R ± ± ± DF09-04_ ± ± ± DF09-04_51 R ± ± ± DF09-04_52 R ± ± ± DF09-04_ ± ± ± DF09-04_54 R ± ± ± DF09-04_55 R ± ± ± DF09-04_ ± ± ± DF09-04_ ± ± ± DF09-04_ ± ± ± DF09-04_ ± ± ± DF09-04_ ± ± ± R denotes samples removed due to high error and/or discordance. * 235 U values calculated from measured 238 U 86
87 Table U-Pb (MC-ICP-MS) analysis common Pb corrected results for sample DF06-40 from the Southern Foreland Zone, Kalahari Craton. Sample 207 Pb/ 1σ error 207 Pb/ 1σ 206 Pb/ 1σ error 207 Pb/ 206 Pb 207 Pb/ 235 U* 206 Pb/ 238 U percent rho 206 Pb 235 U* error* 238 U Age (Ma) Age (Ma) Age (Ma) discord. factor DF06-40_ ± ± ± DF06-40_ ± ± ± DF06-40_ ± ± ± DF06-40_ ± ± ± DF06-40_ ± ± ± DF06-40_6 R ± ± ± DF06-40_7 R ± ± ± DF06-40_8 R ± ± ± DF06-40_9 R ± ± ± DF06-40_ ± ± ± DF06-40_ ± ± ± DF06-40_12 R ± ± ± DF06-40_ ± ± ± DF06-40_14 R ± ± ± DF06-40_15 R ± ± ± DF06-40_16 R ± ± ± DF06-40_17 R ± ± ± DF06-40_ ± ± ± DF06-40_ ± ± ± DF06-40_ ± ± ± DF06-40_22 R ± ± ± DF06-40_23 R ± ± ± DF06-40_ ± ± ± DF06-40_ ± ± ± DF06-40_ ± ± ± DF06-40_ ± ± ± DF06-40_ ± ± ±
88 Table Continued. DF06-40_29 R ± ± ± DF06-40_ ± ± ± DF06-40_31 R ± ± ± DF06-40_32 R ± ± ± DF06-40_ ± ± ± DF06-40_ ± ± ± DF06-40_35 R ± ± ± DF06-40_ ± ± ± DF06-40_ ± ± ± DF06-40_ ± ± ± DF06-40_ ± ± ± DF06-40_40 R ± ± ± DF06-40_ ± ± ± DF06-40_ ± ± ± DF06-40_ ± ± ± DF06-40_ ± ± ± DF06-40_45 R ± ± ± DF06-40_ ± ± ± DF06-40_ ± ± ± DF06-40_ ± ± ± DF06-40_49 R ± ± ± DF06-40_50 R ± ± ± DF06-40_51 R ± ± ± DF06-40_52 R ± ± ± DF06-40_53 R ± ± ± DF06-40_ ± ± ± DF06-40_ ± ± ± DF06-40_ ± ± ± DF06-40_ ± ± ±
89 Table Continued. DF06-40_58 R ± ± ± DF06-40_ ± ± ± DF06-40_ ± ± ± R denotes samples removed due to high error and/or discordance. * 235 U values calculated from measured 238 U Table U-Pb (MC-ICP-MS) analysis common Pb corrected results for sample DF06-41 from the Southern Foreland Zone, Kalahari Craton. Sample 207 Pb/ 1σ error 207 Pb/ 1σ 206 Pb/ 1σ error 207 Pb/ 206 Pb 207 Pb/ 235 U* 206 Pb/ 238 U percent rho 206 Pb 235 U* error* 238 U Age (Ma) Age (Ma) Age (Ma) discord. factor DF06-41_ ± ± ± DF06-41_2 R ± ± ± DF06-41_3 R ± ± ± DF06-41_ ± ± ± DF06-41_4 R ± ± ± DF06-41_ ± ± ± DF06-41_ ± ± ± DF06-41_ ± ± ± DF06-41_ ± ± ± DF06-41_ ± ± ± DF06-41_ ± ± ± DF06-41_ ± ± ± DF06-41_13 R ± ± ± DF06-41_ ± ± ± DF06-41_ ± ± ± DF06-41_ ± ± ± DF06-41_17 R ± ± ± DF06-41_ ± ± ± DF06-41_ ± ± ± DF06-41_ ± ± ±
90 Table Continued. DF06-41_ ± ± ± DF06-41_ ± ± ± DF06-41_ ± ± ± DF06-41_ ± ± ± DF06-41_ ± ± ± DF06-41_26 R ± ± ± DF06-41_ ± ± ± DF06-41_ ± ± ± DF06-41_ ± ± ± DF06-41_ ± ± ± DF06-41_31 R ± ± ± DF06-41_32 R ± ± ± DF06-41_ ± ± ± DF06-41_ ± ± ± DF06-41_ ± ± ± DF06-41_ ± ± ± DF06-41_ ± ± ± DF06-41_ ± ± ± DF06-41_39 R ± ± ± DF06-41_ ± ± ± DF06-41_ ± ± ± DF06-41_42 R ± ± ± DF06-41_43 R ± ± ± DF06-41_ ± ± ± DF06-41_45 R ± ± ± DF06-41_ ± ± ± DF06-41_ ± ± ± DF06-41_ ± ± ± DF06-41_ ± ± ±
91 Table Continued. DF06-41_ ± ± ± DF06-41_ ± ± ± DF06-41_ ± ± ± DF06-41_ ± ± ± DF06-41_54 R ± ± ± DF06-41_ ± ± ± DF06-41_ ± ± ± DF06-41_ ± ± ± DF06-41_ ± ± ± DF06-41_ ± ± ± DF06-41_ ± ± ± R denotes samples removed due to high error and/or discordance. * 235 U values calculated from measured 238 U Table U-Pb (MC-ICP-MS) analysis common Pb corrected results for sample DF06-46 from the Southern Foreland Zone, Kalahari Craton. Sample 207 Pb/ 1σ error 207 Pb/ 1σ 206 Pb/ 1σ error 207 Pb/ 206 Pb 207 Pb/ 235 U* 206 Pb/ 238 U percent rho 206 Pb 235 U* error* 238 U Age (Ma) Age (Ma) Age (Ma) discord. factor DF06-46_1 R ± ± ± DF06-46_2 R ± ± ± DF06-46_3 R ± ± ± DF06-46_ ± ± ± DF06-46_5 R ± ± ± DF06-46_ ± ± ± DF06-46_7 R ± ± ± DF06-46_8 R ± ± ± DF06-46_ ± ± ± DF06-46_10 R ± ± ± DF06-46_ ± ± ±
92 Table Continued. DF06-46_12 R ± ± ± DF06-46_13 R ± ± ± DF06-46_14 R ± ± ± DF06-46_ ± ± ± DF06-46_16 R ± ± ± DF06-46_17 R ± ± ± DF06-46_18 R ± ± ± DF06-46_19 R ± ± ± DF06-46_ ± ± ± DF06-46_ ± ± ± DF06-46_ ± ± ± DF06-46_23 R ± ± ± DF06-46_ ± ± ± DF06-46_ ± ± ± DF06-46_ ± ± ± DF06-46_ ± ± ± DF06-46_ ± ± ± DF06-46_ ± ± ± DF06-46_30 R ± ± ± DF06-46_31 R ± ± ± DF06-46_32 R ± ± ± DF06-46_ ± ± ± DF06-46_34 R ± ± ± DF06-46_35 R ± ± ± DF06-46_36 R ± ± ± DF06-46_37 R ± ± ± DF06-46_ ± ± ±
93 Table Continued. DF06-46_39 R ± ± ± DF06-46_40 R ± ± ± R denotes samples removed due to high error and/or discordance. * 235 U values calculated from measured 238 U Table U-Pb (MC-ICP-MS) analysis common Pb corrected results for sample DF06-45 from the Southern Foreland Zone, Kalahari Craton. Sample 207 Pb/ 1σ error 207 Pb/ 1σ 206 Pb/ 1σ error 207 Pb/ 206 Pb 207 Pb/ 235 U* 206 Pb/ 238 U percent rho 206 Pb 235 U* error* 238 U Age (Ma) Age (Ma) Age (Ma) discord. factor DF06-45_ ± ± ± DF06-45_ ± ± ± DF06-45_ ± ± ± DF06-45_ ± ± ± DF06-45_ ± ± ± DF06-45_06 R ± ± ± DF06-45_ ± ± ± DF06-45_ ± ± ± DF06-45_ ± ± ± DF06-45_ ± ± ± DF06-45_ ± ± ± DF06-45_ ± ± ± DF06-45_ ± ± ± DF06-45_14 R ± ± ± DF06-45_ ± ± ± DF06-45_ ± ± ± DF06-45_ ± ± ± DF06-45_ ± ± ± DF06-45_ ± ± ± DF06-45_20 R ± ± ± DF06-45_ ± ± ±
94 Table Continued. DF06-45_ ± ± ± DF06-45_ ± ± ± DF06-45_ ± ± ± DF06-45_ ± ± ± DF06-45_26 R ± ± ± DF06-45_ ± ± ± DF06-45_ ± ± ± DF06-45_29 R ± ± ± DF06-45_30 R ± ± ± DF06-45_ ± ± ± DF06-45_32 R ± ± ± DF06-45_ ± ± ± DF06-45_34 R ± ± ± DF06-45_35 R ± ± ± DF06-45_ ± ± ± DF06-45_ ± ± ± DF06-45_ ± ± ± DF06-45_39 R ± ± ± DF06-45_ ± ± ± DF06-45_ ± ± ± DF06-45_ ± ± ± DF06-45_ ± ± ± DF06-45_ ± ± ± DF06-45_ ± ± ± DF06-45_ ± ± ± DF06-45_ ± ± ± DF06-45_ ± ± ± DF06-45_49 R ± ± ±
95 Table Continued. DF06-45_ ± ± ± DF06-45_ ± ± ± DF06-45_ ± ± ± DF06-45_53 R ± ± ± DF06-45_ ± ± ± DF06-45_55 R ± ± ± DF06-45_56 R ± ± ± DF06-45_ ± ± ± DF06-45_ ± ± ± DF06-45_ ± ± ± DF06-45_60 R ± ± ± R denotes samples removed due to high error and/or discordance. * 235 U values calculated from measured 238 U Table U-Pb (MC-ICP-MS) analysis common Pb corrected results for sample DF06-44 from the Southern Foreland Zone, Kalahari Craton. Sample 207 Pb/ 1σ error 207 Pb/ 1σ 206 Pb/ 1σ error 207 Pb/ 206 Pb 207 Pb/ 235 U* 206 Pb/ 238 U percent rho 206 Pb 235 U* error* 238 U Age (Ma) Age (Ma) Age (Ma) discord. factor DF06-44_ ± ± ± DF06-44_02 R ± ± ± DF06-44_03 R ± ± ± DF06-44_04 R ± ± ± DF06-44_ ± ± ± DF06-44_06 R ± ± ± DF06-44_ ± ± ± DF06-44_ ± ± ± DF06-44_09 R ± ± ± DF06-44_ ± ± ± DF06-44_ ± ± ± DF06-44_ ± ± ±
96 Table Continued. DF06-44_ ± ± ± DF06-44_ ± ± ± DF06-44_ ± ± ± DF06-44_ ± ± ± DF06-44_ ± ± ± DF06-44_18 R ± ± ± DF06-44_ ± ± ± DF06-44_ ± ± ± DF06-44_21 R ± ± ± DF06-44_ ± ± ± DF06-44_ ± ± ± DF06-44_24 R ± ± ± DF06-44_ ± ± ± DF06-44_ ± ± ± DF06-44_27 R ± ± ± DF06-44_ ± ± ± DF06-44_ ± ± ± DF06-44_ ± ± ± DF06-44_ ± ± ± DF06-44_ ± ± ± DF06-44_33 R ± ± ± DF06-44_ ± ± ± DF06-44_35 R ± ± ± DF06-44_36 R ± ± ± DF06-44_37 R ± ± ± DF06-44_ ± ± ± DF06-44_ ± ± ± DF06-44_40 R ± ± ±
97 Table Continued. DF06-44_41 R ± ± ± DF06-44_ ± ± ± DF06-44_43 R ± ± ± DF06-44_44 R ± ± ± DF06-44_ ± ± ± DF06-44_ ± ± ± DF06-44_ ± ± ± DF06-44_ ± ± ± DF06-44_49 R ± ± ± DF06-44_ ± ± ± DF06-44_ ± ± ± DF06-44_ ± ± ± DF06-44_ ± ± ± DF06-44_ ± ± ± DF06-44_55 R ± ± ± DF06-44_ ± ± ± DF06-44_ ± ± ± DF06-44_ ± ± ± DF06-44_ ± ± ± DF06-44_60 R ± ± ± R denotes samples removed due to high error and/or discordance. * 235 U values calculated from measured 238 U 97
98 Table U-Pb (MC-ICP-MS) analysis common Pb corrected results for sample DF06-43 from the Southern Foreland Zone, Kalahari Craton. Sample 207 Pb/ 1σ error 207 Pb/ 1σ 206 Pb/ 1σ error 207 Pb/ 206 Pb 207 Pb/ 235 U* 206 Pb/ 238 U percent rho 206 Pb 235 U* error* 238 U Age (Ma) Age (Ma) Age (Ma) discord. factor DF06-43_ ± ± ± DF06-43_02 R ± ± ± DF06-43_03 R ± ± ± DF06-43_04 R ± ± ± DF06-43_ ± ± ± DF06-43_06 R ± ± ± DF06-43_07 R ± ± ± DF06-43_ ± ± ± DF06-43_ ± ± ± DF06-43_ ± ± ± DF06-43_ ± ± ± DF06-43_12 R ± ± ± DF06-43_13 R ± ± ± DF06-43_ ± ± ± DF06-43_ ± ± ± DF06-43_16 R ± ± ± DF06-43_ ± ± ± DF06-43_ ± ± ± DF06-43_ ± ± ± DF06-43_ ± ± ± DF06-43_21 R ± ± ± DF06-43_ ± ± ± DF06-43_23 R ± ± ± DF06-43_ ± ± ± DF06-43_25 R ± ± ± DF06-43_ ± ± ±
99 Table Continued. DF06-43_ ± ± ± DF06-43_ ± ± ± DF06-43_ ± ± ± DF06-43_30 R ± ± ± DF06-43_31 R ± ± ± DF06-43_ ± ± ± DF06-43_ ± ± ± DF06-43_ ± ± ± DF06-43_35 R ± ± ± DF06-43_ ± ± ± DF06-43_37 R ± ± ± DF06-43_ ± ± ± DF06-43_39 R ± ± ± DF06-43_ ± ± ± DF06-43_ ± ± ± DF06-43_42 R ± ± ± DF06-43_43 R ± ± ± DF06-43_44 R ± ± ± DF06-43_45 R ± ± ± DF06-43_ ± ± ± DF06-43_47 R ± ± ± DF06-43_ ± ± ± DF06-43_ ± ± ± DF06-43_50 R ± ± ± DF06-43_ ± ± ± DF06-43_52 R ± ± ± DF06-43_ ± ± ±
100 Table Continued. DF06-43_ ± ± ± DF06-43_55 R ± ± ± DF06-43_ ± ± ± DF06-43_ ± ± ± DF06-43_ ± ± ± DF06-43_ ± ± ± DF06-43_ ± ± ± R denotes samples removed due to high error and/or discordance. * 235 U values calculated from measured 238 U Table U-Pb (MC-ICP-MS) analysis common Pb corrected results for sample DF06-18 from the Kaoko Belt. Sample 207 Pb/ 1σ error 207 Pb/ 1σ 206 Pb/ 1σ error 207 Pb/ 206 Pb 207 Pb/ 235 U* 206 Pb 235 U* error* 238 U Age (Ma) Age (Ma) 206 Pb/ 238 U Age (Ma) percent discord. rho factor DF06-18_1 R ± ± ± DF06-18_2 R ± ± ± DF06-18_3 R ± ± ± DF06-18_4 R ± ± ± DF06-18_5 R ± ± ± DF06-18_6 R ± ± ± DF06-18_7 R ± ± ± DF06-18_8 R ± ± ± DF06-18_9 R ± ± ± DF06-18_10 R ± ± ± DF06-18_11 R ± ± ± DF06-18_12 R ± ± ± DF06-18_ ± ± ± DF06-18_ ± ± ± DF06-18_15 R ± ± ±
101 Table Continued. DF06-18_16 R ± ± ± DF06-18_ ± ± ± DF06-18_18 R ± ± ± DF06-18_19 R ± ± ± DF06-18_20 R ± ± ± DF06-18_21 R ± ± ± DF06-18_ ± ± ± DF06-18_ ± ± ± DF06-18_ ± ± ± DF06-18_25 R ± ± ± DF06-18_26 R ± ± ± DF06-18_ ± ± ± DF06-18_28 R ± ± ± DF06-18_29 R ± ± ± DF06-18_ ± ± ± DF06-18_31 R ± ± ± DF06-18_ ± ± ± DF06-18_33 R ± ± ± DF06-18_34 R ± ± ± DF06-18_35 R ± ± ± DF06-18_36 R ± ± ± DF06-18_37 R ± ± ± DF06-18_38 R ± ± ± DF06-18_ ± ± ± DF06-18_ ± ± ± DF06-18_ ± ± ± DF06-18_42 R ± ± ±
102 Table Continued. DF06-18_43 R ± ± ± DF06-18_44 R ± ± ± DF06-18_ ± ± ± DF06-18_ ± ± ± DF06-18_47 R ± ± ± DF06-18_48 R ± ± ± DF06-18_ ± ± ± DF06-18_50 R ± ± ± DF06-18_ ± ± ± DF06-18_ ± ± ± DF06-18_ ± ± ± DF06-18_ ± ± ± DF06-18_ ± ± ± DF06-18_ ± ± ± DF06-18_57 R ± ± ± DF06-18_ ± ± ± DF06-18_59 R ± ± ± DF06-18_60 R ± ± ± DF06-18_ ± ± ± DF06-18_62 R ± ± ± DF06-18_63 R ± ± ± DF06-18_64 R ± ± ± DF06-18_ ± ± ± DF06-18_66 R ± ± ± DF06-18_ ± ± ± DF06-18_68 R ± ± ± DF06-18_ ± ± ±
103 Table Continued. DF06-18_70 R ± ± ± DF06-18_ ± ± ± DF06-18_72 R ± ± ± DF06-18_ ± ± ± DF06-18_ ± ± ± DF06-18_ ± ± ± DF06-18_ ± ± ± DF06-18_ ± ± ± DF06-18_ ± ± ± DF06-18_79 R ± ± ± DF06-18_80 R ± ± ± R denotes samples removed due to high error and/or discordance. * 235 U values calculated from measured 238 U Table U-Pb (MC-ICP-MS) analysis common Pb corrected results for sample DF09-38 from the Kaoko Belt. Sample 207 Pb/ 1σ error 207 Pb/ 1σ 206 Pb/ 1σ error 207 Pb/ 206 Pb 207 Pb/ 235 U* 206 Pb 235 U* error* 238 U Age (Ma) Age (Ma) 206 Pb/ 238 U Age (Ma) percent discord. DF09-38_ ± ± ± DF09-38_ ± ± ± DF09-38_ ± ± ± DF09-38_ ± ± ± DF09-38_5 R ± ± ± DF09-38_ ± ± ± DF09-38_ ± ± ± DF09-38_ ± ± ± DF09-38_ ± ± ± DF09-38_ ± ± ± DF09-38_ ± ± ± DF09-38_ ± ± ± rho factor 103
104 Table Continued. DF09-38_13 R ± ± ± DF09-38_ ± ± ± DF09-38_ ± ± ± DF09-38_ ± ± ± DF09-38_ ± ± ± DF09-38_ ± ± ± DF09-38_ ± ± ± DF09-38_20 R ± ± ± DF09-38_21 R ± ± ± DF09-38_ ± ± ± DF09-38_ ± ± ± DF09-38_ ± ± ± DF09-38_25 R ± ± ± DF09-38_26 R ± ± ± DF09-38_ ± ± ± DF09-38_ ± ± ± DF09-38_ ± ± ± DF09-38_ ± ± ± DF09-38_31 R ± ± ± DF09-38_ ± ± ± DF09-38_ ± ± ± DF09-38_ ± ± ± DF09-38_ ± ± ± DF09-38_ ± ± ± DF09-38_ ± ± ± DF09-38_38 R ± ± ± DF09-38_ ± ± ± DF09-38_ ± ± ±
105 Table Continued. DF09-38_ ± ± ± DF09-38_ ± ± ± DF09-38_ ± ± ± DF09-38_ ± ± ± DF09-38_45 R ± ± ± DF09-38_ ± ± ± DF09-38_ ± ± ± DF09-38_ ± ± ± DF09-38_49 R ± ± ± DF09-38_ ± ± ± DF09-38_ ± ± ± DF09-38_ ± ± ± DF09-38_ ± ± ± DF09-38_ ± ± ± DF09-38_ ± ± ± DF09-38_56 R ± ± ± DF09-38_ ± ± ± DF09-38_ ± ± ± DF09-38_ ± ± ± R denotes samples removed due to high error and/or discordance. * 235 U values calculated from measured 238 U 105
106 Table U-Pb (MC-ICP-MS) analysis common Pb corrected results for sample DF09-39 from the Kaoko Belt. Sample 207 Pb/ 1σ error 207 Pb/ 1σ 206 Pb/ 1σ error 207 Pb/ 206 Pb 207 Pb/ 235 U* 206 Pb 235 U* error* 238 U Age (Ma) Age (Ma) 206 Pb/ 238 U Age (Ma) percent discord. DF09-39_1 R ± ± ± DF09-39_2 R ± ± ± DF09-39_ ± ± ± DF09-39_ ± ± ± DF09-39_5 R ± ± ± DF09-39_ ± ± ± DF09-39_ ± ± ± DF09-39_ ± ± ± DF09-39_9 R ± ± ± DF09-39_ ± ± ± DF09-39_11 R ± ± ± DF09-39_ ± ± ± DF09-39_ ± ± ± DF09-39_ ± ± ± DF09-39_15 R ± ± ± DF09-39_16 R ± ± ± DF09-39_ ± ± ± DF09-39_ ± ± ± DF09-39_19 R ± ± ± DF09-39_ ± ± ± DF09-39_21 R ± ± ± DF09-39_22 R ± ± ± DF09-39_23 R ± ± ± DF09-39_24 R ± ± ± DF09-39_25 R ± ± ± rho factor 106
107 Table Continued. DF09-39_ ± ± ± DF09-39_ ± ± ± DF09-39_ ± ± ± DF09-39_29 R ± ± ± DF09-39_ ± ± ± DF09-39_31 R ± ± ± DF09-39_ ± ± ± DF09-39_33 R ± ± ± DF09-39_ ± ± ± DF09-39_ ± ± ± DF09-39_ ± ± ± DF09-39_ ± ± ± DF09-39_ ± ± ± DF09-39_39 R ± ± ± DF09-39_ ± ± ± DF09-39_41 R ± ± ± R denotes samples removed due to high error and/or discordance. * 235 U values calculated from measured 238 U 107
108 Table U-Pb (MC-ICP-MS) analysis common Pb corrected results for sample DF06-11 from the Kaoko Belt. Sample 207 Pb/ 1σ error 207 Pb/ 1σ 206 Pb/ 1σ error 207 Pb/ 206 Pb 207 Pb/ 235 U* 206 Pb 235 U* error* 238 U Age (Ma) Age (Ma) 206 Pb/ 238 U Age (Ma) percent discord. DF06-11_1 R ± ± ± DF06-11_ ± ± ± DF06-11_ ± ± ± DF06-11_ ± ± ± DF06-11_ ± ± ± DF06-11_ ± ± ± DF06-11_ ± ± ± DF06-11_ ± ± ± DF06-11_8b R ± ± ± DF06-11_9 R ± ± ± DF06-11_10 R ± ± ± DF06-11_11 R ± ± ± DF06-11_ ± ± ± DF06-11_13 R ± ± ± DF06-11_14 R ± ± ± DF06-11_ ± ± ± DF06-11_16 R ± ± ± DF06-11_17 R ± ± ± DF06-11_18 R ± ± ± DF06-11_ ± ± ± DF06-11_ ± ± ± DF06-11_21 R ± ± ± DF06-11_22 R ± ± ± DF06-11_23 R ± ± ± DF06-11_ ± ± ± DF06-11_ ± ± ± rho factor 108
109 Table Continued. DF06-11_26 R ± ± ± DF06-11_ ± ± ± DF06-11_ ± ± ± DF06-11_ ± ± ± DF06-11_ ± ± ± DF06-11_ ± ± ± DF06-11_ ± ± ± DF06-11_ ± ± ± DF06-11_34 R ± ± ± DF06-11_ ± ± ± DF06-11_ ± ± ± DF06-11_37 R ± ± ± DF06-11_ ± ± ± DF06-11_ ± ± ± DF06-11_40 R ± ± ± DF06-11_41 R ± ± ± DF06-11_42 R ± ± ± DF06-11_43 R ± ± ± DF06-11_ ± ± ± DF06-11_ ± ± ± DF06-11_ ± ± ± DF06-11_47 R ± ± ± DF06-11_ ± ± ± DF06-11_49 R ± ± ± DF06-11_ ± ± ± DF06-11_51 R ± ± ± DF06-11_ ± ± ± DF06-11_ ± ± ±
110 Table Continued. DF06-11_ ± ± ± DF06-11_ ± ± ± DF06-11_56 R ± ± ± DF06-11_ ± ± ± DF06-11_ ± ± ± DF06-11_ ± ± ± DF06-11_ ± ± ± DF06-11_61 R ± ± ± DF06-11_ ± ± ± DF06-11_63 R ± ± ± DF06-11_64 R ± ± ± DF06-11_65 R ± ± ± DF06-11_ ± ± ± DF06-11_ ± ± ± DF06-11_ ± ± ± DF06-11_ ± ± ± DF06-11_ ± ± ± DF06-11_ ± ± ± DF06-11_72 R ± ± ± DF06-11_ ± ± ± DF06-11_ ± ± ± DF06-11_ ± ± ± DF06-11_ ± ± ± DF06-11_ ± ± ± DF06-11_ ± ± ± DF06-11_ ± ± ± DF06-11_80 R ± ± ± DF06-11_ ± ± ±
111 Table Continued. DF06-11_ ± ± ± DF06-11_ ± ± ± DF06-11_84 R ± ± ± DF06-11_ ± ± ± DF06-11_86 R ± ± ± DF06-11_ ± ± ± DF06-11_88 R ± ± ± DF06-11_89 R ± ± ± DF06-11_90 R ± ± ± DF06-11_ ± ± ± DF06-11_ ± ± ± DF06-11_ ± ± ± DF06-11_ ± ± ± DF06-11_95 R ± ± ± DF06-11_96 R ± ± ± DF06-11_ ± ± ± DF06-11_ ± ± ± DF06-11_99 R ± ± ± DF06-11_ ± ± ± DF06-11_ ± ± ± DF06-11_ ± ± ± DF06-11_ ± ± ± DF06-11_ ± ± ± DF06-11_105 R ± ± ± DF06-11_ ± ± ± DF06-11_107 R ± ± ± DF06-11_108 R ± ± ± DF06-11_ ± ± ±
112 Table U-Pb (MC-ICP-MS) analysis common Pb corrected results for sample DF06-17 from the Kaoko Belt. Sample 207 Pb/ 1σ error 207 Pb/ 1σ 206 Pb/ 1σ error 207 Pb/ 206 Pb 207 Pb/ 235 U* 206 Pb 235 U* error* 238 U Age (Ma) Age (Ma) 206 Pb/ 238 U Age (Ma) percent discord. DF06-17_50 R ± ± ± DF06-17_51 R ± ± ± DF06-17_ ± ± ± DF06-17_ ± ± ± DF06-17_ ± ± ± DF06-17_ ± ± ± DF06-17_56 R ± ± ± DF06-17_57 R ± ± ± DF06-17_58 R ± ± ± DF06-17_ ± ± ± DF06-17_ ± ± ± DF06-17_ ± ± ± DF06-17_62 R ± ± ± DF06-17_ ± ± ± DF06-17_ ± ± ± DF06-17_ ± ± ± DF06-17_ ± ± ± DF06-17_ ± ± ± DF06-17_68 R ± ± ± DF06-17_ ± ± ± DF06-17_ ± ± ± DF06-17_ ± ± ± DF06-17_ ± ± ± DF06-17_ ± ± ± DF06-17_74 R ± ± ± DF06-17_ ± ± ± rho factor 112
113 Table Continued. DF06-17_ ± ± ± DF06-17_77 R ± ± ± DF06-17_ ± ± ± DF06-17_ ± ± ± DF06-17_ ± ± ± DF06-17_ ± ± ± DF06-17_ ± ± ± DF06-17_83 R ± ± ± DF06-17_84 R ± ± ± DF06-17_ ± ± ± DF06-17_86 R ± ± ± DF06-17_87 R ± ± ± DF06-17_ ± ± ± DF06-17_ ± ± ± DF06-17_90 R ± ± ± DF06-17_ ± ± ± ± DF06-17_92 R ± ± DF06-17_ ± ± ± DF06-17_ ± ± ± DF06-17_95 R ± ± ± DF06-17_ ± ± ± DF06-17_97 R ± ± ± DF06-17_ ± ± ± DF06-17_ ± ± ± R denotes samples removed due to high error and/or discordance. * 235 U values calculated from measured 238 U 113
114 Table U-Pb (MC-ICP-MS) analysis common Pb corrected results for sample DF06-08 from the Kaoko Belt. Sample 207 Pb/ 1σ error 207 Pb/ 1σ 206 Pb/ 1σ error 207 Pb/ 206 Pb 207 Pb/ 235 U* 206 Pb 235 U* error* 238 U Age (Ma) Age (Ma) 206 Pb/ 238 U Age (Ma) percent discord. DF06-08_ ± ± ± DF06-08_13b ± ± ± DF06-08_14 R ± ± ± DF06-08_15 R ± ± ± DF06-08_16 R ± ± ± DF06-08_ ± ± ± DF06-08_ ± ± ± DF06-08_19 R ± ± ± DF06-08_ ± ± ± DF06-08_ ± ± ± DF06-08_22 R ± ± ± DF06-08_ ± ± ± DF06-08_24 R ± ± ± DF06-08_ ± ± ± DF06-08_ ± ± ± DF06-08_ ± ± ± DF06-08_ ± ± ± DF06-08_29 R ± ± ± DF06-08_ ± ± ± DF06-08_ ± ± ± DF06-08_ ± ± ± DF06-08_ ± ± ± DF06-08_ ± ± ± DF06-08_35 R ± ± ± DF06-08_ ± ± ± DF06-08_ ± ± ± DF06-08_ ± ± ± rho factor 114
115 Table Continued. DF06-08_39 R ± ± ± DF06-08_ ± ± ± DF06-08_ ± ± ± DF06-08_42 R ± ± ± DF06-08_43 R ± ± ± DF06-08_ ± ± ± DF06-08_45 R ± ± ± DF06-08_ ± ± ± DF06-08_ ± ± ± DF06-08_ ± ± ± DF06-08_ ± ± ± DF06-08_ ± ± ± DF06-08_ ± ± ± DF06-08_ ± ± ± DF06-08_ ± ± ± DF06-08_ ± ± ± DF06-08_ ± ± ± DF06-08_ ± ± ± DF06-08_ ± ± ± DF06-08_ ± ± ± DF06-08_59 R ± ± ± DF06-08_60 R ± ± ± DF06-08_ ± ± ± DF06-08_ ± ± ± DF06-08_63 R ± ± ± DF06-08_ ± ± ± DF06-08_ ± ± ± DF06-08_ ± ± ±
116 Table Continued. DF06-08_ ± ± ± DF06-08_ ± ± ± DF06-08_ ± ± ± DF06-08_ ± ± ± DF06-08_ ± ± ± DF06-08_ ± ± ± DF06-08_ ± ± ± DF06-08_ ± ± ± DF06-08_ ± ± ± DF06-08_ ± ± ± DF06-08_ ± ± ± DF06-08_ ± ± ± DF06-08_ ± ± ± DF06-08_ ± ± ± DF06-08_81 R ± ± ± DF06-08_82 R ± ± ± DF06-08_ ± ± ± DF06-08_ ± ± ± DF06-08_85 R ± ± ± DF06-08_86 R ± ± ± DF06-08_ ± ± ± DF06-08_ ± ± ± DF06-08_89 R ± ± ± DF06-08_ ± ± ± DF06-08_ ± ± ± DF06-08_92 R ± ± ± DF06-08_93 R ± ± ± DF06-08_94 R ± ± ±
117 Table Continued. DF06-08_ ± ± ± DF06-08_ ± ± ± DF06-08_97 R ± ± ± DF06-08_ ± ± ± DF06-08_ ± ± ± DF06-08_ ± ± ± DF06-08_ ± ± ± DF06-08_ ± ± ± DF06-08_103 R ± ± ± DF06-08_ ± ± ± DF06-08_ ± ± ± DF06-08_ ± ± ± DF06-08_107 R ± ± ± DF06-08_ ± ± ± DF06-08_ ± ± ± DF06-08_ ± ± ± DF06-08_ ± ± ± R denotes samples removed due to high error and/or discordance. * 235 U values calculated from measured 238 U 117
118 Table Lu-Hf (MC-ICP-MS) analysis corrected results for sample DF09-26 from the Northern Zone, Congo Craton. Sample 176 Lu/ 177 Hf corrected error (+/-) 176 Lu/ 177 Hf measured U-Pb Age T (Int)* Model Age (CHUR) (Ga) Model Age (DM) (Ga) 176 Lu/ 177 Hf (CHUR) T (U-Pb Age) Epsilon Hf at T (U-Pb Age) 176 Lu/ 177 Hf (CHUR) T (int) Epsilon Hf at T (int) percent corr DF09-26_ E DF09-26_ E DF09-26_ E DF09-26_ E DF09-26_17 R E DF09-26_ E DF09-26_ E DF09-26_ E DF09-26_ E DF09-26_39 R E DF09-26_ E DF09-26_43 R E DF09-26_ E DF09-26_45 R E DF09-26_ E DF09-26_ E DF09-26_54 R E DF09-26_ E DF09-26_ E DF09-26_ E DF09-26_71 R E n/a n/a n/a 21.9 DF09-26_72 R E DF09-26_ E DF09-26_ E
119 Table Lu-Hf (MC-ICP-MS) analysis corrected results for sample DF09-30 from the Northern Zone, Congo Craton. Sample 176 Lu/ 177 Hf corrected error (+/-) 176 Lu/ 177 Hf measured U-Pb Age T (Int)* Model Age (CHUR) (Ga) Model Age (DM) (Ga) 176 Lu/ 177 Hf (CHUR) T (U-Pb Age) Epsilon Hf at T (U-Pb Age) 176 Lu/ 177 Hf (CHUR) T (int) Epsilon Hf at T (int) percent corr DF09-30_ E DF09-30_3 R E DF09-30_ E DF09-30_ E DF09-30_12 R E DF09-30_13 R E DF09-30_14 R E DF09-30_ E DF09-30_18 R E DF09-30_ E DF09-30_22 R E DF09-30_ E DF09-30_24 R E DF09-30_26 R E DF09-30_27 R E R denotes samples removed due to high error and/or discordance in U-Pb analysis. *T Int reflects upper U-Pb concordia intercept 119
120 Table Lu-Hf (MC-ICP-MS) analysis corrected results for sample DF09-43 from the Central Zone, Congo Craton. Sample 176 Lu/ 177 Hf corrected error (+/-) 176 Lu/ 177 Hf measured U-Pb Age T (Int)* Model Age (CHUR) (Ga) Model Age (DM) (Ga) 176 Lu/ 177 Hf (CHUR) T (U-Pb Age) Epsilon Hf at T (U-Pb Age) 176 Lu/ 177 Hf (CHUR) T (int) Epsilon Hf at T (int) percent corr DF09-43_ E DF09-43_ E DF09-43_8 R E DF09-43_ E DF09-43_ E DF09-43_ E DF09-43_ E DF09-43_ E DF09-43_ E DF09-43_ E DF09-43_ E DF09-43_ E DF09-43_47 R E n/a n/a n/a 6.9 DF09-43_ E DF09-43_ E DF09-43_ E DF09-43_ E DF09-43_ E DF09-43_ E DF09-43_ E R denotes samples removed due to high error and/or discordance in U-Pb analysis. *T Int reflects upper U-Pb concordia intercept 120
121 Table Lu-Hf (MC-ICP-MS) analysis corrected results for sample DF09-44 from the Central Zone, Congo Craton. Sample 176 Lu/ 177 Hf corrected error (+/-) 176 Lu/ 177 Hf measured U-Pb Age T (Int)* Model Age (CHUR) (Ga) Model Age (DM) (Ga) 176 Lu/ 177 Hf (CHUR) T (U-Pb Age) Epsilon Hf at T (U-Pb Age) 176 Lu/ 177 Hf (CHUR) T (int) Epsilon Hf at T (int) percent corr DF09-44_ E DF09-44_ E DF09-44_ E DF09-44_ E DF09-44_ E DF09-44_ E DF09-44_ E DF09-44_ E DF09-44_ E DF09-44_ E DF09-44_ E DF09-44_ E DF09-44_ E DF09-44_ E DF09-44_ E DF09-44_ E DF09-44_ E DF09-44_ E DF09-44_ E DF09-44_ E R denotes samples removed due to high error and/or discordance in U-Pb analysis. *T Int reflects upper U-Pb concordia intercept 121
122 Table Lu-Hf (MC-ICP-MS) analysis corrected results for sample CZ29 from the Central Zone, Congo Craton. Sample 176 Lu/ 177 Hf corrected error (+/-) 176 Lu/ 177 Hf measured U-Pb Age T (Int)* Model Age (CHUR) (Ga) Model Age (DM) (Ga) 176 Lu/ 177 Hf (CHUR) T (U-Pb Age) Epsilon Hf at T (U-Pb Age) 176 Lu/ 177 Hf (CHUR) T (int) Epsilon Hf at T (int) percent corr CZ29_ E CZ29_ E CZ29_ E CZ29_ E CZ29_8 R E n/a n/a n/a 26.0 CZ29_9 R E CZ29_10 R E CZ29_ E CZ29_13 R E CZ29_14 R E n/a n/a n/a 5.5 CZ29_15 R E CZ29_ E CZ29_ E CZ29_18 R E CZ29_19 R E R denotes samples removed due to high error and/or discordance in U-Pb analysis. *T Int reflects upper U-Pb concordia intercept 122
123 Table Lu-Hf (MC-ICP-MS) analysis corrected results for sample CZ53b from the Central Zone, Congo Craton. Sample 176 Lu/ 177 Hf corrected error (+/-) 176 Lu/ 177 Hf measured U-Pb Age T (Int)* Model Age (CHUR) (Ga) Model Age (DM) (Ga) 176 Lu/ 177 Hf (CHUR) T (U-Pb Age) Epsilon Hf at T (U-Pb Age) 176 Lu/ 177 Hf (CHUR) T (int) Epsilon Hf at T (int) percent corr CZ53b_1 R E n/a n/a n/a 19.9 CZ53b_2 R E n/a n/a n/a 25.9 CZ53b_3 R E n/a n/a n/a 13.7 CZ53b_4 R E n/a n/a n/a 15.4 CZ53b_6 R E n/a n/a n/a 13.4 CZ53b_9 R E n/a n/a n/a 11.1 CZ53b_ E CZ53b_14 R E n/a n/a n/a 19.1 CZ53b_15 R E CZ53b_ E CZ53b_19 R E n/a n/a n/a 37.0 CZ53b_ E CZ53b_ E CZ53b_ E CZ53b_ E CZ53b_ E CZ53b_28 R E n/a n/a n/a 21.2 CZ53b_30 R E CZ53b_ E CZ53b_33 R E n/a n/a n/a 25.9 CZ53b_ E CZ53b_36 R E CZ53b_ E CZ53b_ E
124 Table Continued. CZ53b_ E CZ53b_42 R E CZ53b_ E CZ53b_ E CZ53b_ E CZ53b_ E CZ53b_ E CZ53b_ E CZ53b_52 R E CZ53b_ E CZ53b_ E CZ53b_ E CZ53b_ E CZ53b_ E CZ53b_ E CZ53b_ E CZ53b_ E CZ53b_ E CZ53b_ E CZ53b_68 R E n/a n/a n/a 24.1 CZ53b_ E CZ53b_73 R E n/a n/a n/a 18.8 CZ53b_ E CZ53b_ E CZ53b_ E CZ53b_ E CZ53b_ E CZ53b_ E CZ53b_ E
125 Table Continued. CZ53b_ E CZ53b_ E CZ53b_ E CZ53b_ E CZ53b_ E CZ53b_101 R E n/a n/a n/a 21.8 CZ53b_ E R denotes samples removed due to high error and/or discordance in U-Pb analysis. *T Int reflects upper U-Pb concordia intercept Table Lu-Hf (MC-ICP-MS) analysis corrected results for sample CZ35 from the Central Zone, Congo Craton. Sample 176 Lu/ 177 Hf corrected error (+/-) 176 Lu/ 177 Hf measured U-Pb Age T (Int)* Model Age (CHUR) (Ga) Model Age (DM) (Ga) 176 Lu/ 177 Hf (CHUR) T (U-Pb Age) Epsilon Hf at T (U-Pb Age) 176 Lu/ 177 Hf (CHUR) T (int) Epsilon Hf at T (int) percent corr CZ35_ E CZ35_ E CZ35_ E CZ35_ E CZ35_ E CZ35_ E CZ35_ E CZ35_ E CZ35_ E CZ35_17 R E n/a n/a n/a 15.7 CZ35_ E CZ35_ E CZ35_ E CZ35_ E CZ35_ E
126 Table Continued. CZ35_ E CZ35_29 R E CZ35_ E CZ35_ E CZ35_ E CZ35_ E CZ35_40 R E n/a n/a n/a 14.7 CZ35_ E CZ35_ E CZ35_ E CZ35_ E CZ35_ E CZ35_ E CZ35_ E CZ35_ E CZ35_ E CZ35_ E CZ35_ E CZ35_ E CZ35_ E CZ35_ E CZ35_65 R E CZ35_ E CZ35_ E CZ35_ E CZ35_ E CZ35_ E CZ35_ E CZ35_ E
127 Table Continued. CZ35_ E CZ35_ E CZ35_ E CZ35_ E CZ35_ E CZ35_ E R denotes samples removed due to high error and/or discordance in U-Pb analysis. *T Int reflects upper U-Pb concordia intercept Table Lu-Hf (MC-ICP-MS) analysis corrected results for sample DF06-22 from the Southern Zone, Congo Craton. Sample 176 Lu/ 177 Hf corrected error (+/-) U-Pb Age T (Int)* 176 Lu/ 177 Hf measur ed Model Age (CHUR) (Ga) Model Age (DM) (Ga) 176 Lu/ 177 Hf (CHUR) T (U-Pb Age) Epsilon Hf at T (U-Pb Age) 176 Lu/ 177Hf (CHUR) T (int) Epsilon Hf at T (int) percent corr DF06-22_ E DF06-22_ E DF06-22_ E DF06-22_ E DF06-22_8 R E n/a n/a n/a 63.6 DF06-22_ E DF06-22_10 R E n/a n/a n/a 15.0 DF06-22_ E DF06-22_ E DF06-22_17 R E DF06-22_ E DF06-22_19 R E DF06-22_ E DF06-22_ E DF06-22_22 R E
128 Table Continued. DF06-22_ E DF06-22_24 R E DF06-22_25 R E DF06-22_26 R E DF06-22_27 R E DF06-22_28 R E DF06-22_ E DF06-22_30 R E DF06-22_ E DF06-22_32 R E DF06-22_33 R E DF06-22_34 R E DF06-22_ E DF06-22_38 R E DF06-22_ E R denotes samples removed due to high error and/or discordance in U-Pb analysis. *T Int reflects upper U-Pb concordia intercept Table Lu-Hf (MC-ICP-MS) analysis corrected results for sample SZ13 from the Southern Zone, Congo Craton. Sample 176 Lu/ 177 Hf corrected error (+/-) U-Pb Age T (Int)* 176 Lu/ 177 Hf measur ed Model Age (CHUR) (Ga) Model Age (DM) (Ga) 176 Lu/ 177 Hf (CHUR) T (U-Pb Age) Epsilon Hf at T (U-Pb Age) 176 Lu/ 177Hf (CHUR) T (int) Epsilon Hf at T (int) percent corr SZ13_1 R E n/a n/a n/a 12.8 SZ13_ E SZ13_ E SZ13_ E SZ13_ E
129 Table Continued. SZ13_ E SZ13_7 R E n/a n/a n/a 20.6 SZ13_ E SZ13_9 R E n/a n/a n/a 8.5 SZ13_10a R E n/a n/a n/a 7.7 SZ13_12 R E n/a n/a n/a 21.1 SZ13_ E SZ13_ E SZ13_16 R E n/a n/a n/a 11.0 SZ13_17 R E SZ13_18 R E n/a n/a n/a 23.1 SZ13_19 R E n/a n/a n/a 18.0 SZ13_20 R E n/a n/a n/a 18.6 SZ13_ E SZ13_ E SZ13_23 R E SZ13_ E SZ13_ E SZ13_ E SZ13_ E SZ13_ E SZ13_ E SZ13_ E SZ13_ E SZ13_ E SZ13_35 R E n/a n/a n/a 7.3 SZ13_ E SZ13_ E
130 Table Continued. SZ13_ E SZ13_46 R E SZ13_ E SZ13_49 R E SZ13_ E SZ13_52 R E n/a n/a n/a 5.9 SZ13_ E SZ13_ E SZ13_56 R E n/a n/a n/a 12.1 SZ13_ E SZ13_ E SZ13_59 R E SZ13_62 R E n/a n/a n/a 23.0 SZ13_ E SZ13_64 R E SZ13_66 R E n/a n/a n/a 18.3 SZ13_68 R E SZ13_69 R E n/a n/a n/a 7.9 SZ13_70 R E SZ13_71 R E n/a n/a n/a 21.8 SZ13_72 R E SZ13_ E SZ13_ E SZ13_76 R E n/a n/a n/a 18.7 SZ13_ E SZ13_78 R E n/a n/a n/a 14.0 SZ13_79 R E n/a n/a n/a
131 Table Continued. SZ13_ E SZ13_82 R E n/a n/a n/a 7.2 SZ13_87 R E SZ13_ E SZ13_91 R E n/a n/a n/a 12.9 SZ13_ E SZ13_ E SZ13_ E SZ13_98 R E SZ13_ E SZ13_ E SZ13_101 R E n/a n/a n/a 19.0 SZ13_102 R E n/a n/a n/a 18.7 SZ13_103 R E SZ13_ E SZ13_ E SZ13_ E SZ13_ E R denotes samples removed due to high error and/or discordance in U-Pb analysis. *T Int reflects upper U-Pb concordia intercept 131
132 Table Lu-Hf (MC-ICP-MS) analysis corrected results for sample DF09-12a from the Southern Margin Zone, Kalahari Craton. Sample 176 Lu/ 177 Hf corrected error (+/-) 176 Lu/ 177 Hf measured U-Pb Age T (Int)* Model Age (CHUR) (Ga) Model Age (DM) (Ga) 176 Lu/ 177 Hf (CHUR) T (U-Pb Age) Epsilon Hf at T (U-Pb Age) 176 Lu/ 177 Hf (CHUR) T (int) Epsilon Hf at T (int) percent corr DF09-12a_ E DF09-12a_ E DF09-12a_ E DF09-12a_ E DF09-12a_ E DF09-12a_ E DF09-12a_13 R E DF09-12a_ E DF09-12a_ E DF09-12a_18 R E DF09-12a_ E DF09-12a_ E DF09-12a_ E DF09-12a_25 R E DF09-12a_ E DF09-12a_ E DF09-12a_ E DF09-12a_ E DF09-12a_ E DF09-12a_35 R E DF09-12a_ E DF09-12a_ E DF09-12a_ E DF09-12a_ E DF09-12a_ E
133 Table Continued. DF09-12a_ E DF09-12a_58 R E DF09-12a_62 R E DF09-12a_ E R denotes samples removed due to high error and/or discordance in U-Pb analysis. *T Int reflects upper U-Pb concordia intercept Table Lu-Hf (MC-ICP-MS) analysis corrected results for sample DF09-04 from the Southern Margin Zone, Kalahari Craton. Sample 176 Lu/ 177 Hf correcte d error (+/-) 176 Lu/ 177 Hf measure d Model Age (CHUR) (Ga) Model Age (DM) (Ga) U-Pb Age 176 Lu/ 177 Hf (CHUR) T (U-Pb Age) Epsilon Hf at T (U-Pb Age) T (Int)* 176 Lu/ 177 Hf (CHUR) T (int) Epsilon Hf at T (int) percent corr DF09-04_ E DF09-04_ E DF09-04_ E DF09-04_ E DF09-04_ E DF09-04_ E DF09-04_ E DF09-04_ E DF09-04_ E DF09-04_ E DF09-04_ E DF09-04_ E DF09-04_ E DF09-04_ E DF09-04_48 R E R denotes samples removed due to high error and/or discordance in U-Pb analysis. *T Int reflects upper U-Pb concordia intercept 133
134 Table Lu-Hf (MC-ICP-MS) analysis corrected results for sample DF06-40 from the Southern Foreland Zone, Kalahari Craton. Sample 176 Lu/ 177 Hf corrected error (+/-) 176 Lu/ 177 Hf measured U-Pb Age T (Int)* Model Age (CHUR) (Ga) Model Age (DM) (Ga) 176 Lu/ 177 Hf (CHUR) T (U-Pb Age) Epsilon Hf at T (U-Pb Age) 176 Lu/ 177 Hf (CHUR) T (int) Epsilon Hf at T (int) percent corr DF06_40_ E DF06_40_8 R E DF06_40_9 R E DF06_40_ E DF06_40_ E DF06_40_ E DF06_40_17 R E DF06_40_ E DF06_40_ E DF06_40_ E DF06_40_ E DF06_40_ E DF06_40_ E DF06_40_ E DF06_40_ E DF06_40_45 R E DF06_40_ E DF06_40_ E DF06_40_ E R denotes samples removed due to high error and/or discordance in U-Pb analysis. *T Int reflects upper U-Pb concordia intercept 134
135 Table Lu-Hf (MC-ICP-MS) analysis corrected results for sample DF06-41 from the Southern Foreland Zone, Kalahari Craton. Sample 176 Lu/ 177 Hf corrected error (+/-) 176 Lu/ 177 Hf measured U-Pb Age T (Int)* Model Age (CHUR) (Ga) Model Age (DM) (Ga) 176 Lu/ 177 Hf (CHUR) T (U-Pb Age) Epsilon Hf at T (U-Pb Age) 176 Lu/ 177 Hf (CHUR) T (int) Epsilon Hf at T (int) percent corr DF06-41_04 R E DF06-41_ E DF06-41_ E DF06-41_ E DF06-41_ E DF06-41_ E DF06-41_ E DF06-41_ E DF06-41_32 R E DF06-41_ E DF06-41_ E DF06-41_39 R E DF06-41_42 R E DF06-41_ E DF06-41_ E DF06-41_ E DF06-41_ E DF06-41_ E DF06-41_54 R E DF06-41_ E DF06-41_ E DF06-41_ E DF06-41_ E R denotes samples removed due to high error and/or discordance in U-Pb analysis. *T Int reflects upper U-Pb concordia intercept 135
136 Table Lu-Hf (MC-ICP-MS) analysis corrected results for sample DF06-45 from the Southern Foreland Zone, Kalahari Craton. Sample 176 Lu/ 177 Hf corrected error (+/-) 176 Lu/ 177 Hf measured U-Pb Age T (Int)* Model Age (CHUR) (Ga) Model Age (DM) (Ga) 176 Lu/ 177 Hf (CHUR) T (U-Pb Age) Epsilon Hf at T (U-Pb Age) 176 Lu/ 177 Hf (CHUR) T (int) Epsilon Hf at T (int) percent corr DF06-45_06 R E n/a n/a n/a 15.6 DF06-45_ E DF06-45_ E DF06-45_ E DF06-45_ E DF06-45_ E DF06-45_ E DF06-45_ E DF06-45_ E DF06-45_ E DF06-45_29 R E DF06-45_ E DF06-45_ E DF06-45_39 R E DF06-45_ E DF06-45_ E DF06-45_ E DF06-45_ E DF06-45_55 R E DF06-45_56 R E DF06-45_ E DF06-45_ E R denotes samples removed due to high error and/or discordance in U-Pb analysis. *T Int reflects upper U-Pb concordia intercept 136
137 Table Lu-Hf (MC-ICP-MS) analysis corrected results for sample DF06-44 from the Southern Foreland Zone, Kalahari Craton. Sample 176 Lu/ 177 Hf corrected error (+/-) 176 Lu/ 177 Hf measured U-Pb Age T (Int)* Model Age (CHUR) (Ga) Model Age (DM) (Ga) 176 Lu/ 177 Hf (CHUR) T (U-Pb Age) Epsilon Hf at T (U-Pb Age) 176 Lu/ 177 Hf (CHUR) T (int) Epsilon Hf at T (int) percent corr DF06-44_ E DF06-44_02 R E DF06-44_03 R E DF06-44_ E DF06-44_ E DF06-44_09 R E DF06-44_ E DF06-44_ E DF06-44_ E DF06-44_21 R E DF06-44_ E DF06-44_24 R E DF06-44_ E DF06-44_ E DF06-44_35 R E DF06-44_ E DF06-44_44 R E DF06-44_ E DF06-44_ E DF06-44_ E DF06-44_ E DF06-44_ E R denotes samples removed due to high error and/or discordance in U-Pb analysis. *T Int reflects upper U-Pb concordia intercept 137
138 Table Lu-Hf (MC-ICP-MS) analysis corrected results for sample DF06-43 from the Southern Foreland Zone, Kalahari Craton. Sample 176 Lu/ 177 Hf corrected error (+/-) 176 Lu/ 177 Hf measured U-Pb Age T (Int)* Model Age (CHUR) (Ga) Model Age (DM) (Ga) 176 Lu/ 177 Hf (CHUR) T (U-Pb Age) Epsilon Hf at T (U-Pb Age) 176 Lu/ 177 Hf (CHUR) T (int) Epsilon Hf at T (int) percent corr DF06-43_ E DF06-43_04 R E DF06-43_ E DF06-43_ E DF06-43_ E DF06-43_ E DF06-43_ E DF06-43_ E DF06-43_ E DF06-43_ E DF06-43_ E DF06-43_ E DF06-43_ E DF06-43_ E DF06-43_ E DF06-43_ E DF06-43_ E DF06-43_ E DF06-43_42 R E n/a n/a n/a 10.1 DF06-43_ E DF06-43_ E DF06-43_ E DF06-43_ E R denotes samples removed due to high error and/or discordance in U-Pb analysis. *T Int reflects upper U-Pb concordia intercept 138
139 Table Lu-Hf (MC-ICP-MS) analysis corrected results for sample DF06-18 from the Kaoko Belt. Sample 176 Lu/ 177 Hf corrected error (+/-) 176 Lu/ 177 Hf measured U-Pb Age Model Age (CHUR) (Ga) Model Age (DM) (Ga) 176 Lu/ 177 Hf (CHUR) T (U-Pb Age) Epsilon Hf at T (U-Pb Age) T (Int)* 176 Lu/ 177 Hf (CHUR) T (int) Epsilon Hf at T (int) percent corr DF06-18_1 R E DF06-18_3 R E n/a n/a n/a 85.2 DF06-18_5 R E n/a n/a n/a 43.3 DF06-18_9 R E DF06-18_11 R E n/a n/a n/a 9.3 DF06-18_ E DF06-18_ E DF06-18_15 R E n/a n/a n/a 15.2 DF06-18_ E DF06-18_18 R E n/a n/a n/a 28.1 DF06-18_20 R E n/a n/a n/a 51.1 DF06-18_ E DF06-18_ E DF06-18_ E DF06-18_ E DF06-18_31 R E DF06-18_ E DF06-18_34 R E n/a n/a n/a 10.9 DF06-18_36 R E DF06-18_37 R E n/a n/a n/a 12.4 DF06-18_ E DF06-18_42 R E DF06-18_ E DF06-18_ E
140 Table Continued. DF06-18_ E DF06-18_ E DF06-18_ E DF06-18_59 R E n/a n/a n/a 4.3 DF06-18_ E DF06-18_63 R E DF06-18_64 R E DF06-18_ E DF06-18_66 R E n/a n/a n/a 16.4 DF06-18_68 R E n/a n/a n/a 24.3 DF06-18_70 R E DF06-18_ E DF06-18_ E DF06-18_ E DF06-18_ E DF06-18_80 R E R denotes samples removed due to high error and/or discordance in U-Pb analysis. *T Int reflects upper U-Pb concordia intercept 140
141 Table Lu-Hf (MC-ICP-MS) analysis corrected results for sample DF09-38 from the Kaoko Belt. Sample 176 Lu/ 177 Hf corrected error (+/-) 176 Lu/ 177 Hf measured U-Pb Age Model Age (CHUR) (Ga) Model Age (DM) (Ga) 176 Lu/ 177 Hf (CHUR) T (U-Pb Age) Epsilon Hf at T (U-Pb Age) T (Int)* 176 Lu/ 177 Hf (CHUR) T (int) Epsilon Hf at T (int) percent corr DF09-38_ E DF09-38_ E DF09-38_ E DF09-38_ E DF09-38_ E DF09-38_ E DF09-38_ E DF09-38_31 R E DF09-38_ E DF09-38_ E DF09-38_ E DF09-38_ E DF09-38_ E DF09-38_ E DF09-38_ E DF09-38_ E DF09-38_ E DF09-38_56 R E DF09-38_ E DF09-38_ E R denotes samples removed due to high error and/or discordance in U-Pb analysis. *T Int reflects upper U-Pb concordia intercept 141
142 Table Lu-Hf (MC-ICP-MS) analysis corrected results for sample DF09-39 from the Kaoko Belt. Sample 176 Lu/ 177 Hf correcte d error (+/-) 176 Lu/ 177 Hf measured Model Age (CHUR) (Ga) Model Age (DM) (Ga) U-Pb Age 176 Lu/ 177 Hf (CHUR) T (U-Pb Age) Epsilon Hf at T (U-Pb Age) T (Int)* 176 Lu/ 177 Hf (CHUR) T (int) Epsilon Hf at T (int) percent corr DF09-39_2 R E DF09-39_ E DF09-39_ E DF09-39_ E DF09-39_ E DF09-39_ E DF09-39_ E DF09-39_29 R E DF09-39_30a R E n/a n/a n/a 7.0 DF09-39_ E DF09-39_ E DF09-39_ E R denotes samples removed due to high error and/or discordance in U-Pb analysis. *T Int reflects upper U-Pb concordia intercept 142
143 Table Lu-Hf (MC-ICP-MS) analysis corrected results for sample DF06-11 from the Kaoko Belt. Sample 176 Lu/ 177 Hf corrected error (+/-) 176 Lu/ 177 Hf measured U-Pb Age Model Age (CHUR) (Ga) Model Age (DM) (Ga) 176 Lu/ 177 Hf (CHUR) T (U-Pb Age) Epsilon Hf at T (U-Pb Age) T (Int)* 176 Lu/ 177 Hf (CHUR) T (int) Epsilon Hf at T (int) percent corr DF06-11_1 R E DF06-11_ E DF06-11_ E DF06-11_ E DF06-11_13 R E n/a n/a n/a 8.8 DF06-11_ E DF06-11_18 R E DF06-11_ E DF06-11_23 R E DF06-11_ E DF06-11_ E DF06-11_ E DF06-11_ E DF06-11_ E DF06-11_42 R E DF06-11_ E DF06-11_ E DF06-11_ E DF06-11_ E DF06-11_ E DF06-11_ E DF06-11_ E DF06-11_ E DF06-11_ E DF06-11_ E
144 Table Continued. DF06-11_ E DF06-11_ E DF06-11_ E DF06-11_ E DF06-11_ E DF06-11_84 R E n/a n/a n/a 8.9 DF06-11_ E DF06-11_ E DF06-11_ E DF06-11_ E DF06-11_ E R denotes samples removed due to high error and/or discordance in U-Pb analysis. *T Int reflects upper U-Pb concordia intercept Table Lu-Hf (MC-ICP-MS) analysis corrected results for sample DF06-17 from the Kaoko Belt. Sample 176 Lu/ 177 Hf corrected error (+/-) 176 Lu/ 177 Hf measured U-Pb Age Model Age (CHUR) (Ga) Model Age (DM) (Ga) 176 Lu/ 177 Hf (CHUR) T (U-Pb Age) Epsilon Hf at T (U-Pb Age) T (Int)* 176 Lu/ 177 Hf (CHUR) T (int) Epsilon Hf at T (int) percent corr DF06-17_2 R E n/a n/a n/a 8.9 DF06-17_3 R E n/a n/a n/a 7.7 DF06-17_5 R E n/a n/a n/a 7.7 DF06-17_6 R E n/a n/a n/a 16.2 DF06-17_7 R E n/a n/a n/a 3.9 DF06-17_10 R E n/a n/a n/a 11.5 DF06-17_12 R E n/a n/a n/a 9.0 DF06-17_13 R E n/a n/a n/a 10.1 DF06-17_14 R E n/a n/a n/a
145 Table Continued. DF06-17_15 R E n/a n/a n/a 9.2 DF06-17_18 R E n/a n/a n/a 6.9 DF06-17_19 R E n/a n/a n/a 16.3 DF06-17_21 R E n/a n/a n/a 8.0 DF06-17_23 R E n/a n/a n/a 6.7 DF06-17_28 R E n/a n/a n/a 11.3 DF06-17_29 R E n/a n/a n/a 9.8 DF06-17_30 R E n/a n/a n/a 11.4 DF06-17_31 R E n/a n/a n/a 8.8 DF06-17_34 R E n/a n/a n/a 6.4 DF06-17_40 R E n/a n/a n/a 11.1 DF06-17_44 R E n/a n/a n/a 14.5 DF06-17_50 R E DF06-17_ E DF06-17_ E DF06-17_57 R E DF06-17_58 R E DF06-17_ E DF06-17_62 R E DF06-17_ E DF06-17_ E DF06-17_ E DF06-17_ E DF06-17_74 R E DF06-17_ E DF06-17_77 R E DF06-17_ E
146 Table Continued. DF06-17_84 R E n/a n/a n/a 13.2 DF06-17_ E DF06-17_86 R E DF06-17_90 R E DF06-17_ E DF06-17_ E R denotes samples removed due to high error and/or discordance in U-Pb analysis. *T Int reflects upper U-Pb concordia intercept Table Lu-Hf (MC-ICP-MS) analysis corrected results for sample DF06-08 from the Kaoko Belt. Sample 176 Lu/ 177 Hf correcte d error (+/-) 176 Lu/ 177 Hf measured Model Age (CHUR) (Ga) Model Age (DM) (Ga) U-Pb Age 176 Lu/ 177 Hf (CHUR) T (U-Pb Age) Epsilon Hf at T (U-Pb Age) T (Int)* 176 Lu/ 177 Hf (CHUR) T (int) Epsilon Hf at T (int) percent corr DF06-08_3 R E n/a n/a n/a 12.4 DF06-08_4 R E n/a n/a n/a 15.7 DF06-08_7 R E n/a n/a n/a 16.6 DF06-08_9 R E n/a n/a n/a 13.3 DF06-08_12 R E n/a n/a n/a 5.0 DF06-08_14 R E DF06-08_ E DF06-08_ E DF06-08_ E DF06-08_ E DF06-08_ E DF06-08_ E DF06-08_ E DF06-08_ E
147 Table Continued. DF06-08_ E DF06-08_42 R E DF06-08_ E DF06-08_ E DF06-08_ E DF06-08_63 R E DF06-08_ E DF06-08_ E DF06-08_ E DF06-08_ E DF06-08_ E DF06-08_ E DF06-08_ E DF06-08_81 R E DF06-08_ E DF06-08_ E DF06-08_ E DF06-08_ E DF06-08_ E DF06-08_103 R E DF06-08_ E DF06-08_ E DF06-08_ E R denotes samples removed due to high error and/or discordance in U-Pb analysis. *T Int reflects upper U-Pb concordia intercept 147
148 Table Sm/Nd corrected results for the Northern Zone of the Congo craton. Sample Sm (ppm) Nd (ppm) 147Sm /144Nd 143Sm /144Nd E(0) T CHUR T DM (Lin) T DM (-) E(t)* DF DF *T equals 625 Ma Table Sm/Nd corrected results for the Central Zone of the Congo craton. Sample Sm (ppm) Nd (ppm) 147Sm /144Nd 143Sm /144Nd E(0) T CHUR T DM (Lin) T DM (-) CZ CZ CZ CZ38b CZ53b CZ *T equals 625 Ma E(t)* Table Sm/Nd corrected results for the Southern Zone of the Congo craton. Sample Sm (ppm) Nd (ppm) 147Sm /144Nd 143Sm /144Nd E(0) T CHUR T DM (Lin) T DM (-) SZ47b SZ SZ SZ SZ SZ65a IE IE1a DF DF DF SZ *T equals 625 Ma E(t)* 148
149 Table Sm/Nd corrected results for the Southern Margin Zone of the Kalahari craton. Sample Sm (ppm) Nd (ppm) 147Sm /144Nd 143Sm /144Nd E(0) T CHUR T DM (Lin) T DM (-) E(t)* DF DF DF DF SZ99b SZ87b *T equals 625 Ma Table Sm/Nd corrected results for the Naukluft Nappes of the Kalahari craton. Sample Sm (ppm) Nd (ppm) 147Sm /144Nd 143Sm /144Nd E(0) T CHUR T DM (Lin) T DM (-) DF DF *T equals 625 Ma E(t)* Table Sm/Nd corrected results for the Southern Foreland Zone of the Kalahari craton. Sample Sm (ppm) Nd (ppm) 147Sm /144Nd 143Sm /144Nd E(0) T CHUR T DM (Lin) T DM (-) E(t)* DF *T equals 625 Ma Table Sm/Nd corrected results for the Kaoko belt of the Congo craton. Sample Sm (ppm) Nd (ppm) 147Sm /144Nd 143Sm /144Nd E(0) T CHUR T DM (Lin) T DM (-) DF *T equals 625 Ma E(t)* Table Pb/Pb analysis data for the Northern Zone of the Congo craton. Corrected isotope ratios and errors Sample 206 Pb/ 204 Pb error 207 Pb/ 204 Pb error 208 Pb/ 204 Pb error DF DF
150 Table Pb/Pb analysis data for the Central Zone of the Congo craton. Corrected isotope ratios and errors Sample 206 Pb/ 204 Pb error 207 Pb/ 204 Pb error 208 Pb/ 204 Pb error CZ CZ CZ CZ38b CZ53b CZ Table Pb/Pb analysis data for the Southern Zone of the Congo craton. Corrected isotope ratios and errors Sample 206 Pb/ 204 Pb error 207 Pb/ 204 Pb error 208 Pb/ 204 Pb error SZ47b SZ SZ SZ SZ SZ65a IE IE1a DF DF DF SZ Table Pb/Pb analysis data for the Southern Margin Zone of the Kalahari craton. Corrected isotope ratios and errors Sample 206 Pb/ 204 Pb error 207 Pb/ 204 Pb error 208 Pb/ 204 Pb error DF DF DF DF SZ99b SZ87b DF
151 Table Pb/Pb analysis data for the Naukluft Nappes of the Kalahari craton. Corrected isotope ratios and errors Sample 206 Pb/ 204 Pb error 207 Pb/ 204 Pb error 208 Pb/ 204 Pb error DF DF Table Pb/Pb analysis data for the Southern Foreland Zone of the Kalahari craton. Corrected isotope ratios and errors Sample 206 Pb/ 204 Pb error 207 Pb/ 204 Pb error 208 Pb/ 204 Pb error DF Table Pb/Pb analysis data for the Kaoko belt of the Congo craton. Corrected isotope ratios and errors Sample 206 Pb/ 204 Pb error 207 Pb/ 204 Pb error 208 Pb/ 204 Pb error DF
152 Table Major oxide element analysis data for the Damara Orogen. NZ Central Zone Southern Zone Sample DF06-21 CZ49 CZ29 CZ40 CZ38b CZ53b CZ35 SZ47b SZ90 SZ80 SZ78 SZ77 wt% Al 2 O CaO Fe 2 O K 2 O MgO MnO Na 2 O P 2 O SiO TiO LOI Total
153 Table Continued. Southern Zone Southern Margin Zone Naukluft Nappes SFZ Kaoko Belt Sample SZ65a IE4 IE1a DF06-22 SZ13 SZ99b SZ87b DF06-48 DF06-49 DF06-08 wt% Al 2 O CaO Fe 2 O K 2 O MgO MnO Na 2 O P 2 O SiO TiO LOI Total
154 Table Trace element analysis data for the Damara Orogen. Northern Zone Central Zone Southern Zone Sample DF06-21 DF09-36 CZ49 CZ29 CZ40 CZ38b CZ53b CZ35 SZ47b SZ90 SZ80 SZ78 mg/kg Rb Ba Th U Nb Ta La Ce Pb Pr Sr Nd Zr Hf Sm Eu Dy Y Ho Yb Lu
155 Table Continued. Southern Zone Southern Margin Zone Sample SZ77 SZ65a IE4 IE1a DF09-14 DF06-22 DF09-02 SZ13 DF09-10 DF09-11 DF09-07 DF09-09 mg/kg Rb Ba Th U Nb Ta La Ce Pb Pr Sr Nd Zr Hf Sm Eu Dy Y Ho Yb Lu
156 Table Continued. Southern Margin Zone Naukluft Nappes SFZ Kaoko Belt Sample SZ99b SZ87b DF09-03 DF06-48 DF09-16 DF06-49 DF06-08 mg/kg Rb Ba Th U Nb Ta La Ce Pb Pr Sr Nd Zr Hf Sm Eu Dy Y Ho Yb Lu
157 Relative probability 0.6 data-point error ellipses are 2s 0.53 data-point error ellipses are Pb/ 238 U Pb/ 238 U Pb/ 235 U A 0.41 Intercepts at 220±200 & 2568±11 [±13] Ma 0.39 MSWD = Pb/ 235 U B N= Age (Ma) C Figure 4-1. Zircon geochronology analysis for sample BDG06-91 from the Mulden Formation in the Northern Foreland Zone. A) U-Pb concordia diagram. Gray ovals indicate discordant grains which were removed. B) U-Pb concordia diagram showing discordia line. C) U-Pb probability density plot of concordant grains. 206 Pb/ 238 U ages used for grains <1 Ga, 207 Pb/ 206 Pb ages used for grains >1 Ga. 157
158 Number Relative probability EHf Value data-point error ellipses are 2s data-point error ellipses are 2s Pb/ 238 U Pb/ 235 U A 206 Pb/ 238 U Intercepts at 165±110 & 1114±24 Ma MSWD = Pb/ 235 U B N=52 C Age (Ma) 6 N= DM D U-Pb Age (Ma) T DM Model Age (Ga) E Figure 4-2. Zircon geochronology analysis for sample DF09-26 from the Kuiseb Schist in the Northern Zone. A) U-Pb concordia diagram. Gray ovals indicate discordant grains which were removed. B) U-Pb concordia diagram showing discordia line. C) U-Pb probability density plot of concordant grains. 206 Pb/ 238 U ages used for grains <1 Ga, 207 Pb/ 206 Pb ages used for grains >1 Ga. D) Epsilon Hf values of concordant grains plotted against U-Pb ages of individual grains. E) Lu-Hf DM model age histogram of concordant grains. 158
159 Number Relative probability EHf 1750 data-point error ellipses are 2s 0.38 data-point error ellipses are 2s Pb/ 238 U Pb/ 238 U Pb/ 235 U N=10 A Intercepts at ±210 & 1994±13 [±14] Ma MSWD = Pb/ 235 U B Age (Ma) 5 4 N=6 C -8.0 D U-Pb Age (Ma) T DM Model Age (Ga) E Figure 4-3. Zircon geochronology analysis for sample DF09-30 from the Kuiseb Schist in the Northern Zone. A) U-Pb concordia diagram. Gray ovals indicate discordant grains which were removed. B) U-Pb concordia diagram showing discordia line. C) U-Pb probability density plot of concordant grains. 206 Pb/ 238 U ages used for grains <1 Ga, 207 Pb/ 206 Pb ages used for grains >1 Ga. D) Epsilon Hf values of concordant grains plotted against U-Pb ages of individual grains. E) Lu-Hf DM model age histogram of concordant grains. 159
160 Number Relative probability EHf Value data-point error ellipses are 2s data-point error ellipses are 2s Pb/ 238 U Pb/ 238 U Pb/ 235 U N=53 Intercepts at & [ 14] Ma MSWD = 1.5 A 0.26 Intercepts at 833±250 & 2078±39 [±40] Ma MSWD = Pb/ 235 U B Age (Ma) 5 N=20 4 C D U-Pb Age (Ma) T DM Model Age (Ga) E Figure 4-4. Zircon geochronology analysis for sample DF09-44 from the Nosib Group in the Central Zone. A) U-Pb concordia diagram with discordia line. B) U-Pb concordia diagram showing discordia line. Gray ovals indicate discordant grains which were removed. C) U-Pb probability density plot of concordant grains. 206 Pb/ 238 U ages used for grains <1 Ga, 207 Pb/ 206 Pb ages used for grains >1 Ga. D) Epsilon Hf values of concordant grains plotted against U-Pb ages of individual grains. E) Lu-Hf DM model age histogram of concordant grains. 160
161 Number Relative probability EHf value 0.45 data-point error ellipses are 2s data-point error ellipses are 2s Pb/ 238 U Pb/ 238 U A Pb/ 235 U Intercepts at ±250 & 1026±26 [±27] Ma MSWD = 3.0 B Pb/ 235 U N=7 C D Age (Ma) U-Pb Age (Ma) N= T DM Model Age (Ga) E Figure 4-5. Zircon geochronology analysis for sample CZ29 from the Khan Formation in the Central Zone. A) U-Pb concordia diagram. Gray ovals indicate discordant grains which were removed. B) U-Pb concordia diagram showing discordia line. C) U-Pb probability density plot of concordant grains. 206 Pb/ 238 U ages used for grains <1 Ga, 207 Pb/ 206 Pb ages used for grains >1 Ga. D) Epsilon Hf values of concordant grains plotted against U-Pb ages of individual grains. E) Lu-Hf DM model age histogram of concordant grains. 161
162 Relative probability data-point error ellipses are 2s 0.8 N= Pb/ 238 U Pb/ 235 U A Age (Ma) B Figure 4-6. Zircon geochronology analysis for sample CZ40 from the Rossing Formation in the Central Zone. A) U-Pb concordia diagram. Gray ovals indicate discordant grains which were removed. B) U-Pb probability density plot of concordant grains. 206 Pb/ 238 U ages used for grains <1 Ga, 207 Pb/ 206 Pb ages used for grains >1 Ga. 162
163 Number Relative probability Ehf Value data-point error ellipses are 2s data-point error ellipses are 2s Pb/ 238 U Pb/ 238 U A Pb/ 235 U Intercepts at ±170 & 1106±93 [±94] Ma MSWD = Pb/ 235 U B N= DM Age (Ma) 9 C D U-Pb Age (Ma) 8 N= TDM Model Age (Ga) Figure 4-7. Zircon geochronology analysis for sample CZ53b from the Tinkas Formation in the Central Zone. A) U-Pb concordia diagram. Gray ovals indicate discordant grains which were removed. B) U-Pb concordia diagram showing discordia line. C) U-Pb probability density plot of concordant grains. 206 Pb/ 238 U ages used for grains <1 Ga, 207 Pb/ 206 Pb ages used for grains >1 Ga. D) Epsilon Hf values of concordant grains plotted against U-Pb ages of individual grains. E) Lu-Hf DM model age histogram of concordant grains. E 163
164 Number Relative probability Epsilon Hf value data-point error ellipses are 2s 0.26 data-point error ellipses are Pb/ 238 U Pb/ 238 U Pb/ 235 U N=77 A Pb/ 235 U B DM Age (Ma) C U-Pb Age (Ma) D 10 N= TDM model age (Ga) E Figure 4-8. Zircon geochronology analysis for sample CZ35 from the Karibib Formation in the Central Zone. A) U-Pb concordia diagram. Gray ovals indicate discordant grains which were removed. B) U-Pb concordia diagram from 1300 to 500 Ma. C) U-Pb probability density plot of concordant grains. 206 Pb/ 238 U ages used for grains <1 Ga, 207 Pb/ 206 Pb ages used for grains >1 Ga. D) Epsilon Hf values of concordant grains plotted against U-Pb ages of individual grains. E) Lu-Hf DM model age histogram of concordant grains. 164
165 Number Relative probability Ehf Value 0.8 data-point error ellipses are 2s 0.40 data-point error ellipses are 2s Pb/ 238 U Pb/ 238 U Pb/ 235 U A ±110 & 1981±26 [±27] Ma MSWD = Pb/ 235 U Intercepts at B N= DM Age (Ma) 6 5 N=15 C D U-Pb Age (Ma) T DM Model Age (Ga) E Figure 4-9. Zircon geochronology analysis for sample DF06-22 (SZ40) from the Kuiseb Schist in the Matchless Amphibolite Belt of the Southern Zone. A) U-Pb concordia diagram. Gray ovals indicate discordant grains which were removed. B) U-Pb concordia diagram showing discordia line. C) U-Pb probability density plot of concordant grains. 206 Pb/ 238 U ages used for grains <1 Ga, 207 Pb/ 206 Pb ages used for grains >1 Ga. D) Epsilon Hf values of concordant grains plotted against U-Pb ages of individual grains. E) Lu-Hf DM model age histogram of concordant grains. 165
166 EHf Number Relative probability data-point error ellipses are 2 data-point error ellipses are Pb/ 238 U Pb/ 238 U Pb/ 235 U 0.20 data-point error ellipses are 2s 1150 A N= Pb/ 235 U B Pb/ 238 U Intercepts at ±40 & 1411±74 Ma MSWD = Pb/ 235 U C DM Age (Ma) N=43 D U-Pb Age (Ma) E Figure Zircon geochronology analysis for sample SZ13 from the Kuiseb Schist in the Southern Zone. A) U-Pb concordia diagram. Gray ovals indicate discordant grains which were removed. B) U-Pb concordia diagram from 1200 to 500 Ma. Gray ovals indicate discordant grains which were removed. C) U- Pb concordia diagram showing discordia line. D) U-Pb probability density plot of concordant grains. 206 Pb/ 238 U ages used for grains <1 Ga, 207 Pb/ 206 Pb ages used for grains >1 Ga. E) Epsilon Hf values of concordant grains plotted against U-Pb ages of individual grains. F) Lu-Hf DM model age histogram of concordant grains. 2 T DM Model Age (Ga) F 166
167 Number Relative probability EHf Value data-point error ellipses are 2 data-point error ellipses are 2s Pb/ 238 U Pb/ 235 U A 206 Pb/ 238 U Intercepts at ±71 & 1901±18 [±19] Ma MSWD = Pb/ 235 U B N= DM Age (Ma) 6 5 N=23 C -4.0 D U-Pb Age (Ma) T DM Model Age (Ga) E Figure Zircon geochronology analysis for sample DF09-12a from the Hakos Formation in the Southern Margin Zone. A) U-Pb concordia diagram. Gray ovals indicate discordant grains which were removed. B) U-Pb concordia diagram showing discordia line. C) U-Pb probability density plot of concordant grains. 206 Pb/ 238 U ages used for grains <1 Ga, 207 Pb/ 206 Pb ages used for grains >1 Ga. D) Epsilon Hf values of concordant grains plotted against U-Pb ages of individual grains. E) Lu-Hf DM model age histogram of concordant grains. 167
168 EHf Value Number Relative probability data-point error ellipses are N= Pb/ 238 U Pb/ 235 U A Age (Ma) B N= U-Pb Age (Ma) C Figure Zircon geochronology analysis for sample DF09-04 from the Naos Diamictite in the Southern Margin Zone. A) U-Pb concordia diagram. Gray ovals indicate discordant grains which were removed. B) U-Pb probability density plot of concordant grains. 206 Pb/ 238 U ages used for grains <1 Ga, 207 Pb/ 206 Pb ages used for grains >1 Ga. C) Epsilon Hf values of concordant grains plotted against U-Pb ages of individual grains. D) Lu-Hf DM model age histogram of concordant grains. 1 T DM Model Age (Ga) D 168
169 EHf Value Number Relative probability 0.65 data-point error ellipses are 2 data-point error ellipses are 2s Pb/ 238 U Pb/ 238 U Pb/ 235 U data-point error ellipses are 2s Intercepts at ±99 & 2166±20 [±22] Ma MSWD = 1.7 A Intercepts at 795±70 [±71] & 1392±65 [±66] Ma N= Pb/ 235 U MSWD = 1.19 B Pb/ 238 U Intercepts at 643±55 & 2695±12 [±15] Ma MSWD = C Pb/ 235 U 10.0 DM Age (Ma) 6 5 N=15 D U-Pb Age (Ma) E Figure Zircon geochronology analysis for sample DF06-40 from the Kuibis Formation in the Southern Foreland Zone. A) U-Pb concordia diagram. Gray ovals indicate discordant grains which were removed. B) U-Pb concordia diagram showing discordia line. C) U-Pb concordia diagram showing discordia lines. D) U-Pb probability density plot of concordant grains. 206 Pb/ 238 U ages used for grains <1 Ga, 207 Pb/ 206 Pb ages used for grains >1 Ga. E) Epsilon Hf values of concordant grains plotted against U-Pb ages of individual grains. F) Lu-Hf DM model age histogram of concordant grains. 1 T DM Model Age (Ga) F 169
170 EHf Value Number Relative probability data-point error ellipses are 2s data-point error ellipses are 2s Pb/ 238 U Pb/ 238 U Pb/ 235 U 0.60 data-point error ellipses are 2s A N=47 Intercepts at 496±39 & 896±99 [±100] Ma Pb/ 235 U MSWD = 1.3 B Pb/ 238 U Intercepts at 1806±240 & 2879±88 [±89] Ma MSWD = C Pb/ 235 U DM Age (Ma) N=18 D U-Pb Age (Ma) E Figure Zircon geochronology analysis for sample DF06-41 from the Schwarzrand Subgroup in the Southern Foreland Zone. A) U-Pb concordia diagram. Gray ovals indicate discordant grains which were removed. B) U-Pb concordia diagram showing discordia line. C) U-Pb concordia diagram showing discordia line. D) U-Pb probability density plot of concordant grains. 206 Pb/ 238 U ages used for grains <1 Ga, 207 Pb/ 206 Pb ages used for grains >1 Ga. E) Epsilon Hf values of concordant grains plotted against U-Pb ages of individual grains. F) Lu-Hf DM model age histogram of concordant grains. 1 T DM Model Age (Ga) F 170
171 Relative probability data-point error ellipses are data-point error ellipses are 2s Pb/ 238 U Pb/ 238 U Pb/ 235 U A Intercepts at ±52 & 1058±11 [±13] Ma MSWD = Pb/ 235 U B N= Age (Ma) C Figure Zircon geochronology analysis for sample DF06-46 from the Schwarzrand Subgroup in the Southern Foreland Zone. A) U-Pb concordia diagram. Gray ovals indicate discordant grains which were removed. B) U-Pb concordia diagram showing discordia line. C) U-Pb probability density plot of concordant grains. 206 Pb/ 238 U ages used for grains <1 Ga, 207 Pb/ 206 Pb ages used for grains >1 Ga. 171
172 EHf Value Number Relative probability 0.5 data-point error ellipses are 2s 0.20 data-point error ellipses are 2s Pb/ 238 U Pb/ 238 U Pb/ 235 U A Pb/ 235 U B 0.22 data-point error ellipses are 2s N= Pb/ 238 U Intercepts at 120±49 & 1058±14 [±15] Ma 500 MSWD = Pb/ 235 U C Age (Ma) N=17 D U-Pb Age (Ma) E Figure Zircon geochronology analysis for sample DF06-45 from the Fish River Formation in the Southern Foreland Zone. A) U-Pb concordia diagram. Gray ovals indicate discordant grains which were removed. B) U-Pb concordia diagram from 1200 to 400 Ma. Gray ovals indicate discordant grains which were removed. C) U-Pb concordia diagram showing discordia line. D) U-Pb probability density plot of concordant grains. 206 Pb/ 238 U ages used for grains <1 Ga, 207 Pb/ 206 Pb ages used for grains >1 Ga. E) Epsilon Hf values of concordant grains plotted against U-Pb ages of individual grains. F) Lu-Hf DM model age histogram of concordant grains. 2 T DM Model Age (Ga) F 172
173 EHf Value Number Relative probability data-point error ellipses are data-point error ellipses are Pb/ 238 U Pb/ 238 U Pb/ 235 U 0.21 data-point error ellipses are 2s A N= Pb/ 235 U B Pb/ 238 U Intercepts at 444±20 & 1095±10 [±13] Ma 0.09 MSWD = C Pb/ 235 U DM Age (Ma) 5 N=15 4 D U-Pb Age (Ma) E Figure Zircon geochronology analysis for sample DF06-44 from the Fish River Formation in the Southern Foreland Zone. A) U-Pb concordia diagram. Gray ovals indicate discordant grains which were removed. B) U-Pb concordia diagram from 1200 to 300 Ma. Gray ovals indicate discordant grains which were removed. C) U-Pb concordia diagram showing discordia line. D) U-Pb probability density plot of concordant grains. 206 Pb/ 238 U ages used for grains <1 Ga, 207 Pb/ 206 Pb ages used for grains >1 Ga. E) Epsilon Hf values of concordant grains plotted against U-Pb ages of individual grains. F) Lu-Hf DM model age histogram of concordant grains. 1 T DM Model Age (Ga) F 173
174 EHf Value Number Relative probability data-point error ellipses are data-point error ellipses are Pb/ 238 U Pb/ 238 U Pb/ 235 U 0.21 data-point error ellipses are 2s A N= Pb/ 235 U B Pb/ 238 U Intercepts at 302±49 & 1087±14 [±15] Ma 0.09 MSWD = Pb/ 235 U DM C Age (Ma) 6 5 N=21 D U-Pb Age (Ma) E Figure Zircon geochronology analysis for sample DF06-43 from the Fish River Formation in the Southern Foreland Zone. A) U-Pb concordia diagram. Gray ovals indicate discordant grains which were removed. B) U-Pb concordia diagram from 1200 to 300 Ma. Gray ovals indicate discordant grains which were removed. C) U-Pb concordia diagram showing discordia line. D) U-Pb probability density plot of concordant grains. 206 Pb/ 238 U ages used for grains <1 Ga, 207 Pb/ 206 Pb ages used for grains >1 Ga. E) Epsilon Hf values of concordant grains plotted against U-Pb ages of individual grains. F) Lu-Hf DM model age histogram of concordant grains. 1 T DM Model Age (Ga) F 174
175 Age 0.20 data-point error ellipses are 2s data-point error ellipses 580 are Pb/ 238 U Pb/ 238 U Pb/ 235 U A Pb/ 235 U B data-point error ellipses are 2s 560 box heights are 2s Mean = [1.3%] 95% conf. Wtd by data-pt errs only, 0 of 6 rej. MSWD = 0.82, probability = 0.53 (error bars are 2s) 206 Pb/ 238 U Intercepts at 41±99 & 604±22 Ma MSWD = 1.6 C Pb/ 235 U D Figure Zircon geochronology analysis for sample DF09-37 from a granitic pluton in the Northern Zone. A) U-Pb concordia diagram. Gray ovals indicate discordant grains which were removed. B) U-Pb concordia diagram from 1200 to 300 Ma. Green ovals represent grains displaying crystallization ages. Blue ovals represent grains displaying lead loss. Gray ovals indicate discordant grains which were removed. C) U-Pb concordia diagram showing discordia line. D) Mean age of crystallization diagram. 175
176 Number Age EHf Value 0.24 data-point error ellipses are data-point error ellipses are 2s Pb/ 238 U Pb/ 238 U A Intercepts at ±140 & 1036±11 [±13] Ma MSWD = 2.8 B Pb/ 235 U 207 Pb/ 235 U box heights are 2s 1070 Mean = ±2.2 [0.21%] 95% conf. Wtd by data-pt errs only, 0 of 38 rej. MSWD = 1.19, probability = 0.20 (error bars are 2s) C D U-Pb Age (Ma) N= T DM Model Age (Ga) E Figure Zircon geochronology analysis for sample DF09-43 from the grainitic gneissic basement of the Central Zone. A) U-Pb concordia diagram. Gray ovals indicate discordant grains which were removed. B) U-Pb concordia diagram from 1100 to 750 Ma with discordia. Gray ovals indicate discordant grains which were removed. C) Mean age of crystallization diagram. D) Epsilon Hf values of concordant grains plotted against U-Pb ages of individual grains. D) Lu-Hf DM model age histogram of concordant grains. 176
177 Number Relative probability EHf Value data-point error ellipses are 2s data-point error ellipses are 2s Intercepts at -403±680 & 1858±18 [±19] Ma MSWD = Pb/ 238 U Pb/ 235 U A 206 Pb/ 238 U Intercepts at ±290 & ±8.5 [±10] Ma 0.30 MSWD = B Pb/ 235 U N= Age (Ma) C U-Pb Age (Ma) D 4 N= T DM Model Age (Ga) E Figure Zircon geochronology analysis for sample DF06-18 from the Hoanib River Group in the Kaoko Belt. A) U-Pb concordia diagram. Gray ovals indicate discordant grains which were removed. B) U-Pb concordia diagram showing discordia lines. C) U-Pb probability density plot of concordant grains. 206 Pb/ 238 U ages used for grains <1 Ga, 207 Pb/ 206 Pb ages used for grains >1 Ga. D) Epsilon Hf values of concordant grains plotted against U-Pb ages of individual grains. E) Lu-Hf DM model age histogram of concordant grains. 177
178 Number Relative probability EHf Value 0.40 data-point error ellipses are data-point error ellipses are 2s Pb/ 238 U Pb/ 238 U Pb/ 235 U A 0.26 Intercepts at 518±89 & ±5.4 [±9.1] Ma MSWD = 1.9 B Pb/ 235 U 0.0 N= Age (Ma) 7 C U-Pb Age (Ma) D 6 N= T DM Model Age (Ga) E Figure Zircon geochronology analysis for sample DF09-38 from the Ogden Mylonite in the Kaoko Belt. A) U-Pb concordia diagram showing discordia line. Gray ovals indicate discordant grains which were removed. B) U-Pb concordia diagram showing discordia line. C) U-Pb probability density plot of concordant grains. 206 Pb/ 238 U ages used for grains <1 Ga, 207 Pb/ 206 Pb ages used for grains >1 Ga. D) Epsilon Hf values of concordant grains plotted against U-Pb ages of individual grains. E) Lu-Hf DM model age histogram of concordant grains. 178
179 Number Relative probability EHf Value 0.6 data-point error ellipses are data-point error ellipses are 2s Pb/ 238 U Pb/ 238 U Pb/ 235 U A Intercepts at ±98 & ±7.7 [±11] Ma MSWD = Pb/ 235 U B N= Age (Ma) 4 C -2.0 D U-Pb Age (Ma) N= T DM Model Age (Ga) E Figure Zircon geochronology analysis for sample DF09-39 from the Ogden Mylonite in the Kaoko Belt. A) U-Pb concordia diagram. Gray ovals indicate discordant grains which were removed. B) U-Pb concordia diagram showing discordia line. C) U-Pb probability density plot of concordant grains. 206 Pb/ 238 U ages used for grains <1 Ga, 207 Pb/ 206 Pb ages used for grains >1 Ga. D) Epsilon Hf values of concordant grains plotted against U-Pb ages of individual grains. E) Lu-Hf DM model age histogram of concordant grains. 179
180 Number Relative probability EHf Value 0.18 data-point error ellipses are 2 data-point error ellipses are 2s Pb/ 238 U Pb/ 238 U A Pb/ 235 U N= Intercepts at -544±180 & 816.9±8.1 [±8.7] Ma MSWD = Pb/ 235 U B Age (Ma) C 2.0 D U-Pb Age (Ma) 9 8 N= T DM Model Age (Ga) E Figure Zircon geochronology analysis for sample DF06-11 from the Coastal Terrane in the Kaoko Belt. A) U-Pb concordia diagram. Gray ovals indicate discordant grains which were removed. B) U-Pb concordia diagram showing discordia line. C) U-Pb probability density plot of concordant grains. 206 Pb/ 238 U ages used for grains <1 Ga, 207 Pb/ 206 Pb ages used for grains >1 Ga. D) Epsilon Hf values of concordant grains plotted against U-Pb ages of individual grains. E) Lu-Hf DM model age histogram of concordant grains. 180
181 EHf Value Number Relative probability 0.4 data-point error ellipses are 2s data-point error ellipses are 2s Pb/ 238 U Pb/ 238 U Pb/ 238 U Pb/ 235 U data-point error ellipses are 2s Intercepts at 344±150 & 1044±17 [±19] Ma MSWD = ±230 & 1043±20 Ma MSWD = ±330 & 988±19 Ma MSWD = ±130 & 1017±13 [±14] Ma MSWD = A Pb/ 235 U N=74 Intercepts at & [ 34] Ma MSWD = 22 B Pb/ 235 U DM C Age (Ma) N=27 D U-Pb Age (Ma) E Figure Zircon geochronology analysis for sample DF06-08 from the Khumib Terrane in the Kaoko Belt. A) U-Pb concordia diagram. Gray ovals indicate discordant grains which were removed. B) U-Pb concordia diagram from 1200 to 500 Ma. Gray ovals indicate discordant grains which were removed. C) U- Pb concordia diagram showing discordia lines. D) U-Pb probability density plot of concordant grains. 206 Pb/ 238 U ages used for grains <1 Ga, 207 Pb/ 206 Pb ages used for grains >1 Ga. E) Epsilon Hf values of concordant grains plotted against U-Pb ages of individual grains. F) Lu-Hf DM model age histogram of concordant grains. 2 1 T DM Model Age (Ga) F 181
182 EHf Value Number Relative probability 0.45 data-point error ellipses are data-point error ellipses are 2s Pb/ 238 U Pb/ 238 U A Pb/ 235 U 0.40 data-point error ellipses are 2s Intercepts at 1184±78 [±79] & 1937±49 [±51] Ma 0.23 MSWD = N= Pb/ 235 U B 206 Pb/ 238 U Intercepts at ±83 & 2085±53 [±54] Ma MSWD = Pb/ 235 U C Age (Ma) 5 4 N=12 D U-Pb Age E Figure Zircon geochronology analysis for sample DF06-17 from the Hoanib River Formation in the Kaoko Belt. A) U-Pb concordia diagram showing discordia line. B) U-Pb concordia diagram showing discordia line. C) U-Pb concordia diagram showing discordia line. D) U-Pb probability density plot of concordant grains. 206 Pb/ 238 U ages used for grains <1 Ga, 207 Pb/ 206 Pb ages used for grains >1 Ga. E) Epsilon Hf values of concordant grains plotted against U-Pb ages of individual grains. F) Lu-Hf DM model age histogram of concordant grains. 1 T DM Model Age (Ga) F 182
183 Sm-NdDM εhf DM Congo Kalahari Nama Group U-Pb age (Ma) Figure Comprehensive plot of all epsilon Hf data for the Congo and Kalahari cratonic margins. Nama Group metasediments are plotted separately because they may incorporate Congo source terrains. Kaoko Belt samples are included in Congo data Kalahari Congo Distance from SZ-SMZ (km) Figure Comprehensive plot of all Sm-Nd Dm model ages against relative distance to the SZ-SMZ boundary, the suture between the Congo and Kalahari cratons. 183
184 Epsilon Nd value Congo Kalahari Kaoko Time of Deposition (Ma) Figure Comprehensive plot of all epsilon Nd data for the Congo and Kalahari cratonic margins data-point error ellipses are 2s data-point error ellipses are 2s Pb/ 204 Pb Pb/ 204 Pb Age = /-890 Ma Age = /-1400 Ma Pb/ 204 Pb A Pb/ 204 Pb B Figure Pb/Pb plot. A) Kalahari cratonic margin Pb/Pb data. B) Congo cratonic margin Pb/Pb data. 184
185 Sample/chondrite Sample/chondritic value Sample/chondrite Other Oxides (wt %) A SiO2 (wt %) SiO2 (wt %) B Al2O3 CaO Fe2O3 K2O MgO MnO Na2O P2O5 TiO2 Figure A) Bivariate oxide plot of major element oxide percentages from the Kalahari cratonic margin. B) Bivariate oxide plot of major element oxide percentages from the Congo cratonic margin SZ65a SZ77 SZ78 SZ90 IE1a SZ80 SZ87b SZ99b SZ47b IE4 CZ38b DF06-22 DF06_48 1 La Ce Pr Nd Sm Eu Gd Tb Dy Ho Er Tm Yb Lu A 1 La Ce Pr Nd Sm Eu Gd Tb Dy Ho Er Tm Yb Lu B CZ29 CZ35 CZ40 CZ49 CZ53b DF06_08 DF06_21 DF06-49 SZ13 1 La Ce Pr Nd Sm Eu Gd Tb Dy Ho Er Tm Yb Lu C Figure A) Rare earth element (REE) diagram of all pelitic samples from the Congo and Kalahari cratonic margins, inclusive of the Kaoko Belt. B) REE diagram of all semi-pelitic samples from the Congo and Kalahari cratonic margins, inclusive of the Kaoko Belt. C) REE diagram of all psammitic samples from the Congo and Kalahari cratonic margins, inclusive of the Kaoko Belt. 185
186 CHAPTER 5 DISCUSSION Detrital Zircon Analyses Stratigraphic Comparison Formations deposited between ca. 700 and 600 Ma on the Congo cratonic margin (the Karibib Formation, Gauss Formation, Tinkas Formation and Kuiseb Schist) show similar detrital zircon age populations. The four samples collected in the Central Zone (CZ) from strata in the Rossing Formation, Khan Formation and Etusis Formation, which were all deposited prior to ca. 700 Ma, as well as the local granitic gneiss basement, display major populations of zircons at Ma (Figure 5-1). Samples from strata deposited at 740, 750 and 770 Ma, in the Rossing, Khan and Etusis Formations in the Central Zone, as well as a sample from the Kuiseb Schist in the Matchless Amphibolite Belt deposited at 635 Ma in the Southern Zone and samples from the Mulden and Kuiseb Fms. in the Northern Zone, display another major zircon age population at Ma. All samples deposited after ca. 700 Ma along the Congo cratonic margin also contain zircons with ages of ca Ma, regardless of zone (Figure 5-2; Figure 5-3). This is consistent with widespread dispersal of detritus across the Congo margin platform and shelf after ca. 700 Ma. The sedimentary rocks deposited between 700 and 580 Ma along the margin of the Kalahari Craton lack the Ma zircon population, suggesting different sedimentary source terranes at ca. 600 Ma. The Southern Margin Zone (SMZ) samples that were deposited prior to 600 Ma (Naos Diamictite and Kudis Formation) do not contain the ca Ma population seen in the younger stratigraphy (Figure 5-4). The younger Nama Group strata in the Southern Foreland Zone (SFZ) samples, however, exhibit a population of zircons at Ma (Figure 5-186
187 5), although it is not as prominent as those of the Congo margin samples. These zircons may have been derived from the Congo margin sediments that were uplifted within the Damara Orogen and deposited in the Nama foreland basins. The Hf-isotope data from zircons from the Northern Zone (NZ; Figure 5-6), Central Zone (CZ; Figure 5-7) and Southern Zone (SZ; Figure 5-8) are very similar. These zircons typically give εhf values between -5 and +10, although zircons from the SZ samples also give values as low as -10. Formations deposited prior to ca. 700 Ma in the CZ of the Damara belt (the Rossing Formation, Khan Formation, Etusis Formation, and gneissic basement) have similar, highly negative εhf values ranging from -23 to -13 for grains with U-Pb ages of ca Ma and display Lu-Hf DM model ages between 2600 and 2000 Ma (Figure 5-13c). The gneissic basement has a major component of grains with Lu-Hf DM model ages of ca Ma, the sample from the Etusis Formation has a model age population at ca Ma, and the sample from the upper-most member of the Nosib Group has major model age populations at ca. 2500, 2200 and Ma for grains with U-Pb ages of ca Ma. This is in contrast to the low negative to high positive εhf values, ranging primarily from -10 to +11, and mid-mesoproterozoic to Neoproterozoic Lu-Hf DM model ages displayed by formations deposited after 700 Ma across the Congo cratonic margin in the Karibib Formation, Gauss Formation, Tinkas Formation and Kuiseb Schist (Figure 5-6 through Figure 5-8). This indicates that zircons of similar age derived from sources with a more evolved Hf-isotope composition were deposited into the formations deposited prior to ca. 700 Ma than those deposited after ca. 700 Ma. Four of the five samples deposited after ca. 700 Ma in the NZ, CZ and SZ display similar major Lu-Hf DM model age 187
188 populations at ca Ma (Figure 5-13c), indicating derivation from mainly Mesoand Neo-Proterozoic provinces. Sample DF06-22 from the Kuiseb Schist in the Matchless Amphibolite Belt displays major Lu-Hf DM model age populations at ca. 2300, and 650 Ma and minor populations at ca. 3100, and 2000 Ma, which indicate addition from source terranes of Paleoproterozoic and Archean age. The zircon Hf-isotope data from samples of similar stratigraphic age from the SMZ vary significantly from those of the Congo margin strata (NZ, CZ, and SZ). The stratigraphically older sample, DF09-12a, displays εhf values of -5 to +6 for grains giving U-Pb ages primarily between 1500 and 1000 Ma, whereas the stratigraphically younger sample, DF09-04, gives εhf values mainly between -2 and +3 for grains with U- Pb ages of Ma (Figure 5-9). Both SMZ samples display populations of Lu- Hf DM model ages at ca Ma and at ca Ma, that are distinct from those of the Congo margin strata for similar aged grains. The εhf values of the SFZ samples are similar to those found in the younger strata of the Congo marginal samples (Figure 5-10a), whereas the Lu-Hf DM model ages for grains collected in all formations in the SFZ are dissimilar to each other and to other zones (Figure 5-10b; Figure 5-14). The εhf values of SFZ samples typically range from -10 to +4 for grains with U-Pb ages of ca Ma and primarily from -8 to +10 for grains with U-Pb ages of ca Ma, excepting two grains with εhf values of -14 and -23 and U-Pb ages of 900 and 954 Ma, respectively. The remainder of the grains display U-Pb ages between ca and 1875 Ma and εhf values of -9 to +6. The upper-most Fish River Group sample, DF06-43, has major Lu-Hf DM model age populations at ca. 1500, and 1100 Ma from grains with U-Pb ages between 1150 and 800 Ma (Figure 5-14c). The underlying 188
189 Fish River Group sample, DF06-44, has major Lu-Hf DM model age populations at ca and Ma for U-Pb ages between ca and 400 Ma. The dissimilarity between both εhf values and Lu-Hf DM model ages of samples collected in the SFZ and those displayed by zircons of the Congo marginal strata and the difference of Hf data from zircons collected in the SMZ likely indicates a difference in source material. Nama Group The Neoproterozoic Nama Group overlies the Kalahari basin. Paleocurrent analyses suggest that the basal member of the Nama Group (Kuibis Formation) was derived from Kalahari basement and the overlying Schwarzrand Group was derived from the Damara Belt (Blanco et al., 2009). The detrital zircons in the sample from the Kuibis Formation, DF06-40, are all Late Archean to Mesoproterozoic in age and do not display the Neoproterozoic signature found in younger strata, consistent with a basement source (Figure 5-5). The two Schwarzrand Group samples display similar Paleo- to Mesoproterozoic age signatures, but the younger sequence also contains a Neoproterozoic population. The lower Schwarzrand Group sample, DF06-41, was deposited at ca. 580 Ma and has no Neoproterozoic signature. In contrast, the upper Schwarzrand Group sample, DF06-46, was deposited at ca. 560 Ma and displays a major population at ca Ma and a minor population at ca. 600 Ma. The shift in populations between the 580 Ma strata and the 560 Ma strata are consistent with the addition of recycled zircons from the sedimentary rocks eroded from the orogenic belts. Paleocurrent data suggest that the lower members of the overlying Fish River Group are derived from the Gariep Belt, which lies to the west of the Kalahari craton, while the 189
190 upper members are derived from the Matchless Amphibolite Belt and the Kuiseb Schist (Blanco et al., 2009). The sample from the lower Fish River Formation, DF06-45, demonstrates only one major age population at ca Ma, which is consistent with the timing of formation of the Gariep Belt. The samples from the upper Fish River Formation, DF06-44 and DF06-43, display very similar Neoproterozoic age populations to those from the sample collected in the Kuiseb Schist, DF The shifts in age populations with changing depositional periods reflect changes in source terranes and tectonic events reflected by new populations on the cratonic margins. The major shift in age populations between the ca. 600 Ma strata and the ca. 545 Ma strata most probably reflects the growth of the Damara orogen during the amalgamation of the Congo and Kalahari cratons. The εhf values of the Nama Group samples are all relatively similar, Lu-Hf DM model ages, however, vary significantly for the various age populations due to their changing source terrains (Figure 5-10b). εhf values range from -15 to +10 for grains with U-Pb ages between ca and 550 Ma and range from -10 to +3 for grains with U-Pb ages of ca Ma (Figure 5-10a; εhf values described in more detail above). The sample collected in the basal Kuibis Formation, DF06-40, gives model ages greater than ca Ma for zircons displaying U-Pb ages ranging from ca to 1080 Ma, consistent with a Kalahari basement source. The sample collected in the overlying Schwarzrand Formation, DF06-41, was derived from the Damara Belt and displays major Lu-Hf DM model age populations at ca , and Ma as well as minor populations at ca. 3700, 2950, 2800, 2650, 2500, 2300 and 2000 Ma with U-Pb ages ranging from ca to 800 Ma (Figure 5-14c). The addition 190
191 of Meso- and Neoproterozoic model ages to the Paleoproterozoic and Archean ages of the basement terrain indicates a younger source, consistent with the collisional Damara Belt. The sample collected in the basal portion of the Fish River Formation, DF06-45, displays a major Lu-Hf DM model age population at ca Ma, similar to that of the Schwarzrand Formation sample, and has U-Pb ages primarily between ca. 650 and 530 Ma. This similarity indicates comparable Hf ratios being incorporated into the Mesoproterozoic source terrains for both formations, consistent with the collisional Gariep Belt contributing to the Fish River Formation sediments. As described above, the two samples collected from the upper Fish River Formation, DF06-44 and DF06-43, display model age populations similar to each other and to the sample collected in the Kuiseb Schist of the CZ. DF06-44 has major Lu-Hf DM model age populations at ca and Ma and a minor population at ca Ma for grains with U- Pb ages primarily between ca and 520 Ma. DF06-43 has major Lu-Hf DM model age populations at ca. 1500, and 1100 Ma and minor populations at ca and Ma for grains with U-Pb ages primarily between ca and 550 Ma. These data are consistent with a Matchless Amphibolite Belt source for the uppermost Fish River Formation samples. The differences in all Lu-Hf DM model age populations throughout the depositional history of both cratons and the slight variation in εhf values for grains with different U-Pb ages are consistent with discrete source terrains for the Congo and Kalahari sedimentary rocks prior to ca. 545 Ma. Granitic Rocks A Cambrian granitic pluton (sample DF09-37) contains one population of magmatic grains, which display a weighted mean age of crystallization using 206 Pb/ 238 U 191
192 of ± 6.6 Ma with 95% confidence, and another population of inherited grains (Figure 4-19d). The inherited grains underwent partial lead loss during magma genesis and show a lower concordia intercept of 41 ± 99 and an upper intercept of 604 ± 22 Ma (Figure 4-19b-c). Cambrian magmatic zircons are probably typical of the age populations of grains that were eroded from Pan-African plutons within the Damara Orogen. This reflects the zircon populations that would be expected to be present in foreland basins. For instance, Cambrian granitic plutons like this one may represent sources for Damara aged grains in the younger Nama Group. The granitic basement of the CZ, however, as described above, reflects one of the basement inliers of the region and their probable contributions. Comparison by Structural Zone U-Pb age populations of detrital zircons from samples collected in the NZ, CZ and SZ are all similar (Figure 5-11). The samples collected in the SZ and NZ display prominent populations at ca Ma and samples from the NZ, CZ, and SZ all have major populations at ca Ma and at Ma. This is consistent with similar sedimentary sources and dispersal systems along the same margin. The age populations of samples collected in the SMZ and SFZ are dissimilar to those collected from the NZ, CZ, and SZ and to each other (Figure 5-12). The SMZ samples display populations at ca. 1900, 1350, , and 1050 Ma. The youngest population is similar to a population displayed by the samples from the SZ, CZ, and NZ, the other populations, however, are not observed in any other strata in the orogen. The samples collected in the SFZ display age populations at ca , 925, 850 and 192
193 Ma. The Ma population is roughly similar to those from the SMZ, SZ, CZ and NZ. The lack of an Ma population in the SMZ is distinct. The disparity between the SMZ sediments and those of the SZ, CZ and NZ, which were part of the Congo margin, imply that the amalgamation of the Congo and Kalahari cratons occurred after the deposition of the SMZ sediments at approximately 590 Ma. The SFZ sediments, however, are of the Nama Group and were deposited at ca Ma (Blanco et al., 2009). The younger sediments found there may record recycling of zircon grains through the Damara Belt. Zircon Hf-isotopic data is similar for all NZ, CZ and SZ samples. The NZ, CZ, and SZ display εhf values primarily between -10 and +14 for all U-Pb ages (Figure 5-13a). Samples with U-Pb ages of ca Ma typically display εhf values of -10 to +10, with a much higher proportion of positive values than negative, except one grain from the CZ with a U-Pb age of 514 Ma and an εhf value of -26. Grains with U-Pb ages of ca Ma display εhf values primarily between 0 and +10, except one grain from the Kaoko Belt with an εhf value of -26 and a U-Pb age of 811 Ma. εhf values for grains displaying U-Pb ages of Ma range from -23 to -10 and from -5 to +12. A majority of the highly negative values are displayed by grains collected in the CZ and the Kaoko Belt, implying that the source of the Mesoproterozoic zircons in the CZ and Kaoko strata includes a higher proportion of ancient, recycled, continental crust. Samples with U-Pb ages of ca , , 2600 and 2980 Ma typically display εhf values of -8 to +10. Outliers include several grains with U-Pb ages of 1411 and εhf values of +10 to +16, a grain with an εhf value of +23 and a U-Pb age of 1411 Ma, one grain with an εhf value of -13 and a U-Pb age of 1340 Ma and another grain 193
194 with an εhf value of +27 and a U-Pb age of 2024 Ma. Other than in the Mesoproterozoic grains, each of the zones appears to have experienced similar degrees of mixing of broadly similar crustal sources in the sedimentary environment. Lu-Hf DM model ages in the NZ, CZ, and SZ detrital zircons are dominated by ca Ma populations, though the population displayed in the NZ samples is less pervasive than those in the CZ and SZ samples (Figure 5-13b-c). εhf values and Lu-Hf DM model ages for the SMZ and SFZ, however, are not similar to each other or to those of the Congo cratonic margin (Figure 5-14a). The εhf values of SFZ samples range between -10 and +5 for grains with U-Pb ages of ca Ma and with values ranging from -23 to +10 for grains with U-Pb ages of Ma. Three grains with U-Pb ages of ca Ma display εhf values of -2.4 to +3 and two grains at ca have εhf values between +7 and +10. Grains with U-Pb ages between ca and 1900 Ma display εhf values of -7 to +2, and three grains with U-Pb ages of ca. 2700, 2845 and 3335 Ma display εhf values of +2, +3 and -5, respectively. The metasediments of the Congo margin display a higher proportion of more positive εhf values for grains with U-Pb ages between 1150 and 1000 Ma. This implies different, more primitive material was being incorporated into the Congo margin than into the Kalahari margin at that time. The SFZ zircons are dominated by grains with model ages of ca Ma, which overlaps the age populations seen in the Congo craton. The SMZ samples display εhf values between -6 and +6 for grains with U-Pb ages from 1575 to 1000 Ma and εhf values of -3, -2 and +2.5 for the three grains with U-Pb ages of ca to 1900 Ma. The SMZ has a major Lu-Hf DM model age population at ca Ma, slightly overlapping the SFZ population, but dissimilar to all of the Congo marginal strata populations (Figure 5-14b- 194
195 c). The disparities in Hf-isotope data between the zones of the Congo and Kalahari cratonic margins imply differing sedimentary histories. The sources incorporated into the two cratonic margins contain different Hf signatures, implying that the Congo and Kalahari margins were not connected prior to ca Ma. Kaoko Belt Zircons from samples collected in the Kaoko Belt, which is the northern branch of the Damara Orogen along the present western edge of the Congo craton, tend to display U-Pb age populations and isotopic values similar to those of the CZ of the Congo cratonic margin. A probability density plot of detrital zircon U-Pb age populations of samples collected in the Kaoko Belt (Figure 5-15) shows that samples collected in the Coastal Terrane and the Khumib Fm display a major population at ca Ma. Samples collected in the lower Ogden Mylonite sequence and in the Hoanib Fm. display a major population at Ma. The upper Ogden Mylonite samples display only one major population at Ma. The Paleoproterozoic population is consistent with the plutonic and metamorphic rocks of the Kamanjab Inlier, and is unique to the Kaoko Belt. The Meso- and Neoproterozoic age populations are consistent with those of the other Congo marginal strata. Hf-isotopic data for the Kaoko detrital zircons are indistinguishable from those of samples collected along the Congo cratonic margin. The εhf values of the Kaoko Belt samples mainly range from 0 to +10 at ca Ma, from -18 to +6 at ca Ma, and -10 to 0 at ca Ma (Figure 5-16a). Outlying grains display εhf values of -10, -26, +12 and +2 with U-Pb ages of ca. 600, 810, 1090 and 1875 Ma, respectively. These are consistent with εhf values of the Congo marginal strata. Sample DF06-11 from the Coastal Terrane Group is the 195
196 exception; it displays εhf values of +1 to +10 and is consistent with an arc source. The belt displays major Lu-Hf DM model age populations at ca. 950 and Ma and minor populations at ca and Ma (Figure 5-16b). The similarity of the εhf values and Lu-Hf DM model ages displayed in the Congo margin strata and the Kaoko Belt implies common source terrains for the two regions. The U-Pb age populations and associated Hf-isotope data of Kaoko Belt detrital zircons are dissimilar to those of the Kalahari marginal strata (SMZ and SFZ). Comparison by Craton A comprehensive probability density plot of all Congo and Kalahari cratonic margin samples (Figure 5-17) reveals disparate age populations present on the margins of the cratons. Detrital zircons from both cratons display U-Pb age populations at ca Ma, though the population displayed in the samples collected in the Congo marginal strata is proportionally larger, and minor populations at ca Ma. The Congo marginal strata, however, have a major age population at ca Ma, which the Kalahari marginal strata lack. The samples collected in the Nama Group of the Kalahari margin display a minor U-Pb age population at ca Ma and a major population at ca. 540 Ma. The Congo strata, however, give only a minor population at ca. 500 Ma, which are likely metamorphic zircons from the Damara Orogen. The Kalahari marginal strata display major populations at and 1900 Ma, whereas the Congo has only minor populations at these ages. The Nama Group samples, however, display a major population at 1300 Ma, probably indicating a common source. Overall U-Pb age populations prior to ca. 800 Ma have similarities in the Congo and 196
197 Kalahari margins with differing proportions of similar age populations. More recent populations, however, display minor similarities but are characteristically quite distinct. A composite εhf plot of all samples displays differences in zircon age populations for the Congo and Kalahari margin strata (Figure 4-27). Mid-Paleoproterozoic to Archean aged zircons display similar, predominantly negative εhf values on both cratonic margins. The Congo marginal strata display major Lu-Hf DM model age populations at and Ma and minor populations at ca and Ma (Figure 5-18). The Mesoproterozoic to early Neoproterozoic aged zircons display widespread εhf values ranging from -23 to +14. Samples collected on the margin of the Kalahari craton have major Lu-Hf DM age populations at ca Ma and minor populations at ca Ma (Figure 5-18). The major Kalahari populations do not overlap those of the Congo margin strata. Mesoproterozoic to early Neoproterozoic aged zircons collected on the Kalahari margin display clustered, predominantly positive εhf values ranging primarily between -10 and +10. Mid- to late Neoproterozoic aged zircons with major Lu-Hf DM model age populations at ca Ma and minor populations at ca. 650 and 450 Ma collected on the Congo cratonic margin display predominantly positive εhf values with most samples displaying values between 0 and +10. Mid- to late Neoproterozoic zircons collected in the Kalahari marginal strata, however, are less abundant than those collected on the Congo margin and display predominantly negative εhf values ranging from -10 to Despite minor similarities, the Congo and Kalahari craton margin strata display dissimilar Hf-isotope data for zircons within each age population younger than ca Ma. The 197
198 discrepancies in the zircon U-Pb and Hf populations argue that the Congo and Kalahari cratons were separated during deposition of the Ma sedimentary sequences. Source Terrains Congo Craton The detrital zircon age populations displayed by samples collected in Congo marginal strata (NFZ, NZ, CZ, SZ, KZ) are consistent with source terrains found within the Congo craton (Figure 5-19). Erosion of the Archean and Proterozoic basement and magmatic terrains followed by sedimentary transport and deposition of the grains into sedimentary rocks would account for all of the zircon age populations seen in the marginal strata (a summary of Congo Precambrian provinces is given in the Appendix). The major U-Pb age population at ca Ma in the Karibib Fm. and Mulden Fm. in the NZ, in the Khan Fm., Etusis Fm. and granitic basement in the CZ, and in the Kuiseb Schist in the SZ is consistent with contributions from intracratonic basement inliers and possibly input from granitic plutons of the Irumide Belt. The Neoproterozoic zircons (ca Ma) in the Kuiseb and Karibib Fms. of the NZ and Mulden Fm. in the NFZ, in the Gauss and Tinkas Fms. in the CZ and in the Kuiseb Schist in the SZ are probably derived from widespread volcanic provinces along the southern margin of the Congo craton including those in the Lufilian arc and locally the Naauwpoort rhyolite. The Congo margin detrital zircons in the Kuiseb Fm. of the NZ, the Khan and Etusis Fms. of the CZ and the Kuiseb Schist of the SZ display U-Pb age populations at 2050 Ma and the Mulden Fm. of the NFZ and the Kuiseb Schist of the SZ display minor U-Pb age populations at ca Ma and 2500 Ma, respectively, all of which are consistent with sources from the Angola basement. The Matchless Amphibolite Belt in 198
199 the Kuiseb Schist also displays a minor population at ca Ma, which could have been derived from sources within the Ubendian belt, and one at ca Ma, consistent with xenocrystic cores seen in the Angola-Kasai craton. Detrital zircons from the Matchless Amphibolite Belt in the Kuiseb Schist of the SZ, the Rossing Fm. in the CZ and the Mulden Fm. of the NFZ display a U-Pb age population at ca Ma, potentially representing contributions from one or a combination of: granitoids from the Angola basement, the Kibaran basement, and granites and gneisses from the Irumide belt. Samples collected in the Karibib Fm., Kuiseb Fm., the Mulden Fm., the Rossing Fm. and the Kuiseb Schist display minor age populations at ca Ma, the Matchless Amphibolite Belt in the Kuiseb Schist displays one at ca Ma and the Kuiseb Schist displays a population at ca ; these populations are consistent with sediments derived from the Epupa basement and metamorphic complex. The sample from the Kuiseb Fm. displays a minor age population at ca Ma, revealing possible contributions from one or more terrains including the Kuene intrusive complex (anorthosite), the Orue metamorphic terrane and/or the Kibara magmatic belt. Detrital zircons from the Gauss, Tinkas and Rossing Formations in the CZ display minor age populations at ca Ma while zircons collected in the Rossing Fm. in the CZ display minor populations at ca. 875 and 825 Ma, these populations are consistent with contributions from local basement inliers and/or the Zambezi belt. Kalahari Craton The detrital zircon age populations from Kalahari marginal strata (SMZ and SFZ) are consistent with source terrains found within the Kalahari craton (Figure 5-19; 199
200 summary of Kalahari Precambrian terrains is given in the Appendix). Samples collected in the Naos Diamictite and the Kudis Fm. in the SMZ both display a major U-Pb age population at ca Ma, consistent with a contribution from the felsic volcanics of the Rehoboth Inlier and possibly from the Natal province. The samples collected in the Nama Group all display a zircon age population at ca Ma, consistent with the timing of pluton emplacement in the Namaqua and Natal provinces as well as in the Choma-Kaloma block. The samples collected in the upper Schwarzrand and all Fish River Formations within the SFZ display an age population at ca Ma. This age population is not found anywhere else in the Kalahari craton, but is consistent with the timing of deposition of the Damara Sequence on the Congo margin, the formation of the Naauwpoort rhyolite and the timing of formation of the Gariep belt. This suggests that most of the Nama Group zircons were derived from the uplifted Damara orogen. The lack of a Ma population in the Kuibis Fm. and the lower Schwarzrand Fm., the oldest sequences of the Nama Group, implies that the Damara Sequence sediments were not spread across both sides of the Damara orogen prior to the deposition of the Schwarzrand Fm. at ca. 580 Ma. This implies that the Congo cratonic margin was not joined to the Kalahari cratonic margin by the Damara belt prior to ca. 580 Ma. Samples collected from the Kuibis Fm. in the SFZ display a major U-Pb age population at ca Ma, consistent with contributions from the Zimbabwe and/or Kaapvaal cratons. Detrital zircons collected in the Kuibis and Schwarzrand Fms. display minor U-Pb age populations at ca Ma, consistent with a period of magmatism and metamorphism in the Limpopo belt. The Kudis Fm. and Naos Diamictite display U-Pb age populations at ca Ma, consistent with derivation 200
201 from the volcano-sedimentary Magondi belt and/or the Rehoboth inlier. The Naos Diamictite also displays a major population at ca Ma, consistent with plutonic emplacement ages of the Rehoboth Inlier. Detrital zircon U-Pb analyses on samples collected in the Kudis Fm. and Naos Diamictite display minor age populations at ca , 1350, and Ma. The Ma population is consistent with a period of magmatism in the AAB and the Ma population is consistent with granitic pluton emplacement in the Namaqua and Natal provinces. The 1350 Ma population is also present in the sample collected in the Kuibis Fm. and is consistent with derivation from either granitoids of the Sinclair group or those of the Choma-Kaloma block. The U-Pb age population at Ma is consistent with a contribution from either the Rehoboth Inlier or the Natal province. The two samples from the lower Fish River Fm. in the NFZ display minor U-Pb age populations at ca Ma and the upper and lower Fish River Fm. samples as well as the lower Schwarzrand Fm. sample display a minor population at ca Ma. The population at ca Ma is consistent with the timing of low-t metamorphics in the Natal province, whereas the population at ca Ma is consistent with sediments derived from the Zambezi belt. Marginal sediments from the Congo and Kalahari are both consistent with entirely intracratonic sources but the possibility of other, external sources cannot be discarded. Proportions of Crustal Recycling εhf values calculated from Hf isotope ratios varied significantly between the Congo and Kalahari cratonic margins (Figure 4-27). Late Paleoproterozoic zircons from both margins display predominantly negative εhf values, implying that the Paleoproterozoic 201
202 orogenic belts incorporated higher proportions of recycled crust than juvenile crust. From ca Ma in the Congo margin strata and Ma in the Kalahari cratonic margin strata the U-Pb age data set displays a gap, indicating a relatively inactive period with little or no crust formation along the margin of either craton. After ca Ma the εhf values differ significantly between the Congo and Kalahari marginal strata. From Ma tectonomagmatic processes along the margin of the Congo craton incorporated predominantly recycled crust, implying the incorporation of older, reworked crust. At ca Ma magmatism in a source terrain of the Congo margin incorporated roughly equal amounts of juvenile and recycled crust, most likely indicating a high degree of mixing during the orogenic events culminating with the amalgamation of Rodinia. Magmatism in a source terrain of the Kalahari margin, on the other hand, incorporated predominantly juvenile crust from ca Ma and roughly equal proportions of recycled and juvenile crust at ca Ma. This is consistent with either a rifting or accretionary environment and with the timing of the amalgamation of Rodinia. During Neoproterozoic magmatism at ca Ma the Congo craton incorporated primarily juvenile crust whereas the Kalahari craton incorporated primarily recycled crust during this time. This implies different conditions in the source terrains of the two cratonic margins during the time of Rodinia, its rifting and the early stages of the amalgamation of Gondwana. Differing crustal generation conditions in the sources of the cratonic margins imply that the cratons were not joined at the time of the Rodinia supercontinent. 202
203 Sedimentary Mixing The similarity in Sm/Nd values (Figure 4-29) and of common Pb values (Figure 4-30) along the margins of the Congo and Kalahari cratons implies mixing of sedimentary sources of various ages along the margins of both continents. Trace and major element signatures across the cratons are consistent with the rift-drift sedimentary history common to both cratons (Figure 4-31 and Figure 4-32; e.g. Keppie et al., 2008; Vijaya Kumar et al., 2008). The similarity in isotopic and elemental ratios in the metasedimentary sequences is probably the result of stream processes and sediment transport over widespread areas. Paleocurrent data suggest many across craton river channels, allowing for younger sedimentary sequences to incorporate sediment from intracratonic sources on both the Congo and the Kalahari cratonic margins (Blanco et al., 2009). Weathering of the older metasedimentary sequences and subsequent transport through stream processes would also cause sedimentary mixing and homogenize isotopic ratios. Elemental and isotopic components held in the clay fraction of the sediments would break down during metamorphism, unlike the refractory elements in the detrital zircon population. The exchange of the elements in the clay fraction during metamorphism would cause the elemental and isotopic mixing seen along both cratonic margins. The U-Pb and Lu-Hf isotope populations would be preserved during this process because they are contained within the more durable zircon population. Both cratons display such a variable array of sources that distinguishing between the isotopic and elemental ratios of the two cratons is impossible. Unfortunately the trace and major element data describe only the similarity 203
204 in original depositional processes and later metamorphic sedimentary breakdown and are not a viable means of determining the timing of amalgamation. 204
205 CZ35 Gauss Fm n=77 CZ53b Tinkas Fm n=64 CZ40 Rossing Fm n=13 CZ29 Khan Fm n=7 DF09-44 Etusis Fm n=53 DF09-43 basement n= Age (Ma) Figure 5-1. Detrital zircon U-Pb age populations from the Central Zone on the Congo cratonic margin. Populations include concordant grains and upper intercept ages of discordant grains that plotted along discordia. 206 Pb/ 238 U ages used for concordant grains <1 Ga, 207 Pb/ 206 Pb ages used for concordant grains >1 Ga. BDG06-91 Mulden Gp, NFZ n=17 DF09-30 Kuiseb Fm, NZ n=14 DF09-26 Karibib Fm, NZ n= Age (Ma) Figure 5-2. Detrital zircon U-Pb age populations from the Northern Zone and Northern Foreland Zone on the Congo cratonic margin. Populations include concordant grains and upper intercept ages of discordant grains that plotted along discordia. 206 Pb/ 238 U ages used for concordant grains <1 Ga, 207 Pb/ 206 Pb ages used for concordant grains >1 Ga. 205
206 SZ13 Kuiseb Schist n=45 DF06-22 Matchless Amphibolite Belt, Kuiseb Schist n= Age (Ma) Figure 5-3. Detrital zircon U-Pb age populations from the Southern Zone on the Congo cratonic margin. Populations include concordant grains and upper intercept ages of discordant grains that plotted along discordia. 206 Pb/ 238 U ages used for concordant grains <1 Ga, 207 Pb/ 206 Pb ages used for concordant grains >1 Ga. DF09-04 Naos Diamictite n=47 DF09-12a Kudis Fm n= Age (Ma) Figure 5-4. Detrital zircon U-Pb age populations from the Southern Margin Zone on the Kalahari cratonic margin. Populations include concordant grains and upper intercept ages of discordant grains that plotted along discordia. 206 Pb/ 238 U ages used for concordant grains <1 Ga, 207 Pb/ 206 Pb ages used for concordant grains >1 Ga. 206
207 εhf DF06-43 Fish River Fm n=36 DF06-44 Fish River Fm n=40 DF06-45 Fish River Fm n=45 DF06-46 Schwarzrand Fm n=16 DF06-41 Schwarzrand Fm; n= Age (Ma) DF06-40 Kuibis Fm n=36 Figure 5-5. Detrital zircon U-Pb age populations from the Nama Group of the Southern Foreland Zone on the Kalahari cratonic margin. Populations include concordant grains and upper intercept ages of discordant grains that plotted along discordia. 206 Pb/ 238 U ages used for concordant grains <1 Ga, 207 Pb/ 206 Pb ages used for concordant grains >1 Ga DF09-30 Kuiseb Fm, NZ n= DM DF09-30 DF U-Pb Age (Ma) A Figure 5-6. Hf isotope data for the Northern Zone on the Congo margin. A) Epsilon Hf values plotted against concordant U-Pb ages. B) Probability density plot of Lu-Hf DM model ages. Age (Ma) DF09-26 Karibib Fm, NZ n=17 B 207
208 εhf εhf CZ35 Gauss Fm n= DM U-Pb Age (Ma) A CZ35 CZ53b CZ29 DF09-44 DF09-43 CZ53b Tinkas Fm n=42 CZ29 Khan Fm n=7 DF09-44 Etusis Fm n=20 DF09-43 basement n=18 B Age (Ma) Figure 5-7. Hf isotope data for the Central Zone on the Congo Margin. A) Epsilon Hf values plotted against U-Pb ages. B) Probability density plot of Lu-Hf DM model ages DM SZ13 DF06-22 SZ13 Kuiseb Schist n=43 DF06-22 Matchless Amphibolite Belt Kuiseb Schist n= U-Pb Age (Ma) A Figure 5-8. Hf isotope data for the Southern Zone on the Congo Margin. A) Epsilon Hf values plotted against U-Pb ages. B) Probability density plot of Lu-Hf DM model ages. Age (Ma) B 208
209 εhf εhf DM DF09-04 Naos diamictite n= DF09-04 DF09-12a A DF09-12a Kudis Fm n=23 U-Pb Age (Ma) B Figure 5-9. Hf isotope data for the Southern Margin Zone on the Kalahari Margin. A) Epsilon Hf values plotted against U-Pb ages. B) Probability density plot of Lu- Hf DM model ages. Age (Ma) 20.0 DF06-43 Fish River Fm n= DM DF06-43 DF06-44 DF06-45 DF06-41 DF06-40 DF06-44 Fish River Fm n=15 DF06-45 Fish River Fm n=17 DF06-41 Schwarzrand Fm n=18 U-Pb Age (Ma) A DF06-40 Kuibis Fm n=15 B Figure Hf isotope data for the Nama Group in the Southern Foreland Zone on the Kalahari Margin. A) Epsilon Hf values plotted against U-Pb ages. B) Probability density plot of Lu-Hf DM model ages. Age (Ma) 209
210 Southern Zone n=61 Central Zone n=276 Northern Zone n= Age (Ma) Figure Probability density plot of U-Pb age populations in all zones in the Congo cratonic margin. Populations include concordant grains and upper intercept ages of discordant grains that plotted along discordia. 206 Pb/ 238 U ages used for concordant grains <1 Ga, 207 Pb/ 206 Pb ages used for concordant grains >1 Ga. Southern Foreland Zone Nama Group n=220 Southern Margin Zone n= Age (Ma) Figure Probability density plot of U-Pb age populations in all zones in the Kalahari cratonic margin. Populations include concordant grains and upper intercept ages of discordant grains that plotted along discordia. 206 Pb/ 238 U ages used for concordant grains <1 Ga, 207 Pb/ 206 Pb ages used for concordant grains >1 Ga. 210
211 Lu-HfDM model age (Ga) εhf U-Pb Age (Ma) A DM SZ CZ NZ Kaoko Southern Zone n= Central Zone n=133 Northern Zone n= SZ CZ NZ Kaoko Age (Ma) B U-Pb Age (Ma) C Figure Hf isotope data for the zones of the Congo cratonic margin. A) Epsilon Hf values plotted against U-Pb ages. B) Probability density plot of Lu-Hf DM model ages. C) Lu-Hf DM model ages plotted against U-Pb ages. 211
212 Lu-HfDM model age (Ga) εhf DM SF SMZ U-Pb Age (Ma) A Southern Foreland Zone n= SFZ SMZ 1.0 Southern Margin Zone n=36 B U-Pb Age (Ma) C Age (Ma) Figure Hf isotope data for the zones of the Kalahari cratonic margin. A) Epsilon Hf values plotted against U-Pb ages. B) Probability density plot of Lu-Hf DM model ages. C) Lu-Hf DM model ages plotted against U-Pb ages. 212
213 εhf DF06-17 Hoanib Fm. n=33 DF06-18 Hoanib Fm. n=33 DF06-08 Khumib Fm. n=74 DF06-11 Coastal Terrane n=69 DF09-39 Ogden Mylonite n=23 DF09-38 Ogden Mylonite n= Age (Ma) Figure Probability density plot of U-Pb age populations in the Kaoko belt of the Congo cratonic margin. Populations include concordant grains and upper intercept ages of discordant grains that plotted along discordia. 206 Pb/ 238 U ages used for concordant grains <1 Ga, 207 Pb/ 206 Pb ages used for concordant grains >1 Ga DM DF06-08 DF06-11 DF06-17 DF06-18 DF09-38 DF09-39 DF06-17 Hoanib Fm. n=12 DF06-18 Hoanib Fm. n=20 DF06-08 Khumib Fm. n=27 DF06-11 Coastal Terrane n=30 DF09-39 Ogden Mylonite n= U-Pb Age (Ma) A DF09-38 Ogden Mylonite n=18 B Age (Ma) Figure Hf isotope data for the Kaoko belt on the Congo cratonic margin. A) Epsilon Hf values plotted against U-Pb ages. B) Probability density plot of Lu- Hf DM model ages. 213
214 Kaoko Belt samples n=280 Nama Group samples n=220 Kalahari craton samples n=91 Congo craton samples n= Age (Ma) Figure Probability density plot of U-Pb age populations in all zones of the Congo and Kalahari cratonic margins, the Neoproterozoic Nama Group and the Kaoko belt of the Congo cratonic margin. Populations include concordant grains and upper intercept ages of discordant grains that plotted along discordia. 206 Pb/ 238 U ages used for concordant grains <1 Ga, 207 Pb/ 206 Pb ages used for concordant grains >1 Ga. Kaoko Belt samples n=116 Nama Group samples n=86 Kalahari craton samples n=36 Congo craton samples n= Age (Ma) Figure Probability density plot of Lu-Hf DM model age populations in all zones of the Congo and Kalahari cratonic margins, the Neoproterozoic Nama Group and the Kaoko belt of the Congo cratonic margin. 214

215 Figure Geologic map of southern Africa. Displays locations of source terrains for the Congo and Kalahari cratons. Modified from Kröner and Cordani,
Physical properties of the Rehoboth Basement inlier
 Physical properties of the Rehoboth Basement inlier P. Ledru*, T. Becker**, D. Hutchins**, J.P. Milesi*, B. Tourlière*, C. Truffert*, R. Wackerle** *BRGM-French Geological Survey, Orleans, France **Geological
Global Tectonics. Kearey, Philip. Table of Contents ISBN-13: Historical perspective. 2. The interior of the Earth.
 Global Tectonics Kearey, Philip ISBN-13: 9781405107778 Table of Contents Preface. Acknowledgments. 1. Historical perspective. 1.1 Continental drift. 1.2 Sea floor spreading and the birth of plate tectonics.
Evolution of the Slave Province and Abitibi Subprovince Based on U-Pb Dating and Hf Isotopic Composition of Zircon
 Evolution of the Slave Province and Abitibi Subprovince Based on U-Pb Dating and Hf Isotopic Composition of Zircon John W.F. Ketchum 1, Wouter Bleeker 2, William L. Griffin 1, Suzanne Y. O Reilly 1, Norman
Copyright McGraw-Hill Education. All rights reserved. No reproduction or distribution without the prior written consent of McGraw-Hill Education
 Copyright McGraw-Hill Education. All rights reserved. No reproduction or distribution without the prior written consent of McGraw-Hill Education Tibetan Plateau and Himalaya -southern Asia 11.00.a VE 10X
Supplementary material
 GSA Data Repository 2016279 How to make a transverse triple junction New evidence for the assemblage of Gondwana along the Kaoko-Damara belts, Namibia Passchier et al. Supplementary material Details of
Gondwana Research 52 (2017) Contents lists available at ScienceDirect. Gondwana Research. journal homepage:
 Contents lists available at ScienceDirect. Gondwana Research. journal homepage:") Gondwana Research 52 (2017) 153 171 Contents lists available at ScienceDirect Gondwana Research journal homepage: www.elsevier.com/locate/gr Depositional ages and provenance of the Neoproterozoic Damara
Gondwana Research 52 (2017) 153 171 Contents lists available at ScienceDirect Gondwana Research journal homepage: www.elsevier.com/locate/gr Depositional ages and provenance of the Neoproterozoic Damara
GY 112 Lecture Notes Archean Geology
 GY 112 Lecture Notes D. Haywick (2006) 1 GY 112 Lecture Notes Archean Geology Lecture Goals: A) Time frame (the Archean and earlier) B) Rocks and tectonic elements (shield/platform/craton) C) Tectonics
2 Britain s oldest rocks: remnants of
 Britain s oldest rocks: remnants of Archaean crust 15 2 Britain s oldest rocks: remnants of Archaean crust 2.1 Introduction Owing to the complex nature of extremely old deformed rocks, the standard methods
Zircons were separated using standard techniques of mineral separation, including a Wilfley
 GSA DATA REPOSITORY 2011129 Dhuime et al. Analytical methods Zircons were separated using standard techniques of mineral separation, including a Wilfley table, a Frantz isodynamic separator and heavy liquid.
Earthscope in the Northern Rockies Workshop
 Earthscope in the Northern Rockies Workshop Co-conveners: David Foster - University of Florida Paul Mueller - University of Florida David Mogk - Montana State University EarthScope in the Northern Rockies
Ch. 12 Proterozoic Eon
 Ch. 12 Proterozoic Eon Proterozoic Eon is ~ 1.95 billion years in duration, from 2.5 Ga to 0.543 Ga 2.5 Ga 1.6 Ga 1.0 Ga 0.54 Ga Paleoproterozoic Era Mesoproterozoic Era Neoproterozoic Era PROTEROZOIC
Mandy Hofmann Ulf Linnemann Karl-Heinz Hoffmann Axel Gerdes Katja Eckelmann Andreas Gärtner
 DOI 10.1007/s00531-013-0949-6 ORIGINAL PAPER The Namuskluft and Dreigratberg sections in southern Namibia (Kalahari Craton, Gariep Belt): a geological history of Neoproterozoic rifting and recycling of
Geology of the Batemans Bay region. Geological evolution. The Lachlan Orogen
 Australian Journal of Earth Sciences 1 The word orogen is derived from the ancient Greek language word for mountain building. The Lachlan Orogen The rocks exposed in the Batemans Bay are part of the geological
INTRODUCTION. Basalt, the widespread igneous rock on the earth sur-face. today appear to have been equally important
 INTRODUCTION Basalt, the widespread igneous rock on the earth sur-face today appear to have been equally important in the geologic past. Basaltic rocks are mostly partial melting products of the upper
Ore Deposits and Mantle Plumes
 Ore Deposits and Mantle Plumes by Franco Pirajno Geological Survey of Western Australia, Perth, Australia KLUWER ACADEMIC PUBLISHERS DORDRECHT / BOSTON / LONDON CONTENTS PREFACE ACKNOWLEDGEMENTS INTRODUCTION
DETRITAL ZIRCON GEOCHRONOLOGY AND PROVENANCE OF MIDDLE AND UPPER DEVONIAN STRATA, NORTHERN APPALACHIAN BASIN OF NEW YORK STATE
 DETRITAL ZIRCON GEOCHRONOLOGY AND PROVENANCE OF MIDDLE AND UPPER DEVONIAN STRATA, NORTHERN APPALACHIAN BASIN OF NEW YORK STATE SELLECK, Bruce W. 1, CHIARENZELLI, Jeff 2, KRATZMANN, David J. 2, CHRISTOFFERSEN,
The Building of a Continent. Delving into Deep Time
 The Building of a Continent Delving into Deep Time Methods for Studying the Past Identifying orogenies Mountain building events Mountains erode Can t study topography Study the evidence they leave behind
Dome formation mechanisms in the southwestern Central Zone of the Damara Orogen, Namibia
 Trabajos de Geología, Universidad de Oviedo, 29 : 440-444 (2009) Dome formation mechanisms in the southwestern Central Zone of the Damara Orogen, Namibia L. LONGRIDGE 1*, R. L. GIBSON 1 AND J. A. KINNAIRD
7 Sedimentation and tectonics at a mid- Ordovician to Silurian active margin
 80 Mountain Building in Scotland 7 Sedimentation and tectonics at a mid- Ordovician to Silurian active margin 7.1 Introduction In mid-ordovician to Silurian times, the Grampian mountains underwent exhumation,
All work was carried out at the Advanced Analytical Centre, at James Cook
 Appendix LA-ICP-MS U-Pb dating of monazite All work was carried out at the Advanced Analytical Centre, at James Cook University (Townsville, Australia). We used a Coherent GeolasPro 193 nm ArF Excimer
Crustal history and metallogenic fertility: Terrane-scale assessment with detrital zircons
 Crustal history and metallogenic fertility: Terrane-scale assessment with detrital zircons W. L. Griffin 1, E. A. Belousova 1 and Suzanne Y. O Reilly 1 1 GEMOC National Key Centre, Department of Earth
Questions and Topics
 Plate Tectonics and Continental Drift Questions and Topics 1. What are the theories of Plate Tectonics and Continental Drift? 2. What is the evidence that Continents move? 3. What are the forces that
predictive iscovery Why is the gold where it is? redictive mineral ineral discovery pmd CRC
 The Y2 project (2001-2004) Time-space evolution of the Yilgarn Craton: implications for geodynamics Kevin Cassidy and the Y2 team Reduced D Risk through Improved Targeting ineral d Why is the gold where
Event geochronology of the Pan-African Kaoko Belt, Namibia
 Precambrian Research 140 (2005) 103.e1 103.e41 Event geochronology of the Pan-African Kaoko Belt, Namibia Ben Goscombe a,, David Gray a, Richard Armstrong b, David A. Foster c, James Vogl c a School of
Evolution of Continents Chapter 20
 Evolution of Continents Chapter 20 Does not contain complete lecture notes. Mountain belts Orogenesis the processes that collectively produce a mountain belt Includes folding, thrust faulting, metamorphism,
The Earth s Structure. The Lithosphere and Tectonic. The Lithosphere and Tectonic. System. Chapter 12. The Earth s Interior
 The Lithosphere and Tectonic System Chapter 12 The Lithosphere and Tectonic System The theory describing the changing configuration of the continents through time is called plate tectonics. Plate tectonic
6 Exhumation of the Grampian
 73 6 Exhumation of the Grampian mountains 6.1 Introduction Section 5 discussed the collision of an island arc with the margin of Laurentia, which led to the formation of a major mountain belt, the Grampian
Mountain Building. Mountain Building
 Mountain Building Mountain building has occurred during the recent geologic past American Cordillera the western margin of the Americas from Cape Horn to Alaska Includes the Andes and Rocky Mountains Alpine
Phanerozoic (last 0.54 by) Tectonics Climate Life
 Tectonics Climate Life") Phanerozoic (last 0.54 by) Tectonics Climate Life Tools for Locating Past Continent Positions Fossils depending on climate Alignment of geological features Geometrical fit of continental margins Similarity
Phanerozoic (last 0.54 by) Tectonics Climate Life Tools for Locating Past Continent Positions Fossils depending on climate Alignment of geological features Geometrical fit of continental margins Similarity
Strike-Slip Faults. ! Fault motion is parallel to the strike of the fault.
 Strike-Slip Faults! Fault motion is parallel to the strike of the fault.! Usually vertical, no hanging-wall/footwall blocks.! Classified by the relative sense of motion. " Right lateral opposite block
Regional geology of study areas 3
 1 Introduction Central part Indonesia geographically is including Kalimantan, Sulawesi and Java islands. Accretionary and metamorphic complexes expose in the Central Java, South Kalimantan and South Central
3/5/05 Dr. Stewart 1
 I. Physiography of Appalachian Mountains A. Introduction 1. These mountains extend from NE Canada to Georgia 2. They are the remains of a deeply eroded, ancient mountain chain once larger than the Himalayans
Detrital zircon geochronology of Precambrian basement sequences in the Jiangnan orogen: Dating the assembly of the Yangtze and Cathaysia Blocks
 Precambrian Research 159 (2007) 117 131 Detrital zircon geochronology of Precambrian basement sequences in the Jiangnan orogen: Dating the assembly of the Yangtze and Cathaysia Blocks Xiao-Lei Wang a,b,,
Comparison of the ancient Keweenaw Mid-Continent Rift System and the active East. African Rift System
 Neier 1 Emily Neier Mentor: Steve Mattox GEO 485 28 April 2016 Comparison of the ancient Keweenaw Mid-Continent Rift System and the active East African Rift System Abstract The active East African Rift
The Proterozoic. Neoproterozoic b.y Mesoproterozoic 1.6-1b.y. Paleoproterozoic b.y.
 The Proterozoic The Proterozoic Neoproterozoic 1.0-0.544 b.y Mesoproterozoic 1.6-1b.y. Paleoproterozoic 2.5-1.6 b.y. Laurentia: Proterozoic N. America During Proterozoic the six elements (or provinces)
Hildebrand Analysis: Topic 4
 Steven Plescia 12/9/16 Hildebrand Analysis: Topic 4 Hildebrand interprets much of the classic late pc-paloezoic Cordilleran miogeocline as exotic to North America Is there a break in the detrital zircons
Plate Tectonics: A Unifying Theory
 Plate Tectonics: A Unifying Theory What is Plate Tectonics? - 7 large tectonic plates and many smaller ones that break up the lithosphere - Plates are brittle and float on asthenosphere and glide past
UNIVERSITY OF PRETORIA Department of Geology HISTORICAL GEOLOGY - GLY 161 SEMESTER EXAM
 UNIVERSITY OF PRETORIA Department of Geology HISTORICAL GEOLOGY - GLY 161 SEMESTER EXAM Internal examiner: Dr A.J. Bumby. External examiner: Prof. P.G. Eriksson Copyright Reserved 20 th November 2009 Time:
Earth Systems Science Chapter 7. Earth Systems Science Chapter 7 11/11/2010. Seismology: study of earthquakes and related phenomena
 Earth Systems Science Chapter 7 I. Structure of the Earth II. Plate Tectonics The solid part of the earth system includes processes, just like the atmosphere and oceans. However, the time scales for processes
Chapter 4 Rocks & Igneous Rocks
 Chapter 4 Rocks & Igneous Rocks Rock Definition A naturally occurring consolidated mixture of one or more minerals e.g, marble, granite, sandstone, limestone Rock Definition Must naturally occur in nature,
GENERAL GEOLOGY Fall Chapter 18: The Sea Floor. Partial Examination IV Study Guide Dr. Glen S. Mattioli
 GENERAL GEOLOGY 1113-005 Fall 2008 Partial Examination IV Study Guide Dr. Glen S. Mattioli Note that these are NOT questions, but rather are a list of topics that we have covered either in class or are
Chapter 2: Plate Tectonics: A Unifying Theory
 Chapter 2: Plate Tectonics: A Unifying Theory Chapter Outline 2.1 Introduction 2.2 Early Ideas About Continental Drift 2.3 What Is the Evidence for Continental Drift? 2.4 Features of the Seafloor 2.5 Earth
Geological Society, London, Special Publications A Damara orogen perspective on the assembly of southwestern Gondwana
 Geological Society, London, Special Publications A Damara orogen perspective on the assembly of southwestern Gondwana D. R. Gray, D. A. Foster, J. G. Meert, B. D. Goscombe, R. Armstrong, R. A. J. Trouw
N = N 0 e -λt D* = N 0 -N D* = N 0 (1-e -λt ) or N(e λt -1) where N is number of parent atoms at time t, N 0
 or N(e λt -1) where N is number of parent atoms at time t, N 0") N = N 0 e -λt D* = N 0 -N D* = N 0 (1-e -λt ) or N(e λt -1) where N is number of parent atoms at time t, N 0 is initial number of parents, D* is number of radiogenic daughter atoms, and λ is the decay
N = N 0 e -λt D* = N 0 -N D* = N 0 (1-e -λt ) or N(e λt -1) where N is number of parent atoms at time t, N 0 is initial number of parents, D* is number of radiogenic daughter atoms, and λ is the decay
Basin Analysis. Stra-graphy
 Basin Analysis Stra-graphy Basin Analysis Basin analysis integrates program sedimentological, stra-graphic, and tectonic principals to develop a full understanding of the rocks that fill sedimentary basins.
PHYSICAL GEOLOGY AND THE ENVIRONMENT (2 ND CANADIAN EDITION)
") Chapter 2: Plate Tectonics Chapter Summary: Plate tectonics is a theory that suggests Earth's surface is divided into several large plates that change position and size. Intense geologic activity occurs
Chapter 2: Plate Tectonics Chapter Summary: Plate tectonics is a theory that suggests Earth's surface is divided into several large plates that change position and size. Intense geologic activity occurs
Lecture 3 Rocks and the Rock Cycle Dr. Shwan Omar
 Rocks A naturally occurring aggregate of one or more minerals (e.g., granite), or a body of non-crystalline material (e.g., obsidian glass), or of solid organic material (e.g., coal). Rock Cycle A sequence
The Proterozoic Eon (2500 ma to 540 ma)
") The Proterozoic Eon (2500 ma to 540 ma) December November October September August July June May April March February January 0 Ma Phanerozoic C M P 540 Ma oldest shelly fossils Proterozoic 2500 Ma first
The Proterozoic Eon (2500 ma to 540 ma) December November October September August July June May April March February January 0 Ma Phanerozoic C M P 540 Ma oldest shelly fossils Proterozoic 2500 Ma first
History of Earth. Chapter 9: HISTORY OF EARTH. The Solar System. Early Earth: A Giant Impact! Early Earth. Formation of the Solar System
 Chapter 9: HISTORY OF EARTH The Essential Earth, 2 nd Edition Thomas H. Jordan & John Grotzinger History of Earth Earth is 4.56 Billion Years Old Earth has experienced a rich and diverse history that we
CHAPTER 8 SUMMARY AND CONCLUSIONS
 CHAPTER 8 SUMMARY AND CONCLUSIONS The Aravalli Mountain Range (AMR) is the main edifice of NW Indian shield. It is about 800 km long and 200 km wide with NE-SW strike. The rocks of AMR are hosted in an
LATE ARCHAEAN FELSIC ALKALINE MAGMATISM: GEOLOGY, GEOCHEMISTRY, AND TECTONIC SETTING
 LATE ARCHAEAN FELSIC ALKALINE MAGMATISM: GEOLOGY, GEOCHEMISTRY, AND TECTONIC SETTING ZOZULYA DMITRY 1, EBY NELSON 2 1 - Geological Institute Kola Science Centre RAS, Apatity, Russia 2 - Department of Environmental,
Whole Earth Structure and Plate Tectonics
 Whole Earth Structure and Plate Tectonics Processes in Structural Geology & Tectonics Ben van der Pluijm WW Norton+Authors, unless noted otherwise 4/5/2017 14:45 We Discuss Whole Earth Structure and Plate
Neoproterozoic Malani Magmatism, northwestern Indian shield: Not a plume product. Kamal K. Sharma
 Neoproterozoic Malani Magmatism, northwestern Indian shield: Not a plume product Kamal K. Sharma Department of Geology, Government Postgraduate College, Sirohi (Rajasthan) 307001 India sharmasirohi@yahoo.com
GEL 113 Historical Geology
 GEL 113 Historical Geology COURSE DESCRIPTION: Prerequisites: GEL 111 Corequisites: None This course covers the geological history of the earth and its life forms. Emphasis is placed on the study of rock
Sequence Stratigraphy, Ore Deposits, and Africa The Influence of Dr. Eric Cheney!
 GSA Vancouver, BC Oct. 21, 2014 A Sequence Stratigraphic View of the Roan Group Host to the World s Largest Sedimentary Rock-hosted Stratiform Copper District, Central Africa Mindola Pit, Zambia Murray
Igneous Rocks. Igneous Rocks. Genetic Classification of
 Igneous Rocks Fig. 5.1 Genetic Classification of Igneous Rocks Intrusive: crystallized from slowly cooling magma intruded within the Earth s crust; e.g. granite, gabbro 1 Fig. 5.2 Genetic Classification
MSA PRESIDENTIAL ADDRESS: METAMORPHISM, SECULAR CHANGE AND GEODYNAMICS
 MSA PRESIDENTIAL ADDRESS: METAMORPHISM, SECULAR CHANGE AND GEODYNAMICS Michael Brown University of Maryland Heat production Heat production (normalized to present-day value) vs age Age (Ma) Plate tectonics
Regional GIS based exploration targeting studies in data poor environments
 Regional GIS based exploration targeting studies in data poor environments A case study of gold prospectivity mapping in Nigeria Matthew Greentree, Mathieu Lacorde and Bert De Waele Acknowledgements Australian
Geology 101. Reading Guide for Plate Tectonics
 Geology 101 Chapter 1: Plate Tectonics (p. 21) Reading Guide for Plate Tectonics Name You should have read this section during the first week of the quarter. You should re-read this section and review
LAB 6: TRINIDAD BEACH FIELD TRIP
 OBJECTIVES: LAB 6: TRINIDAD BEACH FIELD TRIP 1) to develop your powers of observation, especially of geological phenomena; 2) to identify the rocks exposed at Trinidad Beach; 3) to reconstruct some of
NC Earth Science Essential Standards
 NC Earth Science Essential Standards EEn. 2.1 Explain how processes and forces affect the Lithosphere. EEn. 2.1.1 Explain how the rock cycle, plate tectonics, volcanoes, and earthquakes impact the Lithosphere.
A TRIP THROUGH VIRGINIA GEOLOGY FROM AN ENGINEER S PERSPECTIVE
 A TRIP THROUGH VIRGINIA GEOLOGY FROM AN ENGINEER S PERSPECTIVE Bob Moss, PE Principal Engineer ECS Mid Atlantic, LLC The Engineer Parent WHY IS AN UNDERSTANDING OF LOCAL GEOLOGY IMPORTANT? It provides
Chapter 8: The Dynamic Planet
 Chapter 8: The Dynamic Planet I. The Pace of Change A. The Geologic Time Scale II. Earth s Structure and Internal Energy A. The Earth s Core B. The Earth s Mantle C. The Earth s Crust III. The Geologic
Lin Chen Robert A Creaser Daniel J Kontak Oct 29th, 2014
 FURTHER Re-Os ARSENOPYRITE GEOCHRONOLOGY FROM SELECTED MEGUMA AU DEPOSITS, MEGUMA TERRANE, NOVA SCOTIA: POSSIBLE EVIDENCE FOR A PROTRACTED GOLD-FORMING SYSTEM Lin Chen Robert A Creaser Daniel J Kontak
10. Paleomagnetism and Polar Wandering Curves.
 Map of ocean floor Evidence in Support of the Theory of Plate Tectonics 10. Paleomagnetism and Polar Wandering Curves. The Earth's magnetic field behaves as if there were a bar magnet in the center of
REGIONAL PERSPECTIVES
 2917-CH20.pdf 11/20/03 5:24 PM Page 501 PART E REGIONAL PERSPECTIVES 501 2917-CH20.pdf 11/20/03 5:24 PM Page 502 C H A P T E R T W E N T Y A Global View 20.1 Introduction 502 20.2 Global Deformation Patterns
Structural Styles and Geotectonic Elements in Northwestern Mississippi: Interpreted from Gravity, Magnetic, and Proprietary 2D Seismic Data
 Structural Styles and Geotectonic Elements in Northwestern Mississippi: Interpreted from Gravity, Magnetic, and Proprietary 2D Seismic Data Nick Loundagin 1 and Gary L. Kinsland 2 1 6573 W. Euclid Pl.,
Mesozoic Earth History
 Mesozoic Earth History The Mesozoic Era 251-66 MYA Breakup of Pangea Changes in air and oceanic currents Evolution of new terrestrial and marine life Opening of the Atlantic Ocean Basin Rocky Mountains
THEME 8: The Mokolian Era. Namaqualand Metamorphic Complex. This is a granite-gneiss complex. Includes folded and metamorphosed volcanosedimentary
 THEME 8: The Mokolian Era This runs from 2050 Ma (end of Bushveld Complex) to 1080 Ma (start of Pan African) Includes: Namaqualand metamorphic Complex, Natal metamorphic Complex, sedimenatery sequences
Tectonics 102 (fall 2017 supplement to Geology of NPs): Part 2, Supercontinents Gary Oberts, Nov. 1, 2017
: Part 2, Supercontinents Gary Oberts, Nov. 1, 2017") Tectonics 102 (fall 2017 supplement to Geology of NPs): Part 2, Supercontinents Gary Oberts, Nov. 1, 2017 1858, geographer Antonio Snider-Pellegrini Alfred Wegner (Smithsonian Magazine, June 2012) Modern
Tectonics 102 (fall 2017 supplement to Geology of NPs): Part 2, Supercontinents Gary Oberts, Nov. 1, 2017 1858, geographer Antonio Snider-Pellegrini Alfred Wegner (Smithsonian Magazine, June 2012) Modern
Secular Archaean. Pronounced secular trends from. However, also. Cr, intermediate to felsic magmas, and
 Secular Archaean Pronounced secular trends from 1. early sodic granites (TTGs) 2. later potassic granites However, also 1. LILE- & LREE-enriched, high MgO, Mg#, Ni, Cr, intermediate to felsic magmas, and
A Senior Project presented to the Faculty of the Earth and Soil Sciences Department California Polytechnic State University, San Luis Obispo
 Detrital Zircon Geochronology for Neoproterozoic to Cambrian Sediment Sources of the Deep Creek Range and the Pilot Range in the Southwestern United States A Senior Project presented to the Faculty of
Chapter 4: Plate Tectonics
 Chapter 4: Plate Tectonics K2 in the Himalaya, inset round submersible (beneath the submarine) that went to the Marianas Trench in 1960 http://www.nydailynews.com/news/world/james-cameron-presents-record-setting-deep-sea-expedition-article-1.1215139
Archean Terranes. Archean Rocks. Southeastern Africa. West Greenland. Kaapvaal Craton. Ancient Gneiss Complex
 Archean Terranes Archean Rocks Chapter 15A >2.5 Gy old Younger supracrustal sequences Greenstone belts Calc-alkaline metavolcanic rocks Older gneiss complexes Quartzo-feldspathic rocks Tonalites and migmatites
IMSG Post-conference Field Guide
 IMSG 2017 - Post-conference Field Guide Jérémie Lehmann, Marlina Elburg and Trishya Owen-Smith The purpose of this short field excursion on Wednesday 18 January is to show a variety of rocks that make
Chapter 2. Tectonic Setting of Australia. 2.1 Archaean Cratons
 Chapter 2 Tectonic Setting of Australia The Australian continent comprises a number of different tectonic blocks: Archaean and Proterozoic blocks in the western and central parts and relatively younger
The Composition of the Continental Crust
 The Composition of the Continental Crust Roberta L. Rudnick Geochemistry Laboratory Department of Geology University of Maryland Apollo 17 view of Earth Rationale: Why is studying crust composition important?
As compaction and cementation of these sediments eventually occur, which area will become siltstone? A) A B) B C) C D) D
 A B) B C) C D) D") 1. A student obtains a cup of quartz sand from a beach. A saltwater solution is poured into the sand and allowed to evaporate. The mineral residue from the saltwater solution cements the sand grains together,
1. A student obtains a cup of quartz sand from a beach. A saltwater solution is poured into the sand and allowed to evaporate. The mineral residue from the saltwater solution cements the sand grains together,
GEOLOGY - Tectonic Setting and Tectonometamorphic Evolution of Fuping-Wutai- Hengshan Orogenic Belt, China
 GEOLOGY - Tectonic Setting and Tectonometamorphic Evolution of Fuping-Wutai- Hengshan Orogenic Belt, China Title Summary of Proposed Research Program for Doctor of Philosophy Tectonic Setting and Tectonometamorphic
The Proterozoic Part 1
 UNIVERSITY OF SOUTH ALABAMA GY 112: Earth History The Proterozoic Part 1 Lectures 18/19: Tectonics Instructor: Dr. Douglas W. Haywick Last Time 1) The Early Atmosphere 2) The Oceans and Hydrosphere 3)
We are IntechOpen, the world s leading publisher of Open Access books Built by scientists, for scientists. International authors and editors
 We are IntechOpen, the world s leading publisher of Open Access books Built by scientists, for scientists 4,100 116,000 120M Open access books available International authors and editors Downloads Our
Trace Elements - Definitions
 Trace Elements - Definitions Elements that are not stoichiometric constituents in phases in the system of interest For example, IG/MET systems would have different trace elements than aqueous systems Do
U-Pb zircon geochronology, Hf isotope, latest Neoarchean, magmatic event, Douling Complex, Yangtze craton
 Article Geochemistry October 2013 Vol.58 No.28-29: 3564 3579 doi: 10.1007/s11434-013-5904-1 A ~2.5 Ga magmatic event at the northern margin of the Yangtze craton: Evidence from U-Pb dating and Hf isotope
The Dancing Plates: The Plate Tectonic Revolution
 The Dancing Plates: The Plate Tectonic Revolution The Rock Cycle igneous melting, cooling erosion, dep. melting, cooling baking, pressing sedimentary baking, pressing metamorphic erosion, dep. Earth: Compositional
Theory of Continental Drift
 Plate Tectonics Theory of Continental Drift Alfred Wegener suggested that continents had once been part of a supercontinent named Pangaea, that later broke up. The pieces moved apart over millions of years
New insights on the THO-Superior boundary: Tectonic and metallogenic implications
 New insights on the THO-Superior boundary: Tectonic and metallogenic implications John Percival, GSC Nicole Rayner, GSC Herman Zwanzig, MGS Linda Murphy, MGS Joe Whalen, GSC Martha Growdon, Indiana U.
12. The diagram below shows the collision of an oceanic plate and a continental plate.
 Review 1. Base your answer to the following question on the cross section below, which shows the boundary between two lithospheric plates. Point X is a location in the continental lithosphere. The depth
TABLE DR2. Lu-Hf ISOTOPIC DATA FOR WHOLE ROCK SAMPLES AND ZIRCONS [Lu] [Hf]
![TABLE DR2. Lu-Hf ISOTOPIC DATA FOR WHOLE ROCK SAMPLES AND ZIRCONS [Lu] [Hf]](/thumbs/72/67409273.jpg "TABLE DR2. Lu-Hf ISOTOPIC DATA FOR WHOLE ROCK SAMPLES AND ZIRCONS [Lu] [Hf]") TABLE DR1. LOWER CRUSTAL GRANULITE XENOLITH DERIVATION AND MINERALOGY Sample Kimberlite Type Mineralogy KX1-1 Lace s gt + qz + sa + rt (sil, ky, gr, su, cor, zr, mz) KX1-2 Lace s gt + sa + qz + rt (sil,
TABLE DR1. LOWER CRUSTAL GRANULITE XENOLITH DERIVATION AND MINERALOGY Sample Kimberlite Type Mineralogy KX1-1 Lace s gt + qz + sa + rt (sil, ky, gr, su, cor, zr, mz) KX1-2 Lace s gt + sa + qz + rt (sil,
Introduction To Plate Tectonics Evolution. (Continents, Ocean Basins, Mountains and Continental Margins)
") Introduction To Plate Tectonics Evolution (Continents, Ocean Basins, Mountains and Continental Margins) Geo 386 (Arabian Shield Course) Dr. Bassam A. A. Abuamarah Mohanna G E O 3 8 6 A R A B I A N G E
Introduction To Plate Tectonics Evolution (Continents, Ocean Basins, Mountains and Continental Margins) Geo 386 (Arabian Shield Course) Dr. Bassam A. A. Abuamarah Mohanna G E O 3 8 6 A R A B I A N G E
Quiz 1. 3) Which of the following planetary bodies has the least number of impact craters on its surface? A) Mercury B) Mars C) the Moon D) Earth
 Which of the following planetary bodies has the least number of impact craters on its surface? A) Mercury B) Mars C) the Moon D) Earth") Quiz 1 1) Earth's atmosphere is unique among the moons and planets in that A) it has a nitrogen (N2) rich atmosphere. B) it is rich in oxygen (O2) and nitrogen (N2). C) it is rich in carbon dioxide because
Quiz 1 1) Earth's atmosphere is unique among the moons and planets in that A) it has a nitrogen (N2) rich atmosphere. B) it is rich in oxygen (O2) and nitrogen (N2). C) it is rich in carbon dioxide because
Chapter 02 The Sea Floor
 Chapter 02 The Sea Floor Multiple Choice Questions 1. One of the following is not one of the world's major ocean basins: A. Atlantic Ocean B. Arctic Ocean C. Indian Ocean D. Antarctic Ocean E. Pacific
08GSA, James McLelland Symposium
 Ben van der Pluijm and Eric Tohver with Eric Essene, and Jay Busch, Michael Cosca, James Cureton, Katherine Carlson, Jerry Magloughlin, Klaus Mezger, Mark Rathmell, Margaret Streepey, Mary Ellen Tuccillo.
GEOCHEMISTRY OF CRETACEOUS AND TERTIARY PLUTONS OF THE GREAT FALLS TECTONIC ZONE: IMPLICATIONS FOR CRUSTAL EVOLUTION
 GEOCHEMISTRY OF CRETACEOUS AND TERTIARY PLUTONS OF THE GREAT FALLS TECTONIC ZONE: IMPLICATIONS FOR CRUSTAL EVOLUTION By KELLY R. PROBST A THESIS PRESENTED TO THE GRADUATE SCHOOL OF THE UNIVERSITY OF FLORIDA
GLY 155 Introduction to Physical Geology, W. Altermann. Press & Siever, compressive forces. Compressive forces cause folding and faulting.
 Press & Siever, 1995 compressive forces Compressive forces cause folding and faulting. faults 1 Uplift is followed by erosion, which creates new horizontal surface. lava flows Volcanic eruptions cover
Earth History 870:035
 Earth History 870:035 Course goal: To describe the history of Earth and its inhabitants Most of Earth s history predates humanity, so it has not been observed Therefore, we will emphasize how scientists
Mesozoic Tectonics of the Blue Mountains Province
 Mesozoic Tectonics of the Blue Mountains Province Main Events Middle Triassic: normal subduction and facing arcs Late Triassic: arc-arc collision (?) Jurassic: long-lived terrane-continent collision (?)
Formation of the Archean Kaapvaal Province revisited: Implications for the birth and growth of its diamondiferous root
 Formation of the Archean Kaapvaal Province revisited: Implications for the birth and growth of its diamondiferous root H. Helmstaedt 1 and J.J. Gurney 2 1: Department of Geological Sciences and Geological
Supplementary Table DR1. Detrital zircon age data sorted according to geographic region
 GSA Data Repository 2019154 Barham, M., Kirkland, C.L., and Hollis, J., 2019, Spot the difference: Zircon disparity tracks crustal evolution: Geology, https://doi.org/10.1130/g45840.1 Supplementary Table
GONDWANA 14 East Meets West Field Trip PostGo1 - Ribeira and Brasília belts in the context of West Gondwana
 GONDWANA 14 East Meets West Field Trip PostGo1 - Ribeira and Brasília belts in the context of West Gondwana The aim of the field trip is to discuss the tectonic episodes of West Gondwana amalgamation in
Before Plate Tectonics: Theory of Continental Drift
 Before Plate Tectonics: Theory of Continental Drift Predecessor to modern plate tectonics Shape and fit of the continents was the initial evidence Snider-Pelligrini (1858) Taylor (1908) Wegner (1915) Fig.