Cyclostratigraphy and astronomical tuning of the Maastrichtian limestone-marl alternations at Zumaia and Sopelana, Basque country, N-Spain
|
|
|
- Anna Bailey
- 6 years ago
- Views:
Transcription
1 Ciclostratigrafia e tuning astronomico delle alternanze calcareo-marnosi Maastrichtiane di Zumaia e Sopelana, Paesi Baschi, N-Spagna Sietske J. Batenburg XXV ciclo dottorato Università degli Studi di Napoli Federico II Tutor: Mario Sprovieri Marzo 2013
2
3 Ciclostratigrafia e tuning astronomico delle alternanze calcareo-marnosi Maastrichtiane di Zumaia e Sopelana, Paesi Baschi, N-Spagna Cyclostratigraphy and astronomical tuning of the Maastrichtian limestone-marl alternations at Zumaia and Sopelana, Basque country, N-Spain Sietske J. Batenburg
4 Abstract We present an astronomical time scale for the Maastrichtian based on an integrated stratigraphy of the Zumaia and Sopelana sections in northern Spain. The cyclic alternations of hemipelagic limestones and marls at Sopelana and Zumaia display the range of periodicities of eccentricity-modulated precession. The rhythmic bedding pattern is primarily caused by variations in siliciclastic supply and to a lesser extent to variations in biological productivity, both of which controlled by eccentricity-modulated precession through its influence on the hydrological cycle. Together, the Zumaia and Sopelana sections span almost the entire Maastrichtian, and encompass thirteen 405-kyr cycles, spanning a total duration of 5.3 Myr. Consecutive 405-kyr minima in the lithological and geophysical data records are tuned to successive 405-kyr minima in the new La2011 eccentricity solution. Assuming a K/Pg boundary age of Ma, we present orbitally tuned ages of biostratigraphic and magnetostratigraphic events. The bases of Chrons C29r and C30n have been reliably established at Zumaia and their astronomically tuned ages are in good agreement with previous studies. Data from Sopelana provide a refinement of the age of the base of Chron C31r. Planktonic foraminifera and calcareous nannoplankton data from Zumaia, and new calcareous nannoplankton data from Sopelana allow for worldwide correlation of the cyclostratigraphy of the Basque country. Additionally, the orbitally tuned bulk carbonate carbon isotope curve displays a remarkable amplitude of variation. Strong oscillations in δ 13 C seem regularly paced by the 405-kyr periodicity of eccentricity modulated precession. Additionally, sharp negative shifts associated with falls in sea-level occur at regular intervals of ~1.2 Myr. We present a new global correlation of carbon isotope stratigraphies with an astronomically tuned age model based on the cyclostratigraphy of Zumaia and Sopelana and site 762C (Exmouth Plateau). The Late Campanian/Maastrichtian carbon isotope correlation scheme displays a series of trends and excursions that can be observed across the different depositional settings. We propose that the 405-kyr cycle of eccentricity, and potentially longer periodicities, paced the latest Cretaceous climate and carbon cycle.
5 Contents page Chapter 1. Introduction Cyclostratigraphy and astronomical tuning The Late Cretaceous Rationale The Maastrichtian Zumaia and Sopelana sections GTSnext 13 Chapter 2. Cyclostratigraphy and astronomical tuning of the Late Maastrichtian at Zumaia (Basque country, Northern Spain) 15 Abstract 15 1 Introduction 16 2 Geological setting and sections Basque-Cantabric basin of Spain Studied sections Zumaia Sopelana Bidart Materials and Methods Sampling Biostratigraphy Magnetostratigraphy Geophysical properties Carbon isotope stratigraphy Time series analyses Astronomical target curve 26 4 Results Biostratigraphy Magnetostratigraphy NRM behaviour 27 5
6 4.2.2 C30n/C29r chron boundary Interval within C31n-C30n C31r/C31n boundary Cyclostratigraphy Geophysical data Carbon isotopes 32 5 Discussion Initial age control Phase relation Cyclostratigraphic framework of the 405-kyr cycles Astrochronology Astronomically tuned age model Time series analysis in the time domain Biostratigraphy Magnetostratigraphy C30r Base of C29r Carbon isotope stratigraphy Comparison of Maastrichtian astrochronologies 45 Appendix A. Supplementary information Chapter 2 49 Chapter 3. An astronomical time scale for the Maastrichtian at the Zumaia and Sopelana sections (Basque country, northern Spain) 55 Abstract Introduction Maastrichtian chronologies Age of the K/Pg boundary Geological setting and sections Zumaia Sopelana Material and methods Lithostratigraphy and geophysical properties 60 6
7 3.2 Spectral analysis Astronomical target curve Biostratigraphy Magnetostratigraphy Results Lithostratigraphy and geophysical properties Spectral analysis Calcareous nannofossil biostratigraphy Magnetostratigraphy Cyclostratigraphy and Astronomical tuning Cyclostratigraphy Age model Discussion Biostratigraphy Magnetostratigraphy Orbital pacing Conclusions 88 Appendix B. Supplementary information Chapter 2 89 Chapter 4. Orbitally tuned carbon isotope stratigraphy for the Maastrichtian from Zumaia and Sopelana (Basque Country, N-Spain) new insights from global correlation 91 Abstract Introduction Geologic setting and sections Methodology Results 95 5 Correlation Late Campanian/Maastrichtian carbon isotope correlation Correlated sections Age model Biostratigraphy 104 7
8 5.5 Characteristics of the Late Campanian/Maastrichtian carbon isotope curves Discussion Carbon isotopes as climatic markers Orbital pacing The 405-kyr periodicity of eccentricity Origin of the 1.2-Myr periodicity Summary 116 Chapter 5. The origin of Maastrichtian and Danian limestone-marl alternations at Zumaia and Sopelana, Basque Country, N-Spain 117 Abstract Introduction Rhythmic limestone-marl alternations Geological setting and sections Lithological cycles Methology Bed thickness Analyses of selected intervals Paleo-environmental proxies Results Bed thickness Selected intervals Interval I Interval II Interval III Interval IV Discussion Thickness variations Paleo-environmental interpretation Interval I Interval II 139 8
9 4.2.3 Interval III Interval IV Orbital forcing and paleoclimate 141 Chapter 6. Summary and conclusions 145 Future outlook 147 Acknowledgements 148 References 150 Appendices 164 Appendix C. Geophysical data of the Zumaia and Sopelana sections Appendix D. Stable carbon isotope data of bulk carbonate Appendix E. Bed thickness record of the Zumaia and Sopelana sections Appendix F. Elemental, carbon isotope and geophysical data for selected intervals 9
10 Chapter 1. Introduction 1.1 Cyclostratigraphy and astronomical tuning The Earth s climate is strongly controlled by the amount of energy we receive from the sun, and on long time scales, this depends on the position of the Earth. Gravitational interactions with other bodies in our solar system cause quasiperiodic variations in the Earth s orbit and axial position. Figure 1: Modified from Hinnov and Ogg (2007). Left: The Earth s orbital parameters: eccentricity, the ellipticity of the Earth s orbit; precession of the ellipse and of the equinoxes, which describe the gradual rotation of the Earth s axis, similar to the spinning of a top; and obliquity, the tilt of the Earth s axis. Right: eccentricity, obliquity and precession over the last 1.6 Ma (Laskar et al., 2004), with main periodicities indicated in red. Due to interactions in the Earth-Moon system, and the closer position of the Moon to the Earth, the periodicities of precession and obliquity were slightly shorter for the Late Cretaceous than for the present-day, at ~21.8 for precession and ~39 kyr for obliquity. The realisation that orbital parameters influence climate and sedimentation, initially by Adhémar (1842) and Croll (1864), has lead to great advancements in our understanding of past climate and time scales. The study of cyclic variations in the stratigraphic record, and the impact of orbital variations on paleo-environments, is 10
11 called cyclostratigraphy. The first known cyclostratigraphic study, of Cretaceous strata in Colorado, is by Gilbert (1895). The field was much advanced by Milankovitch, who calculated the first curves of insolation, the amount of energy received from the sun at the top of the Earth s atmosphere, and who developed a theory of the ice ages (Milanković, 1941). Astronomical tuning is the calibration of cyclic sedimentary variations to such astronomical target curves. The detection of orbital periodicities in land-based marine sections, mostly in the Mediterranean area, has greatly improved the Neogene and Quaternary time scale (23 to 0 Ma)(Fischer et al., 2009; Hilgen et al., 1999; Lourens et al., 2004). This has gone hand-in-hand with advancements in the astronomical solutions, which reconstruct the amount of energy received by the sun, termed insolation, over time (Berger, 1978; Laskar et al., 2004, 1993; Varadi et al., 2003). Great progress in the development of orbital time scales was made with the advent of ocean drilling, where long, continuous sedimentary records from the sea floor provide excellently preserved archives of Earth s climate, and by the development of new climate sensitive proxies such as stable oxygen isotope ratios (Emiliani, 1955). Such records have been used extensively to obtain better time control on the Cenozoic, for example for the Oligocene (33.9 to 23 Ma) (Pälike et al., 2006) and the Paleocene (Westerhold et al., 2008). Recently, the orbital tuning of Campanian-Maastrichtian ocean cores (latest Cretaceous) (Husson et al., 2011) has been incorporated in the Geologic Time Scale 2012 (Ogg and Hinnov, 2012). 1.2 The Late Cretaceous The Cretaceous period was characterised by a warm climate and high sea-levels, with large epicontinental seas covering present day low-lying land. This vast area of shallow seas together with the rise in numbers of groups of skeleton-forming micro-organisms has led to the widespread deposition of limestone. In the boreal realm we find the seemingly homogenous white chalk or creta (Latin) or Kreide (German), from which the Cretaceous derives its name and abbreviation K. In other settings, the deposition of limestones and marls occurred in a rhythmic fashion, sensitive to the amount of clay brought in by rivers and dust, and to the 11
12 amount of productivity by micro-organisms. Such Cretaceous rhythmic limestonemarl alternations, for example in the Umbria-Marche basin in Italy (Herbert and Fischer, 1986), have long been recognised to have frequency ratios corresponding to those of orbital parameters. However, the establishment of orbitally tuned time scales for the Cretaceous is hampered by the reliability of the astronomical solution, and only the stable 405-kyr periodicity of eccentricity-modulated precession can be used as a tuning target. Radiometric dating can provide independent age control to identify the correct 405-kyr cycle and anchor astronomical tuning efforts to the absolute time scale. Nevertheless, radiometric dating techniques can suffer from an increasing error further back in time, causing many Cretaceous tunings to remain floating (Fiet et al., 2001; Gale et al., 1999; Sprovieri et al., 2006). 1.3 Rationale Recently, the astronomical time scale for the Maastrichtian (72.1 to 66 Ma) has been improved by tuning of geophysical records from ocean drilling cores (Husson et al., 2011). However, such cores have a limited resolution and rarely reflect the full range of orbital periodicities. This study proposes to take the orbitally tuned time scale for the Late Cretaceous to the next level, and use land-based marine sections to improve and refine the Maastrichtian time scale. Similar to the Mediterranean Neogene successions, the selected Cretaceous sections reflect the range of periodicities of eccentricity-modulated precession, and allow obtaining a cyclostratigraphic interpretation on a precessional resolution (~21.8 kyr) The Maastrichtian Zumaia and Sopelana sections The Zumaia and Sopelana sections in the Basque Country, northern Spain, contain hemipelagic limestone-marl alternations (Fig. 2) and provide an excellent opportunity to improve the Maastrichtian time scale. These sections are investigated with the aim to detect the range of orbital periodicities and the 12
13 potential expression of the stable 405-kyr periodicity of eccentricity. The continuity of the sections is investigated by analysis of the behaviour of potential longer term periodicities and analysis of stable carbon isotope ratios and comparison with existing carbon isotope stratigraphies. The reliability of a field-based cyclostratigraphic interpretation is tested by statistical analyses of high resolution geophysical data sets. After a phase relation with eccentricity is determined, the 405-kyr periodicity, as identified in the lithological and geophysical data records, is tuned to the extracted 405-kyr component of eccentricity in the latest astronomical target curve La2011 (Laskar et al., 2011). To use the established astronomical tuning elsewhere, and to enable comparison with existing astrochronologies, magnetostratigraphic and biostratigraphic data are collected, as well as a stable carbon isotope curve, which allow for global correlation. The carbon isotope stratigraphy permits to distinguish between regional and global climatic influences on the Basque-Cantabric Basin. Finally, we aim to investigate the underlying climatic mechanisms leading to the deposition of the rhythmic limestone-marl alternations in the Basque successions of Maastrichtian and Danian (66 to 61.6 Ma). 1.4 GTSnext This research is part of the European Commission Seveth Framework Programme - funded Initial Training Network GTSnext, towards the next generation Geologic Time Scale, funded under grant agreement Within this project, nine PhD students and three Post-docs work on intercalibration of astronomical and radiometric (Ar-Ar and U/Pb) dating techniques, to better constrain the research methods and to obtain improved ages for dating standards, such as the Fish Canyon Sanidine, and stratigraphic levels, such as the Cretaceous/Paleogene boundary. These efforts are resulting in a step forward in the improvement of the Geologic Time Scale and in the training and encouragement of a new generation of geochronologists. 13


14 Fig. 2: The Maastrichtian Zumaia and Sopelana sections, Basque Country, northern Spain, containing hemipelagic limestone-marl alternations and spanning the Cretaceous/Paleogene Boundary (K/Pg) 14
15 Chapter 2. Cyclostratigraphy and astronomical tuning of the Late Maastrichtian at Zumaia (Basque country, Northern Spain) published as: Batenburg, S.J., Sprovieri, M., Gale, A.S., Hilgen, F.J., Hüsing, S., Laskar, J., Liebrand, D., Lirer, F., Orue-Etxebarria, X., Pelosi, N., Smit, J., Cyclostratigraphy and astronomical tuning of the Late Maastrichtian at Zumaia (Basque country, Northern Spain). Earth and Planetary Science Letters , Abstract The standard Geological Time Scale for the Cretaceous is still largely based on seafloor anomaly profiles combined with radio-isotopic tie-points. The astronomical tuned time scale with its much higher resolution and accuracy has recently been extended to the K/Pg-boundary and is being extended into the Cretaceous. To construct such a time scale for the Cretaceous, we selected the upper Maastrichtian of the Zumaia section in the Basque country (northern Spain) which contains a cyclic alternation of limestones and marls deposited in a hemipelagic setting. The Paleogene portion of the Zumaia section has previously been studied for a joint cyclostratigraphic-radioisotopic intercalibration of the age of the K/Pg boundary. Here we present a high-resolution cyclostratigraphic framework for the upper Maastrichtian (Latest Cretaceous) of the Zumaia section in the Basque country (northern Spain), with new biostratigraphic and magnetostratigraphic data. Bed-tobed correlation with the nearby Sopelana section provides additional bio- and magnetostratigraphic constraints. The stacking pattern of the lithologies shows a hierarchy that reflects the combined influence of the orbital parameters of precession and eccentricity. This is confirmed by time series analyses of lithological and geochemical data indicating a strong influence of eccentricity-modulated precession on latest Cretaceous climate as well. The expression of the 405-kyr eccentricity cycle serves as primary signal for astronomical tuning. We provide two 15
16 tuning options depending on absolute K/Pg-boundary ages of and Ma. The logged part of the section encompasses nine and a half 405-kyr cycles in total and spans 3.9 Myr. The acquired cyclostratigraphic framework provides ages for characteristic planktonic foraminiferal events, magnetic reversals and carbon isotope excursions and resolves the late Maastrichtian time scale in unprecedented detail with relative age uncertainties <100 kyr. The high resolution and large amplitude of shifts in δ 13 C on the 405-kyr and 1.2-Myr scales allow for global correlation and may shed more light on the orbital pacing of late Cretaceous climate. 1 Introduction Astronomical tuning of cyclic climate records of late Cretaceous age has the potential to significantly reduce current uncertainties in the Geological Time Scale. Until recently, the magnetic polarity time scale for this time interval was constructed using seafloor anomaly profiles in combination with a limited set of radio-isotopic tie-points (Gradstein et al. 2004; Cande and Kent 1995). Resultant ages typically have uncertainties up to 0.5 Myr. Astronomical tuning has allowed for a much more detailed and accurate chronology for the younger Cenozoic parts of the Geological Time Scale: most of the Neogene is tuned on the precession and obliquity scale, although uncertainties remain in its older part (Lourens et al., 2004), and most of the Paleogene to the long 405-kyr eccentricity cycle (Pälike et al., 2001; Dinarès-Turell et al., 2003; Röhl et al., 2003; Lourens et al., 2005; Pälike, Norris, et al., 2006; Pälike and Hilgen, 2008; Westerhold et al., 2008, 2012; Westerhold and Röhl, 2009; Hilgen et al., 2010). In view of recent improvements in the astronomical solution (e.g., Laskar et al., 2011), the tuning is being extended into the Late Cretaceous, using only the stable 405-kyr eccentricity cycle for age-assignment. Herbert (1999) used the expression of the long eccentricity modulation of precessional amplitude in reflectance records of South Atlantic Deep Sea Drilling Project (DSDP) cores from sites 516F, 525A, 527 and 528 (South Atlantic) to 16
17 establish an astronomical estimate for durations of Late Cretaceous magnetochrons. This resulted in a floating chronology that gives durations, but not ages, as it was not anchored to orbital target curves. Husson et al. (2011) have recently improved and extended these estimates through direct astronomical tuning of magnetic susceptibility records from Ocean Drilling Program (ODP) Leg 207 (equatorial Atlantic) and 208 (South Atlantic), and grey level variations from ODP-Leg 122 (Indian Ocean) and DSDP-Leg 74 (South Atlantic). They presented two tuning options, following existing uncertainties in the tuning of the Paleocene (Westerhold et al. 2008; Kuiper et al. 2008; Hilgen et al. 2010). A suitable section for independently testing the tuning of the Maastrichtian is the Zumaia section located in the Basque country in northern Spain (Fig. 1). These coastal cliffs are famous for their rhythmically bedded Late Cretaceous to Eocene deposits of hemipelagic limestones and marls and form a classical site for paleoclimatic studies, magnetostratigraphic, biostratigraphic and cyclostratigraphic studies (Herm, 1965; Percival and Fischer, 1977; Lamolda, 1990; Ward et al., 1991; Ward and Kennedy, 1993; ten Kate and Sprenger, 1993; Pujalte et al., 1995; Dinarès-Turell et al., 2003; Elorza and García-Garmilla, 1998; Gómez Alday et al., 2008). Carbon and oxygen isotope values have been reported in low resolution for the upper Maastrichtian and lowermost Danian interval in Zumaia (Mount et al. 1986; Margolis et al. 1987), for an 85 m Mid-Maastrichtian interval (Paul and Lamolda, 2007) and for the Paleocene interval (Schmitz et al. 1997). Recently, two GSSPs have been ratified in Zumaia, marking the bases of the Thanetian and Selandian stages of the Paleocene (Schmitz et al., 2011). The Zumaia section is one of the reference sections for the K/Pg-boundary interval, which is well exposed and contains an iridium anomaly and extinction events of planktonic foraminifera (Smit & ten Kate 1982; Alvarez et al, 1982; Pujalte et al. 1995; Apellaniz et al., 1997). The section plays an important role in determining the age of the K/Pg-boundary, which is currently under discussion. 17
18 In this study, we focus on the Maastrichtian part of the Zumaia section to complement and improve the cyclostratigraphic framework and tuning of the Maastrichtian. We present a detailed magnetobiostratigraphy and continuous, high-resolution records of carbon isotopes, reflectance and magnetic susceptibility of the rhythmically bedded Maastrichtian part of the Zumaia section. Following the identification of the 405-kyr cyclicity in these records, the Zumaia section is tuned to provide astronomical ages of biostratigraphic, magnetostratigraphic and stable isotope events, for regional and global correlation. Finally, a comparison with existing time scales is made, and the astrochronologies of Husson et al. (2011) and Thibault, Husson et al. (2012) are independently tested. 2 Geological setting and sections 2.1 Basque-Cantabric basin of Spain The Zumaia section, together with the Bidart, Hendaye and Sopelana coastal sections, as well as the Trabakua section further in-land (Pujalte et al., 1998), contains marine sediments that were deposited in the flysch trough of the Basque- Cantabric basin (Fig. 1) (Mary et al. 1991; Pujalte et al. 1995; Pujalte et al. 1998). This interplate trough was formed in the Early Campanian, as smaller basins from previous rifting stages joined at the start of the Pyrenean convergence (Pujalte et al. 1998). Whereas the lower Maastrichtian in Zumaia is represented by a thick turbidite succession, deposited during an interval of increased subsidence, the Upper Maastrichtian to Paleocene was characterised by relative tectonic stability, and only slight subsidence (Pujalte et al. 1998). Limestones, marls and occasional turbidites were deposited in a hemipelagic setting with an estimated water depth of m. The basin opened into the Bay of Biscay to the west and was surrounded by shallow shelf areas (Pujalte et al. 1998). 18
 and schematic stratigraphic log from Ward et al (1991) with members as distinguished by them. 2.")
19 Figure 1: Paleogeographic setting (Gómez Alday et al., 2008), simplified geologic map of the study area, from Pujalte et al. (1998) and schematic stratigraphic log from Ward et al (1991) with members as distinguished by them. 2.2 Studied sections Zumaia The Upper Maastrichtian interval at Zumaia spans 145 m and is composed of rhythmically bedded limestones and reddish marls with thin intercalated siliciclastic or calcareous turbidites. These turbidites, although they are many (ten Kate and Sprenger, 1993), do not disrupt the pattern of alternating limestones and marls in the Upper Maastrichtian portion of the section. The sequence of alternating marls and limestones reveals cyclicity on different scales, as summarised in Table 1. On a large scale of ~40 m, there are overall changes in carbonate (light) and clay (purplered) content, which make the expression of the smallest scale alternations (~77 cm) quite variable. The ~20 m-intervals of purple marls have been interpreted in terms of sequence stratigraphy as Lowstand Slope Fan complexes, and the ~20 m grey-red limestone-marl alternations as Transgressive/Highstand Systems Tract deposits (Pujalte et al. 2000). The smallest scale (~77 cm) alternations consist of lighter and darker marls in the lowstand units and of alternating limestones and marls in the transgressive/highstand units. These small scale alternations, or couplets, are grouped in bundles of five (~4 m), and these again in groups of four (Fig. 2 and 3) that have an average thickness of ~16 m. As the thickness ratios (0.77:4:16 m 19
20 equals 1:5:20) agree with the ratio of the periodicities of eccentricity modulated precession (21.8:100:405 kyr equals 1:5:20), we interpret the individual couplets as the expression of the precessional cycle. The variations in colour and resistance, most prominent in the marly units of the couplets, were recorded in high detail in the stratigraphic log and the couplets were numbered (Fig. 3). A total of 189 precessional cycles have been identified, including four couplets with very poorly expressed marls that have been marked with a and b (Fig. 3). Scale of Lithological expression alternation ~ 80 cm Couplets of either limestone/marl alternations or marl/marl alternations with differences in resistance and colour (lightness and redness) ~ 4 m Bundles of five ~80-cm couplets, mostly expressed in the marlier parts of the cycles, by increased thickness, darkness and redness. ~ 16 m Groups of four ~4-m bundles, bounded by characteristic couplets with a limited and thinner expression of the marlier part of the couplet. ~40 m Variations in colour (greyness and redness) and resistance Interpreted depositional mechanism Individual precessional cycles of ~21kyr Short term eccentricity cycle of ~100kyr Long term eccentricity cycle of 405kyr, with a distinctive expression of the minima Long term (~1.2Myr) variations in carbonate and clay content Table 1: Different scales of lithological alternations in the Zumaia section 20

21 Figure 2: Part of the Zumaia section displaying the hierarchical stacking pattern with couplets in bundles of five, and these in groups of four, interpreted as the ~100-kyr and 405-kyr periodicities, respectively. The black lines indicate the most prominent marls. 2.2 Sopelana The Sopelana section also forms part of the Basque Maastrichtian succession and shows a similar alternation of limestones and marls, without the occurrence of turbidites. The Upper Maastrichtian interval of the Sopelana section is characterised by a number of faults, but despite these, the following intervals can be correlated to the Zumaia section by recognition of patterns and marker beds: from cycle 13-29, , , and from cycle 156 downwards, where the section is undisturbed. Only those intervals in Sopelana that have been sampled for paleomagnetism have been incorporated in the log (Fig. 3). These display excellent bed-to-bed correlation, which is in agreement with the recognition of the largescale (~40 m) alternation as has previously been reported by Ward et al. (1991)(Fig. 21
22 3). The Sopelana section has been successfully studied for low-resolution magnetostratigraphy providing approximate locations for several reversals (Mary et al. 1991; Moreau et al. 1994) Bidart The coastal cliffs of the Bidart section in south west France, south of Biarritz, reveal faults but the succession is continuous over the K/Pg boundary interval (Galbrun and Gardin, 2004). Approximately 8 m of Maastrichtian redbrown marls and marly limestones, of which the top 30 cm are gray, are overlain by the clay-rich boundary layer, green at its base, and Danian limestones. Samples for biostratigraphic analysis have been taken in the marliest intervals of the topmost 8m of Maastrichtian sediments. 3. Materials and Methods 3.1 Sampling To obtain climatically sensitive proxy records, samples were taken with hammer and chisel throughout the Zumaia section, in a high resolution of 5-10 samples per limestone/marl couplet (e.g. precession cycle), at an average distance of 10 cm. These samples were analysed for stable carbon isotope ratios, magnetic susceptibility and colour reflectance, after which time series analysis was applied to the records. Oriented cores were drilled for paleomagnetic analyses in both the Zumaia and Sopelana sections, and additional samples were taken in the Zumaia, Sopelana and Bidart sections for the detection of biostratigraphic marker events. 22


23 Figure 3: Stratigraphic log of the Zumaia section and selected intervals of the Sopelana section with key biostratigraphic events and magnetostratigraphy from this study. Grey roman numerals indicate the intervals identified by Ward et al. (1991). The half circles in deep purple indicate the 405-kyr eccentricity minima, the lighter half circles indicate the 100-kyr bundling. White numbers are cycle numbers. 23
24 3.2 Biostratigraphy The first occurrences of four species of planktonic foraminifera, Contusotruncana contusa, Abathomphalus mayaroensis, Racemiguembelina fructicosa and Plummerita hantkeninoides, are recognised in the Basque sections. These species are important biostratigraphic markers, used for defining biohorizons in the Late Maastrichtian, and possess clear characteristics that allow them to be distinguished from similar species (Supplementary text). For A. mayaroensis, R. fructicosa and C. contusa, samples were taken from marly lithologies in selected intervals in Zumaia and Sopelana. Hundreds of specimens were studied in the fraction µm. Samples for P. hantkeninoides were taken in Sopelana and in the coastal section of Bidart, France. The Bidart section has a good exposure of the K/Pg-boundary interval (Galbrun and Gardin, 2004) and the bedding pattern can be correlated to Zumaia. For P. hantkeninoides, thousands of specimens from the fraction µm were analysed, because of its rare occurrence along the Basque coast. 3.3 Magnetostratigraphy With a gasoline-powered drill, 111 oriented samples were taken in the Zumaia section and 140 in Sopelana, with two samples per limestone and one per marl. Two intervals were sampled in the Zumaia section (cycle 84-94, ) and three in Sopelana (cycle 13-29, and ), based on previously identified reversal boundaries by Mary et al. (1991). From each oriented sample level, one specimen was thermally demagnetized in a magnetically shielded furnace using numerous small temperature increments, at 20, 80, 120, 150, 180, 200, 220, 240, 300, 320, 340, 360 C. For some samples, the thermal demagnetization was continued up to 550 C. The natural remanent magnetization (NRM) was measured on a 2G Enterprise horizontal cryogenic magnetometer equipped with DC SQUIDS (noise level 3 x Am 2 ) at the Paleomagnetic Laboratory Fort Hoofddijk, the Netherlands. The directions of the NRM components were calculated by principal component analysis (Zijderveld, 1967; Kirschvink, 1980). Mean directions were 24
25 determined for the individual sections using standard Fisher statistics. The 51 and 58 tilt, respectively, (bedding orientation at Zumaia 110/51 and at Sopelana 129/58; strike/dip) helped to distinguish primary (pre-tilt) from secondary (post-tilt) components and to recognize the present-day field overprint (Dec/Inc; 359/58). 3.4 Geophysical properties Magnetic susceptibility was measured in the petrophysical laboratory of the IAMC- CNR in Naples (Italy) with a Bartington MS2E Point sensor to measure low-field magnetic susceptibility (MS) on the surface of all samples (Fig. 4). The repeatability of the measurements was good (within 0.12 %, 1σ, based on all samples) but the values show scatter, which may be due to surface irregularities and the generally low values. The total light reflectance (L*, in %) of all samples was measured in the same laboratory with a Konica Minolta Spectrophotometer CM 2002 on the surface of the rock fragments (Fig. 4). This records the percentage of reflected energy (RSC) at 31 wavelengths in 10-nm steps, over the visible spectrum from 400 to 700 nm. The precision was estimated at 1.2% (1σ, 173 repeated samples). 3.5 Carbon isotope stratigraphy Two samples for stable carbon isotope analysis (Fig. 5) were selected per couplet, one in each lithology. A small amount of powder was obtained with a small handheld 2 mm drill or with a micro-mill. The powders were heated to 400 C to remove organic components. Analyses were performed in the geochemistry laboratory at the IAMC-CNR (Naples, Italy) with an automated continuous flow carbonate preparation GasBenchII device and a ThermoElectron Delta Plus XP mass spectrometer. Acidification of samples was performed at 50 C. Samples were calibrated to Vienna Pee Belemnite using an internal standard (Carrara Marble with δ 13 C = 2.43 VPDB) and NBS19. The precision/repeatability of δ 13 C measurements was estimated at 0.14 (1σ), on the basis of 41 replicate samples. All isotope data are reported in per mil ( ) relative to the VPDB standard. Measurements with 25
26 extremely negative values for δ 13 C were repeated. Five outliers outside a 9-point moving average ±2σ were excluded. 3.6 Time series analyses Time series analyses on all datasets (Fig. 4 and 5) were performed with the program Redfit, which is designed to estimate red noise spectra from unevenly spaced data series (Schulz and Mudelsee, 2002). Furthermore, wavelet analysis was applied to expand the time series in time frequency space (Grinsted et al. 2004) after removal of periodicities over 25 m in Matlab with the function idealfilter (Matlab 7.9.0, The MathWorks, Natick, MA, 2009). Band-pass filters centred at ~16 m were applied with AnalySeries (Paillard et al. 1996) to reveal variations in the dominant cycle. 3.6 Astronomical target curve Until recently, orbital tuning to astronomical target curves was limited to 40 Ma, with the La2004 solution (Laskar et al., 2004). New advances in the construction of planetary ephemerides have enabled extension to 50 Ma with the La2010 solution (Laskar, Fienga, et al., 2011), and to ~55 Ma with the new astronomical solution La2011 (Laskar, Gastineau, et al., 2011), adjusted to the INPOP10a ephemeris (Fienga et al., 2011). Besides the nominal solution, different solutions were generated with changes in the initial positions of the planets and the asteroids, to evaluate the solution s stability. Earth s eccentricity cannot be precisely calculated beyond 60 Ma, and only the stable 405-kyr cycle can be used for astronomical tuning (Laskar, Gastineau, et al., 2011) The 405-kyr cycle from the La2011 solution was used by Westerhold et al. (2012) to establish an astronomical time scale for the Early Paleogene. 26
27 4 Results 4.1 Biostratigraphy The first occurrences of four species of planktonic foraminifera are indicated in Figure 3 and 5. The FO of C. contusa was found in cycle 150 in Sopelana, corresponding to a stratigraphic level of 119 m in Zumaia. In the Zumaia section itself, the species was first found in cycle 149. Of R. fructicosa, the FO was in cycle 128 in both Zumaia and Sopelana, at 105 m depth in Zumaia. The FO of A. mayaroensis was found in cycle 115 in both Zumaia and Sopelana, at 92 m in Zumaia. For P. hantkeninoides, the FO was in cycle 5 in Sopelana, corresponding to a depth of 4 m in Zumaia. In Bidart, the species was first encountered one couplet above. 4.2 Magnetostratigraphy NRM behaviour In general, the quality of the demagnetization data is relatively poor, which hampers a reliable interpretation in several parts of the selected sections. In all samples, a randomly oriented viscous component is first removed between 20 and 80 C. Upon further heating a second component is removed, in general up to 200/220 C. The direction of the second component is random in all sections, except for some reverse samples in the upper two intervals in Sopelana, which display a present-day field overprint. Heating up to 360 C did not yield reliable directions for all samples as many samples displayed a randomly oriented increase of NRM intensity starting from 300 C (Supplementary Fig. 1, SZ17-1p). Post-depositional processes might have affected the paleomagnetic signal in the Zumaia and Sopelana sections as has been described for the Sopelana section by Moreau et al. (1994). In the case that the demagnetization revealed only one component and the NRM intensities at 220 C are extremely high (above 0.2 A/m; similar to suggestions of Moreau et al. (1994), we consider these directions as being related to the 27
28 process of re-magnetization and therefore unreliable. These samples are mainly from the marly lithology, which is conforming to the findings of Moreau et al. (1994). On the other hand, some samples could be heated up to 550 C (Supplementary Fig. 1, So3), and the resultant direction of this third component did not differ from the direction yielded between 200/220 and C. In both intervals in Zumaia and in Sopelana from cycle , this C temperature component has dual polarity and could be interpreted as primary characteristic remanent magnetization (ChRM) component. The mean direction of this stable magnetic component is plotted on equal area projections (Supplementary Fig. 1). These reveal a slight non-antipodality of the normal and reverse directions, but the data do not pass the reversal test. The slight non-antipodality is most likely related to the weak NRM intensities, which make it difficult to isolate the primary component from an overprint component, related to overlapping blocking temperature of the magnetic carrier. The ChRM directions of the third component are plotted in stratigraphic order (Fig. 3) C30n/C29r chron boundary The interval spanning the possible position of the C30n/C29r boundary was sampled in Sopelana, from cycle In this section, the middle part, from cycle 16-23, seems to show reverse polarity, but the majority of the samples in the lower and upper intervals is of unreliable quality, which may be indicative of a later overprint Interval within C31n-C30n In both the Zumaia and Sopelana section, an interval has been sampled that corresponds to a previously identified short reverse interval in Sopelana, which was thought to represent C30r (Mary et al., 1991). In Zumaia (cycle 84-94) the demagnetization data are of poor quality. At the top of the section, polarities are normal, with a reversal boundary between m, within cycle 85b. The 28
29 following 3.5 m, cycle 86-89, seem to have reverse polarity. The lowermost ~3.5 m have uncertain polarity as normal as well as reverse directions mark this interval. In Sopelana (cycle ), the top of the sampled interval also seems to show reverse polarity, with a reversal at 4.1 m, within cycle 85b. Down to cycle 88, in the interval between m, most samples show a reverse polarity. In the interval from cycle , from m, the samples that are considered most likely reliable have normal polarity. However, six levels, of which four within carbonates (at 11.79, 9.90, 8.61, and 7.73 m; example SZ 17-1 Supplementary Fig. 1) and two within marls (at 8.45 and 7.23 m), seem reliable and suggest a reverse polarity. Example SZ 17-1 shows an increase in NRM intensity and a diversion from a progressive decay line towards the origin upon heating above 300 C. Therefore, we indicate this interval as having uncertain polarity and we cannot exclude that the reverse polarity might extend down to cycle 100. From cycle 101 downwards, between m, the resulting polarity is normal C31r/C31n boundary The interval spanning the C31r/C31n boundary has been sampled fully in Zumaia, and partially in Sopelana (due to the presence of faults). Plotting the ChRM of the C components of samples ZZ 1 to 72 from cycle from Zumaia on equal area projections (Supplementary Fig. 1) clearly shows dual polarity. Even though the directions are non-antipodal, we consider these ChRM reliable. The lower 23.5 m of this interval has reverse polarity, whereas the upper 4 m is of normal polarity. The reversal boundary is located at the top of cycle 153, at 121.5m. It is well defined and in agreement with data of Mary et al. (1991) from Sopelana. In Sopelana, samples yielded reverse polarity, from cycle , and In the uppermost interval between m, the quality of the demagnetization data is too poor to yield any reliable polarity. 29
30 4.3 Cyclostratigraphy Geophysical data The magnetic susceptibility and the total reflectance record (L*) vary in close agreement to the observed alternations in the lithology (Fig. 4). For example, the ~77-cm periodicity is particularly well discernible in the magnetic susceptibility record between 60 and 80 m depth, where this signal is bundled in groups of five that vary in amplitude on the 16-m scale. Both records show remarkable shifts (-18 % in L*, +~14 SI in MS) at depths around 59 and 110 m, reflecting abrupt changes in lithology form carbonate-rich sediments below to marlier sediments above. The magnetic susceptibility record shows main periodicities in the spectrum (estimated by Redfit) at 56 and 18.8 m, and at 84.2 and 72.5 cm (Fig. 4). In the wavelet analyses (for which periodicities larger than 25 m were removed by notchfiltering) the ~19-m periodicity is strongly present throughout the record. In two intervals, from m and more strongly from m, the periodicity is shifted towards smaller values, around 12 m. The wavelet analysis also shows a periodicity around 4 m, albeit of less significance, that is similarly shifted towards smaller values. The ~12-m and ~4-m periodicities are most prominently present in the record around 58 and 109 m in the stratigraphy. Finally, there are periodicities around 80cm throughout the record, except for the interval m. The bandpass filter centred at 19 m (bandwidth m) shows ten large-scale minima. The reflectance record (L*) has its main periodicities at 47.0 and 15.7 m and 72.3 cm (Fig. 4). The wavelet analysis shows a strongly present 16-m periodicity throughout the record, which is somewhat shifted to lower values in the interval from m and strongly shifted to a length of ~12 m in the interval m. There is an additional periodicity around 4 m, visibly present around 58 m and significantly present in the interval m, where it is shifted to slightly lower values. A periodicity with a length of ~70 cm is intermittently present throughout the record. The band-pass filter centred at 15.7 m (bandwidth m) shows ten large-scale maxima. 30

.")
, and the filter for magnetic susceptibility is centred at 18.9 m (bandwidth of 12-40 m).")
31 Figure 4: Stratigraphic log of the Zumaia section with total reflectance L* on the left and magnetic susceptibility on the right, with three-point moving averages plotted over the data series. The data are flanked by their band-pass filters (black lines) and wavelet analyses (for the latter two a notch filter was applied to remove periodicities larger than 25 m). The band-pass filter of the reflectance is centred at 15.7 m (bandwidth m), and the filter for magnetic susceptibility is centred at 18.9 m (bandwidth of m). Bandwidths are broad to allow for detection of the smallest long-term periodicity of ~12 m as observed in the wavelet spectrum. The 31
32 horizontal lines indicate the stratigraphic levels that are identified as 405-kyr minima; the black Ma 405 no.s indicate the 405 eccentricity cycles following the nomenclature of Husson et al. (2011); the orange bands indicate major transitions in the lithology Carbon isotopes The δ 13 C curve from Zumaia (Fig. 5) shows an overall decreasing trend, punctuated by two types of fluctuations of The upper half of the curve is characterised by five rises and falls with a periodicity on the order of 16 m, whereas the lower half shows longer-term oscillations on the order of 47 m. Six prominent negative shifts are indicated Figure 5 and Table 2, ranging in amplitude from The sharpest shift (No.1) occurs within one cycle, and the most gradual shift (No.2) over 6 cycles (5 m). The same time series analyses techniques were applied as for the geophysical properties ( 4.3), showing main periodicities around 47.0 and 16.6 m, and at 122, 103, 101, 97.0, 92.9, 81.3 and 77.5 cm (Fig. 5). In the wavelet analyses, the 16-m periodicity is more significant in the upper half of the record, and an additional periodicity is present, although not significant, around 4 m. The resolution of the record does not allow for reliably detecting periodicities around 80 cm. The bandpass filter centred at 16.6 m (bandwidth m) shows nine large-scale maxima. 32


33 Figure 5: A Chemo-, bio-, magnetostratigraphic framework for the Zumaia section. - The δ 13 C record, with a band-pass filter centred at 16.6m (in black, with a bandwidth of m, to allow for detection of the smallest long-term periodicity 33
34 ~12 m as indicated in the wavelet spectrum). The black Ma 405 no.s indicate the 405 eccentricity cycles following the nomenclature of Husson et al. (2011). Prominent negative shifts, as listed in Table 2, are indicated by black arrows accompanied by their tuned ages. - The identified 405-kyr minima with ages obtained by tuning to the new La2011 solution (Laskar, Gastineau, et al., 2011), assuming a K/Pg-boundary age of Ma. - The first occurrences of four species of planktonic foraminifera, of which the lower three are considered reliable global markers. - The tuned ages of magnetic reversals C31n/C31r and C30n/C29r, the latter based on correlation to Westerhold et al. (2008) (see Supplementary Figure 2). 5 Discussion 5.1 Initial age control An initial estimate of the time span in the Upper Maastrichtian of the Zumaia section can be made by applying the ages of Gradstein et al. (2004), and Ogg et al. (2008) for the K/Pg-boundary and the C31r/C31n reversal boundary. This gives an average sedimentation rate of 3.7 cm/year, a periodicity of 407 kyr for the ~16-m cyclicity, and a periodicity of 20.8 kyr for the ~77-cm limestone-marl alternations. These durations and the hierarchical pattern are strong indications that the different lithologies were deposited under the combined influence of the orbital periodicities of precession and eccentricity. The periodicities of precession were slightly smaller in the Cretaceous with respect to present day (Berger& Loutre 1994; Hinnov 2000), with a mean duration of 20.8 kyr (Herbert& D Hondt 1990). 5.2 Phase relation As the combined influence of the precession and eccentricity is clearly reflected in the rhythmic alternations in Zumaia, the phase relation with eccentricity is 34
35 unambiguous. Since eccentricity determines precessional amplitude, the eccentricity maxima can be recognised by well developed precessional cycles with distinct thick and dark marls. Eccentricity minima can be pinpointed by a poor expression of the marly part of the cycle occurring in an interval of relatively thin and carbonate-rich cycles. This is the same phase relationship as inferred by Dinarès-Turrel et al. (2003), Kuiper et al. (2008), and Hilgen et al. (2010) for the Paleocene part of the Zumaia section. A strong marl-limestone contrast coincides with larger amplitudes in the magnetic susceptibility and reflectance variations. As increased thickness usually coincides with a darker colour of the marls, the variation amongst couplets is most likely caused by increased clay-input. This mechanism has previously been described, and lithologically tested, by Mount & Ward (1986). Increased clastic input may indicate more runoff, potentially caused by an intensified hydrological regime due to the influence of precession. 5.3 Cyclostratigraphic framework of the 405-kyr cycles The identification of 405-kyr minima of eccentricity in the field forms the basis for a chronostratigraphic framework, which allows for more precise age determinations of bio- and magnetostratigraphic events of global importance. This field interpretation is tested by comparison to the periodicities in the generated data records. The identified 405-kyr minima are listed in Supplementary Table 1 and indicated by black lines in Figure 4 and 5. In the upper part of the section, the identified minima coincide with minima in the ~16 m band-pass filter of magnetic susceptibility and maxima in the filter of total reflectance. The carbon isotopes seem to have a lag of two to three precessional cycles (44-65 kyr) with regard to the geophysical data. Further down in the section, the variability in the thickness of the strata increases, which leads to difficulties in comparing the filtered signals with the field interpretation. Nonetheless, the overall number of nine and a half 405-kyr cycles identified in the field is in agreement with the filtered large-scale cycles, yielding an estimated time-span of 3.9 Myr for the studied interval, and an average sedimentation rate of 3.7 cm/kyr. 35
36 5.4 Astrochronology Astronomically tuned age model Now that the cyclostratigraphic framework of the 405-kyr eccentricity related cycles is established and the phase relation with eccentricity known, we can attempt to tune these cycles to 405-kyr eccentricity minima (identified with a filter centred at 405 kyr, band-width kyr) in the new La2011 solution (Laskar, Gastineau, et al., 2011). This tuning uses the K/Pg-boundary as starting point. In fact, the younger Paleocene part of the Zumaia section played an important role in recent attempts to better determine its age. The section was first studied for cyclostratigraphy by Ten Kate and Sprenger (1993) who successfully identified the cycles around the K/Pg-boundary and established an initial tuning of part of the Maastrichtian and Danian sediments. Later, Dinarès-Turell et al. (2003) tuned the Paleocene part of the Zumaia section to the inferred expression of the long-period 2.4-Myr and ~100- kyr eccentricity cycles. Kuiper et al. (2008) tuned to the stable 405-kyr period of eccentricity, to arrive at an astronomical age of ~65.95 Ma for the K/Pg-boundary, using their newly astronomically calibrated age for the FC standard for 40 Ar- 39 Ar dating. A recent direct intercalibration of the Fish Canyon Sanidine by Rivera et al. (2011) arrived at ± Ma, within the uncertainty of the Kuiper et al. (2008) age. The Paleocene part of the Zumaia section was combined with high resolution records from ODP-leg 198 and 208 by Westerhold et al. (2008) to suggest two main tuning options with ages of ~65.28 or ~65.68 Ma for the K/Pg-boundary. However, a recent evaluation of the astronomically tuned time scale for the Paleocene and Earliest Eocene by Hilgen et al. (2010) presents an alternative 405- kyr interpretation, arriving at a main tuning option of ~66.0 Ma for the K/Pgboundary, although a 405-kyr younger tuning could not be excluded. Westerhold et al. (2012) recently presented a different astrochronology for the Early Paleogene, using the new La2010 and La2011 orbital solutions, with a K/Pg boundary age of ± 0.06 Ma. New Ar-Ar and U/Pb data are expected to resolve this age problem. For the moment, however, two tuning options for the Late Maastrichtian are presented here, similar to the approach of Husson et al. (2011) with K/Pg- 36
37 boundary ages of and Ma, of the Ma option in particular is in close agreement with the intercalibrated Fish Canyon Sanidine ages of Kuiper et al. (2008) and Rivera et al. (2011). The tuning options of the Paleocene (Kuiper et al, 2008; Westerhold et al, 2008, Hilgen et al, 2010) and the Maastrichtian cyclostratigraphy presented here and by Husson et al. (2011) place the K/Pg boundary in a 405-kyr eccentricity minimum Time series analysis in the time domain A further test for the field-based age model is performed by application of spectral analyses to the proxy records after tuning. To avoid differences in durations between the tuning options, for this exercise only an age model was applied with a constant duration of 405 kyr between eccentricity minima and linear interpolation between these points. The magnetic susceptibility shows main periodicities at 1.26 Myr, and at 399, 24.1 and 19.7 kyr (Fig. 6). Time series analysis of total reflectance in the time domain shows a strong peak at 1.26 Myr. After removal of the larger periodicities, also periodicities of 404, 275, 135, 110 and 23.0 kyr are noteworthy (Fig. 6). Finally, δ 13 C shows main periodicities at 1.26 Myr, and at 446, 26.9, 25.2, 23.1 and 21.2 kyr. The geophysical data records show a strong expression of the precessional cycles, with periodicities between 19.7 and 24.1 kyr. These durations are, on average, slightly longer than the expected 20.8 kyr, but this can be explained by the influence of precessional amplitude on sedimentation rate. Darker marls have an increased thickness, so that the more prominent and thicker couplets will carry a stronger proxy signal. Additionally, the short ~100-kyr period of eccentricity shows up in the reflectance record, and there is high power around the 405-kyr period, albeit partly introduced by tuning. After tuning, the wavelet analyses of all data series show a very constant behaviour of the periodicities over time. 37

following the nomenclature of Husson et al.")

38 Figure 6: The magnetic susceptibility (MS), reflectance (L*) and stable carbon isotope (δ 13 C) data series in the time domain, with their band-pass filters (with bandwidths of , , and yr -1 ), the 405 eccentricity cycles (black Ma 405 no.s)following the nomenclature of Husson et al. (2011), wavelet analyses (periodicities larger than 2 Myr were removed by notch-filtering) and Redfit spectra (dashed lines at 95 and 80 % significance levels, for the spectrum of L* periodicities larger than 2 Myr were removed by notch-filtering, the original spectrum is shown in grey). 38
39 5.4.3 Biostratigraphy Our orbital tuning and age model allow us to calculate astronomical ages of biostratigraphic events, stable carbon isotope shifts and magnetostratigraphic reversals (Fig. 5 and 7, Table 2). The first occurrences of planktonic foraminifera Contusotruncana contusa, Abathomphalus mayaroensis, Racemiguembelina fructicosa are considered reliable markers, as these species are common in the upper Maastrichtian of the Basque-Cantabric basin. As Plummerita hantkeninoides is very rare in the in the Basque-Cantabric basin, its first appearance does not necessarily match its global occurrence. In this study, the FOs of A. mayaroensis and C. contusa (at Ma and Ma, respectively) are younger with respect to reversal C31n/C31r and the K/Pg boundary than the ages reported by Gradstein et al. (2004) and Ogg et al. (2008) of Ma and Ma, respectively, using a K/Pg boundary age of 65.5 Ma. The FO of the planktonic foraminifer R. fructicosa at Ma is considerably younger than reported by Gradstein et al (2004) at 69.62Ma, but this species is very similar to Racemiguembelina powelli, which occurs earlier. Other authors may consider these species synonymous and group them together, resulting in an older FO Magnetostratigraphy The position of the C30n/C29r reversal boundary has been obtained by correlation to Westerhold et al. (2008), as the data from this study are not reliable for this interval. The seemingly reverse interval with its upper boundary within cycle 85b and its lower boundary in cycle 88 (in Sopelana), which is in agreement with Mary et al. (1991), is not likely to reflect C30r. The magnetostratigraphic results are in excellent agreement with the recently published magnetostratigraphy of Zumaia by Pérez-Rodríguez et al. (2012). The tuned durations for reversal boundaries are listed in Table 2 and Figure 7, with previously reported ages by Husson et al. (2011), Thibault, Husson et al. (Thibault, Husson, et al., 2012), the Geologic Time Scale 2004 (Gradstein et al., 2004), Cande and Kent (1995), Herbert et al. (1995) and Herbert (1999). There is a remarkably good agreement on the total amount of time 39
40 between the K/Pg-boundary and the base of C31n, estimated at 3.22 Myr in this study, 3.23 in Gradstein et al. (2004) and 3.22 by Husson et al. (2011). Fig 7: Late Maastrichtian time scales with magneto-, bio- and chemostratigraphic events according to option 2 of this study; option 2 of Husson et al. (2011) (both assuming a K/Pg-boundary age of Ma); the GTS 2004 and 2008 (Gradstein et al. 2004; Ogg et al. 2008); Cande and Kent (1995), Herbert et al. (1995) and Herbert (1999). Please note that Herbert et al. (1995) and Herbert (1999) only report durations, a K/Pg-boundary age of Ma has been assigned for comparison. For this study, the age of the base of C29r is based on correlation to Westerhold et al. (2008) (see Supplementary Figure 2). 40
41 C30r The position of C30r in seafloor anomaly profiles is roughly at one third of the otherwise normal polarity interval C31n-C30n (based on Cande & Kent 1992; Bouligand et al. 2006), whereas the potential reverse interval in this study is about midway in both thickness and recorded time, which would imply unreasonable changes in spreading rates. Comparison to Husson et al (2011) and other previous estimates (Table 2) suggests that C30r should be located one 405-kyr cycle further down, and it is possible that our sampling does not extend far enough. Although the possibly reverse interval seems rather long (66 kyr), it may be a cryptochron that correlates to one of the wiggles within the C30n interval of anomaly profiles from ocean floors of different basins (Cande and Kent, 1992; Bouligand et al., 2006). Alternatively, the data may be unreliable and result from remagnetization, as samples with reversed polarities also occur within an otherwise normal interval further down (cycle 89 to 100) Base of C29r The samples in this interval seem to indicate reverse polarity at least down to cycle 23, which is older than most previous tunings, and may represent a more recent remagnetization. Instead, the position of the base of C29r can be obtained by correlation to IODP Sites 1262 and 1267, as done by Westerhold et al. (2008). Supplementary Figure 2 shows the reversal to correspond to three cycles above the last 45 kyr minimum before the K/Pg boundary, or 17.5 cycles below the K/Pg boundary, which is in good agreement with Herbert (1999) who found the reversal to be 18.5 cycles to the K/Pg-boundary in reflectance records from ODP-Sites 516F, 528 and 525A in the South Atlantic. It is in reasonable agreement with ten Kate and Sprenger (1993), who correlated the base of C29r from Agost, Spain (De Groot et al, 1986) and Sopelana (Mary et al. 1991). 41
42 5.4.5 Carbon isotope stratigraphy The tuned bulk-carbonate δ 13 C curve from Zumaia has a high resolution, which provides excellent possibilities for correlation. The δ 13 C variations compare well with recently published high resolution bulk δ 13 C data from northern Germany (Voigt et al. 2010), the Gubbio section in Italy (Voigt et al., 2012), two sections in Denmark (Thibault, Harlou, et al., 2012), ODP Hole 1210B on Shatsky Rise in the Tropical Pacific (Jung et al., 2012) and ODP Hole 762C in the Indian Ocean (Thibault, Husson, et al., 2012), although the carbon isotope curve from Zumaia seems to vary with a larger amplitude. The δ 13 C curve reveals clear variations on a ~1.2 Myr scale. These variations are especially apparent in the lower half of the record, while the upper half is dominated by a strong 405-kyr cyclicity. The bulk-carbonate δ 13 C shows a gradual decline throughout the Late Maastrichtian of approximately 0.5 permil, punctuated by six prominent negative shifts, on the order of -1 (Fig. 5). Interpretation of the carbon isotope curve is not straightforward, as the behaviour reflects a complex interplay of sea level variations (Voigt and Hilbrecht, 1997; Jarvis et al., 2006), ocean circulation (Barrera et al., 1997; Frank and Arthur, 1999; Friedrich et al., 2004), and productivity (Li& Keller 1998). The major shifts in bulk-carbonate δ 13 C at 59 and 109 m depth, approximately 1.2 Myr apart, coincide with lithological shifts from reddish limestone-marl alternations that have been interpreted as Transgressive or Highstand Systems Tract deposits to purple marly intervals that likely represent low-stand deposits (Pujalte et al., 1995). A drop of relative sea level, either by eustacy or local tectonics, may have exposed shallow shelf areas. This would have led to increased erosion, and an increased input of clastic material to deeper parts of the basin, where the sedimentary cycles became thicker and marlier. Erosion of sediments on shallow shelf areas, relatively rich in organic matter, may have delivered more 12 C to the deeper parts of the basin, causing a negative excursion in δ 13 C. 42
43 Maxima of the 405-kyr eccentricity cycle in the lithology coincide with minima in δ 13 C, which may be related to an intensified hydrology that would not only have carried more clastic material to the basin, but may also have carried relatively lighter δ 13 C HCO3-. The relatively strong expression of the 405-kyr cycle in the bulk carbonate δ 13 C record of Zumaia in comparison to other sites may be related to the slightly restricted nature of the basin, which was a narrow inter-plate trough (Pujalte et al., 1995), and to a major continental influence. The correspondence of 405-kyr maxima in the δ 13 C record with 405-kyr minima in the lithology is in agreement with the classic response of sedimentary records to Cenozoic climate forcing. The lag of 2-3 precessional cycles compared to geophysical proxy records is similar to a lag of ~35 kyr to the 405-kyr period of eccentricity as found in Oligocene-Miocene records (Pälike et al. 2006), of 42±20 or 48±18 kyr for the Miocene (Holbourn et al. 2007), and of kyr for the Paleocene (Westerhold et al. 2011). Such a lag is likely due to the longer residence time of carbon and consequently the longer response time of the global carbon cycle to astronomical forcing (Pälike et al. 2006). In general, this study shows that Late Maastrichtian climate was strongly controlled by insolation at low latitudes, as the periodicities of eccentricity-modulated precession are the dominant control on the geophysical and δ 13 C data. This is corroborated by the absence of obliquity (with a main period of 41 kyr) that would have exerted a strong control on high latitude climate. Glacio-eustacy has been suggested as controlling mechanism on Late Cretaceous sea levels (Miller et al. 2005), but the absence of a high-latitude signal in our records makes this hypothesis unlikely. 43
. From left to right the cyclostratigraphic interpretation of Husson et al.")
 of the grey level data of Hole 762C; the magnetostratigraphy, 15.")
44 Fig. 8: Comparison of Maastrichtian astrochronologies, with grey bands indicating the identified 405-kyr cycles, numbered Ma 405 1, Ma 405 2,..., from the K/Pg boundary downwards, following Husson et al. (2011). From left to right the cyclostratigraphic interpretation of Husson et al. (2011) of the grey level data of Hole 525A and Hole 762C, with their ~100 kyr and 405 kyr band-pass filters; the cyclostratigraphic framework of Thibault, Husson et al. (2012) of the grey level data of Hole 762C; the magnetostratigraphy, 15.7 m band-pass filter (bandwidth m) of reflectance, 44
45 the reflectance data, the stratigraphic column, the magnetic susceptibility data and the 18.9 m band-pass filter of magnetic susceptibility (bandwidth 12-40m) of Zumaia (this study); the cyclostratigraphic interpretation of the magnetic susceptibility data of Hole 1267B by Husson et al. (2011). 5.5 Comparison of Maastrichtian astrochronologies This cyclostratigraphic framework provides a refinement of the Geological Time Scale for the Late Maastrichtian, with the potential to anchor it to astronomical target curves. The recent astronomical tuning of Maastrichtian sediments from ODP Holes 1267B, 525A and 762C by Husson et al. (2011) shows a very similar duration from the base of chron C31n to the K/Pg boundary (table 2) of 3.22 Myr. Additional tuning results from Hole 762C by Thibault, Husson, et al. (2012) allow to re-evaluate the durations of chrons C29r (Cretaceous) and C30n (table2), which, added to the durations of chrons C30r and C31n by Husson et al. (2011), again gives a duration from the base of C31n to the K/Pg boundary of 3.22 Myr. The geophysical data of magnetic susceptibility (Hole 1267B) and grey level (Hole 762C and 525A) with their 100-kyr and 405-kyr band-pass filters and cyclostratigraphic interpretations by Husson et al (2011) and Thibault et al (2012) are plotted next to the geophysical data and band-pass filters of Zumaia (Figure 8), to assess the cyclostratigraphic framework. The ODP-records have a lower resolution, meaning that the precessional cycles are usually not well expressed. The cyclostratigraphic interpretation often depends on the 100-kyr cyclicity instead of the stable 405-kyr periodicity, such as in Hole 525A (Husson et al., 2011) and the upper part of Hole 762C (Thibault, Husson, et al., 2012). Also, the interpretation relies on several Sites, of which the correlation is not entirely straightforward, as the cyclostratigraphic interpretations do not agree with the positions of the magnetic reversals (Fig. 5 in Husson et al., 2011). By contrast, the Zumaia section has a much higher resolution and offers the possibility to identify the full range of periodicities of eccentricity modulated precession. This allows for a more reliable and detailed cyclostratigraphic framework that is based primarily on cycles that can be identified 45
46 directly in the lithological record. A test of this interpretation is provided by high resolution records of magnetic susceptibility, reflectance, and bulk δ 13 C. There are no indications for faulting or hiatuses, and the large scale alternation of carbonaterich versus marly intervals is in agreement with the Sopelana section, as well as with the Bidart and Hendaye sections in France and the Trabakua section further inland (Pujalte et al., 1998) that were visited, but not logged in detail. It should be mentioned that if there are hiatuses of exactly 405 kyr, these could go unnoticed. The obtained estimate of the duration between C31r/C31n and the K/Pg boundary, however, is in close agreement with the GTS2004 and other studies (Figure 7, Table 2). For the first time, a consistent 405-kyr cyclostratigraphy is presented for the Late Maastrichtian, which is pivotal for anchoring the Geologic Time Scale of the Cretaceous. 46
47 C31r/C31n Zumaia 152/ duration C31r/C31n - K/Pg planktonic foraminifera FO P. hantkeninoides FO A. mayaroensis FO R. fructicosa FO C. contusa ± 0.08 ± 0.08 Sopelana (Bidart ± 0.08 ± 0.08 cycle up) Zumaia, Sopelana ± 0.08 ± 0.08 Zumaia, Sopelana ± 0.08 ± 0.08 Sopelana (Zumaia ± 0.08 ± 0.08 cycle up) Husson et al., Thibault Cande Herbert 2011) et al. and (1995 2, option ± ± ± ± ± 0.07 option (2012) 1 Kent 1999) 2 (1995) 66 ± ± 0.07 ± ± ± ± δ 13 C shifts (Gradstein This study section cycle depth option option et al., no. (m) ) K/Pg ± 0.02 ± magnetic reversals C30n/C29r correlated ± 0.09 ± C30r/C30n C31n/C30r No.1 (-1.0 ) Zumaia No. 2 (-1.1 ) Zumaia No Zumaia No. 4 (-1.4 ) Zumaia No. 5 (-0.9 ) Zumaia No. 6 (-1.2 ) Zumaia ± ± ± ± ± ± ± ± ± ± ± ±
48 Table 2: Tuned ages of chemo-, bio- and magnetostratigraphic events, compared to Husson et al. (2011), Thibault, Husson et al. (2012), the Geologic Time Scale 2004 and 2008 (Gradstein et al., 2004), Cande and Kent (1995), Herbert et al (1995) and Herbert (1992, 1999). Uncertainties in this study are based on the uncertainty in the position of an event, uncertainty in the astronomical target curve (0.023 Myr) and uncertainty in the cyclostratigraphic interpretation (two precessional cycles, Myr). For this study, the age of the base of C29r is based on correlation to Westerhold et al. (2008) (see Supplementary Figure 2). Cycle nr and depth refer to (correlation to) the Zumaia section. 1 Uncertainties for the estimates of the durations (not for the ages) are listed in the original publication. 2 The age of the C30n/C29 reversal was taken from Herbert et al., (1995), the other ages from Herbert (1999). 3 A K/Pg-boundary age of Ma was chosen here for comparison. 4 The duration of chron C30r is uncertain due to a recovery gap. 48
49 Appendix A. Supplementary information Chapter 2 Biostratigraphy All studied samples from the Zumaia, Sopelana and Bidart sections are rich in well preserved planktonic foraminifera. The planktonic species represent more than 90% of all foraminifera, as expected for material deposited in deep facies. About 60 species of planktonic foraminifera can be recognised in the studied assemblages. The lowermost 52m of the logged Maastrichtian succession, before the appearance of Abathomphalus mayaroensis, are included in the Gansserina gansseri biozone. The upper 92m belong to the A. mayaroensis biozone. Some specialists differentiate another biozone in between, which extends from the first occurrence of Contusotruncana contusa until the first occurrence of A. mayaroensis. Additionally, some differentiate a biozone of Plummerita hantkeninoides from its first occurrence up to the K/Pg boundary. Characteristics of the planktonic foraminifera Contusotruncana contusa, Abathomphalus mayaroensis, Racemiguembelina fructicosa and Plummerita hantkeninoides: - Within the four selected species, P. hantkeninoides is the only Maastrichtian species with tubulospines and a surface covered with ridges and costellae. - The name A. mayaroensis refers to those specimens of Abathomphalus that have two muricocarinas in all chambers of the last whorl. - R. fructicosa is considered a species distinct from Racemiguembelina powelli, for having a shorter biseriate development and a larger number of chambers in the final part of the test. - The species C. contusa stands apart from other large species within the genus Contusotruncana, for example C. patelliformis, because it has a higher side spiral and a larger size. 49
50 Characteristics of identified 405-kyr minima and maxima The levels that have been identified as 405-kyr minima share the characteristics of having rather thin, very poorly developed cycles, with minimal difference between the marly and carbonaceous part of the cycles. In between the 405-kyr minima, the cycles are generally more pronounced and bundled in groups of five corresponding to the ~100-kyr periodicity. There are either two or three bundles with darker marls midway between two 405-kyr minima. The 405-kyr minima as identified in the field have been used as starting point for the development of the age model. 50

51 Supplementary Figure 1: Paleomagnetic results: examples of NRM behaviour and equal area projections 51
 and XRF data from Site 1262 and 1267 from the Walvis Ridge, as compiled by Westerhold et al.")
52 Supplementary Figure 2: Correlation of the base of C29r with the magnetic susceptibility and reflectance records from Zumaia (this study) to the carbonate content at Zumaia (ten Kate and Sprenger, 1993) and XRF data from Site 1262 and 1267 from the Walvis Ridge, as compiled by Westerhold et al. (2008). 52
53 Stratigraphic 405 kyr Description level cycle 0 m minimum Cycles 1-3 are lighter and thinner than the underlying cycles. This is consistent with the identification of a 405-kyr minimum at the K/Pg-boundary by Kuiper et al. (*) m maximum The marls, grouped in bundles of five, are darkest and thickest in the middle of these three bundles, and these bundles are most clearly expressed. 16 m minimum The marl of cycle 21, and to a lesser extent the marl of cycle 22, is lighter and thinner than the surrounding marls and form a protruding point of the cliff m maximum The marls, grouped in bundles of five, are darkest and thickest in the middle of these three bundles, and these bundles are most clearly expressed. 32 m minimum The marl of cycle 41 is poorly developed and the limestone of cycle 42 is very prominent, forming a slightly protruding point m maximum The marls, grouped in bundles of five, are darkest and thickest in the middle of these two bundles, and these bundles are most clearly expressed. Just below 41m, the beds are hard to distinguish, coinciding with a probable ~100-kyr minimum. 47 m minimum The individual cycles are very thin and the more resistant part of the cycle is very poorly expressed m maximum The marls, grouped in bundles of five, are darkest and thickest in the middle of these three bundles, and these bundles are most clearly expressed. 61 m minimum The individual beds are thinner and poorly expressed, especially the marlyer beds m maximum The marls, grouped in bundles of five, are darkest and thickest in the middle of these two bundles, and these bundles are most clearly expressed. At 68m there is a double limestone bed with no marl in between, coinciding with a probable ~100-kyr-minimum. 76 m minimum The marl of cycle 94, and to a lesser extent the marl of cycles 93 and 95, is very thin and light compared to the surrounding marls and this level forms the furthest protruding point m maximum The marls, grouped in bundles of five, are darkest and thickest in the middle of these three bundles, and these bundles are most clearly expressed compared to bundles above. At 82m, there is a very thin limestone and a very thin marl, probably coinciding with a probable ~100-kyr minimum. 91 m minimum The marly and less marly layers are hard to distinguish at this level, the marls are not so dark and the less marly layers are very thin and not very resistant m maximum The marls, grouped in bundles of five, are darkest and thickest in the middle of 53
54 these two bundles, and these bundles are most clearly expressed. 111 m minimum The cycles are thin and difficult to identify, because the marls are very poorly expressed, and all beds are very carbonaceous maximum The individual cycles are easier to identify and the marls around 116 are very prominent. 122 m minimum The cycles are thin and difficult to identify here, because the marls are very poorly expressed, and all beds are very carbonaceous m maximum The cycles are very regular and easy to distinguish, with a very prominent marl at 128m. 135 m minimum The marl of cycle 173 is very thin, and the limestones of cycle 173 and 174 very prominent, forming a protruding point into sea m maximum The cycles are very clear and grouped in groups of five, with the darkest marls in these two bundles. Supplementary Table 1: characteristics of the 405-kyr maxima and minima. Minima are used as tie-points for the age model. Underlined levels are particularly welldefined minima. 54
55 Chapter 3. An astronomical time scale for the Maastrichtian at the Zumaia and Sopelana sections (Basque country, northern Spain) Submitted to Earth and Planetary Science Letters In collaboration with: Andrew S. Gale, Mario Sprovieri, Frederik J. Hilgen, Nicolas Thibault, Myriam Boussaha, Xabier Orue-Etxebarria Abstract The rhythmically bedded limestone-marl alternations in the coastal cliffs of Sopelana and Zumaia in the Basque country, northern Spain, provide an excellent opportunity to test and refine existing chronologies for the Maastrichtian (latest Cretaceous). Recently, we established an astronomical time scale for the younger part of the Maastrichtian based on the Zumaia section in northern Spain. Here we present an integrated stratigraphy of the nearby Sopelana section to extend this time scale into C31n, almost to the base of the Maastrichtian. The cyclic alternations of hemipelagic limestones and marls at Sopelana show a strong influence of eccentricity-modulated precession. Together, the Zumaia and Sopelana sections span almost the entire Maastrichtian, and encompass thirteen 405-kyr cycles, spanning a total duration of 5.3 Myr. Consecutive 405-kyr minima in the lithological and geophysical data records are tuned to successive 405-kyr minima in the new La2011 eccentricity solution. Assuming a K/Pg boundary age of Ma, we present orbitally tuned ages of biostratigraphic and magnetostratigraphic events. While the bases of Chrons C29r and C30n have been reliably established at Zumaia and their astronomically tuned ages are in good agreement with previous studies, new data from Sopelana provide a refinement of the age of the base of Chron C31r. Additional planktonic foraminifera and calcareous nannoplankton data from Zumaia, and new calcareous nannoplankton data from Sopelana allow for worldwide correlation and comparison of the cyclostratigraphy of the Basque country. 55
56 1. Introduction 1.1 Maastrichtian chronologies Recently, much progress has been made in improving the temporal resolution of the Maastrichtian time scale by astronomical tuning of cyclic climate records. Originally, Ten Kate and Sprenger (1993) used variations in carbonate content above and below the Cretaceous/Paleogene (K/Pg) boundary at Zumaia to establish a cyclostratigraphic framework, extending ~1.7 Myr down into the Maastrichtian. Later, Herbert et al. (1995) and Herbert (1999) identified the eccentricity modulation of precessional cycles in reflectance records of South Atlantic Deep Sea Drilling Project (DSDP) Sites 357 (Leg 39), 516F (leg 72), 525A, 527 and 528 (Leg 74) to obtain an orbital estimate for the durations of Late Cretaceous magnetochrons C31n-C29r. Husson et al. (2011) produced an astronomical tuning of magnetic susceptibility records from Ocean Drilling Program (ODP) Hole 1258A (Equatorial Atlantic) and Hole 1267B (South Atlantic) and grey level variations from DSDP Site 525 (South Atlantic) and ODP Site 762 (Indian Ocean) and attempted to anchor this tuning to the absolute time scale. Another cyclostratigraphic framework was presented by Thibault et al. (2012b) for ODP Hole 762C based on grey level variations, with an integrated magnetostratigraphy, a bulk-carbonate δ 13 C profile, and planktonic foraminifera and calcareous nannofossil bio-events. A global correlation of carbon isotope curves from Campanian-Maastrichtian successions by Voigt et al. (2012) allows for direct correlation to the Global Stratotype Section and Point of the Campanian-Maastrichtian boundary at Tercis les-bains (France). Recently, a cyclostratigraphic framework for the late Maastrichtian, with magnetostratigraphy, biostratigraphy and a high resolution carbon isotope stratigraphy, has been obtained for the Zumaia section in the Basque country, northern Spain (Batenburg et al., 2012/Chapter 2). This study elaborates on that work by extending the geophysical data records of reflectance and magnetic susceptibility with new data from the lower Maastrichtian Sopelana section. We also include the calcareous nannofossil biostratigraphy for Zumaia of Pérez- 56
57 Rodríguez et al. (2012) and present new calcareous nannofossil data from Sopelana, and additional magnetostratigraphic data. 1.2 Age of the K/Pg boundary Orbitally tuned magneto-, bio- and carbon isotope stratigraphies have recently been established for the Maastrichtian (Batenburg et al., 2012/Chapter 2; Husson et al., 2011; Thibault et al., 2012b), but must to some extent be considered floating. In the ongoing debate about the age of the K/Pg boundary (e.g., (Westerhold et al., 2012), this level has been placed in three successive minima of the 405-kyr eccentricity cycle, following different tuning options. After initial tuning efforts by (1993) and Dinarès-Turell et al. (2003), Kuiper et al. (2008) used an astronomically calibrated age of ± Ma for the Fish Canyon sanidine (FCs) dating standard to recalculate 40 Ar- 39 Ar ages and constrain the tuning on the 405-kyr cycle scale to arrive at a K/Pg boundary age of ~65.95 Ma. A recent intercalibration attempt resulted in a FCs age of ± Ma (Rivera et al., 2011), within the uncertainty of the Kuiper et al. (2008) age. However, Westerhold et al. (2008) combined high resolution XRF and geophysical property records from ODP Sites 1209, 1210, and 1211 (North Pacific;) and Sites 1262 and 1267 (South Atlantic;) with the Paleocene part of the Zumaia section and suggested two main tuning options with ages of ~65.28 or ~65.68 Ma for the K/Pg boundary. Hilgen et al. (2010) reevaluated the Paleocene and Eocene time scale, and with an alternative 405-kyr interpretation arrived at a main tuning option of ~66.0 Ma for the K/Pg-boundary, although not excluding a possible 405-kyr younger tuning. Finally, Westerhold et al. (2012) presented a different astrochronology for the Early Paleogene, using the new La2010 and La2011 orbital solutions, with a K/Pg boundary age of ± 0.06 Ma. In this study, we adopt the 66.0 Ma age, as this is in agreement with the intercalibrated Fish Canyon Sanidine ages of Kuiper et al. (2008) and Rivera et al. (2011), but we do not exclude younger tuning options. 57
58 2. Geological setting and sections The coastal cliffs of Zumaia and Sopelana, along the Bay of Biscay in northern Spain, display rhythmically bedded hemipelagic limestone-marl alternations, deposited in the Basque-Cantabric Basin. From the Campanian to the Eocene, this basin was a deep elongated intra-plate trough, opening to the west into the Bay of Biscay, and surrounded by shallow shelf areas (Mathey, 1988; Pujalte et al., 1998; Rat, 1988). These successions were uplifted in late Eocene times during the Pyrenean orogeny. Major outcrops of Maastrichtian strata are found in the Biscay synclinorium, with the Sopelana section on the eastern flank, and in the Gipuzkoa monocline, with the Zumaia section being the westernmost outcrop (Supplementary figure 1) (Pujalte et al., 1998). 2.1 Zumaia The Zumaia section is located beneath the Punta Aitzgorri Headland near the town of Zumaia, in the Gipuzkoa province of northern Spain. The section is composed of rhythmically bedded deposits of hemipelagic limestones, marls and turbidites of late Cretaceous to Eocene age, and is a classical site for paleoclimatic, magnetostratigraphic, biostratigraphic and cyclostratigraphic studies (Dinarès- Turell et al., 2003; Elorza and García-Garmilla, 1998; Gómez Alday et al., 2008; Herm, 1965; Kuiper et al., 2008; Lamolda, 1990; Percival and Fischer, 1977; Pujalte et al., 1998; ten Kate and Sprenger, 1993; Ward and Kennedy, 1993; Ward et al., 1991) and a reference section for the K/Pg boundary (Molina et al., 2009). The upper Campanian and lower Maastrichtian of the Zumaia section are characterized by a thick turbidite succession, deposited during relatively rapid subsidence, which grades into upper Maastrichtian limestone-marl alternations with intercalated turbidites, deposited during relative tectonic quiescence (Pujalte et al., 1998). The upper Maastrichtian interval was first studied for cyclostratigraphy by Ten Kate and Sprenger (1993). A new cyclostratigraphic framework for the Zumaia section, with additional bio-, magneto-, and chemostratigraphic data, was obtained recently 58
59 (Batenburg et al., 2012/Chapter 2) and is displayed in Figure 2, together with the stratigraphic log of the lower Maastrichtian interval of the Sopelana section. Recently, a high resolution calcareous nannoplankton and planktonic foraminifera stratigraphy was obtained by Pérez-Rodríguez et al. (2012), together with magnetostratigraphic information, which is correlated with our log (Table 1). 2.2 Sopelana The upper Maastrichtian of the Sopelana section in the Vizcaya province of Northern Spain is characterized by a number of large faults, but the lower Maastrichtian is not disturbed and displays a very regular alternation of limestones and marl beds, without the occurrence of turbidites. We refer to the Sopelana 1 section along the Atxabiribil-Arriatera swimming beach, distinguished from the thinner Sopelana 2 section further west (Ward, 1988; Ward et al., 1991). The section was studied for planktonic foraminifera and calcareous nannoplankton by Lamolda et al. (1983). Mary et al. (1991) provided more planktonic foraminifera data and a magnetostratigraphy, and the potential acquisition of a chemical remagnetization signal, particularly by the marl horizons, was discussed by Moreau et al. (1994). The ammonite faunas from Sopelana and the sections of Zumaia, Bidart and Hendaye have been described by Ward and Kennedy (1993). The distribution and shell stable isotope ratios of inoceramids at Sopelana have been studied in detail (Elorza and García-Garmilla, 1998; Gómez-Alday et al., 2004; Gómez Alday et al., 2008). Intervals at Sopelana were included in studies on CaCO 3 and stable isotope variations by Alvarez-Llano et al. (2006), Santander et al. (2007) Domínguez et al. (2007) and Jiménez Berrocoso et al. (2012). The tectonic setting of the Sopelana section has been described by Rodríguez et al. (2008). 59
60 3. Material and methods 3.1 Lithostratigraphy and geophysical properties The Lower Maastrichtian limestone-marl alternations of the Sopelana section were logged and sampled by hammer at a resolution of approximately eight samples per limestone-marl couplet, with an average sampling space of 8 cm. Magnetic susceptibility was measured on the surface of rock fragments in the petrophysical laboratory of the IAMC-CNR in Naples (Italy) with a Bartington MS2E point sensor to measure low-field magnetic susceptibility (MS)(Figs. 3 and 4). As the values were generally low, all samples were measured twice, and each measurement was alternated with blanks. The total light reflectance (L*, in %) of all samples was measured in the same laboratory with a Konica Minolta Spectrophotometer CM 2002 on the surface of the rock fragments (Figs. 3 and 4). All measurements were repeated and directly averaged by the instrument, which records the percentage of reflected energy (RSC) at 31 wavelengths in 10-nm steps, over the visible spectrum from 400 to 700 nm. Cycles 156 to 185 in the Zumaia section have been correlated bed-to-bed to the Sopelana section (Batenburg et al., 2012/Chapter 2) (Fig. 2). The Sopelana and Zumaia datasets were combined at depth level m in cycle 169 located in the lowermost 405-kyr minimum at Zumaia and in the uppermost 405- kyr minimum at Sopelana (see 5.1). 60


61 Figure 1: Overview photograph and stratigraphic log of the Sopelana section, with cycle numbers indicated. See figure 3 for legend. Please note that due to merging of photographs, the distance between promontories, behind the people and behind the concrete reinforcement, is smaller than in reality, while the cliff wall is unaffected. 61
62 3.2 Spectral analysis Spectral analysis of the geophysical data records was performed with Redfit38, which is particularly suited for unevenly spaced paleoclimatic time series (Schulz and Mudelsee, 2002). Wavelet analyses were applied with a Matlab script (Grinsted et al., 2004) and band-pass filters with AnalySeries (Paillard et al., 1996), centred at the periodicities obtained from the Redfit38 analyses, and typically with a broad bandwidth of approximately 1/4 of the periodicity (details in results section). Spectral analyses were performed on the Sopelana data and on the combined Zumaia/Sopelana datasets. 3.3 Astronomical target curve The recently published astronomical solution La2010 pushed the reliability of full eccentricity back to 50 Ma (Laskar et al., 2011a). The new La2011 solutions, adjusted to the INPOP10a ephemeris (Fienga et al., 2011), further extend this reliability to ~54 Ma (Westerhold et al., 2012). Four solutions were generated, with slight differences in the initial positions of the planets and the asteroids, to evaluate the solution s stability. Beyond 60 Ma, Earth s eccentricity cannot be precisely calculated, and only the stable 405-kyr cycle can be used for astronomical tuning (Laskar et al., 2011b). The 405-kyr minima as identified in the succession have been tuned to successive 405-kyr minima filtered from the (nominal) La2011 solution (Laskar et al., 2011b) (bandwidth kyr). 3.4 Biostratigraphy 37 samples from cycles 173 to 251 of the Sopelana section were investigated for calcareous nannofossil biostratigraphy and processed following the procedure described in Thibault et al. (2012b). This results in an average sample resolution of ca 50 kyr for the studied interval, with three additional samples in cycles 157, 159 and 161 (Table 1). Semi-quantitative counts were performed on key and other potential additional stratigraphic markers at a magnification of 1600 ( 100 oil 62
63 objective with a 1.6 additional lens). Preservation of nannofossils ranges from poor (P) to very poor (VP) in the Sopelana section and this affects the overall abundance of identifiable specimens which is generally low. Counts were determined in the following fashion: a species was determined as few (F) if one specimen or more could be observed in every 10 fields of view, rare (R) if, on average, only one specimen could be observed in 11 to 50 fields, very rare (VR) if, on average, only one specimen could be observed in 51 to 100 fields, and single (S) if only one specimen was observed over a total of 200 fields of view. The biozonation of Burnett et al. (1998) was applied. Calcareous nannofossil species considered in this paper followed taxonomic concepts of Perch-Nielsen (1985) and Young and Bown (1997). Bibliographic references for the determined taxa are given in Perch-Nielsen (1985) and Bown (1998). For planktonic foraminifer biostratigraphy, the results reported here are published in Batenburg et al. (2012)/Chapter 2 and Pérez-Rodriguez et al. (2012). 3.5 Magnetostratigraphy Oriented cores for paleomagnetic analyses were taken with a gasoline-powered drill in the topmost and lowermost part of the lower Maastrichtian succession (Fig. 2). From each oriented sample level, one specimen was thermally demagnetized in a magnetically shielded furnace using numerous small temperature increments, at 20, 80, 120, 150, 180, 200, 220, 240, 300, 320, 340 and 360 C. For some samples, the thermal demagnetization was continued up to 550 C. The natural remanent magnetization (NRM) was measured on a 2G Enterprise horizontal cryogenic magnetometer equipped with DC SQUIDS (noise level 3 x Am 2 ) at the Paleomagnetic Laboratory Fort Hoofddijk, the Netherlands. The directions of the NRM components were calculated by principal component analysis (Kirschvink, 1980; Zijderveld, 1967). Mean directions were determined for the individual sections using standard Fisher statistics. The 58 tilt helped to distinguish primary (pre-tilt) from secondary (post-tilt) components and to recognise the present-day field overprint (Dec./Inc.; 359/58). 63


64 Figure 2: Stratigraphic logs of the Zumaia and Sopelana sections with key biostratigraphic events and magnetostratigraphy from this study. Grey roman numerals indicate the intervals identified by Ward et al. (1991) and lilac numbers the units of Wiedmann (1988). The half circles in deep purple indicate the 405-kyr eccentricity minima, the lighter half circles indicate the 100-kyr bundling. White numbers are cycle numbers. 64
65 4. Results 4.1 Lithostratigraphy and geophysical properties In the lower Maastrichtian of the Sopelana section, hemipelagic limestone marl alternations, on a scale of cm per couplet, display variations in the colour and thickness of the marls, albeit less strong than at Zumaia, and variations in the induration and thickness of the limestones. Intervals of distinct variations alternate with poorly expressed limestone-marl couplets, forming bundles of five couplets, and groups of 18 to 20, bounded by particularly poorly expressed marls (Fig. 2). The interval from cycle 212 to 224 has a remarkably constant expression of the limestone-marl couplets and lacks signs of bundling or grouping. A total of 107 couplets has been identified at Sopelana, including three couplets with very poorly expressed marls that have been marked with a and b (Figs. 1 and 2). The magnetic susceptibility record (Fig. 3) displays variations that reflect the alternations in the lithology on the scale of the limestone-marl couplets and on a longer scale of ~19 couplets. Values are relatively low (2.5 to 15.5 SI) and short variations over cm depth are typically around 5 SI. The amplitude of these variations shows a pattern of gradual increase and decrease on a scale of ~12 m. The reflectance record, varying between 47 and 65%, also follows the lithological pattern, and mostly displays gradual variations in average values with some variation in amplitude. Combining the Sopelana and Zumaia datasets at m does not introduce a shift in values; however, the Zumaia datasets show a larger range of variability. 65

 and the filters for magnetic susceptibility are centred at 10.7, 2.4 and 0.")
66 Figure 3: Stratigraphic log of the Sopelana section with total reflectance L* on the left and magnetic susceptibility on the right. The data are flanked by their band-pass filters, wavelet analyses and Redfit power spectra. The band-pass filters of reflectance are centred at 10, 2.9 and 0.62 m (in dark grey, middle grey and light grey, with bandwidths , , m, respectively) and the filters for magnetic susceptibility are centred at 10.7, 2.4 and 0.65 m (in dark red, red and orange, with bandwidths , , and m, respectively). The pink 66
67 bands indicate the stratigraphic levels that are identified as 405-kyr minima, with the black Ma 405 numbers indicating the 405 eccentricity cycles following the nomenclature of Husson et al. (2011). 4.2 Spectral analysis Spectral analysis by Redfit 38 of the magnetic susceptibility record of Sopelana shows main periodicities of 10.7 m and 65 and 54 cm (95% confidence level), 82 cm (90% confidence level) and 2.4 m (80% confidence level). The wavelet analysis displays the presence of the periodicities throughout the section, although especially in the upper two thirds, and shows a temporary shift to slightly shorter periodicities between 156 and 168 m depth, mostly around the 2.4 m periodicity and in the cm periodicity band, indicating slightly lower sedimentation rates, which is in agreement with a decreased thickness of the beds. The 65 cm filtered component (bandwidth cm) shows variations in amplitude on a depth scale of 2 to 3 m, which are also reflected in the 2.4 m filtered component (bandwidth m). The 10.5 m filtered component (bandwidth m) has five minima and four maxima. The combined magnetic susceptibility record (Fig. 4) of Sopelana and Zumaia reveals main periodicities in the Redfit power spectrum of 17 and 12 m (95 % confidence level) and ~72 cm. The wavelet diagram shows that the longer periodicity ~17 m is mostly present in the upper half of the record, down to 110 m in Zumaia, and the 12 m periodicity in the lower half of the record, which coincides with a shift in bedding thickness in Zumaia and the generally thinner bedding at Sopelana. The wavelet spectrum shows the presence of periodicities slightly longer than 72 cm in the upper half of the data, from Zumaia, and slightly shorter than 72 cm in the lower part, from Sopelana. Outputs of band-pass filters, centred at 17 m (bandwidth m) and 12 m (bandwidth m) periodicities, show the presence of 13 cycles throughout the combined datasets. 67

. The bandpass filters of magnetic susceptibility are centred at 17 m (dark red, top), 12 m (pink, base) and at 72 cm (red)(bandwidths of 12-24, 8.8-19 and 0.50-1.")
68 Figure 4: Stratigraphic logs of the Zumaia and Sopelana sections with total reflectance L* on the left and magnetic susceptibility on the right, connected at a depth of m. The data are flanked by their band-pass filters, wavelet analyses and Redfit power spectra. The band-pass filters of reflectance are centred at 16 m (dark grey, top), 12 m (grey-purple, base) and at 72 cm (purple, top), and 49 cm (lilac, base) (bandwidths of 12-29, and m respectively). The bandpass filters of magnetic susceptibility are centred at 17 m (dark red, top), 12 m (pink, base) and at 72 cm (red)(bandwidths of 12-24, and m respectively). The black Ma 405 numbers indicate the 405 eccentricity cycles following the nomenclature of Husson et al. (2011). 68
69 The reflectance record of Sopelana has its main periodicities at 62 cm (99% confidence level), at 10 and 2.9 m and at 85 cm (95% confidence level). The wavelet diagram shows the influence of the 2.9 and 10 m periodicity throughout the section, and the presence of the 2.9 m periodicity mostly in the upper half of the section. The output of the band-pass filtered centred at 10 m (bandwidth m) shows five maxima and minima, and the 62 cm band-pass filtered component (bandwidth cm) shows some bundling on a scale of approximately 3 m. The 2.9 m band-pass filtered component (bandwidth m) shows approximately 17 maxima. Redfit analysis of the reflectance data from the Zumaia and the Sopelana sections combined displays periodicities at 16 and 12 m (95% and 90% confidence level, respectively). The wavelet diagram displays a transitional interval around 110 m, where the main periodicity changes from a 12 m (below) to a 16 m periodicity (upwards). Other important periodicities are around 72 cm and 49 cm, with the 72 cm periodicity mostly visible in the upper half of the wavelet analyses, and the 49 cm periodicity in the lower part of the diagram. This agrees with a change in sedimentation rate at Zumaia and the generally thicker beds at Zumaia compared to Sopelana. The band-pass filtered components centred at 16 (bandwidth m) and 12 m (bandwidth m) display 13 cycles throughout the combined reflectance dataset. 4.3 Calcareous nannofossil biostratigraphy For the part of the section of Zumaia investigated for cyclostratigraphy, we correlated the lithological log of Pérez-Rodriguez et al. (2012) (Table 1) to ours by recognition of the large scale lithological intervals originally defined by Wiedman (1988) and Ward et al. (1991)(Fig. 2). Semiquantitative data are not directly comparable between Pérez-Rodriguez et al. (2012) and this study. Nannofossils were observed at 1250x magnification in Pérez-Rodriguez et al. (2012) and at 1600x here. Among the species considered here, none of them was recorded as common, e.g. corresponding to 1-10 specimens per field of view (fov). The category 69
70 Frequent/Few (F) is estimated in a similar fashion between the two studies, corresponding to 1 specimen per 2 to 20 fov. Pérez-Rodriguez et al. (2012) considered only one subsequent category, rare (R) for 1 specimen per >20 fov whereas in this study, we considered three following categories, rare (R), very rare (VR) and single (S)(Table 1). Although the categories are different, combination of our results with those of Pérez-Rodriguez et al. (2012) highlights the ranges of key biostratigraphic taxa (Table 1). A number of species identified in the lower part of the Zumaia section, which corresponds to the upper part of Sopelana, were not found in this study. Acuturris scotus was found in only one sample, and Arkhangelskiella maastrichtiana and Eiffelithus eximius are absent. The first occurrence (FO) of A. maastrichtiana in Zumaia is was recorded at m (Pérez-Rodríguez et al., 2012) which corresponds to a composite depth of m in our study (Precession cycle number 176, Ma). Nannofossil bio-events such as the last occurrence (LO) of A. scotus, Broinsonia parca constricta, Cribrocorona echinus, Reinhardtites levis, Tranolithus orionatus and Zeugrhabdotus bicrescenticus cannot be compared between the work of Pérez-Rodriguez et al. (2012) and this study because the interval below 145 m at Zumaia (42.2 m in the scale of Perez-Rodriguez et al., (2012) is highly turbiditic, which prevents correlation to Sopelana. Uniplanarius trifidus was not found in Sopelana and those identified for the Zumaia section were considered as highly questionable(pérez-rodríguez et al., 2012). The applied biozonation (Table 1) should be considered here as a tentative interpretation from a record that bears large uncertainties. The top of zones UC17 and UC18 are respectively defined by the last occurrences of T. orionatus and R. levis which both have very inconsistent records across their ranges and when present are at best rare(table 1). 70
71 71
72 72
73 Table 1: Semiquantitative distribution range chart of selected calcareous nannofossil taxa in the Zumaia and Sopelana sections. F, few; R, rare, VR, very rare; S, single (see methods for details). Species having biostratigraphical significance are highlighted in pale grey. Dark grey indicates occurrences interpreted as reworked. Modified from Pérez-Rodriguez et al. (2012) for results on the Zumaia section. 4.4 Magnetostratigraphy The demagnetization data of the lower Maastrichtian at Sopelana are of limited quality, but the resulting magnetostratigraphy is relatively straightforward. In all samples, a randomly oriented viscous component is first removed between 20 and 80 C. Upon further heating a second component is removed, in general up to 200/220 C. The direction of the second component is random in all samples. Heating up to 360 C did not yield reliable directions for all samples as many samples displayed a randomly oriented increase of natural remanent magnetization (NRM) intensity starting from 300 C (Supplementary figure 2). Post-depositional processes might have affected the paleomagnetic signal as has been described by Moreau et al. (1994).When the demagnetization revealed only one component and the NRM intensities at 220 C are extremely high (above 0.2 A/m; similar to suggestions of Moreau et al. (1994), we consider these directions as being related to the process of re-magnetization and therefore unreliable. These samples are mainly from the marly lithology, which agrees with the findings of Moreau et al. (1994). Some samples could be heated up to 550 C (Supplementary figure 2), and the resultant direction of this third component did not differ from the direction yielded between 200/220 and C. Equal area projections (Supplementary figure 2) reveal a slight non-antipodality of the normal and reverse directions, but the data do not pass the reversal test. The slight non-antipodality is most likely related to the weak NRM intensities, which make it difficult to isolate the primary component from an overprint component, related to overlapping blocking temperature of the magnetic carrier. The characteristic remanent magnetization (ChRM) directions of the third component of the logged lower Maastrichtian section (Batenburg et al., 2012/Chapter 2)(Fig. 2)., yielded reverse polarity, from 73
74 cycle , and Above cycle 161, the quality of the demagnetization data is too poor to yield any reliable polarity. New results show that the lowermost part of the section, from cycle 249 to 260, has stable normal polarity, whereas cycle yielded only unreliable and uncertain directions. In particular, the inclination in this interval is too shallow to support a stable normal polarity. 5. Cyclostratigraphy and Astronomical tuning 5.1 Cyclostratigraphy The observed hierarchy of the limestone-marl alternations at both the Zumaia and Sopelana sections, where they are grouped in bundles of five and groups of 18-20, is a strong indication that eccentricity-modulated precession is the underlying cause of the sedimentary cyclicity. Intervals with maximal difference between lithologies, represent the maximal precessional amplitude within eccentricity maxima, which is the same phase relation as inferred by Dinarès-Turell (2003), Kuiper et al. (2008), Westerhold et al. (2008), Hilgen et al. (2010) and Batenburg et al. (2012)/Chapter 2 for the Paleocene and Maastrichtian of the Zumaia section. To obtain an orbitally tuned chronology, only the 405-kyr period of eccentricity provides a stable and reliable tuning target, which would correspond to the ~17 m periodicity in the upper two thirds of the Zumaia section, and the m periodicity in the lower part of the Zumaia section and the whole of the Sopelana section. Time series analyses and lithological observations allow to identify the position of consecutive 405-kyr minima in more detail: Ma 405 9: The position of the topmost 405-kyr minimum, the base of cycle Ma 405 9, can be reliably obtained from correlation to Zumaia from cycle 157 to 185 (Fig. 2, and Batenburg et al., 2012/Chapter 2), and is characterized by two limestone-marl alternations in which the lithologies are very similar, indicating a reduced amplitude of the underlying forcing mechanism. Specifically, the limestones of cycles 173 and 174 are not prominent and the marl in between, of cycle 173, is particularly thin 74
75 and light in colour. Upwards from cycle 171 and downwards from cycle 175, the marls are again darker and thicker. The interval of cycles 172 to175 is characterized by low values of magnetic susceptibility, and a minimum in its 10.7 m filtered component. Ma : Downwards, from cycle 176 to 187, limestones and marls are distinct and cycles are thick, corresponding to a 405-kyr maximum. The interval from cycle 188 to 196 is bounded by marls in which slightly more carbonate rich, but hardly distinguishable, layers occur. These probably represent the very poorly developed limestone-part of a cycle, and have been marked a and b in the log (Fig. 2). These cycles are likely to have been deposited in the ~ 100-kyr minima of eccentricity within a 405-kyr minimum. In the middle of this interval, the marl of cycle 191 is very thin and light in colour and the limestone of cycle 192 is not prominent. This interval is likely to represent the 405-kyr minimum at the base of cycle Ma , which spans 19 cycles and a potential additional cycle marked with a and b. The minimum interpreted from the lithology coincides with low values, decreased variability, and a minimum in the 10.7 m filtered component of magnetic susceptibility. Ma : Cycles 197 to 205 below consist of distinct limestone-marl alternations. Cycle 206 again has a lighter and more resistant level within the marl, marked with a and b, likely to represent a 100-kyr minimum close to a 405-kyr minimum. Cycles 206 and 211 have very poorly developed limestones, which are relatively thin and not prominent. Cycles 207 and 212 have the most prominent limestones in this interval and have the lowest values of magnetic susceptibility. This interval is interpreted as the 405-kyr minimum at the base of Ma , and coincides with a minimum in the 10.7 m filtered component of magnetic susceptibility. Ma : Cycles 212 to 224 display a very regular alternation of relatively thin limestones and marls in which no bundling can be observed. However, values of magnetic susceptibility are high and variations large, indicative of a 405-kyr maximum of eccentricity. The absence of bundling may be the expression of a 75
76 longer term minimum in eccentricity which reduces the amplitude of the ~100 kyr cycles. Downwards, cycles 225 to 233 form the uppermost part of a promontory on the beach. The resistance of the beds likely reflects a slightly higher carbonate content. Some bundling can be observed with a relatively dark marl in cycle 227 and in cycles 230 to 233, bounded by intervals with lighter marls. The limestone of cycle 229 is thin and not prominent, and is bounded by light-coloured marls. The limestone of cycle 230 has very low values of magnetic susceptibility. The interval of cycles 225 to 133 coincides with a minimum in the 10.7 m filtered component of magnetic susceptibility and is likely to span the 405-kyr minimum at the base of cycle Ma Ma : Cycles show distinct limestone-marl alternations with variation in the thickness and colour of the marls. Cycles 234, 238 and 243 in particular have very thin and light-coloured marls, reflecting a bundling of limestone-marl alternations in groups of five. Cycles 245 to 252 form the lowermost part of the promontory on the beach, with relatively little difference among cycles, except in the middle of this interval. The marl of cycle 248 is thin and light, and the bounding limestones of cycles number 248 and 249 are not as prominent as those of neighbouring cycles. The interval coincides with low values of magnetic susceptibility and is interpreted as the 405-kyr minimum of cycle Ma Age model An astronomical age model was constructed by correlating the identified 405-kyr minima in the Sopelana section to successively older minima in the filtered 405-kyr cycle from the new La2011 solution (Laskar et al. 2011b) (band-pass filter centred at 405 kyr, bandwidth from 298 to 615 kyr), linked to the tuning of the 405-kyr cyclicity in the Zumaia section (Batenburg et al., 2012/Chapter 2). Using the astronomical tie-points, time series were generated for the combined Zumaia/Sopelana datasets, on which time series analysis was performed (Supplementary figure 2). The Redfit power spectra of reflectance and magnetic susceptibility, respectively, show dominant periodicities of 415 and 409 kyr, but 76
77 these are likely (partly) introduced by the tuning. Other important periodicities are 23.6 and 22.3 kyr (magnetic susceptibility, 99% confidence level) and 17.9 kyr (reflectance, 95% confidence level). The wavelet diagram shows a relatively constant behaviour of the major periodicities throughout the sections, with potentially some expression of the ~100 kyr periodicity. Ages were assigned to biostratigraphic events based on the 405-kyr tuning, the number of precessional beds between consecutive 405-kyr minima and the position of the event with respect to the precessional cyclicity (Tables 1 and 2). The uncertainty estimate is based on the uncertainty in the position of the event, uncertainty in the correlation, the uncertainty in the cyclostratigraphic interpretation (20.8 kyr) and the astronomical tuning (taken here as 23 kyr, the maximal difference detected between 405-kyr minima in between the variants of the La2011 solutions). 6. Discussion 6.1 Biostratigraphy The succession of calcareous nannofossil and planktic foraminiferal bio-horizons (Fig. 6, Table 2) is similar to other records from low-latitude, tropical sites (Gardin et al., 2012, and references therein; Voigt et al., 2012). Comparison of the ages of bioevents and associated bio-zonal boundaries obtained from cyclostratigraphic studies points to diachronism of nannofossil and planktonic foraminifer events (and biozones) across a wide range of sites (Fig. 7). Among all studies for which biostratigraphic data are available, only two provide ages of calcareous plankton bio-horizons which are calibrated to the most recent late Campanian Maastrichtian time scale (ODP Site 762C, Exmouth Plateau, Indian Ocean, Thibault et al., 2012b, and the Gubbio area, central Italy, Gardin et al., 2012). A slight discrepancy of 0.03 Myr for biostratigraphic events within magnetochron C29r between these studies and our results is accounted for because these authors considered the K-Pg boundary to have an age of 66 Myr instead of the Myr used in our study. 77
78 78
79 79
80 Table 2: Top and Bottom heights (or depths), and estimated ages of significant stratigraphic events recorded in the Zumaia and Sopelana sections compared to the Gubbio area, Italy and the Exmouth Plateau, Indian Ocean. Mag., magnetic reversal boundary; PF, planktic foraminifers; CN, calcareous nannofossils. Reported uncertainties are the sum of the uncertainty in the stratigraphic position (difference in top and bottom height), the uncertainty in the cyclostratigraphic interpretation (taken as two precessional cycles, 43.6 kyr), the uncertainty in the astronomical solution (taken as 23 kyr, the maximal differences in the position of the 405 kyr minima between the La2011 astronomical solutions) and, for the data of Pérez- Rodriguez (2012), an additional uncertainty of one precessional cycle (21.8 kyr) for the correlation. Comparison of our results with the Gubbio area and Site 762C further reinforces diachronism as a major feature of the upper Campanian Maastrichtian interval (Table 2). Of the 13 bio-horizons in common between Zumaia/Sopelana and the Gubbio area, 9 of them point to much younger ages in the Basque country (Table 2). These discrepancies are much above the given ranges of uncertainties and in some cases account for up to 3.6 Myr (FO of Planoglobulina acervulinoides). With respect to the key planktic foraminifer and nannofossil biostratigraphic markers used for biozonation, discrepancies between the Basque country and the Gubbio area vary between a reasonable amount of 136 kyr (FO of Lithraphidites quadratus) and ca 1.5 Myr for the FOs of Racemiguembelina fructicosa and Micula murus (Table 2). Discrepancies between the Basque country and the Indian Ocean are generally even more pronounced (Table 2). Although correlation between Sopelana and Zumaia is imprecise below 145 m, it is possible to propose a linear estimation for the age of the LO of Eiffelithus eximius documented by Pérez-Rodriguez et al. (2012). This estimate points to the largest discrepancy with a very late age of 70.55±0.05 Ma for the Basque country as compared to 73.90±0.05 in the Indian Ocean and 75.60±0.40 in the Gubbio area (Table 2). However, this stratigraphic interval is turbiditic at Zumaia so these specimens of E. eximius may be reworked. Overall, the observed diachronism may result from different sources of error. Different taxonomic concepts and the existence of intermediate evolutionary forms 80
81 in planktonic foraminifers can be, for instance, invoked to explain discrepant ages for the FOs of Abathomphalus mayaroensis, Racemiguembelina fructicosa and Contusotruncana contusa between Pérez-Rodriguez et al. (2012) and our study of the Zumaia and Sopelana sections (Table 2). In this study, such a source of error accounts for less than 500 kyr. Taxonomy is much less problematic for the key nannofossil biostratigraphic markers and is unlikely to account for the observed discrepancy. However, preservation might also play a role, especially for the calcareous nannofossil bio-horizons at Zumaia and Sopelana because the assemblage is generally poorly to very poorly preserved. Nevertheless, it is likely that these discrepancies are partly the result of true migration patterns across latitudes and different oceanic basins, controlled by the high climate variability of the late Campanian Maastrichtian interval. Strongly diachronic succession and ages of late Campanian Maastrichtian calcareous plankton bio-horizons have already been interpreted as the expression of climatically induced migration patterns between Tethyan, Transitional and Austral provinces (Huber and Watkins 1992; Nifuku et al. 2009; Thibault et al. 2010; Thibault et al. 2012b). This potential mechanism must be acknowledged, thoroughly assessed and quantified in the Late Cretaceous because many studies use calcareous plankton biochronology to build their age-models. 6.2 Magnetostratigraphy The upper part of the lower Maastrichtian interval of the Sopelana section has reversed polarity. The magnetic reversal boundary C31r/C31n has been reliably detected slightly higher in the stratigraphy in cycles 152/153 at Zumaia ((Batenburg et al., 2012/Chapter 2; Pérez-Rodríguez et al., 2012). In the lowermost part of the section, normal polarity can be reliably detected, with uncertain polarity from cycles 247 to 249. The whole section was studied previously by Mary et al. (1991), who found reverse polarity until 59 m downwards from the C31r/n boundary, which would correspond approximately to a depth of 181 m, around cycle 245. The samples from the limestones of cycles 247 and 248 may represent reverse polarity, and the reversal is interpreted to be within cycles , although the exact 81
82 position could be slightly higher in the stratigraphy. The reversal has been assigned an age of / Ma (table 2), the uncertainty being based on the uncertainty in the stratigraphic position, in the cyclostratigraphic interpretation, and in the astronomical target curve. The normal polarity in the lowermost part of the section likely represents C32n1n, the short normal polarity interval above the main normal polarity subchron C32n2n, which near its top contains the Campanian/Maastrichtian boundary. The magnetostratigraphy from Zumaia and Sopelana compares well to the recently published chronologies of Husson et al. (2011) and Thibault et al. (2012b)(Figs. 5, 7 and Table 3). The base of C29r, which was obtained by correlation with Westerhold et al. (2008), at ± 0.09 Ma, falls between the ages from these studies, at 66.3 ± 0.07 and Ma, respectively. The total amount of time between the K/Pg boundary and the C31n/C31r reversal as reported by Husson et al. (2011) and Batenburg et al. (2012)/Chapter 2 is identical at 3.22 Myr. The position of C31n/C31r is in the middle of the stratigraphic range established by Pérez- Rodriguez et al. (2012). The total amount of time between the K/Pg boundary and the reversal C31r/C32n1n at Zumaia and Sopelana of 5.26 Myr is slightly less than the 5.4 Myr reported by Husson et al. (2011). The orbital estimate for this timespan by Husson et al. (2011), is based mostly on the grey level variations in Hole 762C, which show a strong presence of the 405-kyr period of eccentricity. However, obliquity cycle variability in the 405-kyr cycle spanning the C31r/C32n1n transition, cycle Ma , seems to obscure the influence of the 100-kyr cycle of eccentricity (Husson et al., 2011), and there is a small uncertainty in the exact stratigraphic position of this transition. These factors may have contributed to a slightly longer estimate of the duration of Chron C31r by Husson et al. (2011)(Fig. 5). 82
.")
 of the grey level data of Hole 525A and Hole 762C, with their ~100 kyr and 405 kyr band-pass filters; the")
83 Figure 5: Comparison of Maastrichtian astrochronologies, with grey bands indicating the identified 405-kyr cycles, numbered Ma 405 1, Ma 405 2,..., from the K/Pg boundary downwards, following Husson et al. (2011). From left to right the cyclostratigraphic interpretation of Husson et al. (2011) of the grey level data of Hole 525A and Hole 762C, with their ~100 kyr and 405 kyr band-pass filters; the cyclostratigraphic framework of Thibault et al. (2012b) of the grey level data of Hole 83
84 762C; the magnetostratigraphy, 16 and 12 m band-pass filters (bandwidths and m) of reflectance, the reflectance data, the stratigraphic column, the magnetic susceptibility data and the 17 and 12 m band-pass filters of magnetic susceptibility (bandwidths of and m) of Zumaia and Sopelana (this study and Batenburg et al., 2012/Chapter 2); the cyclostratigraphic interpretation of the magnetic susceptibility data of Hole 1267B by Husson et al. (2011). Batenburg et al. (2012) Pérez- Rodriguez et This study Thibault et al. (2012b) Husson et al. (2011) Cande & Kent (1995) Herbert (1995 1, 1999) al. (2012) Zumaia Zumaia Sopelana ODP Hole 762C ODP 1267B, 762C, DSDP 525A Magnetic anomaly profiles DSDP 357, 516F, 525A, K/Pg boundary ± ± ± ± Mag.strat. C29r/C30n ± ± ± 21 1 C30n/C30r ± C30r/C31n * ± C31n/C31r ± ± ± C31r/C32n1n ± ± Table 3: Comparison of Maastrichtian magnetostratigraphies. 1 Age of C29r/C30n from Herbert (1995), other boundaries from Herbert et al. (1999); 2 A K/Pg boundary age of Ma was assigned for comparison. 84
85 Figure 6: Cyclostratigraphy and tuned ages of biostratigraphic and magnetostratigraphic events, as obtained in this study, Batenburg et al. (2012)/Chapter 2 and by correlation with Pérez-Rodriguez et al. (2012). 85
86 Figure 7: Maastrichtian time scales with magneto-, bio- and chemostratigraphic events according to Cande and Kent (1995), Herbert et al. (1995), Herbert (1999), option 2 of Husson et al. (2011), Thibault et al. (2012b), Batenburg et al. (2012)/Chapter 2, Pérez-Rodríguez et al. (2012), and the summary of biozones based on correlation of carbon isotope stratigraphies by Voigt et al. (2012), with 1 Bralower et al. (2002); 2 Lees and Bown (2005); 3 Huber (1990); 4 Huber (1992); 5 Pospichal and Wise (1990); 6 Li and Keller (1998); 7 Manivit (1984); 8 Henriksson (1993); 9 Thibault and Gardin (2007); 10 Premoli-Silva and Sliter (1995); 11 Gardin et al. (2012); 12 Monechi and Thierstein (1985); 13 Gardin et al. (2001); 14 Thibault et al. (2012a); 15 Burnett (1990). For Herbert et al. (1995) and Herbert (1999), who only report durations, a K/Pg-boundary age of Ma has been assigned for comparison. 6.3 Orbital pacing The Zumaia section shows strong variability in the expression of the marls, which reflect the amplitude modulation of precession by eccentricity, likely caused by variations in clay supply by run-off (Batenburg et al., 2012/Chapter 2; Mount and Ward, 1986). An enhanced seasonal contrast (on the northern hemisphere) during precession minima at times of eccentricity maxima may have led to an intensified hydrological cycle, leading to deposition of thicker, darker marls. The Zumaia section shows a strong influence of terrigenous input, and was likely closer to the source of clastic sediment than the Sopelana section, which is corroborated by the frequent occurrence of turbidites at Zumaia, and the substantial changes in sedimentation rate. In contrast, the marls in the Sopelana section vary less in expression than at Zumaia, whereas the carbonates vary more strongly in thickness and degree of weathering, displaying the combined influence of variations in productivity and clay input (dilution). As the marls correspond to precessional minima, it is logical to assume that limestones reflect precession maxima. The increased productivity may be due either to an increased input from nutrients through the enhanced hydrological cycle during the preceding precession 86
87 minimum, or to an input of nutrients from eolian dust during periods of a weakened hydrological cycle during precession maxima. Whereas the phase relationship with eccentricity is clear, the phase relation with precession and the proposed climatic mechanism underlying the rhythmic sedimentation requires further testing, for instance through elemental analysis and climate modelling of orbital extremes, using Late Cretaceous boundary conditions. The records are dominated by eccentricity-modulated precession and do not display an evident expression of ~41 kyr obliquity, indicating that regional climate was controlled by lower latitude insolation. A potential influence of a 1.2 Myr cycle can be observed in the upper Maastrichtian of Zumaia and Sopelana, with strong shifts in lithologies from predominantly carbonates to predominantly marls. These shifts, at a ~50 m scale, or approximately 60 cycles apart (counting cycles marked with a and b ), are likely due to changes in relative sea level (Batenburg et al., 2012/Chapter 2). In the lower Maastrichtian of Sopelana, no such shift in lithology can be observed. In cycle 191, which is 60 cycles below the lowermost shift in Zumaia in cycle 132 (counting cycles marked with a and b ), the overall clay and carbonate content of the limestone-marl alternations does not change noticeably. However, the potential influence of a longer-term periodicity might be reflected in the varying strength of the ~100-kyr periodicity through the Sopelana section. A reduced amplitude of the ~100- kyr cycle can be observed in the interval from cycle 212 to 224, ~90 cycles below the lowermost shift in Zumaia. This could be the expression of a long-term eccentricity minimum as the expression of the 100-kyr cycle is minimal in such a minimum because the different ~100-kyr eccentricity components cancel each other out. If the potential 1.2 Myr cyclicity is indeed present throughout the succession, the weakening of the ~100-kyr cycle occurs in the opposite phase of the 1.2 Myr cyclicity as compared to the lithological shifts in the Zumaia section (Batenburg et al., 2012/Chapter 2). Unfortunately, comparison of the expression of this very long period eccentricity cycle with the La2011 eccentricity is not possible as this cycle is not reliable in the solution further back in time than ~54 Ma (Westerhold et al., 2012). 87
88 7. Conclusions In summary, the astronomically tuned time-scale for Zumaia and Sopelana is in good agreement with previously published astronomic time-scales by Herbert (1999), Husson et al. (2011) and Thibault et al. (2012b). Minor refinements include a slightly younger and more tightly constrained age for the C31r/C32n1n chron boundary compared to the astronomically tuned age suggested by Husson et al. (2011), which is used in The Geologic Time Scale 2012 (Ogg and Hinnov, 2012). The astronomical tunings demonstrate that, while the reported durations of magnetostratigraphic chrons are consistent, several biostratigraphic events are not coeval on a global scale, which may be due to true diachroneity, or alternatively to migration patterns and/or misidentification and/or preservational factors. This emphasises the importance of establishing integrated stratigraphies with independent constraints on correlation, which can successfully be achieved by carbon isotope stratigraphy and magnetostratigraphy. The close agreement between astronomical tunings is a confirmation that the Maastrichtian time-scale is now consistent and stable. However, to securely anchor the Mesozoic time-scale further intercalibration with radiometric dating techniques is required to solve the problem of the age of the K/Pg boundary. 88

89 Appendix B. Supplementary information Chapter 2 89


90 90
91 Chapter 4. Orbitally tuned carbon isotope stratigraphy for the Maastrichtian from Zumaia and Sopelana (Basque Country, N-Spain) new insights from global correlation In collaboration with: Silke Voigt, Nicolas Thibault, Mario Sprovieri, Andy Gale, Frits Hilgen Abstract An orbitally tuned bulk carbonate carbon isotope curve is presented from the Maastrichtian Zumaia and Sopelana sections in the Basque country, N-Spain, with a high resolution and a remarkable amplitude of variation. Strong oscillations in δ 13 C seem regularly paced by the 405-kyr periodicity of eccentricity modulated precession. Additionally, sharp negative shifts associated with falls in sea-level occur at regular intervals of ~1.2 Myr. We present a new global correlation of carbon isotope stratigraphies with an astronomically tuned age model based on the cyclostratigraphy of Zumaia and Sopelana and site 762C (Exmouth Plateau). The exclusion of short magnetic polarity chrons from the age model greatly reduces variations in sedimentation rates. The Late Campanian/Maastrichtian carbon isotope correlation scheme allows for a detailed comparison of different paleoenvironmental settings. Although the carbon isotope curves display distinctly different values and intensities of variations, a series of trends and excursions can be observed across the different depositional settings. Notably, the mid- Maastrichtian event is expressed in most records as two positive peaks with maximal δ 13 C values in the Maastrichtian, separated by a pronounced negative excursion, and displaying oscillations on a 405-kyr scale. We propose that the 405- kyr cycle of eccentricity, and potentially longer periodicities, paced the latest Cretaceous carbon cycle. 91
92 1. Introduction Increasingly, carbon isotopes are being used to correlate and date Late Cretaceous successions, and to understand paleoclimatic trends. Carbon isotope stratigraphies are being generated for the late Campanian and Maastrichtian, and used as a reliable correlation tool (Jung et al., 2012; Thibault et al., 2012a, 2012b; Voigt et al., 2012, 2010). Such correlations are a welcome improvement of existing chronologies, as magnetostratigraphic data are only sparsely available for the Campanian and Maastrichtian, and planktonic foraminifera and calcareous nannoplankton are affected by increased provinciality due to ongoing Late Cretaceous cooling (e.g. Thibault et al., 2012b), following the extreme mid- Cretaceous greenhouse warmth (Barrera and Savin, 1999; Clarke and Jenkyns, 1999; Friedrich et al., 2012; Huber et al., 1995; Jenkyns et al., 1994). The gradual cooling was punctuated by a distinct cooling event during the Campanian- Maastrichtian transition (Barrera et al., 1997; Li and Keller, 1998) and periods of intermittent warming (Bralower et al., 2002; Frank and Arthur, 1999; Li and Keller, 1998; Sheldon et al., 2010). To understand the impact of climatic variations on the carbon cycle in the latest Cretaceous, carbon isotope records from different oceanographic settings need to be compared and tied to the astronomically tuned time scale. Here we present a global correlation of the recently established integrated stratigraphy of the Zumaia and Sopelana sections (Basque country, N-Spain) with new d13c data from the Sopelana section. The detailed cyclostratigraphic framework of the Basque sections provides orbitally tuned ages of calcareous nannofossil, planktonic foraminifera and magnetostratigraphic events. The high resolution and remarkable amplitude of δ 13 C variations allows for a detailed comparison with existing carbon isotope stratigraphies. 92
93 2. Geologic setting and sections The Zumaia and Sopelana sections in the Basque country, N-Spain, contain rhythmically bedded hemipelagic limestone-marl alternations of Late Cretaceous to Eocene age. The Zumaia section is a reference section for the Cretaceous/Paleogene (K/Pg) boundary and together, the Sopelana and Zumaia sections span most of the Maastrichtian. Low resolution carbon isotope data have been presented for the upper Maastrichtian and Danian of the Zumaia section (Margolis et al., 1987), and for an interval spanning the lower to upper Maastrichtian transition in Zumaia and Sopelana (Paul and Lamolda, 2007). After cyclostratigraphic efforts around the K/Pg boundary (Ten Kate and Sprenger, 1993) and in the Paleocene (Dinarès-Turell et al., 2003; Kuiper et al., 2008), a cyclostratigraphic framework for the Maastrichtian at Zumaia was obtained recently, with tuned ages for bio- and magnetostratigraphic events (Batenburg et al., 2012/Chapter 2). The astronomical tuning is being extended downwards with new calcareous nannofossil and magnetostratigraphic data from the Sopelana section (Chapter 3). Additional biostratigraphic data for the Zumaia section were obtained from Pérez-Rodríguez et al. (2012). Figure 1: Paleogeographic setting (Gómez Alday et al., 2008), geological map (Pujalte et al., 1998) and schematised stratigraphy after Ward et al (1991). 93
94 3. Methodology For bulk carbonate stable carbon isotope analyses, two samples were selected per couplet, one from the carbonate-rich, and one from the marly part of the cycle, in Zumaia and Sopelana. Additional samples were selected in a resolution of approximately eight samples per cycle for selected intervals of the two sections; between 0 and 6 m, and between 15.5 and 25.7 m in the upper part of the Zumaia section, and in the lower part of the Sopelana section between 174 and m. From the samples, a small amount of powder was obtained with a small handheld 2 mm drill for most samples and for the selected intervals with a micro-mill. The powders were heated to 400 C to remove organic components. Analyses were performed in the geochemistry laboratory at the IAMC-CNR (Naples, Italy) with an automated continuous flow carbonate preparation GasBenchII device and a ThermoElectron Delta Plus XP mass spectrometer. Acidification of samples was performed at 50 C. Samples were calibrated to Vienna Pee Belemnite using an internal standard (Carrara Marble with δ 13 C = 2.43 VPDB) and NBS19. The precision/repeatability of δ 13 C measurements was estimated to be better than All isotope data are reported in per mil ( ) relative to the VPDB standard. Measurements with extremely negative values for δ 13 C were repeated. Five outliers from the Zumaia record outside a 9-point moving average ±2σ were excluded. To identify potential periodicities in the datasets, time series analyses were applied in with the programme Redfit, which is particularly applicable to unevenly-spaced data-sets (Schulz and Mudelsee, 2002). Also, a script for wavelet analysis (Grinsted et al., 2004) was applied in the programme Matlab to examine the datasets, as well as a band-pass filter in the programme AnalySeries (Paillard et al., 1996). 94
95 4. Results A cross-plot of all carbon and oxygen isotope values does not seem to show significant trends or differences amongst the Danian and Maastrichtian data from Zumaia or amongst the Maastrichtian data from Zumaia and Sopelana (Fig 3.). However, cross-plots of the separate intervals may indicate a slight degree of covariance, particularly for the Danian interval. The carbon isotope curve of the Zumaia and Sopelana sections shows an overall decline through the Maastrichtian, with maximum values of 2.2 around 120m, and minimal values around 0.2 below the k/pg boundary (Fig. 4). The record displays marked variability on two depth scales. The lower half of the curve is dominated by a very long variation on a scale of approximately 43m, and the upper half of the curve is strongly dominated by a variability on a scale of ~17 m. Values can vary by as much as one permil over a 43 or a 16 m cycle. The presence of these periodicities is confirmed by the Redfit and wavelet analyses. Figure 2: Cross-plots of bulk carbonate carbon and oxygen isotope data of the lowermost Danian and the Maastrichtian of Zumaia and Sopelana. 95


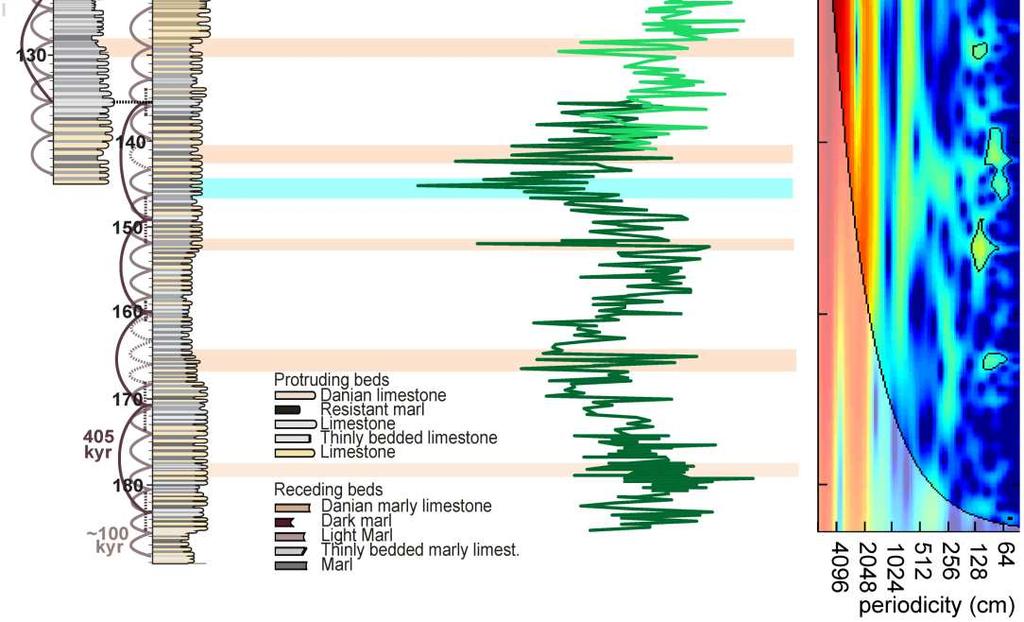
96 power 96
97 Figure 3: Carbon isotope values of the Maastrichtian and lowermost Danian part of the Zumaia and Sopelana sections, with logged limestone marl couplets and cyclostratigraphic interpretation to the left, and Redfit power spectrum and the outcome of wavelet analysis on the right. Pink bands indicate the minima in δ 13 C at a regular pacing of ~17m in Zumaia and ~10 m at Sopelana. Blue bands indicate negative shifts in δ 13 C, which are coincident with lithological shifts in the Zumaia section. The data were plotted on the age model of Batenburg et al. (2012)/Chapter 2 and Chapter 3, which is based on orbital tuning of the lithological variations in Zumaia and Sopelana to the La2011 solution (Fig 4.). A periodicity around 1.1 Myr is present throughout the record, in the wavelet diagram, and a periodicity around 420 kyr mostly in the upper two thirds of the record. A band-pass filter centred at 405 kyr (bandwidth 333 to 623 kyr) allows for comparison with the filtered 405-kyr periodicity from the magnetic susceptibility record (in black). Figure 4 (next page): Magnetostratigraphy, planktonic foraminifera biostratigraphy, calcareous nannoplankton biostratigraphy and carbon isotope stratigraphy from the Zumaia and Sopelana sections in the time domain. The age model is based on the astronomical tuning of the lithology and the geophysical data records (Batenburg et al., 2012/Chapter 2; Chapter 3), of which the band-pass filtered 405-kyr component of magnetic susceptibility is displayed in black. Blue dashed lines indicate the levels of negative shifts on a 1.2 Myr scale, the green line shows the extracted 405-kyr component of the carbon isotope record (bandwidth 333 to 623 kyr). Black Ma 405 numbers indicate the number of 405-kyr cycles from the K/Pg boundary downwards, following Husson et al. (2011). The Redfit power spectrum and wavelet analysis of the combined carbon isotope data of the Zumaia and Sopelana sections are displayed on the right. 97


98 power Figure 4 (for caption see previous page) 98

99 5 Correlation 5.1 Late Campanian/Maastrichtian carbon isotope correlation The carbon isotope profile of the Zumaia and Sopelana sections is correlated to the carbon isotope data of ten Campanian-Maastrichtian successions, following recent correlation efforts by Voigt et al. (2012) and Thibault et al. (2012b). Voigt et al. (2012) presented a detailed and extensive correlation of carbon isotope stratigraphies of Maastrichtian and Late Campanian successions, which has been largely followed here. To avoid large changes in sedimentation rate and discrepancies in magnetostratigraphic datum levels, we have applied less tie-points for correlation (Table 1) and construction of the age-model. The correlation to the Zumaia-Sopelana curve provides a detailed and accurate age-model for the Maastrichtian. For the Late Campanian, and the Campanian-Maastrichtian boundary interval, ages form the astronomical tuning of Husson et al. (2011) were applied, following the approach of Thibault et al (2012b). Figure 5: Paleogeographic map of the early Maastrichtian (70 Ma) with the localities used in this study (after Hay et al., 1999). 99
100 5.2 Correlated sections Trunch borehole and Norfolk coast A Cenomanian-Lowermost Maastrichtian high resolution carbon and oxygen isotope stratigraphy was obtained from the Trunch borehole in north-eastern Norfolk (Jarvis et al., 2006, 2002). The existing carbon isotope stratigraphy of the nearby Norfolk coast cliffs by Jenkyns et al. (Jenkyns et al., 1994) was recently improved and included in a global correlation scheme by Voigt et al. (2012). Belemnites from the Norfolk coast were studied by Schultz (1979), and calcareous nannofossils from the Trunch borehole were reported by Burnett (1990) and updated by Voigt et al. (2012) to reflect the zonation of Burnett et al. (1998). Stevns-1 The Stevns-1 core, drilled off the coastal cliff of Stevns Klimt in Denmark, spans 450 m of chalk from the Upper Campanian to the lower Danian (Stemmerik et al., 2006). Very high resolution carbon isotope data of bulk carbonate were obtained by Schovsbo et al. (2008) and Thibault et al. (2012a), and included in the global correlation scheme of Voigt et al. (2012). The core was studied for nannofossil biostratigraphy by Sheldon et al. (2008), and Thibault et al. (2012a). Tercis An abandoned quarry at Tercis les Bains in south west France, has been proposed as the Global Stratotype Section and Point (GSSP) of the Campanian-Maastrichtian stage boundary (Odin and Lamaurelle, 2001; Odin, 2001) and was ratified in 2002, defined as the arithmetic mean of nine biostratigraphic datum levels. A high resolution bulk carbonate carbon isotope stratigraphy is presented by Voigt et al. (2012), which allows for worldwide correlation of the base of the Maastrichtian stage. Following Voigt et al. (2012), the ammonite stratigraphy was provided by Küchler and Odin (2001), the inoceramid data by Walaszczyk (2002) and the calcareous nannofossil data by Gardin et al, (2001). 100
101 N-Germany The Lägerdorf-Kronsmoor and Hemmoor sections in northern Germany together span the Coniacian to Maastrichtian and form the reference sections for the German white chalk. The Maastrichtian bulk carbonate δ 13 C curve of Hemmoor(Stenvall, 1997), and the Coniacian-lower Maastrichtian bulk carbonate carbon isotope stratigraphy of Lägerdorf-Kronsmoor (Voigt and Schönfeld, 2010) provide a near-continuous record of the last 20 Myr of Cretaceous boreal chalk deposition. Calcareous nannofossil data from Burnett (1990) and macrofossils from Schulz et al. (1984) were assembled in the correlation scheme of Voigt et al. (2012). 1210B An upper Campanian-Maastrichtian high-resolution bulk carbonate carbon-isotope record was obtained from ODP Hole 1210B on Shatsky Rise, in the tropical Pacific (Jung et al., 2012). The distinct variations allow for detailed correlation and comparison of carbon isotope records across the Campanian-Maastrichtian Boundary (Voigt et al., 2012). Planktonic foraminifera were reported by Bralower et al.(2002) and Petrizzo et al.(2011), and calcareous nannoplankton by Lees and Bown (2005). Gubbio The Campanian-Maastrichtian succession of the Bottaccione Gorge and along the Contessa Highway, both near Gubbio, Italy, serve as a reference section for the Tethyan Realm (Gardin et al., 2012). Detailed stratigraphic and magnetostratigraphic studies were performed at Bottaccione by Arthur and Fischer (1977), Lowrie and Alvarez (1977)and Channell et al. (1978) and at Contessa by Lowrie et al. (1982), Chauris et al. (1998) and Gardin et al (2012). Planktonic foraminifera and calcareous nannofossil data were provided by Premoli Silva and Sliter (1995), Monechi and Thierstein (1985) and Gardin et al. (2012). New bulk carbonate δ 13 C data of both sections, and as a composite record for Gubbio, were presented by Voigt et al (2012). 101
102 525A Maastrichtian sediments were recovered from DSDP Hole 525A on the Walvis Ridge in the South Atlantic (Moore and Rabinowitz, 1984), with a planktonic foraminifera biostratigraphy by Li and Keller (1998), calcareous nannoplankton data from Manivit (1984), Henriksson (1993) and Thibault and Gardin (2007), and paleomagnetic data from Chave (1984). Carbon isotope data from benthic foraminifera are provided by Li and Keller (1998) and Friedrich et al. (2009). 690C For the Upper Campanian-Maastrichtian sediments from ODP Hole 690C on Maud Rise in the Weddell Sea (Barker et al., 1990), planktonic foraminfera and calcareous nannoplankton stratigraphies were provided by Barrera and Huber (1990), Huber (1990) and Pospichal and Wise (1990), and magnetostratigraphy by Hamilton (1990). A high resolution carbon isotope stratigraphy was established by Friedrich et al. (2009). 762C DSDP Hole 762C was incorporated in the astronomical tuning of the Maastrichtian by Husson et al. (2011), who refined the original magnetostratigraphy from Galbrun (1992).Recently, the astronomical tuning of 762C was extended and a δ 13 C curve was presented by Thibault et al. (2012b), who correlated it worldwide. This curve was not correlated with tie-points, but plotted on its own age scale based on astronomical tuning by Husson et al. (2011) and Thibault et al. (2012b). A calcareous nannofossil zonation was established by Bralower and Siesser (1992), and refined by Thibault et al. (2012b), and planktonic foraminifera were studied by Wonders (1992) and Zepeda (1998). 102
103 Tie-points 1 K/Pg boundary 2 Prominent δ 13 C minimum close to the base of C29r (tie-point 2 in Voigt et al., 2012) 3 Negative δ 13 C -excursion within C30n, bounded by maxima of Maastrichtian δ 13 C values 4 δ 13 C minimum within C31r, inflection to long-term Maastrichtian δ 13 C rise (tie-point 6 in Voigt et al., 2012) 5 base of δ 13 C maximum near the base of C31r (tie-point 7 in Voigt et al., 2012) 6 δ 13 C minimum near the top of C32n2n (tie-point 8 in Voigt et al., 2012) 7 δ 13 C maximum in C32n2n 8 δ 13 C minimum in C32r1r (tie-point 10 in Voigt et al., 2012) 9 top of pronounced δ 13 C minimum in C33n (tie-point 11 in Voigt et al., 2012) 10 base of δ 13 C minimum in C33n (tie-point 12 in Voigt et al., 2012) Table 1: Description of the tie-points used for carbon isotope correlation 5.3 Age model The age model for the correlation of the data records to the Zumaia-Sopelana record is based on the ages of tie-points 1 to 5, as obtained from orbital tuning of the lithological and geophysical data of the Basque sections to the La2011 astronomical target curve (Batenburg et al., 2012/ Chapter 2; Chapter 3; Laskar et al., 2011b). Below the level of tie-point 5, the data records were correlated to the Gubbio composite curve as presented by Voigt et al. (2012), with ages for selected magnetic reversals, C32n2n/C32n1r, C32r1r/C32n2n, C32r2r/C32r1n, C33n/C32r2r, as determined by Husson et al. (2011). For this interval, ages were obtained by astronomical tuning of geophysical data from ODP hole 762C (Exmouth Plateau, Indian Ocean), for which new δ 13 C data, an extended astronomical tuning and a global correlation were recently presented by Thibault et al. (2012b). The duration between the base of C29r and the Cretaceous/Paleogene boundary of 0.34 ± 0.09 Myr at Zumaia, as obtained through correlation with IODP Sites 1262 and 1267 (Westerhold et al., 2008), is in good agreement with the duration of 0.3 ± 0.02 Myr obtained by astronomical tuning of IODP Hole 1267B by Husson et al (2011) and the duration of ± 0.22 Myr by tuning of ODP Hole 762C (Thibault 103
104 et al., 2012b). Also, the duration between C31r/C31n and the K/Pg boundary is in good agreement between Zumaia-Sopelana, at 3.22 Myr, and the tuning of Husson et al. (2011), with a duration of 3.22 Myr, based on geophysical data of IODP Hole 1267B and DSDP Hole 525A. However, there are discrepancies in the ages and positions of several magnetic reversals amongst sites. C30r was not reliably identified at Zumaia (Batenburg et al., 2012/Chapter 2) and appears much higher in the stratigraphy at the Bottaccione and Contessa sections, of which the composite, Gubbio, is considered a reference section for the Tethyan realm (Gardin et al., 2012). The base of C31r is found to be slightly younger, at Ma, in the astronomical tuning of Zumaia and Sopelana (Chapter 3) than in the tuning of Husson et al (2011), at 71.4 Ma. Also, the ratio of the thickness of C32n1n and C32n1r seems different at Gubbio (Gardin et al., 2012) than at 762C (Thibault et al., 2012b), and C32r1n seems relatively thick at 762 (Thibault et al., 2012b) compared with Gubbio (Gardin et al., 2012). For this reason, these reversals were not incorporated in the age model for the tie-points used in this correlation. 5.4 Biostratigraphy For the mid- to upper-maastrichtian, the exclusion of Chron C30r in Gubbio from the age model, leads to changes in the length of biozones of Stevns-1, N-Germany, 525A and Gubbio as compared to Voigt et al. (2012). These changes have affected these records in similar ways, most notably by shifting ages of mid-maastrichtian bio-events to younger values. Originally, a comparison of ages of bio-events with Zumaia and Sopelana to the compilation of Voigt et al. (2012), showed that, of the thirteen bio-events identified at Zumaia-Sopelana and Gubbio, nine were considerably younger in the Basque sections (Chapter 3). With the alternative agemodel presented here, the ages of biostratigraphic events between tie-points 2 and 4 change for the correlated sections of Stevns-1, N-Germany, 1210B and Gubbio. For the Gubbio section, new calculates ages are presented in table 2. The ages indicate a slightly better agreement between Zumaia-Sopelana and Gubbio in the calcareous nannofossil and planktonic foraminifera biozonations. However, as the 104
105 age models of Stevns-1, N-Germany and 1210B change similarly, existing diachroneity between these sites remains. For a detailed review of the biostratigraphic events in the Late Campanian and around the Campanian-Maastrichtian boundary, we refer to Voigt et al. (2012) and Thibault et al. (2012b), as our age-model and correlation have not caused substantial changes in the ages of biozones for these intervals. Average age and uncertainty (Myr) Planktic foraminifer and calcareous nannofossil events Basque country (Chapter 3) Gubbio area (Gardin et al., 2012) 762C, Indian Ocean (Thibault et al., 2012) FO Plummerita hantkeninoides (PF) ± ± FO Abathomphalus mayaroensis (PF) ± ± ±0.150 FO Racemiguembelina fructicosa (PF) ± ± ±0.220 FO Planoglobulina acervulinoides (PF) ± ± ±0.080 FO Contusotruncana contusa (PF) ± ± ±0.220 FO Micula prinsii (CN) ± ± ±0.070 FO Micula murus (CN) ± ± ±0.070 FO Lithraphidites quadratus (CN) ± ± ±0.060 LO Reinhardtites levis (CN) ± ± ±0.150 LO Tranolithus orionatus (CN) ± ± ±0.070 LO Broinsonia parca constricta (CN) ± ± ±0.100 LO Eiffelithus eximius (CN) ± ±0.090 Table 2: Ages of planktic foraminifer and calcareous nannofossil events for the Basque country (Batenburg et al., in prep.), Gubbio (Gardin et al., 2012) and 762C (Thibault et al, 2012b) with adjusted ages for Gubbio based on the presented global carbon isotope correlation. 105


106 106
107 Fig 6: Correlation of the bulk carbonate δ 13 C records from the European successions of: the Norfolk coast (Voigt et al., 2012) and the Trunch borehole (Jarvis et al., 2002; Jenkyns et al., 1994) in the United Kingdom; Zumaia (Batenburg et al., 2012) and Sopelana (this study) in the Basque country, N-Spain; the Stevns-1 borehole in Denmark (Thibault et al., 2012a); Tercis, SW France (Voigt et al., 2012); Lägerdorf, Kronsmoor and Hemmoor, N-Germany (Voigt et al., 2010); and Gubbio, Italy (Voigt et al., 2012). Grey areas indicate the carbon isotope events as identified by Voigt et al. (2012): the late Campanian Event (LCE), the Campanian-Maastrichtian Boundary Event (CMBE), the mid-maastrichtian Event (MME) and the Cretaceous/Paleogene Event (KPgE). Pink bands indicate the carbon isotope minima identified approximately every 405-kyr in the Zumaia-Sopelana record. Similarly, the blue dashed lines pinpoint the negative shift on a 1.2 Myr scale. Dashed lines with numbers indicate the tie-points used for correlation. The age model is based on the tuning of the Zumaia-Sopelana record (Batenburg et al., 2012; in prep) and selected paleomagnetic reversals at Gubbio (see text) as identified by Arthur and Fischer (1977) and Gardin et al. (2012), with astronomically tuned ages from Husson et al. (2011). Planktonic foraminifera and calcareous annofssil data for Zumaia and Sopelana are from Batenburg et al. (2012; in prep) and Peréz-Rodríguez et al. (2012).For Gubbio, planktonic foraminifera data were provided by Gardin et al. (2012), Premoli-Silva and Sliter (1995), and calcareous nannofossil data by Gardin et al. (2012) and Monechi and Thierstein (1985). The belemnite zonation of the Norfolk coast section is from Schulz (1979) and the nannofossil zones for the Trunch borehole are from Burnett (1990). For Stevns-1, nannofossil data are from Thibault et al. (2012a). Ammonite data for Tercis are from Küchler and Odin (2001), inoceramid data are from Walaszczyk et al. (2002), and nannofossils from Gardin et al. (2001). Nannofossil data from N-Germany are provided by Burnett et al. (1990), and the macrofossil zonation is from Schulz et al. (1984). 107


108 108
Supplementary Information
 Supplementary Information This file contains six supplementary figures, additional references, and extended description of methods used and discussion on (1) magnetobiostratigraphy, (2) magnetic susceptibility
Seismic stratigraphy, some examples from Indian Ocean, interpretation of reflection data in interactive mode
 Seismic stratigraphy, some examples from Indian Ocean, interpretation of reflection data in interactive mode K. S. Krishna National Institute of Oceanography, Dona Paula, Goa-403 004. krishna@nio.org Seismic
Climate of the Past Discussions
 Climate of the Past Discussions Reply to Interactive comment of Anonymous Referee #2 on Orbitally tuned time scale and astronomical forcing in the middle Eocene to early Oligocene by T. Westerhold, U.
Middle Eocene western north Atlantic biostratigraphy and environmental conditions
 Shari Hilding-Kronforst Shari Hilding-Kronforst is currently a Ph.D. candidate at Texas A&M University. Born in Illinois, she received a microscope at age 8 and dinosaur models at age 9. She completed
Time scale controversy: Accurate orbital calibration of the early Paleogene
 Article Volume 13, Number 6 23 June 2012 Q06015, doi:10.1029/2012gc004096 ISSN: 1525-2027 Time scale controversy: Accurate orbital calibration of the early Paleogene Thomas Westerhold and Ursula Röhl MARUM
Section 7. Reading the Geologic History of Your Community. What Do You See? Think About It. Investigate. Learning Outcomes
 Chapter 3 Minerals, Rocks, and Structures Section 7 Reading the Geologic History of Your Community What Do You See? Learning Outcomes In this section, you will Goals Text Learning Outcomes In this section,
Evaluator: Eric Pyle James Madison University
 Building Core Knowledge Reconstructing Earth History Transforming Undergraduate Instruction by Bringing Ocean Drilling Science on Earth History and Global Climate Change into the Classroom This NSF-funded,
Late Maastrichtian carbon isotope stratigraphy and cyclostratigraphy of the Newfoundland Margin (Site U1403, IODP Leg 342)
") Newsletters on Stratigraphy PrePub Article Published online August 217 Late Maastrichtian carbon isotope stratigraphy and cyclostratigraphy of the Newfoundland Margin (Site U143, IODP Leg 342) Sietske
Newsletters on Stratigraphy PrePub Article Published online August 217 Late Maastrichtian carbon isotope stratigraphy and cyclostratigraphy of the Newfoundland Margin (Site U143, IODP Leg 342) Sietske
lecture 12 Paleoclimate
 lecture 12 Paleoclimate OVERVIEW OF EARTH S CLIMATIC HISTORY Geologic time scales http://www.snowballearth.org/index.html Features of the climate during the Cretaceous period the land-sea distribution
Geosciences Faculty Articles
 University of Wisconsin Milwaukee UWM Digital Commons Geosciences Faculty Articles Geosciences 1-1-2007 On the duration of magnetochrons C24r and C25n and the timing of early Eocene global warming events:
SUPPLEMENTARY INFORMATION
 SUPPLEMENTARY INFORMATION Supplementary Figures Supplementary Figure S1 Late Permian paleogeography. (a) Late Permian (~260 Ma) global paleogeography showing the location of South China (base map is from
The Cretaceous-Paleogene boundary and its 405-kyr eccentricity cycle phase: a new constraint on radiometric dating and astrochronology
 The Cretaceous-Paleogene boundary and its 405-kyr eccentricity cycle phase: a new constraint on radiometric dating and astrochronology Michel HENNEBERT 1 Abstract: Radiometric dating and astrochronologic
Late Cretaceous biostratigraphy and adaptive radiation of the calcareous nannofossil genus Eiffellithus
 Ms Jamie Shamrock was born in Pennsylvania; she has earned already a B.A. in anthropology and a B.Sc. in geology. Ms. Shamrock is now going for her Master s degree at the University of Nebraska-Lincoln.
Ice Ages and Changes in Earth s Orbit. Topic Outline
 Ice Ages and Changes in Earth s Orbit Topic Outline Introduction to the Quaternary Oxygen isotopes as an indicator of ice volume Temporal variations in ice volume Periodic changes in Earth s orbit Relationship
Orbital climate forcing of δ 13 C excursions in the late Paleocene early Eocene (Chrons C24n C25n)
") PALEOCEANOGRAPHY, VOL.???, XXXX, DOI:10.109/00PA000909, Orbital climate forcing of δ 1 C excursions in the late Paleocene early Eocene (Chrons C4n C5n) Benjamin S. Cramer 1, James D. Wright, Dennis V.
PALEOCEANOGRAPHY, VOL.???, XXXX, DOI:10.109/00PA000909, Orbital climate forcing of δ 1 C excursions in the late Paleocene early Eocene (Chrons C4n C5n) Benjamin S. Cramer 1, James D. Wright, Dennis V.
Beckenanalyse 2. Genetische stratigraphische Konzepte
 Beckenanalyse 2. Genetische stratigraphische Konzepte Einsele 2000 CYCLIC BEDDING Einsele 2000 1 Sequenzstratigraphie Das Konzept der Sequenzstratigraphie beruht auf dem Zusammenspiel von Sedimentzufuhr
CYCLOSTRATIGRAPHY. a review. Alessandro Grippo, PhD
 CYCLOSTRATIGRAPHY a review Alessandro Grippo, PhD What is Cyclostra9graphy? Cyclostra8graphy is the study of the sedimentary record produced by clima8c cycles of regular frequency generated by varia8ons
Sierro F.J. 1, Ledesma S. 2 and Flores J.A. 1
 Astrobiochronology of Late Neogene deposits near the Strait of Gibraltar (SW Spain). Implications for the tectonic control of the Messinian Salinity Crisis. Sierro F.J. 1, Ledesma S. 2 and Flores J.A.
Lower Maastrichtian cyclostratigraphy of the Bidart section (Basque Country, SW France): A remarkable record of precessional forcing
: A remarkable record of precessional forcing") Lower Maastrichtian cyclostratigraphy of the Bidart section (Basque Country, SW France): A remarkable record of precessional forcing Dorothée Husson, Nicoilas Thibault, Bruno Galbrun, Silvia Gardin, Fabrice
Lower Maastrichtian cyclostratigraphy of the Bidart section (Basque Country, SW France): A remarkable record of precessional forcing Dorothée Husson, Nicoilas Thibault, Bruno Galbrun, Silvia Gardin, Fabrice
35. MAGNETIZATION OF VARICOLORED PELAGIC LIMESTONES FROM HOLES 544A AND 547B 1. J. E. T. Channell, Department of Geology, University of Florida 2
 35. MAGNETIZATION OF VARICOLORED PELAGIC LIMESTONES FROM HOLES 544A AND 547B 1 J. E. T. Channell, Department of Geology, University of Florida 2 ABSTRACT Jurassic limestones from Holes 544A and 547B were
An astronomical polarity timescale for the late middle Miocene based on cyclic continental sequences
 JOURNAL OF GEOPHYSICAL RESEARCH, VOL. 108, NO. B3, 2159, doi:10.1029/2002jb001818, 2003 An astronomical polarity timescale for the late middle Miocene based on cyclic continental sequences H. Abdul Aziz,
Table DR1. Radioisotope ages used to establish astrochronology of the Piobbico core. (1993)
") GSA DATA REPOSITORY 212 Supplementary File: Astronomical tuning of the Aptian Stage from Italian reference sections Chunju Huang, Linda Hinnov, Alfred G. Fischer, Alessandro Grippo, Timothy Herbert Table
GSA DATA REPOSITORY 212 Supplementary File: Astronomical tuning of the Aptian Stage from Italian reference sections Chunju Huang, Linda Hinnov, Alfred G. Fischer, Alessandro Grippo, Timothy Herbert Table
Accuracy of dating methods utilised
 Dating Methods Homke et al. (2009) measured and dated more than 1500 m of stratigraphy in the Amiran anticline, and emphasised the need for multiple dating methods given the lithologic and sedimentary
27. MAGNETOSTRATIGRAPHY OF THE CRETACEOUS/TERTIARY GEOLOGICAL BOUNDARY1
 27. MAGNETOSTRATIGRAPHY OF THE CRETACEOUS/TERTIARY GEOLOGICAL BOUNDARY1 Nikolai Petersen, Institut für Allgemeine und Angewandte Geophysik, Universitát München, Theresienstr. 41, D-8000 Munich, Federal
Development of the Global Environment
 Development of the Global Environment G302: Spring 2004 A course focused on exploration of changes in the Earth system through geological history Simon C. Brassell Geological Sciences simon@indiana.edu
Climate and Environment
 Climate and Environment Oxygen Isotope Fractionation and Measuring Ancient Temperatures Oxygen Isotope Ratio Cycles Oxygen isotope ratio cycles are cyclical variations in the ratio of the mass of oxygen
17. CARBONATE SEDIMENTARY ROCKS FROM THE WESTERN PACIFIC: LEG 7, DEEP SEA DRILLING PROJECT
 17. CARBONATE SEDIMENTARY ROCKS FROM THE WESTERN PACIFIC: LEG 7, DEEP SEA DRILLING PROJECT Ralph Moberly, Jr., Hawaii Institute of Geophysics, University of Hawaii, Honolulu, Hawaii and G. Ross Heath,
21. PALEOMAGNETISM OF THE CRETACEOUS/TERTIARY BOUNDARY, DEEP SEA DRILLING PROJECT LEG 77, SOUTHEASTERN GULF OF MEXICO 1
 21. PALEOMAGNETISM OF THE CRETACEOUS/TERTIARY BOUNDARY, DEEP SEA DRILLING PROJECT LEG 77, SOUTHEASTERN GULF OF MEXICO 1 Margaret M. Testarmata, Institute for Geophysics, University of Texas, Austin, Texas
17. MAGNETOSTRATIGRAPHY OF EQUATORIAL PACIFIC SITE 503 HYDRAULIC PISTON CORES 1
 17. MAGNETOSTRATIGRAPHY OF EQUATORIAL PACIFIC SITE 503 HYDRAULIC PISTON CORES 1 Dennis V. Kent and Dann J. Spariosu, Lamont-Doherty Geological Observatory and Department of Geological Sciences, Columbia
IODP EXPEDITION 306: NORTH ATLANTIC CLIMATE II SITE U1314 SUMMARY
 IODP EXPEDITION 306: NORTH ATLANTIC CLIMATE II SITE U1314 SUMMARY Hole U1314A Latitude: 56 21.883'N, Longitude: 27 53.309'W Hole U1314B Latitude: 56 21.896'N, Longitude: 27 53.311'W Hole U1314C Latitude:
Earth and Planetary Science Letters
 Earth and Planetary Science Letters 325 326 (2012) 100 107 Contents lists available at SciVerse ScienceDirect Earth and Planetary Science Letters journal homepage: www.elsevier.com/locate/epsl To tune
THE TENDENCY OF CLIMATE CHANGE OVER THE PAST SEVERAL MILLIONS OF YEARS AND THE CURRENT INTERGLACIAL DURATION. V.A. Dergachev
 THE TENDENCY OF CLIMATE CHANGE OVER THE PAST SEVERAL MILLIONS OF YEARS AND THE CURRENT INTERGLACIAL DURATION V.A. Dergachev Ioffe Physical-Technical Institute, St. Petersburg, 194021, Russia, e-mail: v.dergachev@mail.ioffe.ru
Chapter 15 Millennial Oscillations in Climate
 Chapter 15 Millennial Oscillations in Climate This chapter includes millennial oscillations during glaciations, millennial oscillations during the last 8000 years, causes of millennial-scale oscillations,
3. DATA REPORT: OXYGEN AND CARBON ISOTOPES FROM SITE 1146, NORTHERN SOUTH CHINA SEA 1
 Prell, W.L., Wang, P., Blum, P., Rea, D.K., and Clemens, S.C. (Eds.) Proceedings of the Ocean Drilling Program, Scientific Results Volume 8. DATA REPORT: OXYGEN AND CARBON ISOTOPES FROM SITE 6, NORTHERN
Lecture 18 Paleoceanography 2
 Lecture 18 Paleoceanography 2 May 26, 2010 Trend and Events Climatic evolution in Tertiary Overall drop of sea level General cooling (Figure 9-11) High latitude (deep-water) feature Two major step Middle
Geologic Time. Decoding the Age of our Planet & North Carolina
 Geologic Time Decoding the Age of our Planet & North Carolina The Geologic Time Scale Objectives Describe the geologic time scale. Distinguish among the following geologic time scale divisions: eon, era,
Glacial-Interglacial Cycling: Ice, orbital theory, and climate. Dr. Tracy M. Quan IMCS
 Glacial-Interglacial Cycling: Ice, orbital theory, and climate Dr. Tracy M. Quan IMCS quan@marine.rutgers.edu Outline -The past - discovery of glacial periods - introduction of orbital theory -The present
Supplement to. Synchronizing early Eocene deep-sea and continental records new cyclostratigraphic age models from the Bighorn Basin Coring Project
 Supplement to Synchronizing early Eocene deep-sea and continental records new cyclostratigraphic age models from the Bighorn Basin Coring Project Thomas Westerhold 1, Ursula Röhl 1, Roy Wilkens 2, Phil
Depositional Sequences Sequences
 Depositional Sequences Transgressive and Regressive packages can be bound by unconformities Because sediment can only be preserved during net aggradation and progradation All other times there is either
Stacked 2.6-Ma grain size record from the Chinese loess based on five sections and correlation with the deep-sea D 18 O record
 PALEOCEANOGRAPHY, VOL. 17, NO. 3, 1033. 10.1029/2001PA000725, 2002 Stacked 2.6-Ma grain size record from the Chinese loess based on five sections and correlation with the deep-sea D 18 O record Z. L. Ding,
Paleoceanography II Telluric Effects on Oceanography
 Paleoceanography II Telluric Effects on Oceanography Geological Oceanography OCN 622 Gary McMurtry Telluric Effects Tellus = Earth Distribution of Continents at 100 Ma BP and Present Comparison of Earth
Resilience of Pacific pelagic fish across the Cretaceous/Palaeogene mass extinction
 SUPPLEMENTARY INFORMATION DOI: 10.1038/NGEO2227 Resilience of Pacific pelagic fish across the Cretaceous/Palaeogene mass extinction Elizabeth C Sibert 1*, Pincelli M Hull 2, and Richard D Norris 1 1 Scripps
IMA. Celestial Influences on Glacial Cycles. Math and Climate Seminar
 Math and Climate Seminar IMA Celestial Influences on Richard McGehee Joint MCRN/IMA Math and Climate Seminar Tuesdays 11:15 1:5 streaming video available at www.ima.umn.edu Seminar on the Mathematics of
- 5 - Figure 2. A. Location map for the Cibao Valley, northern Dominican Republic with generalized geology and major features (Erikson et al., 1998).
.") Diana Ortega-Ariza is a PhD student at the University of Kansas. Her dissertation work proposes to develop absolute age-constrained sequence stratigraphic frameworks and construct rock-based quantitative
Diana Ortega-Ariza is a PhD student at the University of Kansas. Her dissertation work proposes to develop absolute age-constrained sequence stratigraphic frameworks and construct rock-based quantitative
GSA DATA REPOSITORY
 GSA DATA REPOSITORY 2013086 Cosentino et al. Figure DR1. Astronomical tuning (La2004 precession index) of the Maiella composite section (Sampalmieri et al., 2010) and the Morgia 1 borehole (re-drawn from
Last Time. Submarine Canyons and Fans. Turbidites. MAS 603: Geological Oceanography. Lecture 16: Greenhouse vs. Icehouse Earths
 UNIVERSITY OF SOUTH ALABAMA Last Time MAS 603: Geological Oceanography Lecture 16: Greenhouse vs. Icehouse Earths Submarine Fans Definition and morphology Transport mechanisms (density currents) Submarine
PETROLEUM GEOSCIENCES GEOLOGY OR GEOPHYSICS MAJOR
 PETROLEUM GEOSCIENCES GEOLOGY OR GEOPHYSICS MAJOR APPLIED GRADUATE STUDIES Geology Geophysics GEO1 Introduction to the petroleum geosciences GEO2 Seismic methods GEO3 Multi-scale geological analysis GEO4
Variations in the Earth's Orbit: Pacemaker of the Ice Ages
 Variations in the Earth's Orbit: Pacemaker of the Ice Ages For 500,000 years, major climatic changes have followed variations in obliquity and precession. J. D. Hays, John Imbrie, N. J. Shackleton Science,
Recent Climate History - The Instrumental Era.
 2002 Recent Climate History - The Instrumental Era. Figure 1. Reconstructed surface temperature record. Strong warming in the first and late part of the century. El Ninos and major volcanic eruptions are
Supporting Information: Orbital Forcing of the Paleocene and Eocene Carbon Cycle
 Supporting Information: Orbital Forcing of the Paleocene and Eocene Carbon Cycle Richard E. Zeebe 1,, Thomas Westerhold 2, Kate Littler 3, and James C. Zachos 4 Corresponding Author. 1 School of Ocean
Field guide to the Cretaceous strata of the Santander area, Spain
 ESCUELA INTERNACIONAL DE ASTROBIOLOGÍA INTERNATIONAL ASTROBIOLOGY SUMMER SCHOOL Origins of the Building Blocks for Life Field guide to the Cretaceous strata of the Santander area, Spain Bruce Runnegar
Natural Climate Variability: Longer Term
 Natural Climate Variability: Longer Term Natural Climate Change Today: Natural Climate Change-2: Ice Ages, and Deep Time Geologic Time Scale background: Need a system for talking about unimaginable lengths
Newsletters on Stratigraphy, Vol. 49/2 (2016), Published online February 2016; published in print April 2016
, Published online February 2016; published in print April 2016") Newsletters on Stratigraphy, Vol. 49/2 (2016), 383 400 Published online February 2016; published in print April 2016 Article Astronomically tuned age model for the early Eocene carbon isotope events: A
Newsletters on Stratigraphy, Vol. 49/2 (2016), 383 400 Published online February 2016; published in print April 2016 Article Astronomically tuned age model for the early Eocene carbon isotope events: A
Joides Resolution at Hong-Kong
 Report from Iván Hernández-Almeida, post-doc at the Oeschger Centre for Climate Change Research/Institute of Geography, University of Bern. Shipboard Micropaleontologist (radiolarian specialist) on IODP
Deep time records showcase: Earth Systems
 What is Deep Time? Most geoscientists view Deep Time as pertaining to the pre- Quaternary (>10ka [10 4 ]) Last 10ka witnessed a short duration under anomalous conditions of an Icehouse climate state Earth
PLEASE DO NOT WRITE ON THIS QUIZ! Relative Dating and Stratigraphic Principles Quiz
 PLEASE DO NOT WRITE ON THIS QUIZ! Relative Dating and Stratigraphic Principles Quiz TEST NO A Multiple Choice Identify the letter of the choice that best completes the statement or answers the question.
Sequence Stratigraphy as a tool for water resources management in alluvial coastal aquifers: application to the Llobregat delta (Barcelona, Spain)
") Sequence Stratigraphy as a tool for water resources management in alluvial coastal aquifers: application to the Llobregat delta (Barcelona, Spain) Desiré Gàmez Torrent December 2007 CHAPTER 1: Introduction
Sequence Stratigraphy as a tool for water resources management in alluvial coastal aquifers: application to the Llobregat delta (Barcelona, Spain) Desiré Gàmez Torrent December 2007 CHAPTER 1: Introduction
Astronomical ages for Miocene polarity chrons C4Ar C5r ( Ma), and for three excursion chrons within C5n.2n
, and for three excursion chrons within C5n.2n") Earth and Planetary Science Letters 256 (2007) 455 465 www.elsevier.com/locate/epsl Astronomical ages for Miocene polarity chrons C4Ar C5r (9.3 11.2 Ma), and for three excursion chrons within C5n.2n Helen
Earth and Planetary Science Letters 256 (2007) 455 465 www.elsevier.com/locate/epsl Astronomical ages for Miocene polarity chrons C4Ar C5r (9.3 11.2 Ma), and for three excursion chrons within C5n.2n Helen
IODP Proposal Cover Sheet 914 -
 IODP Proposal Cover Sheet 914 - Full Brazilian Equatorial Margin Paleoceanography Received for: 2017-04-03 Title Cenozoic Paleoceanography of the Brazilian Equatorial Margin (PBEM) Proponents Luigi Jovane,
Stratigraphy. The part of geology that deals with the formation, composition, sequence, and correlation of rocks, especially stratified rocks
 Stratigraphy The part of geology that deals with the formation, composition, sequence, and correlation of rocks, especially stratified rocks Limestone Sandstone Shale 1 Stratigraphy The part of geology
Supporting Online Material for
 www.sciencemag.org/cgi/content/full/329/5990/428/dc1 Supporting Online Material for Calcareous Nannoplankton Response to Surface-Water Acidification Around Oceanic Anoxic Event 1a Elisabetta Erba,* Cinzia
Astronomically tuned magnetocyclostratigraphy of late Burdigalian marine sediments at Monte Cardeto, Ancona, Italy. By: T. E.
 Astronomically tuned magnetocyclostratigraphy of late Burdigalian marine sediments at Monte Cardeto, Ancona, Italy By: T. E. Van Peer Supervisor: Dr. S.K. Hüsing Co-supervisors: Dr. F.J. Hilgen Prof. Dr.
A non-marine record of eccentricity forcing through the Upper Triassic of. southwest England and its correlation with the Newark Basin APTS from North
 Kemp, p.1 A non-marine record of eccentricity forcing through the Upper Triassic of southwest England and its correlation with the Newark Basin APTS from North America David B. Kemp and Angela L. Coe 1.
SUPPLEMENTARY INFORMATION Peeters et al. (2004). Vigorous exchange between Atlantic and Indian Ocean at the end of the last five glacial periods
. Vigorous exchange between Atlantic and Indian Ocean at the end of the last five glacial periods") Peeters et al. (24). Vigorous exchange between Atlantic and Indian Ocean splice level Depth (cm) 1 2 depth GeoB-363-2 (cm) depth MD-96-281 (cm) 1 2 3 4 SPECMAP AGE (kyr) Figure S1 (Supplementary Figure
Peeters et al. (24). Vigorous exchange between Atlantic and Indian Ocean splice level Depth (cm) 1 2 depth GeoB-363-2 (cm) depth MD-96-281 (cm) 1 2 3 4 SPECMAP AGE (kyr) Figure S1 (Supplementary Figure
Controls on clastic systems in the Angoche basin, Mozambique: tectonics, contourites and petroleum systems
 P2-2-13 Controls on clastic systems in the Angoche basin, Mozambique: tectonics, contourites and petroleum systems Eva Hollebeek, Olivia Osicki, Duplo Kornpihl Schlumberger, London, UK Introduction Offshore
Marine Oxygen Isotopes and Changes in Global Ice Volume
 Marine Oxygen Isotopes and Changes in Global Ice Volume Name: You have learned about the value of marine oxygen-isotope records for understanding changes in ocean-water temperature and global ice volume
Supplementary Figure S1: Separated benthic 18 O data over 5 Myr. (a) Benthic LR04 benthic 18 O stack 16 ( ) in black with seawater 18 O ( w ) in blue
 Benthic LR04 benthic 18 O stack 16 ( ) in black with seawater 18 O ( w ) in blue") Supplementary Figure S1: Separated benthic 18 O data over 5 Myr. (a) Benthic LR04 benthic 18 O stack 16 ( ) in black with seawater 18 O ( w ) in blue and temperature contribution ( T ) in green. (b) Surface-air
Supplementary Figure S1: Separated benthic 18 O data over 5 Myr. (a) Benthic LR04 benthic 18 O stack 16 ( ) in black with seawater 18 O ( w ) in blue and temperature contribution ( T ) in green. (b) Surface-air
Lecture 10 Constructing the geological timescale
 Lecture 10 Constructing the geological timescale Geologic Time Discovering the magnitude of the Earth s past was a momentous development in the history of humanity This discovery forever altered our perception
Math /29/2014. Richard McGehee, University of Minnesota 1. Math 5490 September 29, Glacial Cycles
 Math 9 September 29, 21 Topics in Applied Mathematics: Introduction to the Mathematics of Climate Mondays and Wednesdays 2: : http://www.math.umn.edu/~mcgehee/teaching/math9-21-2fall/ Streaming video is
Geologic Time. Geologic Events
 Geologic Time Much of geology is focused on understanding Earth's history. The physical characteristics of rocks and minerals offer clues to the processes and conditions on and within Earth in the past.
Practice Questions: Plate Tectonics
 Practice Questions: Plate Tectonics 1. Base your answer to the following question on The block diagram below shows the boundary between two tectonic plates. Which type of plate boundary is shown? A) divergent
Is the Troodos ophiolite (Cyprus) a complete, transform. fault bounded Neotethyan ridge segment?
 a complete, transform. fault bounded Neotethyan ridge segment?") GSA Data Repository DR1 Is the Troodos ophiolite (Cyprus) a complete, transform fault bounded Neotethyan ridge segment? Antony Morris and Marco Maffione Data Repository methods 1.1. Paleomagnetic analysis
GSA Data Repository DR1 Is the Troodos ophiolite (Cyprus) a complete, transform fault bounded Neotethyan ridge segment? Antony Morris and Marco Maffione Data Repository methods 1.1. Paleomagnetic analysis
6. What has been the most effective erosive agent in the climate system? a. Water b. Ice c. Wind
 Multiple Choice. 1. Heinrich Events a. Show increased abundance of warm-water species of planktic foraminifera b. Show greater intensity since the last deglaciation c. Show increased accumulation of ice-rafted
Age Dating and the Oceans
 Age Dating and the Oceans 1. Age dating of geologic materials reveals (a) the age of the Earth, and (b) how long oceans have been on Earth. 2. Relative dating of fossils from the seafloor allows us to
B13 SSS2.5/GM6.10/HS8.3.7/SSP3.1.20
 SSP Stratigraphy, Sedimentology & Palaeontology Orals Monday, 28 April MO1, 08:30 10:00 MO2, 10:30 12:00 MO3, 13:30 15:00 MO4, 15:30 17:00 TU1, 08:30 10:00 TU2, 10:30 12:00 GM1.7, Non-continuous palaeoenvironmental
Lecture #13 notes, Geology 3950 Spring 2006: CR Stern Magnetic reversals (text pages th edition and in the 5 th edition)
") Lecture #13 notes, Geology 3950 Spring 2006: CR Stern Magnetic reversals (text pages 35-37 4 th edition and 53-55 in the 5 th edition) The earth has a magnetic field generated by circulation of charged
Lecture #13 notes, Geology 3950 Spring 2006: CR Stern Magnetic reversals (text pages 35-37 4 th edition and 53-55 in the 5 th edition) The earth has a magnetic field generated by circulation of charged
Tropical Ocean Temperatures Over the Past 3.5 Million Years
 www.sciencemag.org/cgi/content/full/328/5985/1530/dc1 Supporting Online Material for Tropical Ocean Temperatures Over the Past 3.5 Million Years Timothy D. Herbert, Laura Cleaveland Peterson, Kira T. Lawrence,
Fig Available seismic reflection, refraction, and magnetic profiles from 107 the Offshore Indus Basin close to the representative profile GCDH,
 List of Figures Page No. Fig. 1.1 Generalized physiography of the Indian Ocean along with 2 selected (200 m, 1000 m, 2000 m, and 3000 m) bathymetric contours. Fig. 1.2 Lithospheric plates in the Indian
8. Climate changes Short-term regional variations
 8. Climate changes 8.1. Short-term regional variations By short-term climate changes, we refer here to changes occurring over years to decades. Over this timescale, climate is influenced by interactions
Geology of the Hawaiian Islands
 Geology of the Hawaiian Islands Class 12 19 February 2004 A B C D F 97 94 92 91 88 87 86 85 85 84 82 77 73 73 mean 66 64 60 69 60 57 51 29 Exam Scores Mean = 71 Median = 82/77 Any Questions? Sedimentary
APPLICATION OF DYNAMIC PROGRAMMING TO THE DATING OF A LOESS-PALEOSOL SEQUENCE
 Romanian Reports in Physics, Vol. 60, No. 1, P. 157 171, 2008 APPLICATION OF DYNAMIC PROGRAMMING TO THE DATING OF A LOESS-PALEOSOL SEQUENCE C. NECULA, C. PANAIOTU University of Bucharest, Faculty of Physics,
0.5cm Eocene Foram
 Eocene Foram 0.5cm Eocene Foram Bubbles in ice 5 µm Tree rings Tree rings Reconstructing past climate Talk outline: A trip through geologic time Take away points: Climate change through time What past
Chapter 4 Implications of paleoceanography and paleoclimate
 Age ka / Chapter 4 Implications of paleoceanography and paleoclimate 4.1 Paleoclimate expression 4.2 Implications of paleocirculation and tectonics 4.3 Paleoenvironmental reconstruction MD05-2901 (Liu
Lake Levels and Climate Change in Maine and Eastern North America during the last 12,000 years
 Maine Geologic Facts and Localities December, 2000 Lake Levels and Climate Change in Maine and Eastern North America during the last 12,000 years Text by Robert A. Johnston, Department of Agriculture,
Palaeozoic oceanic crust preserved beneath the eastern Mediterranean
 Palaeozoic oceanic crust preserved beneath the eastern Mediterranean Roi Granot Magnetic Anomaly Data Total field Three components 75 m 75 m Total field 250 m Overhauser Three-axial fluxgate Overhauser
Biostratigraphic and Lithostratigraphic Correlation of Sedimentary Strata in the Atlantic Coastal Plain
 Biostratigraphic and Lithostratigraphic Correlation of Sedimentary Strata in the Atlantic Coastal Plain Introduction to the Atlantic Coastal Plain (Please read this page prior to doing the lab) The Atlantic
Revised reservoir model for the Paleocene mounds of the Utsira High, North Sea, Norway John Wild (1) & Nowell Briedis (2)
 & Nowell Briedis (2)") Revised reservoir model for the Paleocene mounds of the Utsira High, North Sea, Norway John Wild (1) & Nowell Briedis (2) (1) Mobil North Sea LLC (2) Esso Exploration & Production Norway A/S (ExxonMobil
Revised reservoir model for the Paleocene mounds of the Utsira High, North Sea, Norway John Wild (1) & Nowell Briedis (2) (1) Mobil North Sea LLC (2) Esso Exploration & Production Norway A/S (ExxonMobil
Stratigraphy and Geologic Time. How old are the rocks?
 Stratigraphy and Geologic Time How old are the rocks? 1 Questions What is the difference between Absolute and Relative dating? How old is the Earth? How can we use fossils to date rocks? How are the absolute
Earth and Planetary Science Letters
 Earth and Planetary Science Letters 290 (2010) 192 200 Contents lists available at ScienceDirect Earth and Planetary Science Letters journal homepage: www.elsevier.com/locate/epsl Orbital chronology of
Depositional Environments. Depositional Environments
 Depositional Environments Geographic area in which sediment is deposited Characterized by a combination of geological process & environmental conditions Depositional Environments Geological processes:
Unit 6: Interpreting Earth s History
 Unit 6: Interpreting Earth s History How do we know that the Earth has changed over time? Regent s Earth Science Name: Topics Relative Dating Uniformitarianism Superposition Original Horizontality Igneous
SOLAR FORCING. Variations in Solar Emissivity
 SOLAR FORCING Solar forcing is the hypothesis that variations in solar emissivity can bring about global climate changes. This hypothesis is undeniable in principle, since virtually all of the Earth s
A.K. Khanna*, A.K. Verma, R.Dasgupta, & B.R.Bharali, Oil India Limited, Duliajan.
 P-92 Application of Spectral Decomposition for identification of Channel Sand Body in OIL s operational area in Upper Assam Shelf Basin, India - A Case study A.K. Khanna*, A.K. Verma, R.Dasgupta, & B.R.Bharali,
Cyclostratigraphy and eccentricity tuning of the early Oligocene. through early Miocene ( Ma): Cibicides mundulus stable
: Cibicides mundulus stable") Cyclostratigraphy and eccentricity tuning of the early Oligocene through early Miocene (30.1 17.1 Ma): Cibicides mundulus stable oxygen and carbon isotope records from Walvis Ridge Site 1264 Diederik Liebrand
Cyclostratigraphy and eccentricity tuning of the early Oligocene through early Miocene (30.1 17.1 Ma): Cibicides mundulus stable oxygen and carbon isotope records from Walvis Ridge Site 1264 Diederik Liebrand
Seismic Inversion on 3D Data of Bassein Field, India
 5th Conference & Exposition on Petroleum Geophysics, Hyderabad-2004, India PP 526-532 Seismic Inversion on 3D Data of Bassein Field, India K.Sridhar, A.A.K.Sundaram, V.B.G.Tilak & Shyam Mohan Institute
Sedimentary Rocks, Stratigraphy, and Geologic Time
 Sedimentary Rocks, Stratigraphy, and Geologic Time A rock is any naturally formed, nonliving, coherent aggregate mass of solid matter that constitutes part of a planet, asteroid, moon, or other planetary
PALEOCEANOGRAPHY, VOL. 19, PA3010, doi: /2003pa000997, 2004
 PALEOCEANOGRAPHY, VOL. 19,, doi:10.1029/2003pa000997, 2004 Revised tuning of Ocean Drilling Program Site 964 and KC01B (Mediterranean) and implications for the D 18 O, tephra, calcareous nannofossil, and
Onset of the Mid-Miocene Climatic Optimum: inferences from stable isotopes on benthic foraminifera at ODP Site 1264 in the southern Atlantic
 Onset of the Mid-Miocene Climatic Optimum: inferences from stable isotopes on benthic foraminifera at ODP Site 1264 in the southern Atlantic April, 2013 Master thesis project Mischa Saes Supervisors Lucas
Accommodation. Tectonics (local to regional) Subsidence Uplift
 Subsidence Uplift") Accommodation Accommodation varies over time; it is the distance between a reference horizon and the sea surface (i.e. relative sea level). The space to be filled in with sediments or water What are the
Accommodation Accommodation varies over time; it is the distance between a reference horizon and the sea surface (i.e. relative sea level). The space to be filled in with sediments or water What are the
P. S. Basak, Ravi Kant, K. Yasodha, T. Mukherjee, P. Rajanarayana, Sucheta Dotiwala, V. K. Baid, P.H. Rao, V. Vairavan, ONGC
 P-483 Summary Delineation of pinch-outs within Panna Formation of Paleocene-Early Eocene sequence in and around South Mumbai Low to Identify Prospective Areas - A Case Study P. S. Basak, Ravi Kant, K.