Source parameters of the great Sumatran megathrust earthquakes of 1797 and 1833 inferred from coral microatolls
|
|
|
- Alison Cain
- 6 years ago
- Views:
Transcription
1 Source parameters of the great Sumatran megathrust earthquakes of 1797 and 1833 inferred from coral microatolls Danny Hilman Natawidjaja, 1 Kerry Sieh, 1 Mohamed Chlieh, 1 John Galetzka, 1 Bambang W. Suwargadi, 2 Hai Cheng 3, R. Lawrence Edwards, 3 Jean-Philippe Avouac, 1 and Steven N. Ward 4 Revision of 14 February Tectonics Observatory, California Institute of Technology 2 Research Center for Geotechnology, Indonesian Institute of Sciences 3 Department of Geology and Geophysics, University of Minnesota 4 Institute of Geophysics and Planetary Physics, University of California Santa Cruz
2 ABSTRACT Large uplifts and tilts occurred on the Sumatran outer-arc islands between 0.5 and 3.3 S during great historical earthquakes in 1797 and 1833, as judged from relative sealevel changes recorded by annually banded coral heads. Coral data for these two earthquakes are most complete along a 160-km length of the Mentawai islands between 3.2 and 2 S. Uplift there was as great as 0.8 m in 1797 and 2.8 meters in Uplift in 1797 extended 370 km, between 3.2 and 0.5 S. The pattern and magnitude of uplift imply megathrust ruptures corresponding to moment magnitudes (M w ) in the range 8.5 to 8.7. The region of uplift in 1833 ranges from 2 to at least 3.2 S and, judging from historical reports of shaking and tsunamis, perhaps as far as 5 S. The patterns and magnitude of uplift and tilt in 1833 are similar to those experienced farther north, between 0.5 and 3 N, during the giant Nias-Simeulue megathrust earthquake of 2005 the outer-arc islands rose as much as 3 meters and tilted toward the mainland. Elastic dislocation forward modeling of the coral data yield megathrust ruptures with moment magnitudes ranging from 8.6 to 8.9. Sparse accounts at Padang, along the mainland west coast at latitude 1 S, imply tsunami runups of at least 5 m in 1797, and 3 to 4 meters in Tsunamis simulated from the pattern of coral uplift is roughly consistent with these reports. The tsunami modeling further indicates that the Indian Ocean tsunamis of both 1797 and 1833, unlike that of 2004, were directed mainly south of the Indian subcontinent. Between about 0.7 and 2.1 S, the lack of vintage 1797 and 1833 coral heads in the intertidal zone demonstrates that interseismic submergence has now nearly equaled coseismic emergence that accompanied those earthquakes. The interseismic 2
3 strains accumulated along this reach of the megathrust have thus approached or exceeded the levels relieved in 1797 and INDEX TERMS: Paleoseismology (7221), Subduction zone processes (8176), Indian Ocean (9340), Subduction zones (7240), Isotopic disequilibrium dating (1120) INTRODUCTION Background Rupture of adjoining and 300-km sections of the Sunda megathrust in December 2004 and March 2005 generated two devastating great earthquakes and large tsunamis (Figure 1) (Subarya et al. [2006]; Briggs et al. [2006]). These rapid-fire failures of a long span of the megathrust raise the question: Are unbroken sections to the north and south now close to failure? [Nalbant et al., 2005; Sieh, 2005] One critical part of assessing whether or not they are close to failure is the investigation of the past behavior of each section of the megathrust. How have currently dormant sections failed in the past? Where have prior ruptures occured, how large have they been, and how often and regularly do they recur? Most of the Sunda megathrust along the eastern margin of the Indian Ocean has generated large, destructive earthquakes in the past few centuries of historical record. North of the 2004 rupture, along the west coast of Myanmar, historical details are sparse, but Chhibber [1934] describes a large earthquake accompanied by uplift of coral reefs in In addition, strains now accumulating across the Indoburman ranges in western 3
4 Myanmar can be ascribed in part to loading of an obliquely slipping Sunda megathrust [Vigny et al., 2003]. The Sumatran section of the megathrust also has a history of destructive large earthquakes (summarized by Newcomb and McCann [1987]), and geodetic measurements show that strain accumulates there in a manner consistent with most of the megathrust being locked [Prawirodirdjo et al., 1997; Chlieh, et al., 2005]. Although the 2004 Aceh- Andaman earthquake is without known precedent, a large earthquake with a magnitude and source area similar to the 2005 Nias-Simeulue earthquake occurred in 1861 (Figure 1) [Newcomb and McCann, 1987; Wichmann, 1918]. A smaller rupture in the region in 1907 produced a higher and more destructive tsunami on the western coast of Simeulue than occurred in 2004 or 2005 [Newcomb and McCann, 1987; Briggs et al, 2006]. This may mean that large slips occured on the shallow section of the megathrust between the island and the trench. Near the Equator, a narrow, 70-km long section of the megathrust produced an M w 7.7 earthquake in 1935 [Natawidjaja et al., 2004; Rivera et al., 2002]. The largest historical Sumatran earthquake originated south of the Equator in 1833 [Newcomb and McCann, 1987]. Reports of severest shaking are from Bengkulu to Pariaman and at sea near the Pagai islands (Figure 2; Appendix 1). Tsunamis along that same stretch of the coast were destructive, especially at Indrapura and Bengkulu, and subsequent minor activity occurred at three nearby Sumatran volcanoes. The tsunami height at the coast of Padang is reported to have been 3-4 meters. The extent of severest effects coupled with seismotectonic considerations led Newcomb and McCann [1987] to conclude that the rupture extended about 550 km, from near Enggano island in the south to the Batu islands in the north. Based upon this extent, they calculated the size of the 4
5 earthquake to be between M w 8.7 and 8.8. Studies of uplifted coral on the fringing reefs of Sipora, North Pagai and South Pagai islands show that at least a 140-km length of the megathrust beneath these islands participated in the 1833 rupture [Zachariasen et al., 1999]. The elastic dislocation model that fit their coral uplift data best had 13 meters of slip on the underlying megathrust. This corresponds to an M w 8.8, if slip occurred only under these islands, but an M w 9.2 if rupture extended the full 550 km proposed by Newcomb and McCann [1987]. A previous large earthquake, in 1797, was accompanied by a destructive tsunami at Padang (Newcomb and McCann [1987]; Appendix 1). The only reports of shaking and tsunami damage are from Padang and nearby, which suggests that Bengkulu, which was also a bustling settlement at the time, was not greatly affected. The shaking is reported to have been the strongest in living memory at Padang, and the tsunami flow depth there was likely at least 5 meters. In this paper we use coral stratigraphy to build upon the investigations of Zachariasen et al. [1999] to constrain further the source parameters of the great 1833 earthquake. In the process, we also produce evidence for the source of the 1797 earthquake and show that it was larger than previously thought [Newcomb and McCann, 1987]. Coral microatolls as recorders of paleogeodetic vertical deformation Coral "microatolls" provide an exceptional opportunity to understand tectonic strain accumulation and relief. They are so named [Krempf, 1927; Scoffin and Stoddart, 1978] because those with raised rims and low centers resemble the celebrated island atolls that form on slowly submerging tropical oceanic crust [Darwin, 1842]. Several species of the 5
6 genera Porites and Goniastrea produce this form when they grow near lowest low tide levels on submerging coastlines. Microatoll morphologies form because the upward growth of corals heads is limited by lowest tide levels, above which exposure causes death. This uppermost limit to coral growth is called the HLS, an acronym for the highest level of survival [Taylor et al., 1987]. Fluctuations in HLS are imprinted on the morphology and stratigraphy of microatolls that have grown up to the level of lowest low tide, as described and illustrated in Appendix 2 and at A year s coral growth typically produces a pair of bands, one dark and one light, that reflect seasonal variations in the density of the coral skeleton caused by seasonal variations in sea temperature, rainfall, and other factors [Knutson et al., 1972; Scoffin and Stoddart, 1978; Taylor et al., 1987; Zachariasen et al., 1999]. The light, lower density Field Code Changed Formatted: French (France) Formatted: French (France) band grows during the rainy season (September to March), and the dark, higher-density band forms during the dry season (April to August) [Zachariasen, 1998]. The annual band is similar to a tree ring in that it provides a yearly record of growth. Taken together a series of annual bands thus provides a time-series for constructing a sea-level history. The annual bands are sometimes visible to the naked eye, but are more pronounced in x- radiographs of thin slabs that have been cut parallel to the direction of coral growth. As stable, long-lived, natural recorders of both slow and abrupt change in sea level relative to their substrate, with sensitivities of about 20 mm, living microatolls are natural paleogeodetic gauges that enable examination of relative sea-level time-series in places and over times not covered by instrumental recordings (Zachariasen et al. [2000], Sieh et 6
7 al. [1999]). Moreover, advances in U-Th disequilibrium geochronology since the mid- 1980s allow dating of annual growth bands in fossil microatolls with uncertainties of only a few years to a few decades, so rates and dates of vertical motions can be constrained tightly [Edwards et al., 1988; Taylor et al., 1990; Zachariasen et al., 1999; Shen et al., 2002; Cobb et al., 2003; Natawidjaja et al., 2004]. In the case of western Sumatra, one also has historical evidence that allows association of specific events in a dated coral microatoll to historical earthquakes. Two attributes of western Sumatra make its populations of microatolls particularly well suited for studying the cyclic accumulation and relief of tectonic strains. First, the Sumatran part of the Sunda subduction zone is one of only a few subduction margins with an abundance of coastline above the locked parts of the subduction megathrust. These coastlines range from 70 to 150 km landward of the trench axis and about from about 20 to 35 km above the megathrust. Second, the region s late Holocene vertical motions are predominantly elastic deformations associated with the cyclic accumulation and relief of strain. Thoughout the region, the presence of mid-holocene microatolls near sea level shows that permanent tectonic deformations have been comparatively slight over the past several thousand years [Zachariasen, 1998]. Methods Mapping, collecting, sample preparation and analysis At sites where we wanted to establish HLS time-series, we mapped the intertidal reef, documented the height, shape and dimensions of many of the coral heads, and collected 7
8 slab samples from the heads that were representative of the overall population. Use of a hand-held GPS receiver with an accuracy of 10 m or better and an electronic total station with accuracy of a few millimeters provided control for both coarse and detailed mapping. A hydraulic chainsaw designed for underwater use enabled collection of vertically oriented ~150-mm wide slabs from the microatoll. We surveyed the elevations of the upper surfaces of the sampled microatolls prior to cutting and the removal of the slabs, to enable recovery of a vertical datum and its relationship to sea level and other samples after removal of the slab. Usually we were able to sample from sites where our slabs represented a larger population of coral heads displaying a similar history. We avoided collecting from microatolls whose HLS history might not reflect open-ocean sea level [Scoffin and Stoddart, 1978]. Whenever possible we collected samples from microatolls that were unaffected by local tilting or subsidence. Such disturbances are easily recognizable, either by visual inspection in the field or by anomalous elevations relative to other heads at the site. Preparation and analysis of the samples Subsequent to collection, we used a large circular saw to cut a thinner section, typically about 10 mm thick, from each slab. X-radiographs of these sections reveal details of growth that are otherwise invisible to the eye. We then used scans of the X- radiographs to produce stratigraphic sections that depict the annual banding of the microatoll. 8
9 Radiometric dating of the microatolls After collection in the field but before cutting into thin slabs, we used a hand-held diamond-impregnated hole drill to remove 5-mm-diameter cores for U-Th dating. The dating was performed at the University of Minnesota. For each analysis, we selected and dissolved samples weighing about 350 mg. Procedures for analysis were modifications of those originally described by Edwards et al. [1987]. Cheng et al. [2000] describes standards and spikes, and Shen et al. [2002] describe mass spectrometric analysis. Each dissolved sample was spiked with a mix of 233 U, 236 U, and 229 Th. Purified uranium and thorium fractions were separated using iron hydroxide precipitation and anion exchange techniques. These fractions were dissolved in dilute nitric acid and their isotopic compositions determined by aspirating solutions through a desolvation nebulizer (MCN 6000 from Cetac Technologies) and measuring ion beam ratios on a magnetic sector inductively coupled plasma mass spectrometer (Thermo-Finnigan Element) operated in peak-jumping and pulse-counting modes using a guard electrode. Table 1 and Table S 1 display the results of these measurements. Tectonics and seismic history of the active Sumatran plate boundary Convergence of the Australian and Indian plates toward southeast Asia is highly oblique at the latitudes of Sumatra (Figure 1). The obliquity is almost completely partitioned into a frontal dip-slip component, accommodated by slip on the subduction megathrust and a right-lateral strike-slip component, accommodated by the Sumatran fault [Fitch, 1972; Katili and Hehuwat, 1967; McCaffrey, 1991]. 9
10 Five great or giant earthquakes dominate strain relief along the subduction megathrust during the period of historical record: In addition to the Aceh-Andaman M w 9.15 earthquake of 2004 [Subarya et al., 2006] and the Nias-Simeulue M w 8.6 earthquake of 2005 [Briggs et al., 2006], M w ~9 and M w ~8.5 earthquakes occurred in 1833 and in 1861, respectively [Newcomb and McCann, 1987](Figure 1). In this paper, we show that an earthquake in 1797 also belongs in this group of great earthquakes. Smaller large megathrust earthquakes have occurred at the termini of these great and giant earthquakes, as well (Figure 1). An M w 7.3 event [DeShon, et al., 2005] occurred at the join between the 2004 and 2005 ruptures in A short length of the megathrust near the Equator produced an M w 7.7 earthquake in Microatoll records show that the earthquake resulted from about 2.3 m of slip on a 35-km wide, 70-km long patch of the megathrust between the Equator and about 0.7 S [Rivera et al., 2002; Natawidjaja et al., 2004]. Microatolls also show that this has been the largest rapid slippage on this part of the megathrust over the past 250 years and that most slip on this patch has been occurring aseismically for at least the past half-century. Thus this section of the megathrust separates the sections to the south and north that generate great and giant earthquakes, perhaps not unlike the separation of locked sections of the San Andreas fault by its 170-km-long, central creeping reach [Allen, 1968]. The second important smaller earthquake is an M w 7.9 event that occurred near Enganno island in 2000, near what was inferred from historical accounts of shaking and tsunamis and a concentration of background seismicity [Newcomb and McCann, 1987] to be the end of the 1833 rupture. Abercrombie et al. [2003] found the 2000 earthquake to 10
11 be complex. It involved sequential rupture of a left-lateral north-striking strike-slip fault within the down-going oceanic slab and then rupture of the megathrust. The strike-slip structure may be one of a set of similar structures between the Investigator fracture zone and Ninety-East ridge offshore Sumatra [Deplus et al., 1998] that accommodate relative motions between the Australian and Indian plates (Figure 1). Recent deformation of western Sumatra has been documented by campaign-style GPS measurements made between 1989 and 2000 [Prawirodirdjo et al., 1999; Bock et al., 2003]. These data show that the large islands south of the Equator, in the area of the 1833 source rupture, are moving in the direction of the relative plate-motion vector. These motions indicate that the subjacent subduction interface is fully locked [Prawirodirdjo et al., 1997]. By contrast, the GPS stations on the islands around the Equator, above the 1935 source, experience lesser motions that are more nearly parallel to the trench (unpublished data, SuGAr network). These surface movements indicate significant aseismic slip on the interface. This part of the subduction interface is within a tectonic domain where the overriding plate is structurally more complex than it is farther south [Sieh and Natawidjaja, 2000]. Earlier microatoll studies that constrain source parameters of the 1833 earthquake Zachariasen et al. [1999] report U-Th ages that cluster around 1833 from microatolls at 15 sites around the Mentawai archipelago. All but three of these sites are on the coast of southern South Pagai (Figure 2). At most sites, they collected small samples with rock hammer and chisel. But at six locations, Silabu, Siruamata, Saomang, Tiop Bay, Siatanusa and Tinopo islands, they cut vertical slabs of the 1833 heads and were able to 11
12 analyze the history of vertical deformation leading up to emergence in We have revisited the Silabu, Siruamata and Saomang sites and offer updates to their interpretations below. Although we did not collect new material from their Tiop bay site, we have revised their analyses in the light of what we have found at other sites. The basic observation of the earlier microatoll work is that southern South Pagai island rose and tilted toward the mainland in Zachariasen et al. [1999] reported uplift of about 2 m on west coast and about 1 m on east coast. They estimated the 1833 coseismic step as we have done, by extrapolating the rate of submergence of a modern microatoll to 1833 to get the immediately post-1833 HLS and then subtracting that elevation from the elevation of the immediately pre-1833 HLS. Only at two of their sites, however, did they collect slabs from both modern and fossil microatolls, so they had to estimate modern rates from other sites. The emergence values they document implied about 13 m of slip on the megathrust beneath southern South Pagai. Assuming similar slip under Sipora and North Pagai, they calculated the size of the 1833 earthquake to be M w 8.8. They extrapolated to an M w 9.2 by assuming that the rupture extended with the same parameters from the Equator to 5.5 S, the rupture length Newcomb and McCann [1987] had inferred from historical reports of shaking and tsunamis. RESULTS FROM INDIVIDUAL SITES The data upon which this paper is based come from 14 sites 13 from the coasts of the four major Mentawai islands (Siberut, Sipora, and North and South Pagai) and one in the Batu islands (Figure 2). Three sites studied previously [Zachariasen et al., 1999] 12
13 were not visited by us. We visited the remaining 11 in 1999, 2000, 2002 and This report contains the detailed record of seven of these sites four in the main text, as examples of the nature of the data, and three in an electronic supplement (Supplement 2). Details of the other four sites will appear in future publications that describe evidence for repeated large megathrust ruptures beneath the Mentawai islands and for long-term aseismic behavior beneath the Batu islands. At each of the eleven sites, we collected slabs from both fossil and modern microatoll heads. These give constraints on coseismic uplift in 1797 and 1833 and on the rates of vertical deformation for three periods the decades prior to 1797, the 27 years between 1797 and 1833, and the latter half of the 20 th century. Tables 1 and Table S1 list the U- Th analyses that constrain the dates of growth of the slabs discussed in detail in this paper. Table 2 lists the latitude and longitude of each sampled microatoll. Siruamata site (Srm) This locality provides a representative example of the recent paleoseismic record along the southwestern coasts of the Mentawai islands. It lies on the east coast of Siruamata islet, a few km off the southwestern coast of Sipora island (Figure 2). Zachariasen et al. [1999] estimated emergence of about 0.7 m during a historically unreported event in about 1810, followed by emergence of about 0.9 m in Our interpretation differs from theirs, because we have new evidence that places the 0.7 m emergence in 1797, and because we have sampled a modern microatoll at the site to constrain better the emergence in
14 The sampled living and fossil microatolls are separated by about half a kilometer. The living head sits on the edge of a mangrove swamp; the fossil microatolls sampled by Zachariasen et al. [1999] populate an intertidal reef platform that extends out from a narrow beach (Figures 3 and 4). Analysis of a modern head The sample taken from the large modern Porites microatoll, Srm00A1, contains a 50- year record of submergence (Figure 5). In that record, the El Niño years of 1962, 1983, 1994 and 1997 [Saji, et al., 1999], with their characteristically exceptional low tides, manifest themselves in the record as HLS unconformities. Otherwise the record is one of uninhibited upward growth. The average rate of submergence of the reef during the five decades of record is about 8 mm/yr, just a few mm/yr under the maximum rate at which an unimpeded coral can grow upward [Natawidjaja et al., 2004]. An animated simulation of the growth of this microatoll in response to sea-level changes is available at Re-analysis of fossil head Si94A6 Fossil microatoll Si96A6 is representative of a number of microatolls discovered by Zachariasen et al. [1999]. It has a central flat surrounded by a younger and higher outer raised rim, and the base of that outer raised rim is surrounded by a disk of still younger growth (Figure 6). The 0.7-m drop from top of the high to the top of the low outer rim represents an emergence of the coral. The abrupt thinning of annual bands 23 bands in from the perimeter of the slab is coincident with the time of the emergence, when the microatoll base suddenly became exposed to low-tide water depths of only a couple tens 14
15 of centimeters. It may be that the thinner bands indicate that survival was more difficult in the hotter water that would have formed during low tides after uplift. Erosion of several centimeters of coral from the lower flank of the microatoll is clear in the crosssection. This commonly occurs on the flanks of miccroatolls that have been lifted into the intertidal zone [Natawidjaja et al., 2004]. An animated simulation of the growth of this microatoll in response to sea-level changes is available at Annual banding of Si94A6 is exceptionally clear, so relative ages of the annual bands are certain within only a year or two. Two U-Th dates constrain the date of the 0.7-m emergence event to near the end of the 18 th century. U-Th analyses permit Zachariasen et al. s interpretation that the outermost ring is the 1833 annual band. However, this interpretation means that the 0.7 m emergence would have occured within a few years of 1810, a period during which the historical record is devoid of large earthquakes It is also possible to assign the 0.7-m emergence to 1797, the year of a large, tsunamigenic earthquake in the historical record [Newcomb and McCann, 1987; Appendix 1]. The U-Th ages of Zachariasen et al. [1999] permit this interpretation. Additional support for a 1797 date of emergence comes from the temporal pattern of δ 13 C values in the last two decades of growth. In search of an isotopic signal reflecting a sudden change in light conditions associated with uplift in this well-banded slab, our colleague, M. Gagan, conducted a detailed examination of δ 13 C variations through the outermost bands of the slab [Gagan et al., 2000]. The clear annual signal in the record likely reflects a pronounced difference in corallite metabolism between the rainy/cloudy 15
16 and dry/sunny seasons. This annual pattern breaks down once in the time-series, in the fifth youngest wholly preserved band. If, as inferred by Gagan et al., this band represents the year without a summer following the eruption of Tambora, east of Java, in April 1815, 1797 is the date of the last thick ring that grew prior to the 0.7-m emergence. This date of emergence is only a couple years older than the date derived from the two U-Th analyses shown in Figure 6. Counting out from the sampled rings to the youngest thick ring yields estimates of AD 1801 ± 5 and 1807 ± 7. The weighted average of these dates is AD 1803 ± 4. Although this interpretation is consistent with the U-Th dates, it would mean that the microatoll died in 1820 rather than in Claiming that the death of the head was from non-tectonic causes in 1820 is not strictly ad hoc, since the extraordinary thinness of the annual bands after the 0.7-m emergence attests to the fact that the head was stressed in its final decades [Zachariasen et al., 1999]. Emergence in 1797 and 1833 Combination of the fossil and modern HLS histories allows a more precise estimate of the 1833 coseismic step. Figure 7 shows that the elevation of the pre-1833 HLS was about 0.1 m below modern HLS in A linear extrapolation of the modern HLS back to 1833, using the rate of submergence determined from the modern microatoll, yields an HLS elevation just after the 1833 event about 1.4 m below the HLS in The difference between pre- and post-event HLS, about 1.2 m, is an estimate of uplift in Linear extrapolation of the modern HLS back to 1833 may yield an underestimate of the actual coseismic uplift in 1833, since large post-seismic transients are common 16
17 following large earthquakes [Sawai, et al., 2004; Melbourne, et al., 2002]. For example, above the Sumatran megathrust a post-seismic transient is evident in some of the microatoll records of the M w 7.7 rupture of 1935, a few hundred km northwest of Siruamata [Natawidjaja et al., 2004]. Post-seismic subsidence of some coseismically uplifted sites continues even today at a higher rate than was occuring in the decades prior to the 1935 earthquake. Continuous GPS records above the 2005 rupture of the megathrust also record post-seismic transients. At Lahewa, where coseismic uplift was nearly 3 m, subsidence of 150 mm occurred in just the first 4 months following the earthquake [Hsu, et al., 2005]. These examples show that we could be underestimating significantly the 1833 coseismic step, not only at Siruamata but at other sites as well. However, we use a linear extrapolation of the modern rate back to 1833 because we have no direct knowledge of post-seismic transients. Furthermore, the effect of post-seismic subsidence would be offset to some degree by the modern global rise in sea level. Whereas inclusion of post-seismic subsidence would increase our estimate of coseismic uplift, correction of the modern subsidence rate by the amount of modern global sea-level rise would reduce it. Since at least 1870, global sea level has been rising [Church and White, 2006]. This correction would be about 195 mm for the period from1870 to 2000 and, by extrapolation, about 200 mm for the entire period between our sample collection dates and the 1833 earthquake. We have not made this correction in any of our reconstructions of the 1833 coseismic step. 17
18 Bangkaulu site (Bkl) The Bangkaulu site is representative of three sites on southern South Pagai island that show little to no emergence during the 1797 event but clear evidence for uplift in The site is on the east coast of a long narrow peninsula that extends South Pagai southeastward (Figure 2). Bangkaulu village lies about 2 km to the northwest. The site consists of a small beach berm and intertidal reef with sparse stands of mangrove near shore (Figure 8). Many well-preserved small fossil Goniastrea microatolls lie within and close to the beach face and mangrove thicket (Figure 9). A few larger Porites microatolls exist farther from shore, and a band of their living equivalents lies tens of meters still farther from shore. The elevation difference of about 0.1 m between the tops of the fossil Goniastrea and Porites microatolls is typical for living microatolls of these two genera [Natawidjaja, 2003]. This similarity implies that the fossil microatolls are contemporaneous and record the same emergence event. We slabbed one each of the Goniastrea and Porites fossil microatolls and a living Porites microatoll. Living, modern head (Bkl03A3) The slabbed modern microatoll from the Bangkaulu site lives about 60 m offshore. It contains an excellent record of episodic rise of the HLS (Figure 10). The clear annual banding in the slab leaves little uncertainty in the assignment of dates to the bands, although only one of three U-Th dates from the slab are consistent with this visual counting (Table 1). Clear drops in HLS occurred during the El Nino years 1994 and 1997, as well as in about 1962 and The average rate of climb of the HLS between 1962 and 2002 is about 7 mm/yr. 18
19 Fossil heads Natawidjaja et al., We slabbed one of the fossil Goniastrea microatolls (Bkl03A2), because this genus commonly has low initial 230 Th values that allow very precise and accurate dating. The location of this sample appears on Figure 8, but we do not include an illustration of the slab here. This slab yielded a date of AD 1800 ± 5 (Table 1) for a sample 80 to 250 mm in from the ragged outer edge of the microatoll. This supports the interpretation that the field of heads died in 1833, although the banding in the slab is too ambiguous to make an exact count of years between the sample and the death of the head. Sample Bkl03A1 is from a large Porites microatoll farther out to sea (Figure 8). We sampled this head because its large size promised a long pre-1833 HLS record. In fact the slab records HLS unconformities throughout the seven decades prior to 1833 (Figure 11). The average rate of submergence prior to emergence in 1833 is about 6 mm/yr, statistically indistinguishable from the average modern rate. The U-Th dates from this fossil Porites microatoll show that it died in the late 18 th or early 19 th century. This is consistent with death in 1833, but the large uncertainties in the dates allow that death could have occurred in The low error in the date of the contemporaneous Goniastrea head, however, shows that the Porites microatoll most likely died within a few years of 1833, in which case the coral death likely resulted from emergence during the 1833 earthquake. The Porites microatoll record constrains any change in HLS in 1797 to be either null or slightly negative. We will show below under "Pattern and magnitude of rupture in 1797" that this provides a crucial constraint on the southeastern extent of the fault rupture of
20 Emergence in 1833 Natawidjaja et al., The HLS records of the modern and fossil heads constrain the magnitude of emergence in 1833 at Bangkaulu to about 1.8 m. The HLS elevation just prior to the 1833 event was about 0.5 m above HLS in 2003 (Figure 12). Extrapolation from the 2003 HLS back to 1833, using the average modern rate, yields an HLS elevation of about 1.3 m below the 2003 level. Under this assumption, the difference between immediately pre- and post-earthquake elevations is about 1.8 m. Sibelua site (Sbl) The Sibelua site represents sites along the northeastern coasts of the Mentawai islands. It lies about half way up the northeast coast of South Pagai (Figure 2). The setting is typical of the protected eastern side of the island in that it comprises labyrinthine waterways through mangrove swamps (Figure 13). We sampled both a living and a fossil microatoll at Sibelua. The living head sits on the seaward edge of the shallow reef; the fossil head is nestled within the convoluted margin of two stands of mangrove, against a border of mangrove snags. As is the case throughout the Mentawai archipelago, these dead tree trunks and roots testify to gradual submergence of the islands during the past few decades. Analysis of the modern head The modern microatoll, Sbl02A2, shows episodic submergence, marked by 3- to 10- year-long periods of HLS stability interrupted by 10- to 15-year-long periods of uninhibited upward growth (Figure 14). It is odd that the HLS unconformities are not 20
21 associated with El Niño years. The record reveals a forty-year average rate of submergence of about 6 mm/yr. Analysis of the fossil head The fossil head that we sampled is representative of a family of large fossil microatolls whose tops are nearly concordant. These are most notable for their large diameters and hat shape each has a raised central disk and a wide lower brim (Figure 15). In cross-section the sampled microatoll displays a history of nearly a century of progressive submergence, prior to a prominent emergence (Figure 16). U-Th analyses show that this period spans most of the 18 th century. Several HLS impingements are well preserved between about 1717 and A deep HLS unconformity in about 1735 followed by about a decade of unimpeded upward growth suggests the occurrence of a minor emergence followed by a slightly larger submergence. Between 1735 and 1783, the tops of successive annual bands rise higher and higher but erosion has removed all but one indication of HLS impingement (in about 1770). Annual variations in HLS are commonly a few tens of millimeters, so erosion probably has been greater than that amount. However, the gradual, nearly linear slope along the top of this section of the head suggests that the slope reflects a long-term submergence at a rate of about 3 mm/yr between about 1745 and The tops of annual bands that formed between about 1783 and 1797 ostensibly imply a large, rapid drop in sea level over several years. However, the utter lack of evidence of HLS unconformities on these bands is a reason to be suspect this interpretation. We 21
22 suspect, instead, that about 20 cm was eroded off the side of the head after it emerged in The steep flanks of emerged heads are sometimes particularly susceptible to lateral erosion [Natawidjaja et al., 2004], so this would not be an unusual case, although the amount of erosion would be several times more than appears on the head in Figure 6. HLS unconformities are also not preserved on the top of the outer flange, which grew between the 1797 and 1833 emergences. Nonetheless, the inward dip of the outer brim indicates clearly that submergence at an average rate of about 4 mm/yr dominated the period between the two events. Emergence in 1797 and 1833 The HLS history inferred from the fossil and modern microatoll slabs implies coseismic uplifts in 1797 and 1833 of about 0.5 and 1.1 m, respectively (Figure 17). The height of the pre-1833 HLS is a few centimeters above the 2002 HLS. Extrapolation of the 2002 level back to 1833, using the average modern rate of about 6 mm/yr yields a post-1833 HLS a little more than 1.0 m below the 2002 level. Accordingly, we estimate the 1833 coseismic emergence to be about 1.1 m, the sum of these two values. The record of HLS in the fossil head constrains the magnitude of emergence in 1797 to about 0.5 m. Because we believe that the record of HLS rise in the two decades prior to 1797 has been obliterated by erosion, we must extrapolate the older record forward to This yields a pre-earthquake HLS about 0.3 m above the 2002 HLS. The immediately post-earthquake HLS is constrained by the top of the 1797 ring to about
23 m below the 2002 HLS. Hence, the magnitude of coseismic emergence in 1797 is about 0.5 m. The steep slope of the top of the five or six annual bands formed immediately after the 1797 emergence suggests a post-seismic transient following the 1797 earthquake. During that period about 70 mm of the coseismic emergence was recovered by submergence (Figure 17). Pitogat site (Ptg) The Pitogat site is the northernmost site on Sipora from which we have recovered clear evidence of the 1797 or 1833 event. The site is on the south side of a large bay near the western shoulder of Sipora island (Figure 2). Our data from Pitogat indicate that combined emergence of 1797 and 1833 was about 1.1 m. The coastline at Pitogat runs east-west and the intertidal reef is about 130 m wide (Figure 18). Immediately to the south is a narrow active beach, backed by a forested, inactive sandy back-beach slope. Snags rooted beneath the modern beach and on the nearshore part of the intertidal reef testify to recent submergence of the site. Fossil heads are concentrated along the southern 30 m of the intertidal reef and modern heads live in a band up to 40 m beyond these. We sampled one fossil and one modern head from these two populations. The HLS record contained in the modern slab is unusual in that it shows a clear reversal in the sense of vertical motion in the past 40 years. Unconformities in the record make interpretation of HLS changes prior to 1962 impossible (Figure 19a). Nonetheless, between 1962 and 1988, HLS clearly rises about 200 mm at an average rate of about 6 23
24 mm/yr (Figure 19b). The subsequent HLS trend has been downward, with HLS unconformities in 1990, 1994 and in One could discount this reversal in trend as being tectonically insignificant, given that both 1994 and 1997 were El Niño years of exceptionally low tides and that 1997 was also the year during which much of the fauna of the western Sumatran reefs died in association with the extended Sumatran and Kalimantan fires [Natawidjaja et al., 2004]. However, the HLS unconformity in the non- El Niño year of 1990 suggests the reversal may be of tectonic origin. Below, we use the average rate from 1962 to 1988, about 6 mm/yr, in calculating the emergence associated with the 1797 and 1833 events. If we were to include the later HLS values, the amounts of emergence calculated below would be about 0.2 meters lower. The fossil microatoll at Pitogat has the classic morphology of heads on a submerging coast a lower central flat formed in 1745 is surrounded by several terrace rings that are progressively higher toward the head s perimeter (Figure 20a). The cross-section shows these as five distinct erosional unconformities, on the tops of annual bands formed in , 1759, , and 1789 (Figure 20b). U-Th analyses show that the head grew during the decades between about 1740 and The HLS dropped nearly 100 mm in about This may be tectonically significant, since the cross-section shows that corallites growing lower on the perimeter of the microatoll in 1770 also died at this time. If this was due to an influx of sand that buried and killed the lower edge of the microatoll, it may have been related to the historical tsunamigenic earthquake of 1770 [Newcomb and McCann, 1987]. Because the fossil microatoll sat within the intertidal zone until recent submergence carried it back below lowest low tides (Figure 21), the submergence of the 18 th century 24
25 must have given way to emergence sometime after about The modern record at Pitogat constrains this emergence to a time well before One simple interpretation is that the emergence was associated with the 1797 event, since the head died soon after about 1790 (Figure 20b). However, a mere 20 cm of emergence in 1797 would have killed the head, since its outermost annual band is so thin. The remainder of the emergence could have occurred in Extrapolation of the fossil record forward in time from the 1700s and the modern record back yields an estimate of about 1.1 m of emergence during one or both of these events (Figure 21). This ambiguity in the partitioning of the emergence will remain until recovery of a head that captures the HLS level just after the 1797 event. The remaining sites In addition to the four sites just described in detail, ten others display evidence for uplift in 1797 or 1833 or both. In the interest of brevity, we summarize the data for these sites, below, rather than elaborating them fully. Details from the first three of these ten sites (Singingi, Silabu and Silogui) appear in an electronic supplement (Supplement 2). The next three sites (Simanganya, Sikici, and Bulasat/Saomang) contain evidence not only for these most recent emergences but also for prior large emergences. They will be examined in detail in a separate, forthcoming paper on the recurrence of large ruptures beneath the Mentawai islands. The Badgugu site, in the Batu islands just south of the Equator, contains a continuous 250-year-long record of relative sea level, the longest obtained from any site in western Sumatra. It will be the centerpiece of a future paper on 25
26 the long-term behavior of the largely decoupled section of the megathrust near the Equator. The Tiop bay, Siatanusa and Tinopo island sites, were examined in detail by [Zachariasen et al., 1999] and hence require only brief review. Singingi site (Sgg) This locality is on the northern tip of a swampy mangrove islet off the northeast coast of South Pagai (Figures 2 and S1). A fringe of dead snags rooted in the intertidal reef flat bears witness to the fact that the islet is slowly submerging (Figure S2). We collected slabs from two fossil microatolls and one living microatoll to define the HLS history of the site (Figures S3 through S5). Figure 22F is a composite of the HLS records of the three slabs from Singingi. The relationship between fossil heads Sgg03A1 and Sgg03A2 shows that at least the 18 th - century part of head Sgg03A2 has been eroded substantially. Together the three heads yield an estimate of about 0.4 m for emergence in The difference between the pre- and post-1833 HLS is about 1.5 m. Silabu site (Slb) This site is on the west coast of North Pagai island, on the south side of a large bay, about 95 km from the trench (Figure 2). The locality was first studied extensively by Zachariasen et al. [1999], who found clear evidence for uplift in 1833 and during an event a few decades earlier. Two distinct populations of fossil microatolls populate the intertidal reef platform (Figure S6). The outer raised rims of the older population commonly are about 0.8 m higher than those of the lower population. 26
27 A modern slab (Figure S8) and several slabs from the fossil populations (Figures S9 through S12) constrain HLS between about 1710 and 1833 and allow us to document HLS history of the past two decades (Figure 22E). Together these records show that emergence was about 0.8 m in 1797 and about 2.2 m in Silogui site (Slg) Silogui is the northernmost site in the Mentawai islands from which we have evidence of the 1797 or 1833 event (Figure 2). The site is near the mouth of a long, narrow bay on the east coast of Siberut island. We recovered a fossil microatoll from the site (Figure S14) and measured the elevation of living HLS on (but did not slab) a modern head. For a surrogate modern submergence rate, we used the rate calculated from a slab collected at Teluk Saibi, about 6.5 km to the south. As at Pitogat, the microatoll indicates that combined emergence in 1797 and 1833 was about a meter (Figure 22B). The top of the fossil head is about 100 mm below the modern 2002 HLS. At 5 mm/yr, the net submergence since 1788 should have been a little over a meter. One or more emergence events between 1788 and the present would be required to raise the head that amount, and 1797 and 1833 are the best candidates. Simanganya site (Smy) Three adjacent sites along the northeastern coast of North Pagai island are near the town of Simanganya. Together they contain a 700-year long record of several large emergence events. Figure 22D displays the portion of this composite record relevant to the 1797 and 1833 events. No clear disturbance of HLS appears to occur in or near Modern and fossil heads constrain emergence in 1833 to be about 1.8 m. 27
28 Sikici site (Skc) The Sikici site is on the east coast of Sipora island. Like Simanganya, its record is a composite from three neighboring sites that spans the past seven centuries. Slabs cut from a fossil and a modern microatoll constrain the HLS history of the past three centuries (Figure 22C). Interseismic submergence has occurred at about 4 mm/yr throughout that period. The head does not record emergence in 1797 well, because it was experiencing unimpeded upward growth in the years before in 1797, dropped its HLS down about 40 mm below the top of the previous year s annual band. Thus emergence in 1797 could have been 40 mm or greater. In contrast, emergence in 1833 is well constrained by the modern and fossil heads to about 1.3 m. Bulasat/Saomang site (Bls/Smg) These neighboring sites on the west coast of South Pagai island contain a composite partial record of emergence events and interseismic submergence that extends about two millennia into the past. Combining the record from two fossil microatolls at Saomang with that of a modern head at Bulasat allows estimation of emergence in 1797 and 1833 (Figure 22G). One of the slabs (P96F1) contains a record of the 1833 event from a Goniastrea microatoll collected by Zachariasen et al. [1999]. The other (Smg02A2) is from a Porites microatoll that we collected. Together these constrain uplift in 1797 to be about 0.95 m. A slab from a modern microatoll at Bulasat, a few km to the northwest provides the elevation of the HLS in Its very rapid average modern rate of submergence extrapolates to a post-1833 HLS about 2.2 m below modern HLS. From this evidence we estimate an emergence of about 2.4 m in 1833, one of the largest values 28
29 obtained among all our sites. If instead the average rate over the past 170 years were, say, 10 mm/yr, our estimate of coseismic uplift in 1833 would diminish to about 2 m. Badgugu West (Bdg) The exceptionally long record from the Badgugu site (Bdg, Figure 2) places constraints on the northern extent of the 1797 and 1833 ruptures. One thin, flat microatoll there records HLS history from about 1746 to 1935 (Figure 22A). The head records an emergence in 1797 of about 200 mm. A rapid submergence of 50 mm follows within no more than 3 years. The microatoll records a small but clear emergence of about 100 mm in 1833, as well. This is followed by a submergence of about the same magnitude within no more than 5 years. Three sites from Zachariasen et al. [1999] Many localities in the Mentawai islands have microatolls whose deaths were dated to about 1833 by Zachariasen et al. [1999]. They collected slabs for HLS analysis at three of these sites, all on southern coasts of South Pagai island. Tiop bay (Ttp) Tiop bay is an elongate re-entrant of the sea on the southern coast of South Pagai. A slab cut there by Zachariasen et al. [1999], P96H1, contains a record extending back about 60 years from The slab exhibits an emergence of only a centimeter or two in 1797 (Figure 22H). Because they did not slab a modern head at this site, they used a 7 mm/yr rate from a modern head 40 km to the northwest to estimate a 1.8-m 1833 coseismic step. We recalculated the coseismic step using the modern rate from Bulasat, 29
30 about 10 km to the northwest and at about the same distance from the trench as Tiop bay. Because the modern rate at Bulasat is much faster (13 mm/yr, Figure 22G), we estimate a greater 1833 coseismic emergence, about 2.8 m. This is the largest known emergence associated with the 1833 earthquake. Siatanusa (Stn) and Tinopo (Tnp) Both of these sites are from islets in the archipelago off the southeast coast of South Pagai. Zachariasen et al. [1999] cut two slabs at each site -- one from a fossil and one from a living microatoll. Each modern slab yielded a record of submergence at average rates of about 4 to 5 mm/yr for the past three to four decades. U-Th dates of each fossil slab are consistent with death by emergence in 1833, but neither slab extends far enough into the previous decades to place a direct constraint on the effects of the 1797 event (Figures 22I and J). The slab from Tinopo, however, does include annual rings from as early as about 1785 (Figure 22I), but the first time upward growth is limited by HLS is in about Although this is not a direct indication of vertical deformation in 1797, it does constrain the magnitude of emergence to no more than about 50 mm. DISCUSSION AND MODELING Synthesis of the paleoseismic records Pattern and magnitude of uplift in 1833 The record of microatoll emergence on the islands of the outer-arc ridge places new constraints on the sources of the 1797 and 1833 earthquakes and tsunamis. Taken together, nine sites show that the Pagai islands tilted toward the mainland in 1833 (Figure 30
31 23). The pattern is coherent: Sites on or near the southwestern flanks of the islands rose 2.2 to 2.8 m, while sites on the northeastern coasts rose between 0.9 and 1.7 m. The tilt is markedly steeper in the south than in the north. The 1833 contours give no indication of closing toward the southeast, so emergence and tilt must have continued in that direction beyond South Pagai. This is consistent with the historical record of severe shaking and tsunami damage at Bengkulu (Appendix 1), which suggests that rupture extended at least as far south as about 5 S. The similarity of uplift values at Siruamata and Sikici, on the southwest and northeast coasts of southern Sipora island (Srm and Skc on Figure 23), require a significant bending of the tilt axis across that island, and an appreciable northwestward diminishment of uplift across the island. The even lower value of 1833 emergence at Pitogat (northern Sipora island, Ptg, Figure 23) confirms the northwestward decrease across Sipora in Whether or not the uplift of 1833 reached Siberut is unresolved. If some portion of the uplift measured at Silogui occurred in 1833, then 1833 uplift extends some distance farther to the northwest, albeit with a distinct kink in contours in the strait between Siberut and Sipora, perhaps as depicted in Figure 23a. Another viable interpretation is that none of the emergence measured at Silogui occurred in In that case 1833 uplift would have ended near the south coast of Siberut, perhaps as depicted in Figure 23b. Any partitioning of the 0.83 m of uplift measured at Silogui (Siberut) between the 1797 and 1833 events is plausible, as long as the uplift in 1797 is at least 25 cm, the thickness of the outermost annual band of the fossil microatoll there. But given the near- 31
32 zero value for 1833 emergence at Badgugu, we favor partitions that assign only a small portion to the 1833 event. In Figure 23a we allocate to 1833 slightly less than half of the uplift at Silogui and allow 1833 uplift to be contiguous all the way to Badgugu. In Figure 23b we give it none and assume that the very slight emergence at Badgugu was isolated from the main region of uplift. Pattern and magnitude of uplift in 1797 Ten sites on Sipora and the Pagai islands constrain the pattern of emergence in 1797 (Figure 24). The Pagai islands tilted northeastward, toward the mainland, but uplift was not as great as in On the southwestern coasts, uplift ranged between 0.7 and 0.8 m and on the northeastern coasts it reached values as great as 0.5 m. The magnitude of uplift of Siberut in 1797 depends on how one partitions slip between 1797 and 1833 at Pitogat and Silogui. In Figure 24a, we tentatively ascribe a little more than half of the 0.83 m at Silogui to 1797, because the 1797/1833 emergence ratio is high farther north, at Badgugu. In Figure 24b, we ascribe all uplift measured at Silogui and more than half of the uplift at Pitogat to The southern limit of emergence in 1797 is delimited by the sharp southeastward decline in values across the southeastern end of South Pagai island. No emergence occurred at Bangkaulu (Bkl, Figure 24) in 1797, and at Tiop bay (Ttp) uplift is a mere 30 mm or so. But only 15 km or so up the coast at Bulasat and Saomang (Bls/Smg), uplift appears to be about 0.8 m. If we have overestimated the emergence at Bulasat/Saomang (i.e. if the modern submergence rate overestimates the average rate since 1797) then this gradient would be less steep, but still present. 32
33 Elastic-dislocation modeling of the ruptures The ambiguities at Silogui and Pitogat and the lack of other sites on or near Siberut permit two basic uplift scenarios for 1797 and The difference between the two is that 1833 uplift in one scenario extends beneath Siberut and in the other it does not. We favor the latter, for three reasons. First, all contouring of the 1833 data that is faithful to the three measurements on Sipora require, at the very least, a sharp bend in the 1833 uplift contours and a northwestward lessening of uplift (Figure 23a). The northwestdiminishing uplift allows drawing of the zero-uplift contour through the Sipora/Siberut strait at this bend (Figure 23b). Second, the 1797 uplift at Badgugu (Bdg) is about twice as large as 1833 uplift there. This hints that uplift of the coasts of Siberut occurred predominantly, and perhaps only, in Historical reports (Appendix 1) also give credibility to the hypothesis that rupture in 1833 did not extend northward beneath Siberut. One account hints that in Padang shaking was more severe in 1797 than in Tsunami run-up at Padang also appears to have been greater in One account gives a tsunami run-up of 3 to 4 m in Padang in We estimate from other accounts that run-up there was between 5 and 10 m in Another indication that rupture did not extend beneath Siberut in 1833 is the comparison of tsunami severity in Padang and Benkulu in 1833; tsunami damage appears to have been greater in Bengkulu and Indrapura (Figure 2) than in Padang. This suggests that the primary source of the tsunami was offshore from Indrapura and Bengkulu, well south of Padang. In this section we construct models of the 1797 and 1833 ruptures based upon the observed magnitudes and patterns of emergence in 1797 and 1833, adhering to our 33
34 favored interpretations of the Pitogat and Silogui data (Figures 23b and 24b). As have many earlier investigators (e.g. [Kanamori, 1973; Savage, 1983; Thatcher and Rundle, 1984; Zachariasen et al., 1999]), we do this by constucting elastic dislocation models that attempt to reproduce the pattern of surface deformation. A principal constraint in the models is the geometry and location of the megathrust. We fix its position and shape from its outcrop on the seafloor, as defined by bathymetry at the deformation front, and by assuming it is coincident with the top of the Wadati- Benioff zone (based upon locations of hypocenters from the relocated ISC catalogue for the period [Engdahl et al., 1998]). We also constrain the dislocation to be purely dip-slip and choose a dip of 15, the best-fitting value for the megathrust beneath the islands. This seems justified, given that instrumentally recorded events in the region overwhelmingly have slip vectors with no more than a small strike-slip component [McCaffrey, 1991]. Elastic dislocation models of the 1833 event We follow Okada [1992] and start with simple models in which the rupture plane is a rectangular patch, embedded in an elastic half-space beneath the region of uplift and has uniform slip throughout. Figure 25a shows that for megathrust ruptures that extend updip to the seafloor (7 km), best-fitting models have slip ranging from about 7 to 10 m and down-dip limits of faulting ranging between depths of about 45 to 50 km. The fact that the χ 2 values are 4 or higher, though, shows that none of these uniform, rectangular models fit the data well. 34
35 One way to improve the fit to the data is to subdivide the megathrust beneath the islands into two or more smaller rectangles with differing slip amounts and downdip limits of rupture. Figure 25b illustrates in three separate panels a range of fits to the data on Sipora, North Pagai and South Pagai. In each panel are nine solutions -- permutations of 5, 10 and 15 m of slip with 30-, 40- and 50-km downdip depths. Among these nine models, the best-fitting for Sipora is the model with 5 m of slip and a locking depth of 50 km. But for the data from North Pagai island, the best-fitting of the nine models is the one with 10 m of slip and a 50-km locking depth. The best-fitting of the models for the data from the coasts of South Pagai island is the one with 15 m of slip and a down-dip locking depth of 40 km. Guided by these initial tests of best-fitting models, we now construct a composite forward model that fits all the data optimally. The model consists of three rectangular patches, one under Sipora, one under North Pagai and one under South Pagai (Figure 26a). The patches under Sipora and North Pagai extend from the trench to a depth of 50 km. Under Sipora, slip is 9 m; under North Pagai it is 11 m. The patch under South Pagai has slip of 18 m and extends to a depth of 37 km. We extend this patch southeast to nearly 5 S, because historical reports (Appendix 1) suggest rupture extended at least this far, and because modern seismicity is sparse until that latitude. This composite model fits most of the data well -- the shallower slope to the data in the north, the steeper slope in the center, and the very steep slope in the south (Figure 26b). The magnitude, M w, of this rupture would be 8.9. Its principal characteristics are that slip increases southeastward from about 9 m to about 18 m and that the downdip limit of faulting 35
36 shallows southeastward from about 50 to 37 km. The χ 2 value of this model, 0.95 shows that the model fits most of the 18 data points well. An alternative composite model that does not include rupture all the way to the trench may also be acceptable, but does not fit the data quite as well. Figure 26cd shows the fit of a model in which slip ends updip at 20 km. The downdip limits of faulting are 45, 50 and 39 km from northwest to southeast. Slips on the three patches are 7, 9, and 10 meters, from northwest to southeast. The χ 2 value for this model is 1.19, slightly greater than the model in Figure 26ab. Its size is much smaller, equivalent to a M w 8.6. Clearly, the coral data do not fully constrain rupture characteristics outboard of the islands. But they do require that the down-dip limit of rupture lies at variable distances between the islands and the mainland. Elastic dislocation models of the 1797 event As with the modeling of the 1833 event, a successful model of the 1797 source must replicate well the magnitudes of the uplift and the pattern of tilt, which are summarized here: Uplift ranges from zero to about 80 cm. The low values of uplift in the northwest and southeast limit the rupture to between about 0.5 and 3.2 S (Figure 24). The southeastern flank of the uplift is remarkedly steep, dropping from about 80 cm to zero in less than 20 km. The northeastward tilt of Sipora and North Pagai islands is steep. And uplift at one locality on Siberut is no more than about 0.8 m. As with the 1833 uplifts, we find that there is no simple, uniform-slip rupture of the megathrust beneath the Mentawai islands that provides a good fit to the entire data set for Many points cannot be fit within their errors, as shown by χ 2 values > 6 for even 36
37 the best-fitting of the uniform-slip rectangular patches. Thus, models using combinations of patches are warranted. For models with rupture out to the trench, one model that fits relatively well is that shown in Figure 27. In this scenario, slip under Siberut is 6 m and extends from the trench to a depth of 40 km. Slip under Sipora is 8 m and the downdip limit of rupture is just 34 km. This shallow downdip limit of rupture yields the steep gradient in uplift that the microatolls record. Under North Pagai and the northern half of South Pagai, slip is 6 m and extends to a depth of 38 km. No elastic model fits well the steep southeast-sloping gradient on southern South Pagai. In this least-objectionable model, we use slip of 4 m on a narrow patch with a down-dip limit of rupture 50 km. This composite model fits all values except those at the southeasternmost three uplifted sites (Sibelua, Bulasat/Saomang and Singingi). We were unable to fit with an elastic model these three points and the three points with no uplift farther south (Figure 27). This may indicate that some of the deformation in 1797 was not elastic. Perhaps the half-meter underestimation of this model to the uplift documented at Bulasat/Saomang and Sibelua reflects a half-meter or so of deformation related to anelastic permanent deformation of the island. Such deformation is shown by outcrops of reef limestone that sit at least 30 m above sea level at the Perak Batu Sumatran GPS Array (SuGAr) station, just a few kilometers north of the Sibelua site ( As in 1833, the emergence and northeastward tilt of all sites on the islands show that the downdip limit of 1797 rupture is northeast of the islands; unlike 1833, however, the downdip limit in 1797 appears to be close to the northeastern coasts of the islands, 37
38 especially at the latitudes of Sipora and North Pagai. The 1797 displacements are smaller and the 1797 rupture surface is shorter and narrower than those of Accordingly, the range of magnitudes of the 1797 rupture, M w 8.5 to 8.7, is appreciably smaller than that of the 1833 rupture. χ 2 tests show that, taken as a whole, the data are insensitive to the updip limit of rupture. We cannot resolve with these data where the rupture ended between the trench and the southwestern coasts of the islands. Post-seismic disturbance at Badgugu The slight post-seismic submergences seen at the northernmost locality, Badgugu, may have an important implication for the 1797 and 1833 events. Badgugu submerged 60 mm after the 1797 event and 140 mm after the 1833 event (Fig 22G). In both cases, the post-seismic submergence happened in less than four years. Because it was greater in 1833 than in 1797,post-seismic submergence probably scales with the size of the principal ruptures rather than with the magnitude of slip under Badgugu, which was higher during the lesser of the two earthquakes (1797). This association of greater postseismic subsidence with lesser local slip on the megathrust implies a local timedependent effect related to the overall size of the rupture. One possibility is that these rapid submergences reflect aseismic slip on the megathrust up-dip from the Badgugu site, as has been shown for post-seismic deformation associated with the 2005 giant Nias- Simeulue earthquake [Hsu, et al., 2005]. Paucity of 1797 and 1833 sites on the intertidal reefs around Siberut We found only one 18 th - or 19 th -century microatoll on the reefs surrounding Siberut island, probably because heads uplifted in 1797 and 1833 having already submerged 38
39 beneath the intertidal zone there. South of central Sipora (~2 S) fossil heads that died in 1797 or 1833 are readily apparent, because their upper parts protrude 30 to 50 cm above the sea surface during lowest tides. Likewise, north of Siberut, among the Batu islands, the tops of fossil heads that were killed by emergence during the M w 7.7 earthquake of 1935 protrude into the intertidal zone. Along both of these lengths of the outer-arc ridge, then, modern submergence has not exceeded the magnitude of emergence in the most recent large earthquakes. The sparcity of microatoll sites near Siberut is not due to differences in the reef environment, except perhaps along the vertiginous southwestern coast of the island, where reefs are small, wave energies high and microatolls rare. The character of the eastern coastlines of the Pagai or Batu islands do not differ much from those of northernmost Sipora or Siberut. Furthermore, colonies of living microatolls are abundant along the southern and eastern coasts of Siberut (Natawidjaja et al., in review). Their pattern of submergence throughout the past half-century, in combination with deformations measured with GPS over the past 15 years, indicate that the subjacent part of the megathrust is locked to depths of more than 40 km and stores strain that is released during large earthquakes (Chlieh et al [2005]). Thus the difficulty in finding 1797 and 1833-vintage microatolls near Siberut must be due to their not protruding into the intertidal zone. The Pitogat and the Silogui microatolls are probably representative they reside wholly or almost wholly below the modern HLS, that is, below the level of lowest low tides. If these are representative of 18 th - and 19 th -century heads from northern Sipora to northernmost Siberut islands, then this readily exlains why we were largely unsuccessful in finding more than two. 39
40 These findings imply that the emergence on northern Sipora and on Siberut in 1797 and 1833 has been equaled by subsequent submergence. Strictly speaking, though, this is not the case, since sea level has been rising globally 1 to 2 mm/yr for at least the past several decades. Making the generous assumption that this submergence has been occurring for all of the past century, sea level is now 0.1 to 0.2 m above its level in 1797 and In this case, potential slip on the subjacent megathrust now equals about 80 to 90% of the slip that produced those two giant earthquakes. Tsunami data and modeling Historical accounts of both the 1797 and 1833 events include mention of large tsunamis on Sumatran coasts (Appendix 1 and Supplementary material). One story reports that at some unnamed location the 1797 tsunami surge rose 15 m above normal water level. In Padang, Dutch and German accounts suggest the tsunami surge was at least 5 but less than 10 meters deep in 1797 and that inundation extended more than 1 kilometer inland. Historical writings give a less graphic description of the 1833 tsunami in Padang, but one account states that the tsunami surge was 3 to 4 meters high. The extensive destruction of port facilities at Bengkulu suggests that the 1833 tsunami was severe there. Are these historical tsunami reports compatible with the pattern and magnitude of uplift we have documented and modeled? How do the tsunamis of 1797 and 1833 compare to the Aceh tsunami of 2004? To answer these questions, we modeled the gross features of the tsunamis generated by both earthquake ruptures. 40
41 Our simulations employ a linear, dispersive tsunami code [Ward, 2001] and the fault rupture parameters shown in Figures 26a and 27. The waves run over 2-minute (~3.7 km) bathymetry from ETOPO2, so tsunami characteristics caused by smaller details are unresolvable and unmodelled. Moreover, the simulation does not carry the waves onto dry land, so the model does not attempt to mimic details of coastal inundation and runup. Rather, wave amplitudes computed directly offshore are scaled to approximate nominal runup amplification as deduced by a range of laboratory experiments on smooth plane beaches. We know that in reality run up can vary over short distances by factors of two or three. Operationally, our runup estimates represent the mean value of a statistical distribution that has a standard deviation roughly equal to the mean. That is, for a quoted runup of say 2 meters, perhaps 15% of nearby locations would experience runups > 4 m and a few percent of nearby locations would experience runups > 6 m. Like tsunami from all large earthquakes, the model 1797 and 1833 tsunamis beam in directions perpendicular to fault strike. Thus, the brunt of the 1797 and 1833 waves run toward the southwest and northeast from their northwest-striking sources under the Mentawai islands. Waves traveling into the open Indian Ocean are highest southwest of the sources. Unlike the 2004 Aceh-Andaman tsunami source, which had a nearly northsouth orientation (Figure 1), the 1797 and 1833 events do not yield high amplitudes on the coasts of India or Sri Lanka. Because of this tsunami beaming effect and the increasingly east-west trend of the megathrust south of the Equator, future earthquakes there probably do not pose a great wave threat to the west coasts of the Bay of Bengal. The model of the 1833 tsunami indicates that offshore islands shielded mainland locations to the north of the rupture. Note the very slow northwestward progress of 41
42 nearshore waves (Figure 28). North of Padang, the fastest tsunami waves travel outboard of the islands and then duck in to the mainland coast through the straits between the islands, outpacing the waves propagating through the very shallow waters between the islands and the coast. The 1833 tsunamis at Meulaboh, Padang and Bengkulu have average runup heights of 1.9, 2.8 and 5.7 m, respectively (Left panel, Figure 28). Among the three mainland coastal localities, Bengkulu, directly east of the 1833 source, receives the strongest waves, consistent with the historical record. Contrast the peak wave heights of 0.4, 0.7 and 2.1 m at three deep-water locations. Each of these is less than the values at the nearby mainland coastal site, because of the amplifications due to shoaling. The region of uplift in 1797 extended farther north than the uplift of Modeling of our coral data suggests that 1797 slip averaged about 6 m, about one-half to one-third the magnitude of slip along the 1833 rupture (Table 3). Generally co-seismic uplift, hence tsunami amplitude, scales with slip, so the 1797 tsunami should be far smaller than the 1833 tsunami. Indeed, the 1797 simulation yields lower tsunami amplitudes overall. At Meulaboh, Padang and Bengkulu the average runups are 1.0, 3.2 and 1.0 m, respectively. For the deep-water sites (A, B, and C on Figure 28), the 1797 simulation yields 0.2, 0.85 and 0.1 meters. Of the six representative locations, only those closest to the northern part of the 1797 rupture experienced higher values than in Even so, the modeled 1797 runup of 3.1 m at Padang is only one-half to one-third the 5 to 10 m wave surge that we infer from the historical record. This difference could be due to a misinterpretation of the historical evidence. Alternatively, details of shallow bathymetry and coastal features near Padang could have pushed wave response beyond the norm. Or, 42
43 we may have underestimated fault slip for the 1797 earthquake. In regard to the latter, we have only one coral site on Siberut island, so it is possible that uplift was greater in the surrounding waters than what we infer. To test the modeling with recent observations, we compute tsunami waveforms for the December 2004 event at six representative locations and compare predicted peak wave heights with observed values. For the source of the 2004 tsunami, we use the source parameters given by Lay et al. [2005]. Simulation of the 2004 tsunami gives 4.0, 1.2 and 1.4 m runups at Meulaboh, Padang and Bengkulu and 1.1, 0.6 and 0.5 at deepwater sites A, B and C. These calculated runups are lower than observed values. At Meulaboh, the tsunami runup was generally greater than 15 m [Yalciner et al., 2005]. Our interviews of eyewitnesses in Padang harbor indicate that the amplitude of the highest surge there in 2004 was about 2 m (K. Sieh, unpublished field notes). Plausible causes for these discrepancies between model and actual values are the same as in the case of the 1797 model. Comparison of the 1797, 1833 and 2004 tsunami simulations suggests that great earthquake ruptures offshore Padang and Bengkulu are capable of generating tsunami runups of many meters, similar to those generated along much of the mainland west coast of Aceh in More detailed analyses will be necessary, however, to assess whether or not the special conditions exist for runups on the Padang-Bengkulu coast to reach the extraordinary 20- to 35-m values experienced at some Aceh localities in Clustering of 1797 and 1833 events 43
44 The interval between the 1797 and 1833 ruptures is much shorter than the average interval between great ruptures of the megathrust there. If all slip occurs seismically, then division of the amount of slip during the earthquakes by the convergence rate gives the nominal, average repeat time for the earthquakes. The trench-perpendicular component of convergence across the Sumatran plate boundary is about 45 mm/yr (Figure 1). Slip in the 1797 model averages about 6 meters (Figure 27). Hence, if type earthquakes were periodic and characteristic, they would recur about every 130 years. Likewise, the average slips of about 15 and 10 m in the 1833 models (Figure 26) would correspond to return periods of about 330 years and 220 years. All of these calculations yield intervals that are much longer than the 37 years between the two great earthquakes. These long calculated intervals are consistent, however, with an apparent lack of previous giant earthquakes in the historical record, which extends back to about A.D [Newcomb and McCann, 1987]. Furthermore, the amount of slip that occurred beneath the islands in 1833 is far greater than could have accumulated between 1797 and Beneath Sipora and North Pagai, model slip in 1833 is about 10 meters. If all of this had accumulated in just 37 years, the rate of trench-perpendicular convergence would have been about 270 mm/yr, which is many times greater than the known rate. Both of these observations imply that the 1797 and 1833 ruptures comprise a couplet that relieved strains that had accumulated in prior centuries. Slip in 1797 did not relieve all strains that had occurred in the previous interseismic period, and slip in 1833 relieved more than just those strains that had accumulated in the years since
45 There are at least two other examples of great-earthquake couplets. Paleoseismic and historical records [Sieh, 1984; Jacoby et al., 1988; Sieh et al., 1989; Weldon et al., 2004] show that the great 1812 and 1857 ruptures of the Mojave section of the San Andreas fault were preceded by about 300 years of dormancy. Slip during both events was about 6 meters. The 6 meters of slip that occurred in 1812 would account for about half of the strain accumulated at about 35 mm/yr in the prior three centuries. Taken together, however, these two slips plausibly accounts for all of the strain that had accumulated in the preceding three centuries. Recent ruptures of the dextral strike-slip Denali fault provide another example. At the crossing of the Trans-Alaska pipeline, slip during the great M w 7.9 earthquake of 2002 was about 5 meters [Eberhart-Phillips et al., 2003]. At the 10 mm/yr average slip rate of the fault at this location [Meriaux et al., 2004], an average recurrence interval for such ruptures would be about 500 years. Nonetheless, a rupture large enough to severely disturb trees along the fault occurred just 90 years earlier, in 1912 [Carver et al., 2004]. It is highly unlikely that the strains necessary to result in a 5-m right-lateral slip could have accumulated in the 90 years between 1912 and These three examples of great-rupture couplets demonstrate that some large fault ruptures do not relieve all or even most of the elastic strains that had accumulated prior to their occurrence. Rather than ushering in a long period of dormancy, the first event in the couplet is followed within decades by an even larger rupture. In the case of both the 1812 San Andreas and Mentawai 1797 events, and perhaps in the case of the 1912 Denali event as well, the rupture relieved appreciably less elastic strain than had been 45
46 accumulated through the long antecedent period of dormancy. This could have been a warning that the second event was in the offing. Given the existence of the 1797 and 1833 couplet, one should ask whether or not the recent great Aceh-Andaman and Nias-Simeulue earthquakes of 2004 and 2005 could each also represent the first in a couplet. The correct answers are uncertain, because the date and nature of previous great ruptures along those two sections of the megathrust are poorly known. The megathrust beneath Nias island has the best constraints. Rupture under Nias during the 2005 Nias-Simeulue event averaged about 6 m [Briggs et al., 2006]. At the rate of strain accumulation (Figure 29), strains leading to this amount of slip would accrue in about 140 years. Since this is almost precisely the time between 2005 and the previous great earthquake in 1861, it is unlikely that a re-rupture of the megathrust under Nias will happen in the next few decades. The history of the northern half of the 2005 rupture is too poorly known to forecast its behavior over the next few decades. Likewise, the history of the megathrust along the 1600-km long rupture of 2004 is too poorly known to venture a strong opinion. Scenarios for future events Four observations are relevant with respect to the future behavior of the Sunda megathrust in the region of the great 1797 and 1833 earthquakes and tsunamis. First, between about 0.5 S and the Equator, it appears that the megathrust does not, for the most part, participate in the generation of great earthquakes. Coral records show that the 1797 and 1833 ruptures halted at the southern edge of this section (Figure 29). Furthermore, the great ruptures of 1861 and 2005 ended near the northern limit (Newcomb and 46
47 McCann [1987]; Briggs et al. [2006]; Figure 22A). The largest sudden rupture of this part of the megathrust in the past 250 years is a 2.3 m slippage during the M w 7.7 earthquake of 1935 [Natawidjaja et al., 2004]. Thus this part of the megathrust is likely a northern barrier to rupture under the Mentawais. Second, the microatolls of Siberut island that emerged in 1797 and possibly 1833 are now at or below the tops of modern living microatolls. This indicates that submergence over the past two centuries has nearly compensated for emergence during those events. If this were not true, we would have found an abundance of 1797/1833 microatolls above water during low tides. In contrast, at all our sites south of about 2 S, 1833 microatolls still protrude above the lowest low tides, generally by a few hundred millimeters. This indicates that strain accumulation since 1833 has not compensated for emergence during that event. A similar conclusion can be drawn for the Batu islands, where heads that emerged in 1935 still reside well above their levels just before that earthquake. Thus, the deficit of strain relief at the latitude of Siberut is greater than to the southeast or northwest, normalized to the size of the previous rupture. One can imagine scenarios for a future megathrust earthquake in which the 150-km-long Siberut section fails separately. But since faults do not always recoup all the strain relieved by a previous earthquake prior to generating another, it is also possible that the Siberut and northern Sipora sections will fail in concert with the next rupture of the sections that failed in A third pertinent observation is that modern seismicity roughly outlines the sides and downdip edges of the 1797 and 1833 ruptures (Figure 29). Since background seismicity commonly is sparse on a locked patch (e.g. Subarya et al. [2006]), the 1797 and
48 downdip limits likely approximate the downdip limits of future ruptures as well. This locked Mentawai patch has a cluster of recent earthquakes between Sipora and Siberut islands. The most recent flurry of earthquakes there were aftershocks that occurred two weeks after the March 2005 Nias-Simeulue M w 8.7 earthquake ( This location coincides with a major change in the character of the 1833 rupture and the cross-over between compensated and overcompensated 1797 and 1833 microatoll populations. High concentrations of stress at this change in 1833-rupture behavior could have made this area unusually sensitive to additional loading by the Nias-Simeulue rupture of The fourth observation relevant to forecasting future ruptures of the locked Mentawai patch concerns the section of the megathrust along the southernmost Sumatran coast, between Enganno island and the Sunda Strait (Figure 1). No one has proposed that the 1833 rupture extended into this region. Is this 300-km-long section is capable of rupturing during a great earthquake? Or is it like the Javan section of the megathrust to the east, alleged to be weakly coupled and capable of generating only moderate to major quakes? SUMMARY AND CONCLUSIONS Records of vertical deformation contained in fossil and modern coral microatolls reveal uplift associated with the great Sumatran earthquake of 1833 (Figure 23). The corals show that along at least a 170-km span of the Sumatran outer-arc ridge, uplift ranged between 1 and 3 m, with pronounced tilts toward the mainland, as occurred during the great rupture of the Sunda megathrust in 2005 [Briggs et al., 2006]. Elastic- 48
49 dislocation modeling of these data yield a preferred forward model characterized by a southeastward increase in slip from 9 to 18 m and a southeastward decrease in the downdip limit of rupture from 50 km to 37 km (Figure 26a). Our data do not allow us to resolve the updip limit of rupture; models with updip limits at 20 km depth (Figure 26c) fit the data nearly as well as our favored model, in which rupture extends all the way to the trench. The pattern of uplift indicates that rupture continued southeast from the Mentawai islands, consistent with the inference from historical accounts that the rupture extended an additional 220 km or so to the southeast. The northwestern limit of rupture is likely at about 2 S, but may have extended as much as 160 km farther northwest with much smaller amounts of slip. The earthquake magnitudes indicated by the range of plausible rupture parameters range from M w 8.7 to 8.9. The coral records demonstrate that significant uplift of the outer-arc islands also occurred 37 years earlier, in 1797 (Figure 24). As in 1833, the islands tilted toward the mainland, but uplift amounts were a factor of two to three smaller where the ruptures overlap. The southeastern limit of uplift in the 1797 event occurs on South Pagai island, so the southeastern limit of rupture is well constrained to about 3.2 S. Our forward models of the 1797 megathrust rupture have rupture lengths of at least 160 km under the islands. The 1797 rupture likely extended northwest 160 km beyond the 1833 rupture, terminating at a section of the megathrust that slips primarily aseismically, near 0.5 S Our favored model has a 360-km long source that consists of four rectangular patches with slips of 4 to 8 m and with downdip limits of rupture that range from 34 to 50 km. We obtain a magnitude of 8.5 for the model with a 20-km deep updip rupture limit and an 8.7 for the case of the megathrust breaking to the seafloor. 49
50 The modeled down-dip limits of the 1797 and 1833 ruptures are similar to the current down-dip limit of the currently locked patch, as judged from background seismicity. History records that both the 1797 and 1833 earthquakes generated large, destructive tsunamis (Appendix 1). Both the shaking and tsunami run-up appears from these accounts to have been more severe in 1797 at Padang, opposite Siberut. This supports our microatoll-based conclusion that the 1797 rupture, though smaller, extended closer to Padang than the 1833 rupture. Our simulations of the 1797 and 1833 tsunamis on the mainland coast yield runup values consistent with historical accounts. Whether values were locally as high as the 20- to 35-m values seen in Aceh in 2004 cannot be resolved without more detailed modeling or observation. However, it is clear from our modeling of the 1797 and 1833 tsunamis that rupture of the megathrust south of the Equator should not be expected to produce large tsunamis along the western coasts of the Bay of Bengal. A significant improvement in our initial assessments of the source parameters of the 1797 and 1833 earthquakes could result from additional work. Certainly there are other microatoll sites along the outer-arc ridge that remain to be sampled. In particular, data from the islands along strike to the southeast, between 3.5 and 5.5 S, could help constrain the magnitude and limits of the 1833 rupture. A more thorough search for vintage 18 th - and 19 th -century microatolls beneath lowest low tides on the fringing reefs of Siberut island would constrain the ruptures of 1797 and 1833 much better there. Moreover, paleoseismic work in the marshes and estuaries of the mainland coast would likely yield important results. On the mainland coast, it may be possible to recover records of submergence and tsunamis associated with a series of late-holocene megathrust ruptures, as at the Cascadia subduction zone and in south-central Chile 50
51 [Atwater et al., 2004]. The absence or presence of submergence during the 18 th and 19 th centuries would provide constraints on the northwestern extent of rupture that are more compelling. Such work might also constrain better the down-dip limits of rupture and the magnitude of slip in both events. These investigations would likely also yield minimum tsunami inundation distances. Similar investigations along the southernmost Sumatran coast could support or refute the hypothesis that southward of 5.5 S and along the coast of Java the megathrust is incapable of producing great earthquakes [Newcomb and McCann, 1987]. Finally, a more thorough search of historical records would likely add substantially to knowledge of the levels of shaking and size of the 1797 and 1833 tsunamis. ACKNOWLEDGMENTS Many friends, colleagues, and family provided critical support of our field efforts in 1997, 2000, 2002 and 2003, particularly Imam Suprihanto, Susi Mardia, and Dudi Prayudi. Maarten Schmidt translated historical Dutch accounts of the earthquakes and tsunamis and Juniator Tulius found many of them. Jenny Briggs translated the German accounts. Historian Jeffrey Hadler helped us find and interpret historical information. Thorough, thoughtful reviews by Brian Atwater and Harvey Kelsey helped us clarify many points and correct mistakes in the manuscript. Carrie Sieh helped improve the figures. Finally, we are greated indebted to the many people of mainland West Sumatra and the Mentawai islands, for their hospitality and friendship. This research was supported by NSF grants EAR , , and (to KS), EAR , , and (to RLE), and EAR (to SNW) and by the 51
52 Indonesian International Joint Research Program (RUTI). This is contribution number 15 of the Tectonics Observatory, Caltech. REFERENCES Abercrombie, R. E., Antolik, M., Ekstrom, G. (2003), The June 2000 M-w 7.9 earthquakes south of Sumatra: Deformation in the India-Australia Plate, J. Geophys. Res., 108(B1), 2018, doi: /2001jb000674, Allen, C. (1968), The tectonic environments of seismically active and inactive areas along the San Andreas fault system, in Proceedings of Conference on Geological Problems of the San Andreas Fault System, Stanford Univ. Publ. Geol. Sci., Palo Alto, California. Atwater, B., Tuttle, M., Schweig, E., Rubin, C., Yamaguchi, P., Hemphill-Haley, E. (2004), Earthquake recurrence inferred from paleoseismology, Developments in Quaternary Science, 1. Bock, Y., Prawirodirdjo, L., Genrich, J., Stevens, C., McCaffrey, R., Subarya, C., Puntodewo, S., Calais, E. (2003), Crustal motion in Indonesia from Global Positioning System measurements, J. Geophys. Res., 108(B8),2367 doi: /2001JB Boelhouwer, J. C. (1841), Herinneringen van mijn verblijf op Sumatra's westkust gedurende de jaren, , edited, 's-gravenhage: Doorman (The Hague). Briggs, R., K. Sieh, A. Meltzner, D. Natawidjaja, J. Galetzka, B. Suwargadi, Y.-J. Hsu, M. Simons, N. Hananto, I. Suprihanto, D. Prayudi, J.-P. Avouac, L. Prawirodirdjo and Y. Bock (2006), Deformation and slip along the Sunda megathrust during the giant Nias-Simeulue earthquake of March 2005, Science, xxx, yyy. Carver, G., Plafker, G., Metz, M., Cluff, L., Slemmons, B., Johnson, E., Roddick, J., Sorensen, S. (2004), Surface rupture on the Denali fault interpreted from tree damage during the 1912 Delta River M-w earthquake: Implications for the 2002 Denali fault earthquake slip distribution., Bull. Seismol. Soc. Am., 94, S58-S71. Cheng, H., Adkins, J., Edwards, R., Boyle, E. (2000), U-Th dating of deep-sea corals, Geochimica et Cosmochimica Acta 64(14), , doi: /S (99) Chhibber, H. (1934), Geology of Burma, 538 pp., McMillan, London, England, UK. 52
53 Chlieh, M., Avouac, J-P., Sieh, K., Prawirodirdjo, L., Bock, Y., Hjorleifsdottir, V., Ji, C., Hebert, H., Sladen, A., Natawidjaja, D., Subarya, C., Galetzka, J.,(2005) Coseismic Slip and afterslip associated to the Mw9.14 Aceh-Andamen Earthquake., paper presented at AGU Fall Meeting, San Francisco, CA. Church, J., and N. White (2006) A 20 th century acceleration in global sea-level rise, Geophys. Res. Lett., 33, L01602, doi: /2005GL Cobb, K. M., Charles, C., Cheng, H., Kastner, M., Edwards, R. (2003), U/Th-dating living and young fossil corals from the central tropical Pacific, Earth. Planet. Sci. Letts., 210,(1-2), , doi: /S X(03) Darwin, C. (1842), The Structure and Distribution of Coral Reefs, 278P, Smith, Elder & Co., London, England, UK. Deplus, C., Diament, M., Hébert, H., Dubois, J., Patriat, P., Sibilla, J., Bertrand, G., Dominguez, S., Malod, J., Pontoise, B. (1998), Direct evidence of active deformation in the eastern Indian oceanic plate, Geology, 26, (2), , doi: / DeShon, H., Engdahl, E., Thurber, C., Brudzinski, M. (2005) Constraining the boundary between the Sunda and Andaman subduction systems: Evidence from the 2002 M w 7.3 Northern Sumatra earthquake and aftershock relocations of the 2004 and 2005 great earthquakes. doi: /2005GL024188, 2005, Geophys. Res. Lett., 32. de Stuers, H. (1849) De Vestiging en Uitbreiding der Nederlanders ter Westkust van Sumatra, 1 of 2 vols. Amsterdam: P. N. van Kampen, cx, 239. du Puy, J. (1845), Een aantekeningen omtrent vuurbergen en aardbevingen op Sumatra, Tijdschrift voor Neerland's Indie, 7. du Puy, J. (1847), Een paar aantekeningen omtrent vuurbergen en aardbevingen op Sumatra, Tijdschrift voor Neerland's Indie, 9. Eberhart-Phillips, D., Haeussler, P., Freymueller, J., Frankel, A., Rubin, C., Craw, P., Ratchkovski, N., Anderson, G., Carver, G., Crone, A., Dawson, T., Fletcher, H., Hansen, R., Harp, E., Harris, R., Hill, D., Hreinsdottir, S., Jibson, R., Jones, L., Kayen, R., Keefer, D., Larsen, C., Moran, S., Personius, S., Plafker, G., Sherrod, B., Sieh, K., Sitar, N., Wallace, W. (2003) The 2002 Denali Fault Earthquake, Alaska: A large magnitude, slip-partitioned event, Science, 300, Edwards, R. L., Chen, J., Ku, T., Wasserburg, G. (1987), Precise timing of the last interglacial period from mass spectrometric determination of 230Th in corals, Science, 236,
54 Edwards, R. L., Taylor, F., Wasserburg, G. (1988), Dating earthquakes with highprecision thorium-230 ages of very young corals, Earth Planet. Sci. Lett., 90, (4) Engdahl, E., van der Hilst, R., Buland, R. (1998), Global teleseismic earthquake relocation with improved travel times and procedures for depth determination, Seis. Soc. of Amer. Bull., 88, (3) Fitch, T.(1972), Plate convergence, transcurrent faults, and internal deformation adjacent to southeast Asia and the western Pacific, J. Geophys Res, 77 (23), Gagan, M., Sieh, K., Hantoro, W., Lynch, H., Edwards, R., Zachariesen, J. (2000), Coral microatoll seismochemistry and the great Tambora eruption of 1815 AD, paper presented at 9th International Coral Reef Symposium, Bali, Indonesia, October 23-27, Hsu, Y., Simons, M., Avouac, J-P., Sieh, K., Briggs, R., Meltzner, A., Bock, Y., Subarya, C., Prawirodirdjo, L. (2005), Coseismic and Postseismic Slip on the Sumatran Megathrust following the 2005 Nias-Simeulue, Indonesia Earthquake, paper presented at AGU Fall Meeting, San Francisco, CA. Jacoby, G., Sheppard, P., Sieh, K. (1988), Irregular recurrence of large earthquakes along the San Andreas fault in southern California -- Evidence from trees near Wrightwood, Science, 241, Kanamori, H. (1973), Mode of strain release associated with major earthquakes in Japan, Earth Planet. Sci. Annual Reviews, 1, Katili, J. A., and F. Hehuwat (1967), On the occurence of large transcurrent faults in Sumatra, Indonesia, Journal of Geoscience, 10, Knutson, D. W.,Smith S., Buddemei, R. et al. (1972), Coral Chronometers - Seasonal Growth Bands In Reef Corals, Science, 177, 270-& Krempf, A. (1927), La forme des recifs corallines et le regime des vents alternants, Mem. Trav. Serv. Oceanogr. Peche Indochine, 2, 1-3. Lay, T., Kanamori, H., Ammon, C., Nettles, M., Ward, S., Aster, R., Beck, S., Bilek, S., Brudzinski, M., Butler, R. DeShon, H., Ekström, G., Satake, K., Sipkin, S. (2005), The great Sumatra-Andaman earthquake of 26 December 2004, Science, 308, McCaffrey, R. (1991), Slip vectors and stretching of the Sumatran fore arc, Geology, 19,
55 Melbourne, T. I., Webb, F., Stock, J., Reigber, C. (2002), Rapid postseismic transients in subduction zones from continuous GPS, J. Geophys. Res. 107, art. no Meriaux, A., Sieh, K., Rubin, C., Ryerson, F., Finkel, R. Meltzner, A., Taylor, M. (2004), Kinematics of the southern Alaska constrained by westward-decreasing post-glacial slip-rates on the Denali fault, Alaska., paper presented at AGU Fall Meeting, San Francisco, CA, USA. Mueller, S., and L. Horner (1855), Reizen en onderzoekingen in Sumatra gedaan op last der Nederlandsche regering tussen de jaren 1833 en 1838, 1855, 's-gravenhage: Furi (The Hague). Nalbant, S., Steacy, S., Sieh, K., Natawidjaja, D., McCloskey, J. (2005), Earthquake risk on the Sunda trench, Nature, 435, Natawidjaja, D. (2003), Neotectonics of the Sumatran Fault and paleogeodesy of the Sumatran subduction zone, Ph.D thesis, 371pp, California Institute of Technology, Pasadena, California, USA, September 27, Natawidjaja, D., K. Sieh, J. Galetzka, H. Cheng, R.L. Edwards, B. Suwargadi (in review), Interseismic deformation above the Sunda Megathrust recorded in coral microatolls of the Mentawai islands, West Sumatra, J. Geophys. Res. Natawidjaja, D., Sieh, K., Ward, S., Cheng, H., Edwards, R., Galetzka, J., Suwargadi, B (2004), Paleogeodetic records of seismic and aseismic subduction from central Sumatran microatolls, Indonesia, J Geophys Res, 109. Netscher, E. (1881) Padang in het laatst der XVIIIe eeuw, Verhandelingen van het Batviaasch Genootschap van Kunsten en Wetenshappen, 41 (7) 122. Newcomb, K., and W. McCann (1987), Seismic History and Seismotectonics of the Sunda Arc, J. Geophys. Res., 92, Okada, Y. (1992), Internal deformation due to shear and tensile faults in a half space., Bull. Seism. Soc. Am., 82, Prawirodirdjo, L., Bock, Y., Genrich, J., (1999), One century of tectonic deformation along the Sumatran Fault from triangulation and GPS surveys, J.Geophys.Res. 105 (B12) Prawirodirdjo, L., Bock, Y., McCaffrey, R. (1997), Geodetic observations of interseismic strain segmentation at the Sumatra subduction zone, Geophys. Res. Lett., 24, (21)
56 Rivera, L., Sieh, K., Helmberger, D. (2002), A Comparative Study of the Sumatran Subduction-Zone earthquakes of 1935 and 1984, Bull. Seism. Soc Am, 92, (5) Saji, N. H., Goswami, B., Vinayachandran, P., Yamagata, T. (1999), A dipole mode in the tropical Indian ocean., Nature, 401, Savage, J. (1983), A dislocation model of strain accumulation and release at a subduction zone, J. Geophys. Res, 88, Sawai, Y., Satake, K., Kamataki, T., Nasu, H., Shishikura, M., Atwater, B., Horton, B., Kelsey, H., Nagumo, T., Yamaguchi, M. (2004), Transient uplift after a 17th century earthquake along the Kuril subduction zone., Science, 306, Scoffin, T. P., and D. R. Stoddart (1978), The nature and significance of microatolls, Philos. Trans. R. Soc. London, Series B, 284, Shen, C.-C., Edwards, R., Cheng, H., Dorale, J., Thomas, R., Moran, B., Weinstein, S., Edmonds, H. (2002), Uranium and thorium isotopic and concentration measurements by magnetic sector inductively coupled plasma mass spectrometry, Chemical Geology, 185, (3-4) Sieh, K., S. Ward, D. Natawidjaja, B. Suwargadi (1999), Crustal deformation at the Sumatran subduction zone revealed by coral rings, Geophysical Research Letters, 26, Sieh, K. (1984), Lateral offsets and revised dates of large earthquakes at Pallett Creek, California, J. Geophys. Res., 89, Sieh, K. (2005), Aceh-Andaman earthquake: What happened and what's next? Nature, 434, 573. Sieh, K., and D. Natawidjaja (2000), Neotectonics of the Sumatran fault, Indonesia, J. Geophys. Res., 105, 28, ,326. Sieh, K., Stuvier, M., Brillinger, D. (1989), A more precise chronology of earthquakes produced by the San Andreas fault in southern California, J.Geophys.Res., 94, Subarya, C., Chlieh, M., Prawirodirdjo, L., Avouac, J.P., Bock, Y., Sieh, K., Meltzner, A., Natawidjaja, D., McCaffrey, R.(2006), Plate-boundary deformation associated with the great Sumatra-Andaman earthquake, Nature. 56
57 Taylor, F. W., Edwards, R. Wasserburg, G. (1990), Seismic recurrence intervals and timing of aseismic subduction inferred from emerged corals and reefs of the central Vanuatu (New Hebrides) frontal arc, J. Geophys. Res., 95, Taylor, F. W., Frohlich, C. Lecolle, J., Strecker, M. (1987), Analysis of partially emerged corals and reef terraces in the central Vanuatu arc: Comparison of contemporary coseismic and nonseismic with Quaternary vertical movements, J. Geophys. Res., 92, Thatcher, W., and J. Rundle (1984), A viscoelastic coupling model for the cyclic deformation due to periodically repeated earthquakes at subduction zones, J. Geophys. Res., 89, Verkerk, P., A.W.P. (1870), Palembangsche schetsen I, De Gids, 8. Vigny, C., Socquet, A., Rangin, C., Chamot-Rooke, N., Pubellier, M., Bouin, M., Bertrand, G., Becker, M. (2003), Present day crustal deformation around Sagaing fault, Myanmar, J. Geophys. Res., 108. Ward, S. (2001), Landslide tsunami, J. Geophys. Res., 106, Weldon, R., Scharer, K., Fumal, T., Biasi, G. (2004), Wrightwood and the earthquake cycle: What a long recurrence record tells us about how faults works, GSA Today, 14, Wichmann, A. (1918), Die Edbeben des Indischen Archipels bis zum Jahre Verhandlingen der Koninklijke Akademie van Wetenschappen te Amsterdam (Tweede Sectie). Deel XX. No. 4. Johannes Müller, Amsterdam. [In German.]. Yalciner, A., Perincek, P., Ersoy, S., Presateya, G., Hidayat, R., McAdoo, B. (2005), December 26, 2004 Indian Ocean Tsunami Field Survery (Jan , 2005) at North of Sumatra Island. Zachariasen, J. (1998), Paleoseismology and Paleogeodesy of the Sumatran Subduction Zone: A Study of Vertical Deformation Using coral Microatolls, Ph. D. thesis, 418 pp, California Institute of Technology, Pasadena, California, USA, October 3, Zachariasen, J., Sieh, K., Taylor, F., Edwards, R., Hantoro, W. (1999), Submergence and uplift associated with the giant 1833 Sumatran subduction earthquake: Evidence from coral microatolls, J.Geophys.Res., 104, Zachariasen, J., Sieh, K., Taylor, F., Hantoro, W. (2000), Modern vertical deformation at the Sumatran subduction zone: Paleogeodetic Insights from Coral Microatolls, Bull.Seism.Soc.Am., 90,
58 58 Natawidjaja et al.,
59 TABLES Table Th ages of Sumatran microatolls reported in this paper. Samples have been dated by the U-Th disequilibrium method (Edwards et al. [1987]), modified as described by Cheng et al. [2000], at the University of Minnesota. In the 232 Th column, ppt refers to parts per trillion by mass. Ages and 234 U values are calculated using decay constants from Cheng et al. [2000]. Uncorrected 230 Th ages are calculated assuming no initial 230 Th. Corrected 230 Th ages are our best estimate of the true age on the basis of the samples isotopic composition. The ages are corrected for initial 230 Th assuming an initial atomic 230 Th/ 232 Th ratio of (6.5±6.5) x10-6. This value is specific to corals from this area [Zachariasen et al., 1999]. Under Calendar Year, the years on the left side of the column are determined by subtracting the corrected 230 Th age from the date of analysis. The initial 234 U value is calculated from the measured 234 U value using the corrected 230 Th age. U-Th data for samples from Si94A6 are in Zachariasen et al. [1999]. Sample 238 U 232 Th δ 234 U* 230 Th/ 238 U 230 Th Age 230 Th Age (Year) (Year) Site Number (ppb) (ppt) (measured) (activity) (uncorrected) (corrected) Ca Bangkaulu Bkl03A1-1b 2205 ± ± ± ± ±4 198 ±35 18 (Bkl) Bkl03A1-2b 2230 ± ± ± ± ±4 223 ±49 17 Bkl03A3-1a (I) 2142 ±3 247 ± ± ± ±4 11 ±6 1 Bkl03A3-1a (II) 2147 ±5 176 ± ± ± ±4 19 ±5 1 Bkl03A3-2a 2354 ±5 306 ± ± ± ±3 46 ±6 1 Bkl03A2-1b 2087 ±2 243 ± ± ± ±3 205 ±5 1 Sibelua 2098 ±2 831 ± ± ± ±3 193 ±15 18 Sbl02A1-1a (Sbl) Sbl02A1-2b 2124 ± ± ± ± ±3 247 ±35 17 Sbl02A1-4a 2103 ± ± ± ± ±4 313 ±
60 Sbl02A2-2a (I) 2203 ± ± ± ± ±6 57 ±27 19 Sbl02A2-2a (II) 2180 ± ± ± ± ±3 63 ±29 19 Pitogat Ptg00A2#1a 2363 ± ± ± ± ±6 228 ±24 17 (Ptg) Ptg00A2#3b 2368 ±3 628 ± ± ± ±4 260 ±5 1 PTG00A1#2a 2404 ± ± ± ± ±4 36 ±75 19 PTG00A1#2b 2675 ± ± ± ± ±3 53 ±30 19 λ 230 = x 10-6 y -1, λ 234 = x 10-6 y -1, λ 238 = x y -1. *δ 234 U = ([ 234 U/ 238 U] activity 1)1000. ** δ 234 U initial was calculated based on 230 Th age (T), i.e., δ 234 U initial = δ 234 U measured (e λ234xt ). Table 2. Locations of all microatolls used in this study, determined with handheld GPS receivers. We have found the locations are repeatable from year to year to within about 10 meters or less. Site Sample Longitude Latitude Badgugu, Tanamasa Bdg00A Silogui, Siberut Slg02A Teluk Saibi Tsa00A Pitogat, Sipora Ptg02A Pitogat, Sipora Ptg02A Siruamata, Sipora Si94A Siruamata, Sipora Srm00A Sikici-Site B, Sipora Skc03B Sikici-Site A, Sipora Skc00A Silabusabeu, North Pagai Slb00A Silabusabeu, North Pagai Slb00A Silabusabeu, North Pagai Slb00A Silabusabeu, North Pagai Slb00A Silabusabeu, North Pagai Np94A Simanganya-Site C, N. Pagai Smy03C Simanganya-Site A, N. Pagai Np00A Singingi, South Pagai Sgg03A Singingi, South Pagai Sgg03A Singingi, South Pagai Sgg03A Singingi, South Pagai Sgg03A
61 Sibelua, South Pagai Sbl02A Sibelua, South Pagai Sbl02A Bulasat, South Pagai Bls02A Saomang, South Pagai Smg02A Bangkaulu, South Pagai Bkl03A Bangkaulu, South Pagai Bkl03A Bangkaulu, South Pagai Bkl03A Tinopo, South Pagai P96K Siatanusa, South Pagai P96J Teluk Tiop, South Pagai P96H Natawidjaja et al., Table 3. Calculated tsunami runup values at six sites for the 1797, 1833 and 2004 events (in meters). Bold values are for coastal sites closest to the tsunami source. Italicized values are for open-ocean sites closest to the tsunami source. Refer to Figure 28 for locations A 0.19 m B C Meulaboh Padang Bengkulu Table S Th ages from samples of the microatolls described in the supplementary materials to this paper. See caption of Table 1 for details. Sample 238 U 232 Th δ 234 U* 230 Th/ 238 U 230 Th Age 230 Th Age Cale (Year) (Year) Site Number (ppb) (ppt) (measured) (activity) (uncorrected) (corrected) Y Singingi Sgg02A1-1a 2563 ± ± ± ± ±3 213 ± (Sgg) Sgg03A1-2b 2363 ±3 671 ± ± ± ±4 257 ± Sgg03A2-1b 2250 ±2 961 ± ± ± ±3 185 ±
62 Sgg03A2-2a (I) 2206 ±2 620 ± ± ± ±3 235 ± Sgg03A2-2a (II) 2209 ±2 687 ± ± ± ±3 232 ± Sgg03A3-1b 2348 ±3 579 ± ± ± ±2 7 ±9 199 Sgg03A3-2b 2310 ± ± ± ± ±2 31 ± Silabu SLB00A2#1a 2771 ±7 785 ± ± ± ±6 280 ± (Slb) SLB00A2#3a 2526 ±7 755 ± ± ± ±5 348 ± SLB00A3#1b 2668 ± ± ± ± ±4 181 ± SLB00A3#2a 2675 ±4 445 ± ± ± ±3 229 ±7 177 SLB00A34b 2787± ± ± ± ±6 256 ± SLB00A4#2b 2469 ± ± ± ± ±3 229 ± SLB00A4#2b 2373 ± ± ± ± ±4 235 ± ± ± ± ± ±3 208 ± Silogui Slg02A1-1b (Slg) Slg02A1-3b 2353 ± ± ± ± ±3 254 ± λ 230 = x 10-6 y -1, λ 234 = x 10-6 y -1, λ 238 = x y -1. *δ 234 U = ([ 234 U/ 238 U] activity 1)1000. ** δ 234 U initial was calculated based on 230 Th age (T), i.e., δ 234 U initial = δ 234 U measured (e λ234xt ). Corrected 230 Th ages assume the initial 230 Th/ 232 Th atomic ratio of 6.5 ±6.5 x10⁻⁶. This value is specific to corals from this area [Zachariasen et al., 1999]. 62
63 FIGURE CAPTIONS Figure 1. Tectonic and seismic setting of the Mentawai section of the Sunda megathrust. In the aftermath of the two giant Sumatran megathrust earthquakes of 2004 and 2005, the nature of past ruptures south of the Equator is particularly worth investigating. The Mentawai islands (Mt) include all the islands within the ellipse labeled 1797&1833 and are the focus of this study. Ss = Sunda Strait. En = Enggano island; Bt = Batu islands; Ni = Nias island; Sm = Simeulue island; Nb = Nicobar islands; An = Andaman islands. NER and IFZ = Ninety-East Ridge and Investigator Fracture Zone. Intervening nearly north-south lines are other oceanic fracture zones and intervening east-west lines are fossil spreading centers. Figure 2. Map of sampled sites on the Sumatran outer-arc islands that have evidence for emergence in 1797 and/or Data from three sites (Tiop bay, Siatanusa and Tinopo) are from Zachariasen et al. [1999]. Siberut, Sipora, North Pagai and South Pagai are the largest of the Mentawai islands. Numbers in parentheses refer to figures in the text and in the supplementary materials that illustrate data from the sites. Figure 3. Oblique aerial photograph of the Siruamata site. Fossil microatoll Si94A6 is underwater in the lower left corner of the image. The sampled living microatoll Srm00A1 is in front of the sparse mangroves in the center right. View is approximately southward. Naming convention for coral heads and samples is this: First two or three letters are abbreviations for the the site or island name; next two numbers refer to the year the coral was studied or sampled; next letter indicates the sub-site on the island; last number is a specific number for the coral head. Hence, 63
64 Srm00A1 denotes the first head measured or sampled (1) at the first site studied (A) on Siruamata island (Srm) in the year 2000 (00). Figure 4. Map of the Siruamata site shows the location of the slabbed modern microatoll (Srm00A1) and fossil microatolls described by Zachariasen et al. [1999]. Figure 5. Modern history of sea-level change revealed in microatoll Srm00A1 at Siruamata. A. Drawing of the vertical face of a radial cut through the coral microatoll. Concentric annual growth bands indicate unimpeded lateral and vertical growth, when corallites are growing below the level of lowest low tide, which is just a few below the highest level at which they can survive (HLS). Heavy lines are unconformities, commonly formed when upward growth is unimpeded by aerial exposure during lowest low tides, but also caused by tectonic emergence above lowest low tides. Dates of formation of the annual bands were determined by counting inward from the outer perimeter, which was living when the slab was collected, in mid Date uncertainites reflect ambiguities in that count. In this microatoll, progressively higher HLS unconformities in about 1962, 1974, 1983, 1994 and 1997 indicate rapid submergence since B. Graph of HLS history derived from the microatoll cross-section shows an average rate of submergence of about 8 mm/yr for the past five decades. Circles denote HLS unconformities. Squares indicate eroded HLS unconformities. Small triangles show highest level of coral growth for years in which the entire coral head was growing below HLS. These are lower bounds on HLS. Figure 6. Stratigraphic analysis of slab Si94A6 (modified from Zachariasen et al. [1999], using U-Th dates in that paper). The dates of the annual rings are assigned so 64
65 that a δ 13 anomaly in the thin outer bands coincides with 1815, the year of the eruption of Tambora in 1815 [Gagan et al., 2000]. This gives the year 1797 as the last year during which thick annual bands formed. Hence, the prominent 700-mm emergence probably occurred in 1797, the year of a large historical, tsunamigenic earthquake in west Sumatra. Figure 7. Combination of HLS histories from the fossil and modern heads at Siruamata yields an estimate of about 1.2 m for coseismic emergence in Symbols are same as in Figure 6. Figure 8. Map of the Bangkaulu site on southern South Pagai island. Two fossil heads (Bkl03A1 and A2) and a modern head (Bkl03A3) constrain emergence in 1833 and show that no uplift occurred here in Between the site and Bangkaulu village, undated tsunami blocks up to 2 m in diameter are common. Figure 9. Photograph of numerous small Goniastrea microatolls and mangroves near the beach at the Bangkaulu site. View is toward the northwest. Figure 10. Modern history of sea-level change revealed in microatoll Bkl03A3 at Bangkaulu. A. Cross-section shows clear HLS unconformities in about 1962, 1976, 1980, and 1990, and in the El Niño years 1994 and The small open circles (in this and other cross-sections) are drill holes that preserve a record of horizontality during analysis. B. Graph of HLS elevation versus time shows four decades of submergence at an average rate of about 7 mm/yr. Figure 11. Pre-1833 history of sea-level change revealed in fossil Porites microatoll Bkl03A1 at Bangkaulu. A. Cross-section shows rapid submergence through seven decades in about the mid- to late 18 th century. U-Th dates yield averaged date of 65
66 1827 ± 28 for outermost band. Date of 1805 ± 5 date on annual band in contemporaneous nearby Goniastrea head shows that this population died no sooner than Thus, we assign dates of 1757 and 1770 to the major HLS unconformities, because they are consistent with the dates of lesser tsunamigenic earthquakes. This is consistent with the U-Th dates and only 5 or so years of erosion of the perimeter, if it emerged in The high quality of the annual bands in this sample leads to no uncertainty in band counting. B. Graph of HLS history shows that the submergence rate averaged about 6 mm/yr during the seven decades prior to Figure 12. The HLS time-series at Bangkaulu shows that this site did not emerge during the 1797 event, but rose about 1.8 m in Figure 13. Map of the Sibelua site on the northeastern coast of South Pagai island. The belt of dead mangrove snags on the perimeter of the living forest is evidence of submergence over the past few decades. Fossil microatoll Sbl02A1 and modern microatoll Sbl02A2 yielded clear HLS time-series. Arrow shows approximate view direction in Figure 15. Figure 14. Modern history of sea-level change revealed in microatoll Sbl02A2 at Sibelua. A. Pattern of annual bands in cross-section of modern head shows two periods of uninhibited upward growth between three periods of relative HLS stability. B. HLS time-series for the modern head at Sibelua yields an average rate of submergence of about 6 mm/yr for the past 5 decades. Figure 15. Photograph of fossil microatoll Sbl02A1 at Sibelua, from the boughs of a mangrove snag, shows the hat shape of the head a raised central disk surrounded by a low outer brim. View is approximately toward the northwest. 66
67 Figure 16. Fossil Porites microatoll Sbl02A1 records more than a century of relative sealevel changes at Sibelua before uplift in A. Annual bands show an abrupt emergence in the late 1700s, steady submergence in the decades before and after, and emergence in about The annual bands that formed in the 15 years before 1797 were partially eroded after emergence in U-Th date of 1812 ± 15 supports interpretation that final emergence and death occurred in B. HLS time-series shows rates of about 6 mm/yr before and 4 mm/yr after emergence late in the 1700s. Figure 17. HLS time-series from modern and fossil microatolls at Sibelua shows 0.5 m uplift in 1797 followed by 1.1 m uplift in Figure 18. Map of Pitogat site on northwestern flank of Sipora island shows the classic marks of an oscillating sea level. The beach has transgressed over the muddy and peaty substrate of the swamp, in which mangrove snags are rooted. Fossil heads that underlie the peat and mud indicate that uplift raised the heads above their HLS. We cut samples of modern microatoll Ptg00A1 and fossil microatoll Ptg00A2 Figure 19. Modern history of sea-level change revealed in microatoll Ptg00A1 at Pitogat site. A. Annual bands in vertical, radial cross-section show submergence followed by emergence. Unconformities in the oldest part of the head obscure HLS history prior to B. Graph of modern HLS history. Rise of HLS at about 6 mm/yr began in 1962 and continued until Since 1988 HLS has been nearly stable, except for the prominent die-down of the living perimeter during the regionally extensive death of Mentawai and Batu islands reefs in Figure 20. Pre-1797 history of sea-level change revealed in fossil Porites microatoll Ptg00A2 at Pitogat site. A. Cross-section of fossil head. This head grew during the 67
68 last six decades of the 18 th century and probably died because of emergence in The two most prominent HLS unconformities in the record may have occurred in the years of two historically known tsunamigenic earthquakes, 1756 and U-Th date of 1745 ± 5 near center of microatoll implies a date of about 1789 for the outermost ring, consistent with several years of erosion after uplift in B. HLS time-series for Pitogat site shows submergence at high rates throughout the last half of the 18 th century. Figure 21. HLS time-series for Pitogat site, eastern Siberut island. Combined emergence associated with the 1797 and 1833 events is about 1.1 m. Lacking additional constraints, the nature of partitioning of slip between the 1797 and 1833 events is uncertain. Figure 22. HLS histories for ten sites not discussed in detail in this paper (See Figure 2 for locations). These records place important constraints on vertical deformation associated with the 1797 and 1833 earthquakes. A. Badgugu (Bdg, southern Batu islands). B. Silogui (Slg, northeast coast Siberut). C. Sikici (Skc, northeast coast Sipora). D. Simanganya (Smy, northeast coast North Pagai). E. Silabu (Slb, west coast of North Pagai). F. Singingi (Sgg, northeast coast South Pagai). G. Bulasat/Saomang (Bls and Smg, southwest coast South Pagai). H. Tiop bay (Tnp, southwest South Pagai). I. Tinopo islet (Tnp, southern South Pagai archipelago). J. Siatanusa islet (Stn, southern South Pagai archipelago). Data supporting B, E, and F are in the electronic supplement to this paper. History after 1935 in A is in Natawidjaja et al. [2004]. Time-series H, I, and J are from data in Zachariasen et al. [1999]. Use of multiple colors in individual panels indicates HLS time-series from 68
69 different microatolls or different parts of the same microatoll at a site. Time-series P96F1 in panel G is corrected downward 100 mm, because it is an HLS record from a Goniastrea microatoll; Goniastrea HLS is about 100 mm higher than Porites HLS (Appendix 2). Figure 23. Maps of uplift associated with the 1833 earthquake show that a large region raised between 1 and 2 m. A prominent feature is the tilt of the islands toward the northeast. Emergence diminished greatly (a) or ended (b) toward the northwest in the strait between Sipora and Siberut islands. The coral data do not constrain the southeastern limit of emergence. Star shows location of April 10 M w 6.8 aftershock of the March 28, 2005, Nias-Simeulue earthquake. Dashed circle outlines region of aftershocks of that earthquake. Figure 24. Maps of uplift associated with the 1797 earthquake. Uplift ranges as high as about 80 cm, much less than in The southeastern edge of uplift occurs along the southeastern shores of South Pagai island, and the northwestern edge is in the Batu islands. a. Contours of uplift assuming nearly equal partitioning of slip between 1797 and 1833 events at Silogui (Slg) and Pitogat (Ptg). b. Contours of uplift assuming no uplift at Silogui and Pitogat occurred in Figure 25. A survey of plausible fits to the uplifts of 1833, in which a rectangular rupture patch with uniform slip extends updip to the trench. A. χ 2 values as a function of downdip rupture limit and slip. Although models with about 7 m of slip and 45- to 50-km downdip rupture depths fit best, no uniform model fits well. B. Plots of uplift patterns for transects across Sipora, North Pagai and South Pagai drawn perpendicular to trench strike display the fits of nine models to data from the coastlines of each 69
70 island. Each island s data (dots) are fit best with different slip values and down-dip limits of rupture. This warrants a search for composite forward models. Figure 26. Composite forward models for the 1833 rupture beneath the Mentawai islands. A. Map view of model in which slip extends updip to the trench. Red contours are modeled uplift and subsidence; colored dots are data. Slip increases from 9 m on the northwestern patch to 18 m on the southeastern patch. Depth of the downdip limit of rupture decreases southeastward from 50 to 37 km. B. Graph of uplift versus distance from the trench shows separately the fit to the data from Sipora, North Pagai and South Pagai. C. Map view of alternative rupture model for the 1833 earthquake, in which the updip limit of faulting is at a depth of 20 km. Slip in this model varies from 7 m in the northwest to 10 m in the southeast. D. The fit to the data is not as good as in case of slip extending to the trench. Nonetheless, a comparison of this fit with that in Figure 26b shows that the coral data are insensitive to slip on the megathrust near the trench. Figure 27. Composite forward model for the 1797 rupture beneath the Mentawai islands, in which slip extends updip to the trench. a. Map view of the four rectangular patches used to fit the data. Red contours are modeled uplift and subsidence; colored dots are data. Slip varies from 4 to 8 m and the downdip limit of rupture varies between 34 and 45 km. b. Graphs of uplift versus distance from the trench show separately the fit to the data from Siberut, Sipora, North Pagai/South Pagai and southern South Pagai. Figure 28. Model of the 1833 tsunami 45 minutes after the megathrust rupture. Red-toyellow band shows positive values of the wave; blue-to-red band shows negative 70
71 values relative to calm sea level. Yellow dots show average runup of tsunami at specific locations along coastlines. Yellow stars show locations of six hypothetical tide gauges, whose tsunami records are on the left. Modeled 1833 average tsunami runup at Bengkulu (5.7 m) is slightly higher than modeled runup of the 2004 tsunami at Meulaboh. Figure 29. Map of the 1797 and 1833 rupture planes and modern seismicity shows that modern seismicity is low in the region of the great ruptures but high in the surrounding regions. This suggests that the modern locked patch is similar in dimension to the patches that broke in 1797 and Epicenters are from the Harvard CMT catalog for the period 1977 to 2005 ( Figure A1. Maps of Padang that includes locations mentioned in historical accounts of the 1797 and 1833 earthquakes and tsunamis. A. Padang in 1781 was a small settlement of a few dozen private and government structures about a kilometer from the sea. Reports indicate that the 1797 tsunami carried a large English ship from its anchorage near the river mouth to the part of the town north of the Fort called the Bird Market. The tsunami also carried smaller boats to the large market, east of the main town. Adapted from Netscher [1881]. B. Padang in 1828 was a larger settlement, but still concentrated upstream from the river mouth. The tsunami surge in 1833 is reported to have been 3 to 4 meters high at the coast. Adapted from de Stuers [1849]. C. Map of the modern city of Padang shows that dense settlement extends from the shoreline landward for more than 3 kilometers and is mostly less than 5 meters above sea level. Bird Market Streets may mark the location of the bird 71
72 market, where the English ship was deposited by the tsunami surge in 1797). The 2005 map is drafted from satellite imagery. Location of Bird Market Streets and Batang Arau Hotel are constrained by handheld GPS determinations. Figure A2. Response of an idealized coral microatoll to changes in sea level. A. Vertical cross-section of the microatoll shows growth of annual bands from A to I. Changes in sea level several times in the 32-year long period lead to changes in pattern of growth. B. Graph of sea level versus time shows years when growth unconformities record lowest annual low tide level (dots) and years when level of highest corallites provide only a minimum constraint (triangles). The highest level of survival of the corals (HLS)is actually a few centimeters higher than lowest low tide. Figure S1. Photographs of the Singingi site, off the northeast coast of South Pagai island. A. Oblique aerial view looking toward the northwest. Sampled microatolls are below water level, between the small stand of isolated mangroves and the northern tip of the wooded islet in the foreground. Photograph taken January 10, 2005, near the time of high tide. The white arrow indicates approximate location of ground photo. B. Ground view toward the north at a time of lower tide shows the mangrove snags on the shallow reef. During lowest tides, the surface in the foreground is exposed above water. Figure S2. Map of the Singingi site shows broad shallow reef east of mangrove thicket. Zone of mangrove roots and snags is indication of recent submergence. Sampled microatoll Sgg03A3 is representative of Porites coral heads living on the edge of the shallow reef. Microatolls A1 and A2 record uplift in 1797 and
73 Figure S3. The record of sea-level change in living microatoll Sgg03A3. A. Crosssection of the microatoll shows growth of annual bands during the past half-century. B. Graph of HLS history from the microatoll shows submergence rate since about 1970 has been quite low only about 2 mm/yr. An episode of rapid submergence in the 1960s pushes the average rate of the past four decades to about 7 mm/yr. Figure S4. Record of sea-level change in fossil microatoll Sgg03A1. A. Photograph of the microatoll shows the distinct series of terraces that step up away from its center, a typical morphological indicator of submergence over several decades. B. Crosssection shows that the raised rims formed during a period of rapid submergence. The central flat signifies two decades of near stability of the HLS. U-Th ages are consistent with death of the head in C. Graph of HLS history shows period of near-stability between 1710 and 1740, followed by rapid submergence in the halfcentury leading up to the 1797 earthquake. Figure S5. Record of sea-level changes in hat-shaped fossil microatoll Sgg03A2. A. Photograph shows a highly eroded raised outer rim around a prominent central high. Position of slab is next to our colleague Kire s right foot. B. Lack of HLS unconformities in cross-section (except in about 1810) shows that the head is highly eroded. Nonetheless, it appears to show crudely an emergence late in the 18 th century and death in about C. Graph of HLS history. Figure S6. The Silabu site, southwestern coast of North Pagai island. A. Map of site shows zone of submerging mangrove snags and peaty substrate on intertidal reef platform and band of living microatolls on outer edge of intertidal reef. Two fossil microatoll populations sit on the intertidal platform. The higher population emerged 73
74 in 1797 and the lower one emerged in NP slabs were cut and analyzed by Zachariasen et al. [1999]. Slb slabs are from this study. Small numbers adjacent to the microatolls indicate the elevation of outer raised rims above 2000 HLS. Double numbers indicate elevation of inner rim and an outer rim for two hat-shaped heads that show emergence in both 1797 and B. Arrangement of the four Slb00A microatolls in cross-section shows their vertical relationship to each other. Together they reveal HLS history between about 1710 and Figure S7. Photos of mangrove snags protruding from the the modern beach at Silabu site. The snags root in a peat layer that overlies mid- to late Holocene reef coral, including microatolls that emerged in 1797 and Views are toward the northeast. A. Snags projecting through the crest of the modern beach. B. Prograding of the back of the beach berm into the mangrove swamp. Figure S8. Modern history of sea-level change revealed in microatoll Slb00A1. A. Stratigraphic cross-section of modern head. B. HLS time-series for the modern head has very few HLS unconformities, a situation that is typical for microatolls in rapidly submerging environments. Average rate of submergence here was about 10 mm/yr between 1985 and Figure S9. History of sea-level change at Silabu site between 1797 and 1833 revealed in microatoll NP94A8. A. Stratigraphic cross-section of microatoll shows emergence of the top of a hemispherical head into the intertidal zone in 1797, rapid upward growth during interseismic submergence between 1797 and 1833, and emergence and death in B. HLS time-series shows emergence in 1797 and subsequent rapid 74
75 rise of sea level until emergence in Modified from Zachariasen et al. [1999]. U-Th dates are from that paper. Figure S10. History of sea-level change at Silabu site in the decades leading up to 1797 revealed in fossil microatoll Slb00A4. A. Stratigraphic cross-section of microatoll shows only one clear HLS unconformity, in about B. HLS time-series shows rapid submergence in the decades prior to 1797 and emergence in about Figure S11. History of sea-level change at Silabu site from about 1670 through 1715 revealed in fossil microatoll Slb00A3. A. Stratigraphic cross-section of microatoll reveals a major emergence in the late 17 th century, followed by many decades of rapid submergence. B. HLS time-series shows rapid submergence consistent with those seen later in the century in microatoll Slb00A4. Figure S12. History of sea-level change at Silabu site through the mid-18 th century revealed in fossil microatoll Slb00A3. A. Stratigraphic cross-section of highly eroded microatoll. B. HLS time-series shows rapid submergence in the middle decades of the 18 th century, emergence late in the century and final emergence in Figure S13. Map of Silogui site on the central east coast of Siberut shows cluster of modern and fossil heads about 150 m offshore. Numbers (in centimeters) indicate elevation of outer raised rims of microatolls relative to water level at the time of measurement. Figure S14. Fossil microatoll Slg02A1 provides evidence of uplift sometime after about 1795, probably in 1797 and perhaps also in A. Cross-section of the microatoll shows two prominent HLS drops in the middle of the 18 th century, which may reflect 75
76 uplift during the 1756 and 1770 earthquakes, known from the historical record (Appendix 1). The outer edge of the microatoll died at about the end of the 18 th century. B. HLS history of the microatoll, assuming the 1756 and 1770 age assignments. Death of the microatoll occurred sometime after about 1790, presumably in APPENDIX 1. Historical accounts of the 1797 and 1833 earthquakes and tsunamis In the course of our work on the 1797 and 1833 earthquakes, we have come across several written accounts of the earthquakes and tsunamis, of which this appendix is an interpretive summary. To make the full text of the accounts readily accessible, we provide them as an electronic supplement (Supplement 1). Below, we summarize these historical accounts. Figure 1 of the main text shows the locations of most places mentioned in the accounts. The settlement of Padang is depicted in Figure A1, as it was in 1781 and 1828 (Panels A and B). The southernmost part of the modern city, nearest the old settlement, is shown in Panel C, for comparison (February 10, about 10 pm) Summary: All reports of this earthquake are from Padang or nearby. They indicate that the 1797 earthquake caused considerable damage in Padang, but that only two lives were lost there. Tsunami surges caused damage in Padang and deaths in Air Manis (Figure A1) and affected the Batu islands. The shaking. The duration of the shaking in Padang was one minute. A report published in 1845 indicates that it was the strongest earthquake in the memory of residents of Padang. By contrast, a report published in 1847 states that at the time of the 76
77 1797 event older people recalled that a stronger earthquake had occurred forty years prior to Many houses collapsed or were severely damaged and 3 to 4 inch fissures appeared in the ground. The tsunami. Several people who climbed trees to escape the tsunami at Air Manis were found the next day, dead in the branches. That whole town was flooded and several houses washed away. The tsunami at Padang also flooded the whole place and consisted of three or four ebbs and surges in the river harbor. One report indicates the surge rose one-third the height of the Apenberg, the 104-m high peninsula that juts out from the south bank of the river (i.e. about 34 m). That report states that the peninsula broke the force of the tsunami somewhat. Another report states that during the tsunami the water level rose (at an unnamed location) 50 feet above normal. At Padang, the ebbs left the riverbed dry and the surges left fish on the riverbanks. All the boats in the river ended up on dry land. A 150-to-200 ton English sailing ship that was tied to a tree near the mouth of the harbor rode the surge 0.75 English miles up river (to behind either the fort or the bird market, depending on the account), destroying three homes while in transit. The surges carried several smaller boats up the river as well and deposited them behind the market, about 1.8 km from the river mouth. All seaside homes were reported flooded as well. Interpretation: The reports of the 1797 earthquake and tsunami focus on tsunami effects near the river, which extends landward from the coast as Padang s harbor. This probably should not be taken as an indication that the tsunami inundation was most notable along the river, because the settlement at that time was confined to riverbanks upstream from the coast (Figure A1). At Air Manis, a small village on the exposed 77
78 western side of the Apenberg, the tsunami rose high enough to drown people who had climbed trees to escape the tsunami. The trees would probably have to have been at least 4 or 5 meters tall to support the weight of an adult Indonesian, so this seems to constrain the minimum flow depth of the tsunami there. The grounding of the English ship behind the fort or bird market suggests a flow depth at least this high. The current riverbank walls are about 2 meters high and the draft of the ship was probably at least 3 meters. Thus it is reasonable to believe the tsunami run up was at least 5 meters. This is still far less than the purported ~30-m run up on the flank of the Apenberg, which juts out from the harbor and the reported 50-foot (15-m) runup elsewhere along the coast. It is doubtful that the tsunami flow depth could have been as high as 15 or 30 m at Padang, for surely this would have caused the wholesale destruction of the settlement and a far greater loss of life. We suggest that a flow depth of between 5 and 10 m at Padang is most consistent with the available historical data (November 24, about 8 pm) Summary: The earthquake lasted 5 minutes at Bengkulu and about 3 minutes at Padang. It was felt as far away as Singapore and Java. Damaging tsunamis occurred at Bengkulu, Pulau Cinco, Indrapurah, Padang, and Pariaman. Reports say that no one died in Bengkulu and only one native died in Padang. The shaking. Shaking was severe along the coast from Bengkulu to Pariaman and at sea near the Pagai islands. In Pariaman the shaking was so strong that no one could stand. Damage was substantial in both Padang and Bengkulu, but was greater in Bengkulu, where all structures were damaged and the fort and tower had to be torn down. In Padang, wooden houses fared well but many stone structures lost walls and roofs. 78
79 Huts collapsed as far away as Palembang, in eastern Sumatra. Fissures a couple feet wide occurred in Pariaman, and fissures formed in the beach between Pariaman and Padang and along the riverbank in Padang. The tsunami. In Padang, ships moved on their anchors and some were lost. The sea ran up 3 to 4 meters at the beach. The map of 1828 (Figure A1, Panel B) shows sparse settlement along the beach and the center of town still along the northern bank of the river, a kilometer or more inland. The pier and customs building at Bengkulu were wiped out, and some boats were deposited upon the beach. In Pariaman, the tsunami started with the withdrawal of the sea. The surge tore all boats from their anchors and carried them to the left and right. At Pulau Cinco (the location of which we have been unable to determine) the sea rushed in and carried away several houses and people. At Indrapurah terrible waves rolled in over the low countryside and one village was completely washed away. One woman and her child were swept away, but many people survived by climbing trees and waiting there until morning. In the Seychelles, 5000 km west of Sumatra in the Indian Ocean, the 1833 tsunami was similar to that which followed the giant Aceh-Andaman earthquake of Volcanic phenomena. Two volcanoes, Marapi and Kerinci showed heightened activity after the earthquake. Collapse of a natural dam high on Kaba volcano led to flooding of the valleys to the southeast of the volcano, with the loss of 90 people in two districts. One village was flooded to a depth of 20 feet and was left buried in 7 feet of mud. Interpretation: The long duration of the earthquake and its severity certainly suggest a very large source rupture. The clear indication that the earthquake was more severe at 79
80 Bengkulu than at Padang may indicate that the rupture extended well south of the Pagai islands and that it did not extend as far north as Padang. The description of the earthquake at Padang as oscillatory could be construed to mean that short-period motions were less pronounced than sensible long-period motions. Tsunami damage appears to have been greater at Indrapura and Bengkulu than at Padang. Boats were torn from their moorings in Pariaman and Padang, but the descriptions imply (but do not expressly state) that the water did not surge over the riverbanks as it had in Nonetheless, the surge rose 3 to 4 meters at the beach in Padang, which would have been high enough to flood at least a few hundred meters inland, given that the earthquake occurred during a spring tide and that elevations are under 5 m up to at least a kilometer inland. This might not have inundated many structures, given the sparse settlement near the beach shown on the 1828 map (Figure A1). APPENDIX 2. Explanation of the growth of coral microatolls relative to sea level Although previous papers describe the use of a coral microatoll to measure changes in sea level [e.g. Zachariasen, 1999, 2000; Natawidjaja et al., 2004], this appendix offers a reiteration of these earlier explanations, for the convenience of readers of this paper. In addition, the supplementary materials contain two animations of coral growth that help visualize a coral s response to sea-level changes. Massive coral heads such as those used in this study are colonies of individual corallites, one to a few millimeters in diameter, which live on the perimeter of the head. Each corallite produces an aragonitic skeleton that is progressively left behind by the 80
81 organism as it divides by mitosis and grows radially outward at rates of about 10 millimeters per year. Growth at about this rate produces a coral head with a diameter of about four meters in 200 years. When the original organism first attaches itself to the sandy or rocky substrate (point A in Figure A2), it is some distance below sea level. As the colony grows laterally it becomes more massive and develops a broader base, qualities that give it stability in the nearshore environment. The vertical growth of the colony eventually brings its uppermost living corallites to the level of lowest low tides (b in Figure A2). These uppermost corallites do not survive long out of the water. Porites corallites of the types we use cannot survive at levels greater than about 40 mm above lowest low tide [Briggs et al., 2006]. This uppermost limit to coral growth is called the HLS, an acronym for the highest level of survival [Taylor et al., 1987]. Lateral growth continues below lowest low tide level, but vertical growth is halted at the HLS. If lowest tide levels do not vary over several years, the head develops a flat upper surface (B to C). If sea level suddenly drops, say because of uplift of the reef during an earthquake, the HLS drops the same amount, leaving a dead band of corallites around the perimeter of the head. The difference in elevation between the old HLS and the new one is a measure of the amount of uplift. In the case of the microatoll in Figure A2, sea level is stable at the new level for five years, until growth reaches point D, at which time submergence occurs, either instantaneously or at a rate greater than the corallites can grow upward. The microatoll takes five years to reach the new HLS level (E). HLS stays at that level for just a year, then drops again, to level F. Subsequent to that drop, sea level rises rapidly and is 81
82 tracked by HLS for 10 years, to G. Later periods of rapid subsidence and sea-level stability bring the microatoll to its final configuration in the figure, at point I and HLS level h. An emergence of about 120 mm kills the entire microatoll at this final stage. In the figure, the red lines are unconformities that represent death of corallites on the top and flanks of the microatoll. These unconformities are the features that allow determination of relative sea-level history during the life of the microatoll. They are depicted as dots in the graph of HLS history in Figure A2 and in similar figures in the paper. The tops of annual bands that are growing below HLS appear as triangles in the graphs of HLS history. ELECTRONIC SUPPLEMENT 1 Translated accounts of the 1797 and 1833 earthquakes and tsunamis [Our comments within the texts appear in brackets] 1797 earthquake From Wichmann [1918], pp (Translated by Jenny Briggs, Pasadena City College) 1797 (no date). In the area around the Gunung Merabu (volcano), township of Kedu, Java. Numerous quakes accompanied by an eruption of the molten matter which had been seen bubbling at the depths of the crater. 1 February 10, around 10 p.m. West coast of Sumatra. The first period of shaking lasted one minute, after which a tidal wave immediately arose and forced its way with such strength into the river at Padang that the town was flooded. 2 After this, the water withdrew so far that even the river bed was left dry. This sequence was repeated three times. The village of Ajer [Air] Manis, located on the beach, was flooded and several huts were swept away. In Padang itself, crevices appeared that were 3-4 inches wide, but these closed up again after further shaking occurred. However, cracks formed in the walls of most of the buildings. Throughout the entire night as well as throughout the whole of the next day, February 11, the ground was moving. Every minutes, severe shaking occurred. For the duration 82
83 of the entire following week, people felt the ground trembling. However, the intervals of calm grew steadily longer. 3 According to J. Griffith s reports, the earthquakes had spread over an area 2 degrees north and 2 degrees south of the equator. Moreover, the tidal wave they generated also had effects on the Batu islands. 4 J. Anderson mentioned, based on the report of S. C. Crooke, a severe earthquake in the region of Djambi [Jambi], east Sumatra, about 20 years prior to , and J. R. Logan thinks that it very possibly could have occurred in 1797 at the same time as the quakes in west Sumatra 6. Footnotes: 1 par les matières en fusion qu on voyait bouilloner au fonds de son cratère. Deschamps. Precis sur l ile de Java. Mem. de la Soc. roy. d Arras , p J. du Puy. Een paar aanteekenigen omtrent vuurbergen en aardbevingen op Sumatra, Tidjschrift voor Neerl , p Robert Mallet (Fourth report on the Facts of Earthquakes. Report Brit. Assoc. Adv. of Sci London 1855, p. 38) referred to the papers written by J. Griffith in stating that this earthquake occurred on Feb. 20, but Griffith s reports certainly gave it no date. On Feb. 10, 1797, S. A. Buddingh described an earth- and sea-quake at the Minnahassa on Celebes. He reported himself that at Kema the tidal wave was so powerful that it made the water in the rivers rise up, and that among others the village of Ajer Madidi -- halfway between Kema and Menado at an elevation of m.-- was flooded (Neederlandsch Oost-Indiё 2. Rotterdam 1860, p. 66.) In the entire report, not one word is true. Apparently he once heard of the earthquake in Sumatra and, with the usual carelessness, attributed it to northern Celebes. 3 It was also reported that a ship was swept 3 miles toward land by the tidal wave and that the wave caused 300 people to lose their lives (Memoir of the Life and Public Services of Sir Thomas Stamford Raffles, London 1830, p. 295). 4 Description of a rare Species of Worm Shells, discovered at an Island lying off the Northwest [sic!- A.W.- author] coast of Sumatra. Philos. Transact. 96. London 1806, p Mission to the East Coast of Sumatra in Edinburgh and London 1826, p On the Local and Relative Geology of Singapore. Journ. Asiatic Soc. of Bengal. N.S. 16. Calcutta 1847, p From du Puy [1845], pp Translated by Maarten Schmidt, Caltech Earthquakes are frequent on Sumatra, but they cause not much damage because of the low population. The strongest earthquake in the memory of the people in Padang, happened on February 10, 1797 around 10 p.m. The moon which was full shone brightly but darkened at the first quake and stayed so during the night - the first shock lasted for about one minute - the waves of the sea ran with fury up the river by which the whole place was flooded. Next, all the water ran out the river, which was suddenly dry; this repeated itself 83
84 three times; the river banks were covered with fish; a sailing ship of 150 tons which was moored to a tree near the mouth of the river, broke loose when the sea entered and was driven to behind the then-existing fort, a distance of 3/4 Eng. miles; on the way the vessel hit a stone house and two wooden ones which were demolished. Several smaller vessels, which were moored in the river, were also dislodged and moved off by the sea; some of these were later found behind the great market. A storage building in front of the house of the Resident at the river bank was lifted by the rushing waves and put down in the Chinese kampong - all of Air Manis, a seaside village at the corner opposite the Padang harbor is flooded and many houses flushed away - the next day one found several of the unfortunate inhabitants dead on the tree branches, where they had climbed to save themselves. The inhabitants of Padang left their houses and fled to the square outside the city; they saw the ground break open at some places some 3-4 inches wide, and then in further shaking close again. The earth was the whole night, and the following day, in continuing movement; every15 to 20 minutes there was heavy quaking and it lasted a week that the ground was shaking; the pauses became longer and longer. The walls of most of the stone houses in Padang were torn, so that cases and furniture fell over and much damage was suffered; in Padang itself only two people died. A less strong earthquake occurred in [Shaking reports suggest that this earthquake was caused by the Sumatran fault, far inland] From du Puy [1847], pp Translated by Maarten Schmidt, Caltech On February 10, 1797, at 10 p.m. a heavy earthquake occurred which caused the collapse of many houses. The shock was so strong that the ground split open; further shocks were felt every half hour for five hours during the night though they became weaker and weaker. At the time of the first shock the sea came up three times, so high that it reached one third of the height of the 'Apenberg', which did brake the force somewhat, and all the ships outside the river were thrown onto dry land. An English sailing ship of about tons was found behind the Bird Market the next morning. The sides of the river were covered with fish and all seaside houses were flooded. Fortunately, this terror caused few or no human casualties. Old people claimed that 40 years ago there had been a yet stronger earthquake. [There was, in fact an earthquake in 1756 (Newcomb and McCann [1987]).] From an account for which we have misplaced the reference! During the shake a tidal wave rose along the coast, which reached a hight [sic] of 50 feet above the usual water-hight. At this occasion a reef was lifted up, so that it was a danger for the navigation earthquake 84
85 From Wichmann [1918], pp (Translated by Jenny Briggs, Pasadena City College) January 28, a few minutes after 12 noon. Batavia. Earthquakes. The shocks were repeated, gaining in severity. The last one was so strong that several houses were damaged and even the old Lutheran church developed cracks. 1 January 29, noon. Tjiwidei. District of Tjisondari, Division of Bandung, Preanger regency, Java. Severe quakes, one of which was followed by rumblings from the earth that lasted one minute. 2 November 24, around 8:30 p.m. Sumatra. Severe earthquake, that was felt in Singapore and even in Java. 3 In Bengkulen [Bengkulu], on the west coast of Sumatra, there were severe quakes, the first of which lasted 5 minutes 4 and caused damage and even destruction of buildings. The tidal wave which crashed into the coast destroyed the harbor dam and all houses nearby. Two schooners, along with several smaller crafts, were flung onto the land. Padang. Severe quakes, lasting 3 minutes, which recurred over the following days. Direction SSW-NNE. Apart from the damage to buildings, cracks also appeared in the earth, from which water and sulfurous steam arose. Each quake was accompanied by a subterranean crashing noise. A tidal wave that broke here did considerable damage. Indrapura and Pulu Tjingko [Cinco island]. Severe shaking. The damage caused here by the tidal wave was significant, and people also lost their lives. From the Gunung Singalang (volcano) people heard a loud boom, which, as at the Merapi volcano (which was initially blamed for the explosion), was followed by an eruption. Priaman. The most intense quakes. Cracks of two or more feet in breadth appeared in the earth. The sea drew back and then returned in the form of a powerful tidal wave, which tore numerous ships from their anchors. The shaking continued for many days. 5 Province of Rau, Division of Lubuk Sikaping. The Amerongen Fort was forcibly attacked by rebellious natives during the time of the earthquake itself; they interpreted the shaking as a good sign. 6 Palembang. The first quake, noticed at 8:30 p.m., was followed by 6 others. Direction S-N. Buildings developed cracks and several huts collapsed. The Ajer [Air] Lang river, whose source was at the volcano Bukit Kaba, had run dry 3 years previously when an earthquake was followed by a landslide that created a dam and a lake. During the earthquake of November 24, however, this dam was destroyed again, which emptied the lake. 7 In their stormy course, the tumbling waters either partly or completely destroyed the village of Kapala Tjurk on Ajer Lang, as well as the more distant villages on Ajer Kling 8 : Udjan Panas, Lubuk Talang, Ajer Apo, Lubuk Tandjung, Tabah, Njambikei and Grung Agung. 9 Singapore. At 8:35 p.m. a weak shock was felt, followed by a shaking of the ground that lasted for a minute or perhaps somewhat longer. The vibrations experienced 85
86 in the encampment of Glam were stronger than those in the town itself. In the report it was noted that this was the first earthquake in Singapore since its occupation by the English (1819). 10 On Java, the quake was also weak; reports simply noted this fact. On the high seas, the quake was also experienced. The ship Mercurius, which at the time was above the Pageh [Pagai] Islands on the west coast of Sumatra, was shaken by heavy quakes. August 26. The island Ramiri on the coast of Arakan, Birma. During the earthquake, people observing the mud volcano from Kyauk Phyu, [a town/place- J.B.] which lay off its northern peak, saw flames and steam rising several hundred feet above the volcano s summit. 11 November 25, 7 a.m. Singapore. A quake, followed by a second one at 5 a.m. [sic- J.B. This may be an error in the original that should be p.m.?] Direction E-W. 12 Pulu Painang (Penang). Earthquake (no date given). Ternate. In the first half of the year there were 25 quakes. 14 It was specially noted that on the 18 th June, at 6 a.m., the earth rumbled and immediately afterwards a lengthy period of strong shaking occurred. 15 In the second half of the year, 3 quakes were observed. Footnotes: 1 Algemeene Konst- en Letterbode. Haarlem , p M. Th. Reiche. Berigten over berguitbarstingen en aardbevingen Natuurk. Tidjschr. Ned. Indiё 18. Batavia 1858, p P. van Oort en S. Muller. Aanteekeningen gehouden op eene reize over een gedeelte van het eiland Java. Verhandel. Batav. Genootsch. 16. Batavia 1836, p Due to an error, February is stated instead of January in the report. In my opinion, we should also not exclude the possibility that this earthquake began on the 28 th, and, indeed, occurred at the same time as the one in Batavia. 3 Algemeene Konst- en Letterbode. Haarlem , p. 254, 339, 2, p M. Th. Reiche 1.c. pag Asiatic Journal N. S. 14, pt. 2. London 1834, p. 21, 263. A. F. W. Stumpf. Tijdschr. voor Neerl. Indiё , p H. J. Domis. Aanteekeningen betreffende Benkoelen. De Oesterling 1. Kampen 1835, p It was also mentioned that well water could not be obtained for several days. 5 J. C. Boelhouwer. Herinneringen van mijn verblijf op Sumatra s Westkust ( ). s Gravenhage 1841, p S. Müller en L. Horner. Fragmenten van de reizen en onderzoekingen in Sumatra. Bijdr. t. de T. L. en Vk. (1) , p It is called Telaga Ktjil or Selandjuang ketjil and appears to be an old crater lake. See also A. A. von Karacson. De vulkaan Kaba op Sumatra. Tijdsehr. K. Nederl. Aardr. Genootsch. (2) 14. Leiden 1897, p A tributary river of the Ajer Lang. 9 A. W. Verkert Pistorius Palembangsche Schetsen. De Gids. Amsterdam , p
87 10.Asiatic Journal and Monthly Register. 14, pt 2. London 1834, p. 21. de Castelnau. Tremblement de terre a Singapore. Compt. rend. Acad. des Sc. 52. Paris 1861, p F. R. Mallet. The Mud Volcanoes of Ramri and Cheduba. Records Geol. Survey India 11. Calcutta 1878, p De Castelnau. Tremblement de terre a Singapore. Compt. rend. Acad. des Sc. 52. Paris 1861, p J.R. Logan. On the Local and Relative Geology of Singapore. Journ. Asiat. Soc. of Bengal. N. S. 16. Calcutta 1847, p H. Coldenoff, p Ibid., p From du Puy [1847], pp Translated by Maarten Schmitt, Caltech To the editors of the Journal of the Dutch (East) Indies A friend and lover of the sciences has enabled me to communicate the following observation of a major earthquake, falling in the time interval between the observations of Mr. du Puij and mine. Dr. A.F.W. Stumpff On November 24, 1833, around 8 p.m. oscillating earthquake shocks were felt in Padang, on the W. coast of Sumatra, which at first were not thought to be serious; soon, the shocks were so violent that all went outside, fearing to be buried under the wiggling buidings. Outside, with the earth shaking under one's feet, one saw in a bright moon buildings and trees in hefty motion, the ground splitting with water bubbling up with major force, while the river was threatening to overflow. The sea was extremely active, one was fearful of it rushing in causing destruction as had happened in a similar natural event late in the last century. This situation lasted somewhat over three minutes. The entire population of Padang was afoot, those living along the river trying to reach higher lying areas of the city. During the months of August, September and October one had observed extreme heat and humidity; the day of November 24 characterized itself by a deep silence in all of nature, that had not then been noticed, however; the terrible motion that followed was not without consequnces. In the houses, everything was overthrown, especially the stone houses were subject to great destruction through the tearing and separating of walls and the collapse of stone pillars. At sea there was also much commotion. Ships in the port of Padang moved on their anchors, some of which were lost. An underground noise preceded the motion, after which mud and sulfur-like fumes rose from the split ground. Several hours before the first shock, one had seen along the beach a surprisingly large amount of fish; the following day many dead fish were observed at the same location. It was noteworthy that the volcano Merapi in Agam was not particularly active during this terrifying event; it had early thrown out much fire and ash but during the general upheaval the mountain was quiet; only after the first motion one had observed a terrible bang, which some here in Padang also believed to have heard. 87
88 Elsewhere, local circumstances seem to have offered more resistance to the destructive force. At Poelo Cinco [Cinco island], the sea rushed in and carried off several houses and also people. At Indrapoera there was also some destruction caused by the sea and a few people died. At Benkoelen [Bengkulu], all buildings had much damage, so much so that the tower and the fort had to be taken down; the pier with the storage building and the customs office were wiped out, two government and several other ships were deposited on the beach, however no lives were lost there. Shocks were felt far into the ocean. The captain of the 'Mercury' tells that near the Pagai islands, hundreds of miles offshore, he experienced the shocks as if he had hit cliffs. Experts are assuming that this earthquake moved from SSW to NNE. The first and strongest motion was simultaneous with spring tide, three days before Full moon. The atmosphere seems to have been little affected and weather stations saw no change. The same night and following days were characterized by shocks of varying strengths until the end of November. From Verkerk [1870], pp Translated by Maarten Schmidt, Caltech [Summary: The article describes the first part of an ascent of the most active volcano in the Palembang Highlands, the Holy Mountain Kabaa. On the way, the author descibes his stay in Apoor, where he is hosted by the old man Tjermin.] About 25 years ago, the region east of Kaaba was subject to an upheaval, so terrible in its consequences, that it has erased people's memory of all previous disasters. Some three years earlier, one of the streams originating on the Kaaba, the Ajer Lang, had suddenly dried up. An earthquake close to its origin had made a dam over the stream bed: the water could not escape and created a lake in a nearby valley. The damage caused by the lack of water along the Lang was repaired and forgotten, and the fear of disaster had subsided among the people - when suddenly terror struck. This time it happened in the middle of the night. Awakened by the hefty shocks of the booming earth, which was staggering like a horse driven by its rider, they rushed outside. From the steep, nearly verical, side of the Lang, which near the village Kapala Tjoeroek is about feet high, and where the bamboo huts cling to the side like bird nests, they looked down into the river; but who can descibe their terror when they saw in the bright lightning flashes, there in the depths where hours earlier there had been nothing but a dry rocky bottom, a screaming and boiling sea that rose up from the abyss as if to swallow the mountain. The lake had broken through its dam and rushed as if in one jump into the Kapala Tjoerek bed! - The hapless! could hardly believe their eyes. As in a terrible dream, swaying between doubt and fear, they kept staring, and even though the danger increased all the time, none were thinking about saving themselves. None of them would escape. Not even the few who, not mesmerized by fear, ran up the mountainside. The faster and faster rising flood overtook them all. The disaster took more than 120 lives. Tjermin's 88
89 wife was also killed. A number of villages were totally or partly destroyed. Except for Kapala Tjoeroek at the Lang, the following places on the Klingi (into which the Lang empties): Oedjan Panas, Loeboe Talang, Ajer Apo, Loeboe Tandjoeng, Tabah, Njambikei and Goeroeng Agoeng. After two days the Lang went down to its present day level. It was finally noted that three elephants were moved along in the stream. Jeffrey Hadler, U California, Berkeley, communication, There is a wonderful account of the 1926 earthquake in Muhammad Radjab's "Village Childhood" (Semasa Kecil di Kampung). It's been translated in Susan Rodger's book "Telling Lives, Telling History." I've pasted the chapter below. Minangkabau records of 1833 are harder to come by. Imam Bondjol does not mention the quake in his Dutch-filtered memoirs (translated by Christine Dobbin and downloadable): The Jawi-script "Hikayat Fakih Saghir 'Ulamiah Tuanku Samiang Syekh Jalaluddin Ahmad Koto Tuo" was published in 1847 but really covers the late 18th and early 19th centuries, and again does not mention the quake. And Imam Bonjol's son's memories of the Padri War make no mention of the earthquake either. I find this very odd since 1833 was the year that the Padri's surrendered, and the war changed from a civil war (with Dutch intervention on the side of the adat group) to one of general anti-colonial resistance. A major earthquake and tsunami should have affected the Dutch garrisoned in Padang. Perhaps the highlands did not feel the quake so strongly? Is this possible? A search on "gempa" in Proudfoot's Malay Concordance Project turns up plenty of fun references but nothing relating to the 1833 event. So I'll keep hunting. There are a number of syair, tambo, and hikayat that I've yet to check through. Where can I find the 1845 and 1847 Dutch accounts? Jeffrey Hadler, U California, Berkeley, communication 21 April 2005 I've been writing to fellow historians and Anthony Reid has this 1833 anecdote: I was fascinated by 1833, and share your wonderment that we have not heard more about it in the literature. I looked up the book I happen to have of Henry Lyman: The Martyr of Sumatra, since he was in Padang about that time. It turns out he arrived Padang only early 1834, but noted of Sunday 23rd Feb 1834 that he preached on board a ship, the Eugene, and "Heard of an earthquake at Padang whch very much damaged the hill; opened the river so as to make it dry, and filled it with fish not known before. It also drove on this coast a large shoal of fish, never before 89
90 seen here, something like alewives." (pp ). Lyman was an Amherst boy, heading to Toba to be gobbled up by obliging Batak. Along with the Dutch government literature a great place to look for information on the 1861 and 1907 events would be missiological sources. The German Rheinish mission was active in Nias and the Bataklands; Americans were also a presence. I'll keep my eyes open. In 1833 the Massachusetts-Padang pepper trade was responsible for a big chunk of the American GNP (maybe 5%) and at the time of the earthquake there were maybe 30 American ships in West Sumatran waters. The logs have been microfilmed, more should be available in Salem, and this would be a great place to go hunting for good English language accounts. From Boelhouwer [1841], pp Translated by Maarten Schmidt, Caltech I should not forget to mention an earthquake that we felt at the end of November. In the evening there were very heavy shocks, such that all of us feared for our lives and none, not even the oldest natives, could recall something like this. It was impossible for me and anybody else to stay in the house, and we could not even keep standing; all of nature seemed to be in turmoil, everything was shaking and was falling apart; nothing that had been on tables or in cabinets stayed there; the earth opened up at various places, creating fissures two or more feet wide. The sea retreated with furious power a long way, from which she came back in with double fury; none of the ships off Priaman stayed anchored, all were torn away and we found them the next morning at large distances, spread left and right. For several days there was shaking, though less. In Padang, several stone buildings, including the church, suffered much damage; the church could not be used any more, and on my journey to Padang I saw terrible grooves (rills) on the beach. At Benkoelen, as we learned later, the entire harbor head as well as the tax office for Import and Export were destroyed. From Mueller and Horner [1855], pp Translated by Maarten Schmidt, Caltech Earthquakes are often felt at Padang, but rarely of such intensity that they endanger inhabitants. The most powerful earthquake since many years occurred on November 24, 1833, just after 8 p.m., for about 2 minutes. The air was damp, quiet and humid, in moonlight. The oscillating movement of the earth, together with underground shocks and a rattling sound that clearly came from the S.E., made everybody rush out of their houses and created fear in all. One heard everywhere a hard stomping of "rijstblokken" [rice blocks?] and people yelling. Along the river fissures had opened here and there, which then closed again. The sea had repeatedly run up the sloping beach, up to 10 to 12 "voet" [Dutch foot, approximately equal to an English foot] high. All wooden houses creaked and shook enormously; but the stone houses fared worse, with damaged walls, some fell over, and some roofs that collapsed. In some houses, furniture had been thrown from one 90
91 corner to the other. There was considerable damage but few accidents. Only one native and two cows were lost. Curious is the large area over which the earthquake was noticed. The shaking was felt in Natal, Tanapoeli, Singapore, on the N. coast of Java, in the Lampongs, at Palembang and on Benkoelen [Bengkulu]: so over an area of at least 150,000 sq. miles, or about as large as France. At Benkoelen, the shocks wereheavier with more damage to the beautiful stone buildings, than at Padang. At the beach near Indrapoera the sudden rise in the ocean, which rolled in terrible waves over the low country side, a small village was entirely destroyed where a woman with her child disappeared in the water, while some people found refuge in trees where they stayed until the next morning. Also in parts of inner Sumatra the shocks were extremely violent, among others in the region Rau where just then the Dutch fort Anerongen was besieged by thousands of mutineers who considered this natural phenomenon a favorable sign for their side. The two volcanoes Merapi, in Agam and Korintji [Kerinci], gave at that time some indication of increased activity, though not such that their natural chimneys seemed to contribute to a diminishing and calming down of the underground explosive forces. This was provided by the small volcano Kaba, located in the hinterland of Palembang, between the high volcanoes Dempo and Merapi of Korintji, closer to the Dempo. From the capital Benkoelen the Goenong Kaba lies E.N.E. at 40 geogr. Minutes distance; from Palembang about 2 degress W.S.W. This volcano is only "voet" (feet) high and has several peaks, among which besides the smoking crater there used to be a small lake, called Talaga Kitjil, probably an inactive caldera filled with rain water. During the earthquake, the Goenoeng Kaba had a terrible eruption, on which occasion the Talaga Kitjil emptied over the low country to the S.E.; a flood that in its path destroyed and swept off everything, jammed up several rivers and caused major destruction in the districts Sindang-Klingi and Sindang-balita. A small village in a valley close to the foot of the mountain, was inundated to a height of 20 feet, at the end leaving a mud layer of 7 feet high, together with uprooted trees, rocks, and the bodies of 36 victims as well as many dead animals. In the two districts there were in total 90 casualties. The water in the river Moesi, near Palembang, was unfit to drink for several weeks due to sulfuric acid. During the night of 24-25th November 1833, 11 more earthquakes were felt and they continued with decreasing strength until the end of the year. The central point of the forces working inside the earth were clearer in the neighborhood of Goenong Kaba, where the shocks and loud underground noises were far and above the heaviest. From Ruth Ludwin, Univ. Washington, communication, 3 January 2005 I notice that the info on the web about the 1833 Java quake does not give an exact date. In the "Times" of London, I find an account of an earthquake felt in Palambang on 24th Nov Was that the date of the 1833 megathrust earthquake? Here is the full account. I was not able to find a Aug. 20, 1834 (p.2. c.e) article listed in the Times index. July 4, 1834 (p.2, col. c) "Times" of London EARTHQUAKE IN JAVA. The Hague, June 29 The accounts received from Java, to the 26th of February, contain nothing of general 91
92 interest: but one of the papers gives some particulars of the earthquake in the night of the 24th of November last. "This earthquke which was flet in Java and elsewhere, especially in Sumatra, is ascibed in a report from Palambang to an eruption of the Volcano Bocker(?) Kaba, in Palambang. Besides the damage done by repeated shocks of the earthquake, the effects of an inundation coming from that mountain were most distressing. Between the two principal peaks of the mountain there was a lake, called Telaga Ketjtel (?), which, in consequence of the shocks of the earthquake, inundated the neighbouring districts. The inundation was increased by the overflowing of the river Ager Dinglen(?), the channel of which was choked up by masses of earth and trunks of trees. The hamlet of Talbang Ager Lang was covered with water to the depth of 21 feet, and after the inundation there remained a bed of mud seven feet deep. Thirty-six inhabitants of the hamlet perished. The total number of victims in the districts was 90. Mount Kaba is 50 leagues from Palambang, and yet the water of the great river Moessie (?) [Musi] was not fit to drink for several weeks. An account from Kodal states that on the 2nd of February, during a torrent of rain, part of the mountain of Telo Mejo (?), in the district of Ngassinan(?), on the frontiers of Ansbarawa, had sunk down, by which 12 habitations were buried, and 37 persons lost their lives. Excerpt from letter by Lionel Jackson, Donald Forbes, John Shaw, Vaughn Barrie, GSC Seychelles Tsunami Expedition, Canada, to Irwin Itzkovitch, Canada, 7 February 2005 It is our pleasure to inform you that the GSC Indian Ocean Tsunami Expedition to the Republic of Seychelles (RS) returned to Canada this past weekend. We consider our expedition, which was to investigate the tsunami that struck that island archipelago nation on 26 December 2004, an unqualified success. We arrived in RS the morning of 22 January and departed the morning of 3 February. We investigated the tsunami and its impact on the two largest granitic islands, Mahé and Praslin, where most of the population of about 80,000 reside. The tsunami resulted in significant property damage but only two fatalities in RS. Two factors worked in RS's favor: the tsunami struck during low tide and it was a Sunday so most businesses in the commercial and industrial areas of Victoria, the capital, were closed. These areas were extensively flooded and boats and debris were driven ashore. Furthermore, children were not in school. Had the tsunami struck at high tide on a normal working day, the death toll could have been scores or hundreds. Lastly, we were able to obtain tidal data recorded during the Krakatoa tsunami of 1883 from the RS National Archives in Victoria and from the 1888 Royal Society report that we examined in the British Library in London. This data set can be compared with the water level records from the 2004 tsunami, which appears to have been larger and more damaging that the Krakatoa event. The archival investigation also uncovered evidence of another tsunami that struck the islands ca and may have been comparable to the 2004 event. 92
93 From the National Archives, Seychelles, via Phil Cummins, Australia, via Lionel Jackson, Canada. F/2.14 v. 17, item 44. pp Extract from the Mercantile Record and Commercial Gazette, 5 October 1883, which reports extensively on the tsunamis in the Seychelles produced by the eruption of Krakatau in The following report has been kindly forwarded by Mr. H.W. Estridge, Collector of Customs at Mahe: I may remark that Mr. Beauchamp D Offay, aged 67, told me that the same thing happened 50 years ago. He recollects it well. The tide then went into the houses, was knee deep, and came in with a roar. ELECTRONIC SUPPLEMENT 2 These materials comprise the descriptive data from three paleoseismic sites on the coasts of the Mentawai islands. The locations of these sites, Singinngi (Sgg), Silabu (Slb) and Silogui (Slg) are in Figure 2. HLS time-series from the sites appear in the main text in Figure 22, panels B, E and F. Singingi site (Sgg) This locality is on the northern tip of a swampy mangrove islet off the northeast coast of South Pagai (Figure S1). A fringe of dead snags rooted in the intertidal reef flat bears witness to the fact that the island is slowly submerging (Figure S2). We collected slabs from two fossil microatolls and one living microatoll to define the HLS history of the site (Figures S3 through S5). Figure 22F is a composite of the HLS records of the three slabs from Singingi. The relationship between fossil heads A1 and A2 shows that at least the 18 th -century parts of 93
94 head A2 has been eroded substantially. Together the three heads yield an estimate of about 0.37 m for emergence in HLS just prior to the 1833 event is about 0.35 m above the 2003 HLS. And extrapolation of the 2003 HLS back to 1833, using the average modern rate of submergence yields a post-1833 HLS about 1.2 m below the 2003 level. The difference between the pre- and post-1833 HLSs is thus about 1.55 m. The modern microatoll The modern head at Singingi (Sgg03A3) exhibits two periods of relative HLS stability separated by a period of rapid upward growth (Figure S3). In the late 1950s through the early 1960s, HLS did not vary by more than a few cm. Following an emergence of several cm in 1962, the head experienced nearly two decades of unimpeded upward growth. Since about 1982, upward growth has been limited to an average rate of just 2 mm/yr. On average over the past half-century HLS has risen about 7 mm/yr. The fossil microatolls We cut slab Sgg03A1 from the best-preserved fossil microatoll that we could find at Singingi. The head exhibited the morphology of terraced raised outer terraces that is common in the Mentawais (Figure S4a). Judging from the degree of preservation of this radially symmetric morphology, the microatoll has experienced little erosion. As expected, its internal stratigraphy is consistent with this morphology. The central flat represents a quarter century of HLS stability (Figures S4b and S4c). The terraces represent occasional HLS unconformities during a half-century of rapid submergence of the head. The average rate of submergence is about 7.6 mm/yr, indistinguishable from 94
95 the modern rate. U-Th analyses constrain microatoll growth to the 18 th century, so we assume that the head died from uplift in We cut slab Sgg03A2 because it exhibited a clear raised central disk, which we thought might represent growth prior to emergence in 1797 (Figure S5a). The severe erosion of its raised outer rim alerted us to the possibility that the rest of the head might have suffered severe erosion also. The stratigraphic relations exposed in the slab confirm that initial assessment; there is only one HLS unconformity on the surface of the entire slab, in about 1811 (Figures S5b and S5c). Nonetheless, the microatoll contains useful information for constraining HLS history before, during and after the 1797 and 1833 events. The U-Th ages from this slab are much more precise than the one age from the other fossil slab; they constrain the annual bands to just a decade or so and support the conclusion that emergence and death occurred in 1797 and 1833, respectively. 95
96 Silabu site (Slb) The Silabu site is a broad intertidal reef flat on the southeast side of a large bay (Figure S6). A narrow perimeter of living Porites microatolls skirts the intertidal reef on the west and south and two generations of fossil heads lie on the intertidal platform. A thin beach berm flanks the intertidal platform on the east and is prograding eastward into a mangrove swamp. A peat mat with abundant rooted mangrove snags extends west from under the beach sand and gravel. This organic mat is a remnant of the mangrove swamp that has been overridden by the beach as it has prograded eastward (Figure S7). Modern head The slab cut from a modern microatoll with a broad raised outer rim shows that submergence has been occurring at an average rate of nearly 10 mm/yr for the last two decades of the 20 th century (Figure S8). The rate of submergence is so high that the microatoll was unable in most years to reach HLS; only in three years was upward growth inhibited by a low tide. Fossil heads Zachariasen et al. [1999] presented evidence for emergence in both 1833 and an earlier event around the turn of the century. They noted two populations of fossil microatolls on the intertidal reef flat, with outer raised rims separated by as much as 0.8 m in elevation. Their slab NP94A8 provides particularly clear evidence for both events, so we have reproduced it here with slight re-interpretation (Figure S9). They concluded that the emergence of the microatoll s central hemisphere occurred in about 1793, based 96
97 on ring counting and U-Th dates on two bands. An emergence date of 1797 is also plausible and is consistent with the historical record. We have assigned this age to the last pre-emergence ring in the slab cross-section. Several annual bands of the 1790s have been eroded off the top of the hemisphere, a circumstance that is not uncommon for heads that have emerged into the intertidal zone. The vertical distance between the tops of the 1797 and 1833 bands, 42 cm, gives the best measure of the amount of submergence in the 37 years between the two emergences. The average rate of submergence between the two earthquakes, about 12 mm/yr, is comparable to but perhaps slightly higher than the average rate estimated above, from the modern microatoll. Because the top of the NP94A8 head was below HLS before the 1797 emergence, it provides only a minimum value of the emergence associated with that event. To recover the full amount of emergence, we sampled the microatoll with the highest raised rim at the site. This microatoll was highly eroded, but a small remnant of its outer raised rim was well-preserved. The slab from that remnant, Slb00A4, shows in profile the twin horns of the rim (Figure S10). The U-Th ages are consistent with emergence in 1797, although they have an uncertainty of three decades. The difference in elevation between the top of the rim and the top of the post-1797 emergence band on NP94A8, about 80 cm, is our best measure of emergence in 1797 (Figure 22E). We recovered HLS a record from one other head that allows us to extend HLS history still farther back into the 18 th and late 17 th centuries. Slb00A2 is a slab from a microatoll that has a hemispherical center and an outer raised rim (Figure S11). U-Th analyses indicate that the hemisphere formed between about 1640 and 1690 and that the outer raised rim formed between about 1690 and An emergence event of at least 27 cm 97
98 killed the top of the hemisphere in about 1690 and allowed the initiation of growth of the outer raised rim. The rate of upward growth of the outer rim was about 7 mm/yr and projects directly to the oldest HLS elevation of microatoll Slb00A4, just described above (Figure 22E). Thus we have a record of HLS that is nearly continuous through more than a century before the 1797 earthquake. The emergence in about 1690 is consistent with the first historical record of a large earthquake and seaquake in western Sumatra, in One other microatoll adds to the story at Silabu. That head, Slb00A3, is a wellpreserved microatoll with a central platform, an intermediate raised rim and an outer lower rim. Inspecting this head in the field, we anticipated that it would contain a record of the complete 1797 emergence, because it exhibited both the high raised rim and an outer lower rim (Figure S12). It was, in fact, the only head we found at the site with this morphology. U-Th analyses confirmed that the high raised rim formed in the decades prior to 1797 and that the outer lower rim formed in the decades prior to As in many other cases we have documented, the external side of the raised rim appears to have suffered appreciable erosion after emergence. If we assume that the top of the lowest annual band in the outer brim is the 1797 band, then this lateral erosion would amount to about 15 annual bands. This assumption is reasonable, because it is consistent with the 1776 ± 7 date on an annual band that is 18 years older by visual ring counting. It is also reasonable because this assumed 1797 band marks the point at which the bottom of the microatoll abruptly changes growth direction, an event that might well be expected with the changes in wave dynamics associated with a large emergence. The difference between the tops of the pre-1797 and pre-1833 annual bands is about 45 cm. This is the same elevation difference that exists between the top of the pre-1833 band in NP94A8 98
99 and the top of the pre-1797 band in Slb00A4 (Figure 22E). Thus we have support for the story pieced together from the other heads is correct. Silogui site (Slg) About 150 m offshore at the Silogui site is a small field of modern and fossil microatolls (Figure S13). We collected a slab from one of the hat-shaped fossil microatolls and measured the most recent HLS from several of the modern microatolls. The fossil slab contains a clear record of two large HLS unconformities, 19 and 35 years in from the outermost ring (Figure S14). A U-Th analysis yields an age of 1795 ± 19 years for the band that is 4 or 5 years in from the outermost band, which appears to be substantially eroded. Thus the outermost preserved band formed within two decades of Even if the head died in 1797, it would be risky to assume that the outer band formed in 1797, because erosion is likely to have removed the outer few bands. Instead we assign the two large HLS unconformities to 1756 and 1770, the dates of two large earthquakes in the region [Newcomb and McCann, 1987]. These assignments yield a date for the youngest preserved band of 1788, which is quite compatible with the U-Th age and erosion of about nine of the youngest bands. In this most reasonable interpretation, the microatoll would have died due to uplift in To construct an HLS history for Silogui requires the assumption of the average rate of subsidence at the site since Sites just 6.5 and 14 km to the southeast and northwest have been submerging at rates of 4.1 and 3.8 mm/yr, respectively, for the past halfcentury (Natawidjaja and others (in review). Therefore, the use of an average rate of
100 mm/yr at Silogui seems reasonable. This yields the HLS history depicted in Figure 22B. Rates of submergence during the 18 th century and for the past few decades are similar and the misalignment between the 18 th -century and modern HLS curves is about 83 cm. We cannot say with certainty how this amount of emergence should be partitioned between 1797 and But we prefer the interpretation that the entire emergence occurred in 1797, because the microatoll does not have a lower raised rim. It might well have grown such a rim if uplift in 1797 was less than about 25 cm, since the lower part of the head might have survived such a small uplift. ELECTRONIC SUPPLEMENT 3 At one can find and download movies that illustrate the growth of coral microatolls in response to sea-level changes. Two of these animated simulations of coral growth use the sea-level histories determined from a modern and a fossil microatoll collected at the Siruamata site (Figures 2 through 7). 100
101 Figure 1 INDIA BANGLADESH MYANMAR VIETNAM CHINA LAOS Sunda megathrust An THAILAND CAMBODIA 5 0 SRI LANKA 2004 (M w 9.15) INDIAN PLATE 1907 (M 7.6) 1861 & 2005 (M w 8.6) 50 mm/yr Andaman Sea Nb Sm Ni Bt S u m a 2002 (M w 7.3) SE ASIAN MALAYSIA PLATE SINGAPORE -5 t r a n f a u Mt 1935 (M w 7.7) Indian Ocean 1797 & 1833 NER IFZ 57 mm/yr l t En Ss 2000 (M w 7.9) Java
102 Figure 2 1S 2S 3S Batu Siberut S u b d u c t i o n Islands 99E 100E Badgugu (Bdg) Pitogat (Ptg) (18-21) Siruamata (Srm) (3-7) m e g a t h r u s t Silogui (Slg) (S13-14) Teluk Saibi (Tsb) Sikici (Skc) Sipora N. Pagai Silabu (Slb) (S6-12) Bulasat (Bls) Saomang (Smg) Marapi (Agam) Pariaman Padang Simanganya (Smy) Singingi (Sgg) (S1-5) S. Pagai S u m a t ra n f a u l t Tiop bay (Ttp) Siatanusa (Stn) Kerinci Indrapura Sibelua (Sbl) (13-17) Tinopo (Tnp) Sample site Settlement Volcano with minor activity after 1833 earthquake Kaba kilometers Bangkaulu (Bkl) (8-12) Bengkulu

103 Figure 3 Si94A6 (dead microatoll) Siruamata Island Srm00A1 (living microatoll)
104 Figure 4 Srm00A1 Si94A6 Si94A1-3 Si94A5 Intertidal Sub - tidal reef Beach Lagoon Lagoon Mangrove reef North Jungle Siruamata site Meters
105 1975 Figure 5 A Millimeters ± ± up Srm00A1 1962± 3 Relative sea level (mm) B 8.3 ± 1.6 mm/yr Year Preserved HLS unconformity (error bar is 2σ) Minimum HLS level Eroded HLS unconformity Growth unconformity Less clear growth unconformity Annual bands Clear Less clear or inferred
106 Figure 6 A Si94A Emergence of 700 mm in 1797 Relative sea level (mm) B 6.5 ±1.4 mm/yr 1797 event 0.4 ±1.2 mm/yr 1833 event Preserved HLS unconformity (error bar is 2σ) Minimum HLS level Eroded HLS unconformity Growth unconformity 1770 ± Eroded Dated sample (Table 1) Annual bands: Clear Less clear or inferred Millimeters ± 7
107 Figure 7 Relative sea level (meters) ± 1.4 mm/yr Si94A6 ~700 mm emergence 0.4 ± 1.2 mm/yr Srm00A1-8.3 ± 1.6 mm/yr Year 1160 ± 140 mm emergence Siruamata
108 Figure Meters S u b -ti d a l I n t e r - r e e f Bkl03A1 t i d a l Surveyed Heads Modern Old Beach Mangroves Bkl03A3 r e e f 800 m Bangkaulu village site map Bkl03A2 View direction of Fig.9 Bangkaulu site

109 Figure 9
110 Figure ± ± ± ± ± 2 Bkl03A ± mm A Relative sea level (mm) ± 2.4 mm/yr B Year Preserved HLS unconformity (error bar is 2σ) Minimum HLS level Eroded HLS unconformity Growth unconformity U-Th dates (Table 1) Undated samples Horizontal datum Annual bands: Clear Less clear or inferred
111 Figure 11 A ± ± Bkl03A mm Relative sea level (mm) ± 0.7 mm/yr year B Preserved HLS unconformity (error bar is 2σ) Minimum HLS level Eroded HLS unconformity Growth unconformity U-Th dates (Table 1) Undated samples Horizontal datum Annual bands: Clear Less clear or inferred
112 Figure 12 Relative sea level (meters) ± 0.7 mm/yr Bkl03A ± 0.40 m -7 ± 2.4 mm/yr Bkl03A3 Bangkaulu Year
113 Figure 13 North Inter t i d a l S u b - t i d a l r e e f Surveyed Heads Modern Old hat-shaped Other old Belt of Sbl02A2 r e e f M a n g r o v e Sbl02A mm snags Sibelua site dead Fig. 15 Sparse mangrove t h i c k e t
114 Figure A ± ± ± mm 1970 ± Relative sea level (mm) ± 2.6 mm/yr 1985 ± 1 Sbl02A Year B Preserved HLS unconformity (error bar is 2σ) Minimum HLS level Eroded HLS unconformity Growth unconformity U-Th dates (Table 1) Undated samples Horizontal datum Annual bands: Clear Less clear or inferred

115 Slab cut Figure 15
116 Figure 16 OVERTURNED INNER HEAD A Eroded Sbl02A mm ± Relative sea level (mm) ± ± ± B Year ± 1 mm/yr 480 mm ± 1 mm/yr Preserved HLS unconformity (error bar is 2σ) Minimum HLS level Eroded HLS unconformity Growth unconformity U-Th dates (Table 1) Undated samples Horizontal datum Annual bands: Clear Less clear or inferred
117 Figure 17 Relative sea level (meters) ± 1.0 mm/yr Sbl00A1 490 ± 70 mm 4 ± ± 320 mm Sbl00A2 6 ± 2.6 mm/yr Sibelua Year
118 S u b - Ptg00A1 t i d a l re e f Ptg00A2 North Figure meters Field of living B e a c h microatolls Fossil microatolls in mud Pitogat site M angrove swamp Roots and snags Approx. boundaries of living and dead microatolls Surveyed Heads: Modern Old
119 Figure 19 millimeters A ± ± ± Living Ring ± 75 Relative sea level (mm) 1952 ± Ptg00A1-5.8 ± 1.5 mm/yr 1.3 ± B Preserved HLS unconformity (error bar is 2σ) Minimum HLS level Eroded HLS unconformity Growth unconformity U-Th dates (Table 1) Undated samples Horizontal datum Annual bands Clear Less clear or inferred
120 Figure mm 1765 Ptg00A ± A ± 5 Preserved HLS unconformity (error bar is 2σ) Minimum HLS level Eroded HLS unconformity Growth unconformity U-Th dates (Table 1) Undated samples Annual bands: Clear Less clear or inferred Relative sea level (mm) ± ± 2.6 mm/y Year B 1800
121 Figure Relative sea level (meters) ± ± 1797? mm/y -5.8 ± Year Pitogat
122 Figure 22abcd A ± 0.2 mm/yr Bdg00A1 0 Bdg00A Badgugu (Bdg) Relative sea level (meters) B Slg02A ±1.4 mm/yr Tsa02B1 Silogui (Slg) - Teluk Saibi (Tsa) C 4.6 ± 0.6 Skc02B ± 0.13 m 4.4 ± 1.2 mm/yr Skc02A1 Sikici (Skc) D ± 1.0 Smy03C ± 0.17 m 8.3 ± 1.2 mm/yr Smy00A1 Simanganya (Smy) Year
123 Figure 22efg E -7.2 ± 1.2 Slb00A2-6.6 ± 0.9 Slb00A4 Slb00A ± 0.15m NP94A8-12 ± ± 0.42 m -9.7 ± 2.5 mm/y Slb00A1 Relative sea level (meters) F ± 1 mm/yr Sgg03A1 Sgg03A ± 0.3 m Silabu (Slb) 7.1 ± 1.7 mm/yr Sgg03A3-1 Singinggi (Sgg) G ±3 mm/yr Smg02A ± 0.2 m 11 ± 2 P96F ± 0.48 m 13.4 ± 1.3 mm/yr Bls02A Bulasat (Bls)-Saomang (Smg)
124 Year Figure 22hij H P96H ± 0.5 m 13.4 ± 3 mm/yr Relative sea level (meters) I P96K ± 0.16 m Tiop Bay (Ttp) -4.1 ± 0.8 mm/yr P96K2 Tinopo (Tnp) J P96J ± 0.18 m 5.2 ± 1.8 mm/yr P96J3 Siatanusa (Stn)
125 A Batu 0 99E Islands 100E Figure 23ab Bdg 0.12 ± 0.05 Padang S u m a t ra n f a u l t 1S 3S Siberut S u b d u c t i o n m e g a t h r u s t Sipora 1 m Srm 1.22± m N. Pagai Slg 0.25 ± 0.25 Ptg 0.56 ± 0.56 S. Pagai Skc 1.29± S Smy 1.71 ± 0.17 Sgg 1.50 ±.30 Sbl 1.07 ± 0.32 Slb 2.17 ± 0.42 Tnp 0.88 ± 0.16 Bls/Smg 2.52± 0.50 kilometers Ttp 2.83 ± 0.50 Bkl 1.75 ± 0.40 Stn1.17 ± 0.18 B Batu 99E Islands Bdg 0.12 ± E S u m a t ra n f a u l t 0 m Padang 1S Siberut Slg 0.25 ± 0.25 Ptg 0.56 ± 0.56 Sipora S u b d u c t i o n m e g a t h r u s t 0 Skc 1.29 ± 0.13 Smy 1.71 ± S 3S 0.5 m 1 m 2 m Srm 1.22 ± 0.17 Slb 2.17 ± 0.42 Bls/Smg 2.52 ± 0.48 Sgg 1.50 ±.30 Sbl 1.07 ± 0.32 Tnp 0.88 ± 0.16 kilometers Ttp 2.83 ± 0.50 Bkl 1.75 ± 0.40 Stn1.17 ± 0.18
126 A Batu 0 m 0.5 m 1 m 99E Islands Bdg 0.2 ± E Padang S u m a t ra n f a u l t 1S Figure 24ab Siberut Slg 0.53 ± 0.30 Ptg 0.69 ± S S u b d u c t i o n m e g a t h r u s t Sipora Srm 0.7 ± 0.1 N. Pagai Slb 0.80 ± 0.20 Bls/Smg 0.86 ± 0.20 Skc 0.08 ± S Smy 0.05± 0.05 Sgg 0.37± 0.09 S. Pagai Sbl 0.49 ± 0.07 Tnp 0.05 ± 0.05 kilometers Ttp 0.03 ± 0.05 Bkl 0 ± 0.05 B Batu 0 m 0.5 m 1 m Islands 99E Bdg 0.2 ± E Padang S u m a t ra n f a u l t 1S Siberut Slg 0.83 ± S Ptg 0.69 ± 0.56 Skc 0.08 ± S S u b d u c t i o n m e g a t h r u s t Sipora Srm 0.7 ± 0.1 Slb 0.80 ± 0.20 Bls/Smg 0.86 ± 0.20 S. Pagai Smy 0.05± 0.05 N. Pagai Sgg 0.37± 0.09 Sbl 0.49 ± 0.07 Tnp 0.05 ± 0.05 Bkl 0 ± 0.05 kilometers Ttp 0.03 ± 0.05
127 40 A Rupture Depth (km) B Distance from trench (km) m Sipora 10m 5m Uplift (m) Figure 25ab Slip (m) Slip 15m 10m 5m North Pagai Slip m 10m 5m South Pagai Slip 0-1 Uplift values Down-dip limits of rupture 50 km 40 km 30 km -2 0
128 Figure 26ab m m Sipora North Pagai Uplift (m) -4 M w m South Pagai Uplift (m) 2 0 km A Distance from Trench (km) B 0
129 -1 Figure 26cd m m M w m Uplift (m) 2 0 km C 5 6 D
130 Figure 27ab Siberut m Sipora M w m 2 6 m North/South Pagai Uplift (m) 1 0 km m A 7 8 Southern South Pagai B

131
132 Figure mm/yr Depth (km) Siberut mm/yr S. Pagai Kilometers mm/yr 104
133 Figure A1 Indian Ocean E Unmapped A Apenberg B A Market E D Unmapped 0 1 Kilometers (approximate scale) C A. Fort B. Church C. Hospital D. Pepper warehouses E. Battery Sand Vegetation Roads Paths Mostly European homes & private structures Houses & structures of citizens and natives Other & unidentified structures 1781 Indian Ocean C Sand Vegetation Roads B Market A. Old fort B. Church C. Hospital D. Jail E. Customs F. Inner harbor for coastal vessels G. Government G D E A B Apenberg F 0 Kilometers Indian Ocean Imam Bonjol park Ranah Ganting C Densely populated Vegetation Roads visible on imagery 5-meter contour Pondok Pasar Gadang Nipah Padang Hill Air Manis Berok Padang Harbor 0 Bird Market Streets Batang Arau Hotel Arau River Kilometers (approximate scale)
134 Figure A2 Relative sea level (mm) A B A H E G B C F D Years I h b 35 HLS history Microatoll cross-section E B C G F D A H I h b
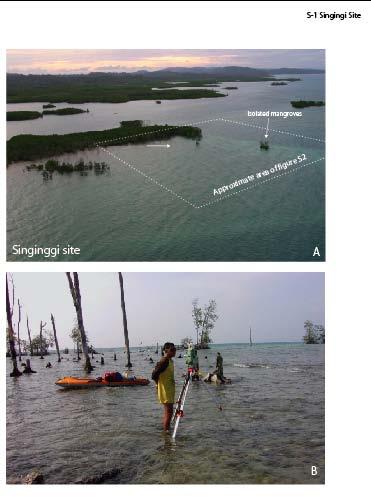
135
136 Sgg03A3 S u b - t i d a l Inner edge of living heads r e e f Figure S2 Beach Sgg03A2 Isolated mangrove M a n g Roots and snags Sgg03A4 (not slabbed) Sgg03A1 North r o v e t h i c k e Outer edge of highest old heads t Singinggi Site Sgg03A5 Outer edge of snags Surveyed Heads Modern Old
137 Figure S ± ± Sgg03A A 0 Preserved HLS unconformity (error bar is 2σ) Minimum HLS level Growth unconformity ± 1 300mm Relative sea level (mm) U-Th dates (Table 1) Undated samples 7.1 ±1.6 mm/yr Year 1990 HLS- right side HLS- left side B Annual bands Clear Less clear or inferred

138 Figure S-4 Slab cut A ± Sgg03A B mm Relative sea level (mm) 100 C ± 1 mm/yr Year Preserved HLS unconformity (error bar is 2σ) Minimum HLS level Eroded HLS unconformity Growth unconformity U-Th dates (Table 1) Undated samples Annual bands Horizontal datum Clear Less clear or inferred

139
140 Figure S 6 Micratolls N 70 A L i v i n g Died 1797 Died 1833 Living Eroded older Photos Np94A6 Np94A5 r e e f 39 h e a d s Slb00A1 S u b Slb00A2 - t i d a Silabu site l I n t e r Np94A8 - t i d a l Slb00A /34 80/ r e e f Np94A9, s S n a g s Slb00A3 Crest A B t u m p s a n d r o o t s B e a c h i n p e a t m a t M a n g r o v e Crest s w a m p meters Relative sea level (mm) B 1797 Slb00A ± ± 30 ~ Slb00A ± ± ± 7 Horizontal Scale Bar for Microatolls m ~1681 Slb00A ± living coral Low tide ± 12 Slb00A

141
Source parameters of the great Sumatran megathrust earthquakes of 1797 and 1833 inferred from coral microatolls
 JOURNAL OF GEOPHYSICAL RESEARCH, VOL. 111,, doi:10.1029/2005jb004025, 2006 Source parameters of the great Sumatran megathrust earthquakes of 1797 and 1833 inferred from coral microatolls Danny Hilman Natawidjaja,
News Release December 30, 2004 The Science behind the Aceh Earthquake
 News Release December 30, 2004 The Science behind the Aceh Earthquake PASADENA, Calif. - Kerry Sieh, the Robert P. Sharp Professor of Geology at the California Institute of Technology and a member of Caltech's
5-31. Cambodia. Vietnam. South China S ea. Malaysia. Kuala L umpur. Singapore. Kalimantan. Sunda S trait. Jakarta. Java 98E. Sumatra. Pini.
 5-31 Ridge Ninetyeast 52mm/yr Wharton For e S umatran Ridge Indian Andaman Sea arc 1861 Burma Ridge 1833 Thailand Sumatran Sliver Subduction Southeast Asian P late Malaysia Fault P Cambodia Kuala L umpur
Interseismic deformation above the Sunda Megathrust recorded in coral microatolls of the Mentawai islands, West Sumatra
 JOURNAL OF GEOPHYSICAL RESEARCH, VOL. 112,, doi:10.1029/2006jb004450, 2007 Interseismic deformation above the Sunda Megathrust recorded in coral microatolls of the Mentawai islands, West Sumatra Danny
This document is downloaded from DR-NTU, Nanyang Technological University Library, Singapore.
 This document is downloaded from DR-NTU, Nanyang Technological University Library, Singapore. Title Aceh Andaman earthquake : what happened and what's next? Author(s) Sieh, Kerry Citation Sieh, K. (2005).
Northern Simeulue Earthquake Recurrence
 Meltzner et al. Northern Simeulue Earthquake Recurrence AUXILIARY TEXT 4.1. 2004 and subsequent uplift at the Lhok Dalam (LDL) sites 4.1.1. 2004 coseismic uplift Coseismic uplift attributed to the 2004
Paleogeodetic records of seismic and aseismic subduction from central Sumatran microatolls, Indonesia
 JOURNAL OF GEOPHYSICAL RESEARCH, VOL. 109,, doi:10.1029/2003jb002398, 2004 Paleogeodetic records of seismic and aseismic subduction from central Sumatran microatolls, Indonesia Danny Hilman Natawidjaja,
CMP08-B ± 90 CMP08-B3
 1 2 3 1597 1583 CMP8-B2 1646 ± 9 1583 16 ± 21 1619 ± 2 167 1555 1612 1569 1555 1559 1597 167 cm LEGEND 1563 ± 54 U-Th sample date 1569 1559 tilted inner head CMP8-B3 1643 ± 59 1589 1597 date based on correlation
Submergence and uplift associated with the giant 1833 Sumatran subduction earthquake: Evidence from coral microatolls
 JOURNAL OF GEOPHYSICAL RESEARCH, VOL. 104, NO. B1, PAGES 895-919 JANUARY, 1999 Submergence and uplift associated with the giant 1833 Sumatran subduction earthquake: Evidence from coral microatolls Judith
Inquiry: Sumatran earthquakes with GPS Earth Science Education
 Inquiry: Sumatran earthquakes with GPS Earth Science Education www.earthobservatory.sg Preparation: Before doing this investigation, complete two introductory investigations using GPS data from UNAVCO
The Earthquake of Padang, Sumatra of 30 September 2009 scientific information and update
 The Earthquake of Padang, Sumatra of 30 September 2009 scientific information and update 01-October-2009 Christophe Vigny Directeur de recherches at CNRS Laboratoire de Géologie Geoscience Dept. Of ENS,
Lessons from the 2004 Sumatra earthquake and the Asian tsunami
 Lessons from the 2004 Sumatra earthquake and the Asian tsunami Kenji Satake National Institute of Advanced Industrial Science and Technology Outline 1. The largest earthquake in the last 40 years 2. Tsunami
Earthquakes and Earthquake Hazards Earth - Chapter 11 Stan Hatfield Southwestern Illinois College
 Earthquakes and Earthquake Hazards Earth - Chapter 11 Stan Hatfield Southwestern Illinois College What Is an Earthquake? An earthquake is the vibration of Earth, produced by the rapid release of energy.
NUMERICAL SIMULATIONS FOR TSUNAMI FORECASTING AT PADANG CITY USING OFFSHORE TSUNAMI SENSORS
 NUMERICAL SIMULATIONS FOR TSUNAMI FORECASTING AT PADANG CITY USING OFFSHORE TSUNAMI SENSORS Setyoajie Prayoedhie Supervisor: Yushiro FUJII MEE10518 Bunichiro SHIBAZAKI ABSTRACT We conducted numerical simulations
4-68. Tb /
 4-8 5 4 3 1 -.1 +/-.7 /7 Tb97 Uneroded HLS Eroded HLS Tectonic rate/displacement dashed where less certain dotted where extrapolated -.9+/17 +/-1.7 Relative Elevation of HLS (cm) -1 - -3-4 5 4 3 1 (a)
Earthquakes. Building Earth s Surface, Part 2. Science 330 Summer What is an earthquake?
 Earthquakes Building Earth s Surface, Part 2 Science 330 Summer 2005 What is an earthquake? An earthquake is the vibration of Earth produced by the rapid release of energy Energy released radiates in all
AN ABNORMAL TSUNAMI GENERATED BY OCTOBER 25 th, 2010 MENTAWAI EARTHQUAKE
 AN ABNORMAL TSUNAMI GENERATED BY OCTOBER 25 th, 2010 MENTAWAI EARTHQUAKE Bambang Sunardi 1, Suci Dewi Anugrah 2, Thomas Hardy 1, Drajat Ngadmanto 1 1 Research and Development Center, Indonesia Meteorological
A) B) C) D) 4. Which diagram below best represents the pattern of magnetic orientation in the seafloor on the west (left) side of the ocean ridge?
 B) C) D) 4. Which diagram below best represents the pattern of magnetic orientation in the seafloor on the west (left) side of the ocean ridge?") 1. Crustal formation, which may cause the widening of an ocean, is most likely occurring at the boundary between the A) African Plate and the Eurasian Plate B) Pacific Plate and the Philippine Plate C)
1. Crustal formation, which may cause the widening of an ocean, is most likely occurring at the boundary between the A) African Plate and the Eurasian Plate B) Pacific Plate and the Philippine Plate C)
Plates & Boundaries The earth's continents are constantly moving due to the motions of the tectonic plates.
 Plates & Boundaries The earth's continents are constantly moving due to the motions of the tectonic plates. As you can see, some of the plates contain continents and others are mostly under the ocean.
This document is downloaded from DR-NTU, Nanyang Technological University Library, Singapore.
 This document is downloaded from DR-NTU, Nanyang Technological University Library, Singapore. Title Tsunami inundation modeling for western Sumatra Author(s) Citation Borrero, José C.; Sieh, Kerry; Chlieh,
Chapter 1. Introduction and Synthesis
 Chapter 1 Introduction and Synthesis 1-2 Motivation: inadequacy of data for understanding earthquake cycles Understanding the behavior of active faults over multiple seismic cycles has been an elusive
This document is downloaded from DR-NTU, Nanyang Technological University Library, Singapore.
 This document is downloaded from DR-NTU, Nanyang Technological University Library, Singapore. Title Author(s) Citation Frictional afterslip following the 2005 Nias-Simeulue earthquake, Sumatra Hsu, Ya-Ju;
Plate Tectonics. entirely rock both and rock
 Plate Tectonics I. Tectonics A. Tectonic Forces are forces generated from within Earth causing rock to become. B. 1. The study of the origin and arrangement of Earth surface including mountain belts, continents,
Dynamic Earth A B1. Which type of plate boundary is located at the Jordan Fault? (1) divergent (3) convergent (2) subduction (4) transform
 divergent (3) convergent (2) subduction (4) transform") Dynamic Earth A B1 1. The edges of most lithospheric plates are characterized by (1) reversed magnetic orientation (2) unusually rapid radioactive decay (3) frequent volcanic activity (4) low P-wave and
Dynamic Earth A B1 1. The edges of most lithospheric plates are characterized by (1) reversed magnetic orientation (2) unusually rapid radioactive decay (3) frequent volcanic activity (4) low P-wave and
MAR110 LECTURE #6 West Coast Earthquakes & Hot Spots
 17 September 2007 Lecture 6 West Coast Earthquakes & Hot Spots 1 MAR110 LECTURE #6 West Coast Earthquakes & Hot Spots Figure 6.1 Plate Formation & Subduction Destruction The formation of the ocean crust
An ancient shallow slip event on the Mentawai segment of the Sunda megathrust, Sumatra
 JOURNAL OF GEOPHYSICAL RESEARCH, VOL. 117,, doi:10.1029/2011jb009075, 2012 An ancient shallow slip event on the Mentawai segment of the Sunda megathrust, Sumatra Belle Philibosian, 1 Kerry Sieh, 2 Danny
Earthquakes Chapter 19
 Earthquakes Chapter 19 Does not contain complete lecture notes. What is an earthquake An earthquake is the vibration of Earth produced by the rapid release of energy Energy released radiates in all directions
Earthquakes Earth, 9th edition, Chapter 11 Key Concepts What is an earthquake? Earthquake focus and epicenter What is an earthquake?
 1 2 3 4 5 6 7 8 9 10 Earthquakes Earth, 9 th edition, Chapter 11 Key Concepts Earthquake basics. "" and locating earthquakes.. Destruction resulting from earthquakes. Predicting earthquakes. Earthquakes
Crustal Boundaries. As they move across the asthenosphere and form plate boundaries they interact in various ways. Convergent Transform Divergent
 Name: Date: Period: Plate Tectonics The Physical Setting: Earth Science CLASS NOTES Tectonic plates are constantly moving and interacting As they move across the asthenosphere and form plate boundaries
Building Disaster Resilience Community in Asia: Indonesian perspective
 Workshop C of the 7th Science Council of Asia (SCA) Conference Construction of Secure and Safe Society against Global Changes of Natural Disasters Okinawa, June 14 th, 2007 Building Disaster Resilience
MAR110 Lecture #5 Plate Tectonics-Earthquakes
 1 MAR110 Lecture #5 Plate Tectonics-Earthquakes Figure 5.0 Plate Formation & Subduction Destruction The formation of the ocean crust from magma that is upwelled into a pair of spreading centers. Pairs
Introduction to Oceanography. Chapter 2: Plate Tectonics Overview
 Introduction to Oceanography Chapter 2: Plate Tectonics Overview Much evidence supports plate tectonics theory. The plate tectonics model describes features and processes on Earth. Plate tectonic science
USU 1360 TECTONICS / PROCESSES
 USU 1360 TECTONICS / PROCESSES Observe the world map and each enlargement Pacific Northwest Tibet South America Japan 03.00.a1 South Atlantic Arabian Peninsula Observe features near the Pacific Northwest
1.3 Short Review: Preliminary results and observations of the December 2004 Great Sumatra Earthquake Kenji Hirata
 1.3 Short Review: Preliminary results and observations of the December 2004 Great Sumatra Earthquake Kenji Hirata We give a brief review about observations and preliminary results regarding the 2004 great
Plate Boundary Observatory Working Group for the Central and Northern San Andreas Fault System PBO-WG-CNSA
 Plate Boundary Observatory Working Group for the Central and Northern San Andreas Fault System PBO-WG-CNSA Introduction Our proposal focuses on the San Andreas fault system in central and northern California.
Directed Reading. Section: The Theory of Plate Tectonics. to the development of plate tectonics, developed? HOW CONTINENTS MOVE
 Skills Worksheet Directed Reading Section: The Theory of Plate Tectonics 1. The theory that explains why and how continents move is called. 2. By what time period was evidence supporting continental drift,
Quaternary Science Reviews
 Quaternary Science Reviews 122 (2015) 258e281 Contents lists available at ScienceDirect Quaternary Science Reviews journal homepage: www.elsevier.com/locate/quascirev Time-varying interseismic strain rates
AIRCURRENTS THE TOHOKU EARTHQUAKE AND STRESS TRANSFER STRESS TRANSFER
 THE TOHOKU EARTHQUAKE AND STRESS TRANSFER AIRCURRENTS 11.2011 Edited Editor s Note: The March 11th Tohoku Earthquake was unprecedented in Japan s recorded history. In April, AIR Currents described the
Learning Objectives (LO)! Lecture 11: Plate Tectonics II! No Homework!! ** Chapter 3 **! What we ll learn today:!
! Lecture 11: Plate Tectonics II! No Homework!! ** Chapter 3 **! What we ll learn today:!") Learning Objectives (LO)! Lecture 11: Plate Tectonics II! No Homework!! ** Chapter 3 **! What we ll learn today:! 1. List the three types of tectonic plate boundaries! 2. Describe the processes occurring
Learning Objectives (LO)! Lecture 11: Plate Tectonics II! No Homework!! ** Chapter 3 **! What we ll learn today:! 1. List the three types of tectonic plate boundaries! 2. Describe the processes occurring
The Cascading Hazards from Cascadia s Earthquakes
 Tsunamis The Cascading Hazards from Cascadia s Earthquakes Earthquakes (Nisqually earthquake, Seattle, WA) Volcanoes (Mt St Helens eruption, WA) Joan Gomberg gomberg@usgs.gov Landslides (Oso landslide,
Chapter 2 Plate Tectonics and the Ocean Floor
 Chapter 2 Plate Tectonics and the Ocean Floor Chapter Overview Much evidence supports plate tectonics theory. The plate tectonics model describes features and processes on Earth. Plate tectonic science
22.5 Earthquakes. The tsunami triggered by the 2004 Sumatra earthquake caused extensive damage to coastal areas in Southeast Asia.
 The tsunami triggered by the 2004 Sumatra earthquake caused extensive damage to coastal areas in Southeast Asia. An earthquake is a movement of Earth s lithosphere that occurs when rocks in the lithosphere
The Sea Floor. Chapter 2
 The Sea Floor Chapter 2 Geography of the Ocean Basins World ocean is the predominant feature on the Earth in total area Northern Hemisphere = 61% of the total area is ocean. Southern Hemisphere = about
The 2007 Bengkulu earthquake, its rupture model and implications for seismic hazard
 The 2007 Bengkulu earthquake, its rupture model and implications for seismic hazard A Ambikapathy, J K Catherine, V K Gahalaut, M Narsaiah, A Bansal and P Mahesh National Geophysical Research Institute,
The Dynamic Crust 2) 4) Which diagram represents the most probable result of these forces? 1)
 4) Which diagram represents the most probable result of these forces? 1)") 1. The diagrams below show cross sections of exposed bedrock. Which cross section shows the least evidence of crustal movement? 1) 3) 4. The diagram below represents a section of the Earth's bedrock. The
1. The diagrams below show cross sections of exposed bedrock. Which cross section shows the least evidence of crustal movement? 1) 3) 4. The diagram below represents a section of the Earth's bedrock. The
Alfred Wegener gave us Continental Drift. Fifty years later...
 CHAPTER 2 Plate Tectonics and the Ocean Floor Plate Tectonics: summary in haiku form Alfred Wegener gave us Continental Drift. Fifty years later... Words Chapter Overview Much evidence supports plate tectonics
CHAPTER 2 THE WAY THE EARTH WORKS: EXAMINING PLATE TECTONICS
 CHAPTER 2 THE WAY THE EARTH WORKS: EXAMINING PLATE TECTONICS Coverage of plate tectonics is required early in introductory Geology as context for the mineralogy, petrology, structure, internal processes,
24. Ocean Basins p
 24. Ocean Basins p. 350-372 Background The majority of the planet is covered by ocean- about %. So the majority of the Earth s crust is. This crust is hidden from view beneath the water so it is not as
San Francisco Bay Area Earthquake Simulations: A step toward a Standard Physical Earthquake Model
 San Francisco Bay Area Earthquake Simulations: A step toward a Standard Physical Earthquake Model Steven N. Ward Institute of Geophysics and Planetary Physics, University of California, Santa Cruz, CA,
This document is downloaded from DR-NTU, Nanyang Technological University Library, Singapore.
 This document is downloaded from DR-NTU, Nanyang Technological University Library, Singapore. Title Author(s) Citation Deformation and slip along the Sunda megathrust in the Great 2005 Nias-Simeulue earthquake.
Section 7. Reading the Geologic History of Your Community. What Do You See? Think About It. Investigate. Learning Outcomes
 Chapter 3 Minerals, Rocks, and Structures Section 7 Reading the Geologic History of Your Community What Do You See? Learning Outcomes In this section, you will Goals Text Learning Outcomes In this section,
Plate Tectonics. Structure of the Earth
 Plate Tectonics Structure of the Earth The Earth can be considered as being made up of a series of concentric spheres, each made up of materials that differ in terms of composition and mechanical properties.
Earthquakes & Volcanoes
 Earthquakes & Volcanoes Geology - the study of solid Earth, the rocks of which it is composed, and the processes by which they change geo = Earth; ology = study of Earth s Layers Plate Tectonics - the
Essentials of Oceanography Eleventh Edition
 Chapter Chapter 1 2 Clickers Lecture Essentials of Oceanography Eleventh Edition Plate Tectonics and the Ocean Floor Alan P. Trujillo Harold V. Thurman Chapter Overview Much evidence supports plate tectonics
Answers: Internal Processes and Structures (Isostasy)
") Answers: Internal Processes and Structures (Isostasy) 1. Analyse the adjustment of the crust to changes in loads associated with volcanism, mountain building, erosion, and glaciation by using the concept
Answers: Internal Processes and Structures (Isostasy) 1. Analyse the adjustment of the crust to changes in loads associated with volcanism, mountain building, erosion, and glaciation by using the concept
GPS Strain & Earthquakes Unit 5: 2014 South Napa earthquake GPS strain analysis student exercise
 GPS Strain & Earthquakes Unit 5: 2014 South Napa earthquake GPS strain analysis student exercise Strain Analysis Introduction Name: The earthquake cycle can be viewed as a process of slow strain accumulation
Topic 5: The Dynamic Crust (workbook p ) Evidence that Earth s crust has shifted and changed in both the past and the present is shown by:
 Evidence that Earth s crust has shifted and changed in both the past and the present is shown by:") Topic 5: The Dynamic Crust (workbook p. 65-85) Evidence that Earth s crust has shifted and changed in both the past and the present is shown by: --sedimentary horizontal rock layers (strata) are found
Topic 5: The Dynamic Crust (workbook p. 65-85) Evidence that Earth s crust has shifted and changed in both the past and the present is shown by: --sedimentary horizontal rock layers (strata) are found
FOCAL MECHANISMS OF SUBDUCTION ZONE EARTHQUAKES ALONG THE JAVA TRENCH: PRELIMINARY STUDY FOR THE PSHA FOR YOGYAKARTA REGION, INDONESIA
 FOCAL MECHANISMS OF SUBDUCTION ZONE EARTHQUAKES ALONG THE JAVA TRENCH: PRELIMINARY STUDY FOR THE PSHA FOR YOGYAKARTA REGION, INDONESIA Myo Thant 1, Hiroshi Kawase 2, Subagyo Pramumijoyo 3, Heru Hendrayana
8.0 SUMMARY AND CONCLUSIONS
 8.0 SUMMARY AND CONCLUSIONS In November 2008, Pacific Gas and Electric (PG&E) informed the U.S. Nuclear Regulatory Commission (NRC) that preliminary results from the Diablo Canyon Power Plant (DCPP) Long
UNIT 6 PLATE TECTONICS
 UNIT 6 PLATE TECTONICS CONTINENTAL DRIFT Alfred Wegner proposed the theory that the crustal plates are moving over the mantle. He argued that today s continents once formed a single landmass, called Pangaea
2. Tsunami Source Details
 2. Tsunami Source Details The Northland area faces a range of potential tsunamigenic sources that include several local and distant fault systems and underwater landslides. A NIWA study (Goff et al. 2006)
Megathrust earthquakes: How large? How destructive? How often? Jean-Philippe Avouac California Institute of Technology
 Megathrust earthquakes: How large? How destructive? How often? Jean-Philippe Avouac California Institute of Technology World seismicity (data source: USGS) and velocities relative to ITRF1997 (Sella et
Practice Questions: Plate Tectonics
 Practice Questions: Plate Tectonics 1. Base your answer to the following question on The block diagram below shows the boundary between two tectonic plates. Which type of plate boundary is shown? A) divergent
Section 3 Deforming Earth s Crust
 Section 3 Deforming Earth s Crust Key Concept Tectonic plate motions deform Earth s crust. Deformation causes rock layers to bend and break and causes mountains to form. What You Will Learn Stress is placed
A GLOBAL SURGE OF GREAT EARTHQUAKES FROM AND IMPLICATIONS FOR CASCADIA. Thorne Lay, University of California Santa Cruz
 A GLOBAL SURGE OF GREAT EARTHQUAKES FROM 2004-2014 AND IMPLICATIONS FOR CASCADIA Thorne Lay, University of California Santa Cruz Last 10 yrs - 18 great earthquakes: rate 1.8/yr; rate over preceding century
Earthquakes. Earthquakes are caused by a sudden release of energy
 Earthquakes Earthquakes are caused by a sudden release of energy The amount of energy released determines the magnitude of the earthquake Seismic waves carry the energy away from its origin Fig. 18.1 Origin
The Indian Ocean. Copyright 2010 LessonSnips
 The Indian Ocean One of the five major geographic divisions of the world s ocean, the Indian Ocean is located in the Eastern Hemisphere. The Indian Ocean is bounded by three continents: Africa to the west,
Heterogeneous coupling of the Sumatran megathrust constrained by geodetic and paleogeodetic measurements
 Click Here for Full Article JOURNAL OF GEOPHYSICAL RESEARCH, VOL. 113, B05305, doi:10.109/007jb004981, 008 Heterogeneous coupling of the Sumatran megathrust constrained by geodetic and paleogeodetic measurements
Unit 4 - Water. Earth s Interior. Earth s Interior. Continental Drift. Continental Drift. Continental Drift. Crust. Mantle. Core.
 Unit 4 - Water How did the oceans form? What special adaptations do saltwater organisms have? Where does our water come from? How do humans affect the Earth s water? Crust Rigid outer shell of Earth Oceanic
Partial rupture of a locked patch of the Sumatra megathrust during the 2007 earthquake sequence
 1 Ref: Konca et al., Nature, vol 456 pp 631-635, Dec 4, 2008 Partial rupture of a locked patch of the Sumatra megathrust during the 2007 earthquake sequence A. Ozgun Konca 1, Jean-Philippe Avouac 1, Anthony
Seismic Characteristics and Energy Release of Aftershock Sequences of Two Giant Sumatran Earthquakes of 2004 and 2005
 P-168 Seismic Characteristics and Energy Release of Aftershock Sequences of Two Giant Sumatran Earthquakes of 004 and 005 R. K. Jaiswal*, Harish Naswa and Anoop Singh Oil and Natural Gas Corporation, Vadodara
Section Forces Within Earth. 8 th Grade Earth & Space Science - Class Notes
 Section 19.1 - Forces Within Earth 8 th Grade Earth & Space Science - Class Notes Stress and Strain Stress - is the total force acting on crustal rocks per unit of area (cause) Strain deformation of materials
Plate Tectonics - Demonstration
 Name: Reference: Prof. Larry Braile - Educational Resources Copyright 2000. L. Braile. Permission granted for reproduction for non-commercial uses. http://web.ics.purdue.edu/~braile/indexlinks/educ.htm
MARINE GEOLOGY & GEOGRAPHY
 MARINE GEOLOGY & GEOGRAPHY Bathymetry BATHYMETRY BATHYMETRY THE UNDERWATER EQUIVALENT TO TOPOGRAPHY THE STUDY OF WATER DEPTH A BATHYMETRIC MAP SHOWS FLOOR RELIEF OR TERRAIN AS CONTOUR LINES Bathymetry
TAKE HOME EXAM 8R - Geology
 Name Period Date TAKE HOME EXAM 8R - Geology PART 1 - Multiple Choice 1. A volcanic cone made up of alternating layers of lava and rock particles is a cone. a. cinder b. lava c. shield d. composite 2.
Earthquakes. Pt Reyes Station 1906
 Earthquakes Pt Reyes Station 1906 Earthquakes Ground shaking caused by the sudden release of accumulated strain by an abrupt shift of rock along a fracture in the earth. You Live in Earthquake Country
General Oceanography Geology 105 Expedition 10 - Whole Lotta Shakin' Goin' On
 General Oceanography Geology 105 Expedition 10 - Whole Lotta Shakin' Goin' On Name Not attempting to answer questions on expeditions will result in point deductions on course workbook (two or more blank
Investigation of Sumatran Fault Aceh Segment derived from Magnetotelluric Data
 Investigation of Sumatran Fault Aceh Segment derived from Magnetotelluric Data Nurhasan 1, D. Sutarno 1, Y Ogawa 2, F. Kimata 3, D Sugiyanto 4 1 Physics Department, Bandung Institute of Technology, Bandung,
Sendai Earthquake NE Japan March 11, Some explanatory slides Bob Stern, Dave Scholl, others updated March
 Sendai Earthquake NE Japan March 11, 2011 Some explanatory slides Bob Stern, Dave Scholl, others updated March 14 2011 Earth has 11 large plates and many more smaller ones. Plates are 100-200 km thick
Earthquakes. Earthquake Magnitudes 10/1/2013. Environmental Geology Chapter 8 Earthquakes and Related Phenomena
 Environmental Geology Chapter 8 Earthquakes and Related Phenomena Fall 2013 Northridge 1994 Kobe 1995 Mexico City 1985 China 2008 Earthquakes Earthquake Magnitudes Earthquake Magnitudes Richter Magnitude
MARINE GEOLOGY & GEOGRAPHY
 MARINE GEOLOGY MARINE GEOLOGY & GEOGRAPHY Marine Geology 4 LAYERS OF THE EARTH CRUST THICKNESS: VARIES BETWEEN OCEAN & CONTINENTS 5-40 KM STATE: SOLID ELEMENTS: SILICON, ALUMINUM, CALCIUM, SODIUM, POTASSIUM
GNH7/GG09/GEOL4002 EARTHQUAKE SEISMOLOGY AND EARTHQUAKE HAZARD
 Tectonics Lecture 10 Global Seismotectonics Rigid plate translation A Map of the World s Fracture Zones Magnetic anomalies and fracture zones form the basic building blocks for the construction of isochron
Lab 9: Satellite Geodesy (35 points)
") Lab 9: Satellite Geodesy (35 points) Here you will work with GPS Time Series data to explore plate motion and deformation in California. This lab modifies an exercise found here: http://www.unavco.org:8080/cws/pbonucleus/draftresources/sanandreas/
Lab 9: Satellite Geodesy (35 points) Here you will work with GPS Time Series data to explore plate motion and deformation in California. This lab modifies an exercise found here: http://www.unavco.org:8080/cws/pbonucleus/draftresources/sanandreas/
SCIENCE IN THE NEWS Plate Tectonics
 SCIENCE IN THE NEWS Plate Tectonics From VOA Learning English, this is Science in the News. I m Anna Matteo. And I m Christopher Cruise. Scientists who study the Earth tell us the continents and ocean
Get in Touch with Tapasvi IAS
 Barren Island Volcano Erupted Again, Facts About Barren Island Get in Touch with Tapasvi IAS Join us on Facebook for daily updates and important material for UPSC Join Now Join our Telegram Channel and
Name Date Class. How have geologists learned about Earth s inner structure? What are the characteristics of Earth s crust, mantle, and core?
 Chapter 4 Plate Tectonics Section 1 Summary Earth s Interior How have geologists learned about Earth s inner structure? What are the characteristics of Earth s crust, mantle, and core? Earth s surface
The Marine Environment
 The Marine Environment SECTION 16.1 Shoreline Features In your textbook, read about erosional landforms, beaches, estuaries, longshore currents, and rip currents. For each statement below, write or. 1.
THE DEPOSITS OF TSUNAMIS WESLEY PESANTEZ, CATHERINE NIELD, COLIN WINTER
 THE DEPOSITS OF TSUNAMIS WESLEY PESANTEZ, CATHERINE NIELD, COLIN WINTER AN OVERVIEW OF OUR SEMINAR WHAT IS A TSUNAMI WHY STUDY TSUNAMIS PROPERTIES OF TSUNAMIS TSUNAMI HYDRODYNAMICS IDEALIZED DEPOSITS SEDIMENT
Chapter Overview. Evidence for Continental Drift. Plate Tectonics. Evidence for Continental Drift. Evidence for Continental Drift 9/28/2010
 Chapter Overview CHAPTER 2 Plate Tectonics and the Ocean Floor Much evidence supports plate tectonics theory. Different plate boundaries have different features. Tectonic plates continue to move today.
Chapter 02 The Sea Floor
 Chapter 02 The Sea Floor Multiple Choice Questions 1. One of the following is not one of the world's major ocean basins: A. Atlantic Ocean B. Arctic Ocean C. Indian Ocean D. Antarctic Ocean E. Pacific
Introduction Faults blind attitude strike dip
 Chapter 5 Faults by G.H. Girty, Department of Geological Sciences, San Diego State University Page 1 Introduction Faults are surfaces across which Earth material has lost cohesion and across which there
Deformation of Rocks. Orientation of Deformed Rocks
 Deformation of Rocks Folds and faults are geologic structures caused by deformation. Structural geology is the study of the deformation of rocks and its effects. Fig. 7.1 Orientation of Deformed Rocks
OCN 201 Mantle plumes and hot spots
 OCN 201 Mantle plumes and hot spots Question Long-term (>50 million years) changes in sea level are caused by: A. Changes in the volume of water in the ocean B. Changes in the volume of the ocean basins
CSU Student Research Competition Summary Submission
 Name: CSU Student Research Competition Summary Submission Shawn Morrish Title: Coseismic Uplift and Geomorphic Response to the September 5, 2012 Mw7.6 Nicoya Earthquake, Costa Rica Abstract: The Nicoya
Seasonal Summary. Great Lakes Winter By the North American Ice Service
 Seasonal Summary Great Lakes Winter 2014-2015 By the North American Ice Service Summary for the Great Lakes The 2014-2015 winter in the Great Lakes region was a season that was punctuated by three distinct
21. Earthquakes I (p ; 306)
") 21. Earthquakes I (p. 296-303; 306) How many people have been killed by earthquakes in the last 4,000 years? How many people have been killed by earthquakes in the past century? What two recent earthquakes
21. Earthquakes I (p. 296-303; 306) How many people have been killed by earthquakes in the last 4,000 years? How many people have been killed by earthquakes in the past century? What two recent earthquakes
Section 2: How Mountains Form
 Section 2: How Mountains Form Preview Objectives Mountain Ranges and Systems Plate Tectonics and Mountains Types of Mountains Objectives Identify the types of plate collisions that form mountains. Identify
Indian Ocean Tsunami Warning System: Example from the 12 th September 2007 Tsunami
 Indian Ocean Tsunami Warning System: Example from the 12 th September 2007 Tsunami Charitha Pattiaratchi 1 Professor of Coastal Oceanography, The University of Western Australia Email: chari.pattiaratchi@uwa.edu.au
Plate Tectonics IDEA THAT EARTH S SURFACE IS BROKEN INTO PLATES THAT MOVE AROUND. Fault = fracture in the crust where the movement has occurred
 Warm-up #14 A mountain range found 100 meters above sea level is measured to be 1,000 meters high from its tallest peak. From the top, the first 500 meters are incredibly steep. After this point, the mountain
CHAPTER 2 NOTES -FOUNDATIONS OF GEOLOGY-
 CHAPTER 2 NOTES -FOUNDATIONS OF GEOLOGY- LESSON 2.1A: LAYERS OF THE EARTH GEOLOGY Geology- LAYERS OF THE EARTH Earth has 3 major layers based on their composition: o - the outer layer, made of solid rock.