Holocene atmospheric mercury levels. isotopes
|
|
|
- Edith Robertson
- 5 years ago
- Views:
Transcription
1 Supporting information for Holocene atmospheric mercury levels reconstructed from peat bog mercury stable isotopes Maxime Enrico*,,, Gaël Le Roux, Lars-Eric Heimbürger,#, Pieter Van Beek, Marc Souhaut, Jérome Chmeleff, Jeroen E. Sonke *, ECOLAB, Université de Toulouse, CNRS, INPT, UPS ; ENSAT, Avenue de l Agrobiopole, Castanet Tolosan, France. Laboratoire Géosciences Environnement Toulouse, Observatoire Midi-Pyrénées, CNRS/IRD/Université Paul Sabatier Toulouse III, 14 avenue Edouard Belin, Toulouse, France. Laboratoire d Etudes en Géophysiques et Océanographie, Observatoire Midi-Pyrénées, CNRS/IRD/Université Paul Sabatier Toulouse III, 14 avenue Edouard Belin, Toulouse, France. *Correspondence to: enrico@get.obs-mip.fr, sonke@get.obs-mip.fr This pdf includes: - Pages S1 S32 - Supplementary text - Supplementary figures S1-S10 - Supplementary Tables S1-S8. S1
2 Age models Pinet and Estibere peat cores were dated using the 210 Pb constant rate of supply (CRS) model 1. Profiles of excess 210 Pb are shown in Figure S2. The age models for Pinet cores were validated using independent markers. Profiles of 137 Cs activity in Pinet cores are shown in Figure S3. Only core B shows a well-defined peak in 137 Cs, which corresponds to a CRS model age range of , and is therefore highly consistent with 137 Cs emission during the Chernobyl accident in The activity of 241 Am was below the detection limits for all samples from core B. Significant 241 Am activity was detected in one sample from core A (CRS age of 1950 to 1972) and two samples from core C (CRS age of 1916 to 1972), which is consistent with 241 Am releases by nuclear weapon tests in the 60 s. Five samples from Pinet core A were dated using bomb pulse radiocarbon. The ages obtained are shown in Figure S4, and align well with the 210 Pb CRS age model. Although the 210 Pb CRS age models from the three Pinet peat cores agree well for the last years, the chronology obtained for core B for the older peat layers differ significantly from the other two cores (Figure S4). Profiles of Pb stable isotope plotted against cumulative peat mass are very consistent between the three Pinet peat cores (Figure S5). This suggests that peat accumulation was similar for the three cores despite the differences observed in the CRS age models (Figure S4). This leads to differences in Pb stable isotope chronology for core B compared to cores A and C (Figure S6). This pattern is attributed to the significant excess 210 Pb activities found in the deeper peat layers of core B than for cores A and C (Figure S2). Ignoring the 210 Pb data from the deepest peat samples from core B (B26 to B34, see Table S2) consistently aligns the age model with cores A and C (Figure S4). This makes the age model more coherent with the first conventional radiocarbon date (Figure S4), and corrects well the Pb stable isotope chronology (Figure S6). We suggest that deep peat samples from core B suffered from cross-contamination during grinding using a blender. S2
3 In addition to 210 Pb CRS dating, conventional radiocarbon dates were obtained for three samples from Pinet core A and five from Pinet core B. One single radiocarbon date was used for Estibere age model. The age models obtained using the Bacon package for R software 2 are shown in Figure S7. All the radiocarbon dates (from cores A and B) with corresponding cumulative peat masses were combined to build the age model for core C (Figure S7). We observe constant peat accumulation in deeper peat layers corresponding to the first 6000 years of peat accumulation (10, years BP), followed by a smooth transition to a period with lower peat accumulation rates. The low peat accumulation rate is attributed to higher peat decomposition, as shown by the increase in peat bulk density (Figure S7). Concerning Hg accumulation, this low peat accumulation rate is characterized by higher Hg concentrations (Figure S7), but consequently stable HgARs. Mastercore construction The chronologies of cumulative Hg inventories in the three Pinet peat cores are in very good agreement (Figure S8). In order to build one single record using these three peat cores, we smoothed cumulative Hg inventories from the three Pinet peat cores with ages (Figure S8). The mastercore HgAR is then calculated as the derivative of the smoothed curve. The uncertainties in HgAR are calculated as the difference between mastercore HgAR and individual core HgARs. Hg stable isotopes in peat Hg accumulation in peat occurs predominantly via Hg wet deposition and GEM uptake by vegetation (dry deposition) 3. The isotope signatures of Hg are helpful for quantifying the contribution of both deposition mechanisms. The peat MDF signature, δ 202 Hg, is shifted to S3
4 lower values due to the preferential uptake of light Hg isotopes during GEM uptake by sphagnum 3, 4. The mixing between GEM dry deposition and Hg wet deposition also contributes to variations in peat δ 202 Hg. Odd-Hg isotope anomalies ( 199 Hg, 201 Hg), driven by photochemical reactions during Hg cycling, are thought to be conservative during GEM uptake by vegetation and during Hg wet deposition. They are however dependent on the respective contribution of these two deposition pathways, and potentially on post-depositional photochemical Hg re-emission from sphagnum surfaces or cells. The variations in anthropogenic emissions and sources can affect the atmospheric 199 Hg (both wet deposition and GEM) as well. Even Hg isotope anomalies ( 200 Hg, 204 Hg) are the most useful signatures to estimate Hg deposition pathways. MIF of even Hg isotopes is even more restrictive than odd-isotope MIF, and is thought to occur only in the upper troposphere and stratosphere during GEM oxidation 5. Emission sources of Hg, both natural and anthropogenic, do not display significant even Hg isotope anomalies ( 200 Hg = 0) 6. Then, the peat 200 Hg signature only reflects the mixing between GEM uptake and Hg wet deposition, which have significantly different 200 Hg signatures (Figures 2, S9) 3. The Hg isotope signatures of GEM and wet deposition in the Pyrenees were determined previously 3. Peat 200 Hg (and 204 Hg) falls in between the signatures of GEM and wet deposition (Figure 2 in main text and Figure S9). An inverse relationship is found between 200 Hg and 204 Hg (Figure S9), similar to previously reported data on atmospheric samples 3, 4. Data of 204 Hg however suffer from higher analytical uncertainty, and peat 204 Hg was not measured in all samples. We therefore used 200 Hg only for the mass-balance between GEM uptake and Hg wet deposition. Hg isotope mass balance S4
5 Using a 200 Hg-based mass balance, we estimated the respective contributions of Hg wet deposition and GEM uptake to Hg accumulation in peat from Estibere and Pinet. = + (equation S1) + =1 (equation S2) This mass balance calculation assumes that 200 Hg signatures of GEM and Hg wet deposition remained constant over the Holocene. Based on the insignificant 200 Hg of all known primary Hg emission sources 6, 7 and the 200 Hg profile of Estibere showing constant peat 200 Hg (Figure 1), this assumption is thought to be reasonable. The evolution of Pinet peat 200 Hg shown in Figure 1 more likely reflects a change in the wet/dry deposition balance. The decrease in Pinet peat 200 Hg parallels the increase in HgAR since the 70 s. It is also reflected in peat 199 Hg which decreases during this period (Figure 1), and is consistent with a higher contribution from GEM uptake. As mentioned in the main text, the associated peak in HgAR at Pinet in the period is late compared to Estibere and other European records ( , n = 13) 8. The combination of 200 Hg and HgAR argues for an increase in GEM uptake rate by plants rather than enhanced Hg wet deposition or GEM concentration. On average, we find that the GEM uptake contribution to HgAR was as high as 77 ± 8 % in Pinet bog and 57 ± 8 % in Estibere. The lower GEM uptake contribution at Estibere (and thus higher Hg wet deposition contribution) can indicate either that Hg wet deposition is higher and/or that the GEM uptake rate is lower. Both possibilities are compatible with the high altitude, higher wet deposition and shorter growing season at Estibere (2100m) compared to Pinet (880m). S5
6 Past Hg wet deposition and GEM dry deposition The GEM dry and Hg wet deposition contribution we found using the 200 Hg mass balance were applied to the calculated HgAR in order to reconstruct past Hg wet deposition (HgAR dry ) and past GEM dry deposition (HgAR wet ). = (equation S3) = (equation S4) The evolution of HgAR wet and HgAR dry for Estibere record are similar to HgAR total because the contributions of GEM uptake and Hg wet deposition did not vary with time. For Pinet record, we find that GEM dry deposition alone explains the late peak in HgAR beginning around While the uncertainty is relatively high, we observe that there is no increase in HgAR wet for this period (Figure S10). We can even distinguish a decrease in HgAR wet down to very low values, but this derives more likely from the uncertainties in the calculations of HgARs and 200 Hg isotope mass-balance. The increase in Pinet HgAR dry over the last 40 years probably results from an ecological disturbance. The peat bog was drained since the 1970 s by a central 10m wide ditch, located 75m from the coring sites, which likely affected the ecosystem. GEM dry deposition is dependent on two different parameters, which are atmospheric GEM concentration and GEM uptake velocity (also called GEM dry deposition velocity, V GEM in cm s -1 ). = ( ) (equation S5) While there is no indication of any large Hg emission point source nearby the Pinet bog during the last 40 years, the GEM dry deposition velocity could have been affected by the drainage since GEM deposition velocity is suspected to change with biomass S6
7 productivity. Any increase in productivity would increase leaf surface per ground surface unit, allowing increased gas exchange (i.e. GEM uptake) with the atmosphere. Other factors could also modify GEM deposition velocity but our knowledge on GEM uptake by vegetation is still limited. Reconstruction of past GEM concentration We used equation (5) to reconstruct past atmospheric GEM concentrations from the Estibere and Pinet peat cores. This requires the knowledge of present-day V GEM and the assumption of constant V GEM with time. Present-day V GEM can be estimated using recent HgAR dry reconstructed from the peat cores (31 ± 1 and 5.2 ± 2.0 µg m -2 y -1 for Pinet and Estibere respectively) and European GEM concentrations obtained from monitoring data (1.5 ± 0.3 ng m -3 ) 9. We find recent V GEM of ± and ± cm s -1 for Pinet and Estibere respectively. The next step consists in applying this V GEM to older reconstructed HgAR dry in order to calculate past GEM concentration, still using equation (5). The Pinet record does not however satisfy the requirement of constant V GEM, as we discussed above how the drainage of the peat bog led to higher V GEM during the last 40 years. Without the knowledge of V GEM, it is therefore impossible to reconstruct past GEM concentration using the Pinet record. In Estibere record, we found no evidence for such change in V GEM (no variation in peat 200 Hg and no delayed peak in HgAR). We therefore assume that V GEM was constant over time, and reconstructed past GEM concentrations (from 800 CE to 2011 CE) using Estibere record. In order to access to pre-anthropogenic times, we attempted to estimate V GEM in Pinet for peat layers pre-dating the ecological disturbance. As for recent times, this requires the S7
8 knowledge of GEM concentration and HgAR dry. We therefore used Pinet HgAR dry reconstructed for the period (pre-disturbance) and reconstructed GEM concentration from Estibere record for the same period. This gave a pre-disturbance V GEM of ± cm s -1 at Pinet. Applying this V GEM to pre-anthropogenic times HgAR dry (1.1 ± 0.4 µg m -2 y -1 for the period BCE), for which peat 200 Hg (0.02 ± 0.04, 1σ, n = 76) is similar to peat (0.02 ± 0.03, 1σ, n = 36), gives an estimate of preanthropogenic atmospheric GEM concentration of 0.30 ± 0.13 ng m -3. S8
9 Supplementary figures Fig. S1. Location of the Pinet peat bog and Estibere peatland (map data: Google, Landsat / Copernicus) Fig. S Pb profiles of Pinet and Estibere peat cores. Fig. S Cs and 241 Am profiles in Pinet peat cores. Fig. S4. Comparison of 210 Pb CRS age model with radiocarbon dates in Pinet peat cores. The left panel shows the 210 Pb and post-bomb radiocarbon ages for the last 260 years while the right panel extends back to the first conventional radiocarbon date (from core B). Fig. S5. Profiles of Pb stable isotopes in Pinet peat cores as a function of cumulative peat mass. Fig. S6. Lead isotope chronology ( 206 Pb/ 207 Pb on the upper panels and 208 Pb/ 206 Pb on the lower panels) reconstructed using Pinet peat cores and 210 Pb CRS model (left panels) and after correcting the CRS age model for core B (right panels). Fig. S Pb and radiocarbon age models computed using Bacon package for R software, density, Hg concentration. Fig. S8. Cumulative Hg inventories (upper panel) and HgAR (lower panel) vs. time at the Pinet peat bog. The red line is the smoothed, weighted average of the three Pinet cores, and the red shaded area represents 1σ uncertainty. Red circles, triangles and squares stand for samples from Pinet peat cores A, B and C respectively. Fig. S9. Even Hg isotope anomalies in peat samples from Pinet and Estibere, wet deposition and GEM from the Pyrenees. 200 Hg (A) and 204 Hg (B) plotted against δ 202 Hg, and the inverse relationship between 200 Hg and 204 Hg (C). Rainfall and GEM data were taken from Enrico et al. (2016) 3. Fig. S10. Reconstructed HgAR wet and HgAR dry for Estibere (blue) and Pinet (red) peat cores. S9
10 Supplementary Tables Table S1. Results of radionuclides measurements ( 210 Pb, 137 Cs, 241 Am), inferred CRS model ages, radiocarbon bomb pulse datings and Pb stable isotope composition of peat samples from Pinet core A. Table S2. Results of radionuclides measurements ( 210 Pb, 137 Cs, 241 Am), inferred CRS model ages, peat Pb stable isotope composition and corrected CRS model for core B (see supplementary text). Sample B40 was dated using conventional radiocarbon dating. Table S3. Results of radionuclides measurements ( 210 Pb, 137 Cs, 241 Am), inferred CRS model ages, and Pb stable isotope composition of peat samples from Pinet core C. Table S4. Results of radionuclides measurements ( 210 Pb, 137 Cs, 241 Am) and inferred CRS model ages for Estibere peat core. Table S5. Peat Hg concentrations and Hg stable isotope signatures of Pinet core A. Table S6. Peat Hg concentrations and Hg stable isotope signatures of Pinet core B. Table S7. Peat Hg concentrations and Hg stable isotope signatures of Pinet core C. Table S8. Peat Hg concentrations and Hg stable isotope signatures of Estibere peat core. S10

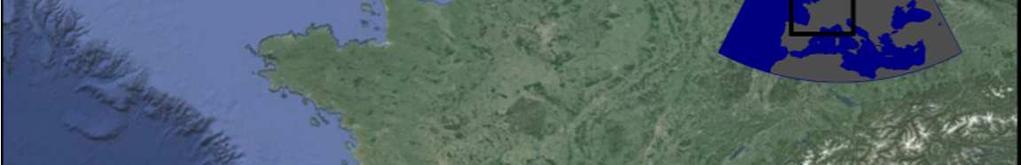

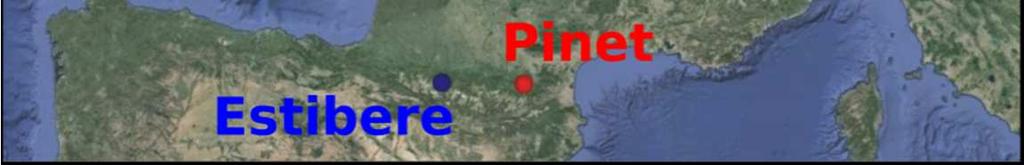
11 Fig. S1. S11
12 Fig. S2. S12
13 Fig. S3. S13
14 Fig. S4. S14
15 Fig. S5. S15
16 Fig. S6. S16


17 Fig. S7. S17
18 Fig. S8. S18
19 Fig. S9. S19
20 Fig. S10. S20
21 Table S1. sample top depth cumulative peat mass thickness bulk density 210 Pbex activity 137 Cs activity 241 Am activity CRS age (mid-point) radiocarbon age Mass AR 206 Pb/ 207 Pb cm kg m -2 cm g cm -3 Bq kg -1 ± Bq kg -1 ± Bq kg -1 ± yrs CE ± yrs CE kg m -2 yr -1 A A A A A A A A A A A A A A A A A A Pb/ 206 Pb S21
22 Table S2. sample top depth cumulative peat mass thickness bulk density 210 Pbex activity 137 Cs activity 241 Am activity CRS age (Mid-point) Mass AR 206 Pb/ 207 Pb 208 Pb/ 206 Pb corrected CRS age Mass AR cm kg m -2 cm g cm -3 Bq kg -1 ± Bq kg -1 ± Bq kg -1 ± yrs CE ± kg m -2 yr -1 yrs CE ± kg m -2 yr -1 B B B B B B B B B B B B B B B B B B B B B B B B B B B B B B B B B B B B S22
23 B B B B B S23
24 Table S3. sample top depth cumulative peat mass thickness bulk density 210 Pbex activity 137 Cs activity 241 Am activity CRS age (mid-point) Mass AR 206 Pb/ 207 Pb 208 Pb/ 206 Pb cm kg m -2 cm g cm -3 Bq kg -1 ± Bq kg -1 ± Bq kg -1 ± yrs CE ± kg m -2 yr -1 C C C C C C C C C C C C C C C C C C C C C C C C C S24
25 Table S4. sample top depth cumulative peat mass thickness bulk density 210 Pbex activity 137 Cs activity 241 Am activity CRS age (mid-point) Mass AR cm kg m -2 cm g cm -3 Bq kg -1 ± Bq kg -1 ± Bq kg -1 ± yrs CE ± kg m -2 yr -1 EST EST EST EST EST EST EST EST EST EST EST EST EST EST EST EST EST EST EST EST EST EST S25
26 Table S5. core sample depth depth cumulative peat mass density c(hg) modeled age δ 202 Hg Δ 199 Hg Δ 200 Hg Δ 201 Hg Δ 204 Hg top, cm mid-point, cm top, kg m -2 g cm -3 ng g -1 yrs AD/BC A A A A A A A A A A A A A A A A A A A A A A A A A A A A A S26
27 Table S6. core sample depth depth cumulative peat mass density c(hg) modeled age δ 202 Hg Δ 199 Hg Δ 200 Hg Δ 201 Hg Δ 204 Hg top, cm mid-point, cm top, kg m -2 g cm -3 ng g -1 yrs AD/BC B B B B B B B B B B B B B B B B B B B B B B B B B B B B B B B B B B B B S27
28 B B B B B B B B B S28
29 Table S7. core sample depth depth cumulative peat mass density c(hg) modeled age δ 202 Hg Δ 199 Hg Δ 200 Hg Δ 201 Hg Δ 204 Hg top, cm mid-point, cm top, kg m -2 g cm -3 ng g -1 yrs AD/BC C C C C C C C C C C C C C C C C C C C C C C C C C C C C C C C C C C C C S29
30 Table S8. core sample depth depth cumulative peat mass density c(hg) modeled age δ 202 Hg Δ 199 Hg Δ 200 Hg Δ 201 Hg Δ 204 Hg top, cm mid-point, cm top, kg m -2 g cm -3 ng g -1 yrs AD/BC EST EST EST EST EST EST EST EST EST EST EST EST EST EST EST EST EST EST EST EST EST EST EST EST EST EST EST EST EST EST EST EST EST S30
31 EST EST EST EST EST EST EST EST EST EST EST EST EST EST EST EST EST EST S31
32 REFERENCES 1. Appleby, P. G.; Nolan, P. J.; Oldfield, F.; Richardson, N.; Higgitt, S. R., 210Pb dating of lake sediments and ombrotrophic peats by gamma essay. Sci. Total Environ. 1988, 69, (0), Blaauw, M.; Christen, J. A., Flexible paleoclimate age-depth models using an autoregressive gamma process. Bayesian Analysis 2011, 6, (3), Enrico, M.; Roux, G. L.; Marusczak, N.; Heimburger, L. E.; Claustres, A.; Fu, X.; Sun, R.; Sonke, J. E., Atmospheric Mercury Transfer to Peat Bogs Dominated by Gaseous Elemental Mercury Dry Deposition. Environ. Sci. Technol. 2016, 50, (5), Demers, J. D.; Blum, J. D.; Zak, D. R., Mercury isotopes in a forested ecosystem: Implications for airsurface exchange dynamics and the global mercury cycle. Global Biogeochem. Cycles 2013, 27, (1), Chen, J.; Hintelmann, H.; Feng, X.; Dimock, B., Unusual fractionation of both odd and even mercury isotopes in precipitation from Peterborough, ON, Canada. Geochim. Cosmochim. Acta 2012, 90, (0), Sun, R.; Streets, D. G.; Horowitz, H. M.; Amos, H. M.; Liu, G.; Perrot, V.; Toutain, J.-P.; Hintelmann, H.; Sunderland, E. M.; Sonke, J. E., Historical ( ) mercury stable isotope inventory from anthropogenic sources to the atmosphere. Elementa: Science of the Anthropocene 2016, 4, Zambardi, T.; Sonke, J. E.; Toutain, J. P.; Sortino, F.; Shinohara, H., Mercury emissions and stable isotopic compositions at Vulcano Island (Italy). Earth Planet. Sci. Lett. 2009, 277, (1-2), Amos, H. M.; Sonke, J. E.; Obrist, D.; Robins, N.; Hagan, N.; Horowitz, H. M.; Mason, R. P.; Witt, M.; Hedgecock, I. M.; Corbitt, E. S.; Sunderland, E. M., Observational and modeling constraints on global anthropogenic enrichment of mercury. Environ. Sci. Technol. 2015, 49, (7), EMEP European Monitoring and Evaluation Programme. (accessed on 9/15/2016), S32
Chapter 6: Chronology
 6.1 21 Pb Sources and Pathways...48 6.2 Principles of 21 Pb Dating...48 6.3 Sediment Core Radionuclide Chronology...51 6.5 Sediment Core Trace Metal Chronology...57 47 6. Chronology The results from Chapter
Isotopic composition of atmospheric mercury in China: New evidence for sources and transformation processes in air and in vegetation
 Supporting Information Isotopic composition of atmospheric mercury in China: New evidence for sources and transformation processes in air and in vegetation Ben Yu 1,2, Xuewu Fu 1,*, Runsheng Yin 1, Hui
Procedia Earth and Planetary Science 13 ( 2015 ) th Applied Isotope Geochemistry Conference, AIG-11 BRGM
 th Applied Isotope Geochemistry Conference, AIG-11 BRGM") Available online at www.sciencedirect.com ScienceDirect Procedia Earth and Planetary Science 13 ( 2015 ) 282 286 11th Applied Isotope Geochemistry Conference, AIG-11 BRGM Large variation of mercury isotope
Available online at www.sciencedirect.com ScienceDirect Procedia Earth and Planetary Science 13 ( 2015 ) 282 286 11th Applied Isotope Geochemistry Conference, AIG-11 BRGM Large variation of mercury isotope
Environmental Applications
 Environmental Applications Gamma ray Spectrometry Paul Nolan University of Liverpool Gamma ray spectrometry of environmental samples is a standard technique Germanium detector Programs available for spectrum
Application of a selective extraction method. for methylmercury compound specific stable. isotope analysis (MeHg CSIA) in biological.
 in biological.") 1 Supplementary information for 2 3 4 5 Application of a selective extraction method for methylmercury compound specific stable isotope analysis (MeHg CSIA) in biological materials 6 7 Jeremy Masbou* a,
1 Supplementary information for 2 3 4 5 Application of a selective extraction method for methylmercury compound specific stable isotope analysis (MeHg CSIA) in biological materials 6 7 Jeremy Masbou* a,
Mae Gustin University of Nevada
 Mae Gustin Mae Gustin University of Nevada General -atmospheric Hg and watersheds Atmospheric contribution i from mining i Sources Form Measuring deposition Effect of mining on deposition Local Nevada
Chapter 17 Tritium, Carbon 14 and other "dyes" James Murray 5/15/01 Univ. Washington (note: Figures not included yet)
") Chapter 17 Tritium, Carbon 14 and other "dyes" James Murray 5/15/01 Univ. Washington (note: Figures not included yet) I. Cosmic Ray Production Cosmic ray interactions produce a wide range of nuclides in
Chapter 17 Tritium, Carbon 14 and other "dyes" James Murray 5/15/01 Univ. Washington (note: Figures not included yet) I. Cosmic Ray Production Cosmic ray interactions produce a wide range of nuclides in
Addressing water quantity and quality concerns in the Peace-Athabasca Delta, northern Alberta, from perspectives of the past
 Addressing water quantity and quality concerns in the Peace-Athabasca Delta, northern Alberta, from perspectives of the past Brent Wolfe, PhD Associate Professor Department of Geography and Environmental
A global ocean inventory of anthropogenic mercury
 1 von 5 18.02.2015 10:34 nature.com Publications A-Z index Cart Login Register Archive Volume 512 Issue 7512 Letters Article ARTICLE PREVIEW view full access options NATURE LETTER 日本語要約 A global ocean
Isotopes as tools. Isotopes Equal places Stable versus unstable/radiogenic (anthropogenic vs natural) Basics Examples
 Basics Examples") Discussion 2 Paper due to me Sept 30-pdf and complete citation Find a paper using isotopes as tool for understanding biogeochemical processes They may be radiogenic or stable Written paper same requirements
Discussion 2 Paper due to me Sept 30-pdf and complete citation Find a paper using isotopes as tool for understanding biogeochemical processes They may be radiogenic or stable Written paper same requirements
Possible use of airborne radionuclide content in soil and biomonitors
 Possible use of airborne radionuclide content in soil and biomonitors M. Krmar, D. Radnović 2, J. Hansman, N. Todorović, M. Velojić 3 Department of Physics, Faculty of Science, University Novi Sad, Novi
Historical Changes in Climate
 Historical Changes in Climate Medieval Warm Period (MWP) Little Ice Age (LIA) Lamb, 1969 Hunters in the snow by Pieter Bruegel, 1565 Retreat of the Rhone Glacier shown by comparing the drawing from 1750
Discussion assignment
 Discussion 2 Paper due to me Sept 28-pdf and complete citation Find a paper using isotope(s) as tool for understanding biogeochemical processes They or it may be radiogenic or stable Written paper same
Isotopes as tools.
 Basics Examples Isotopes as tools http://ethomas.web.wesleyan.edu/ees123/isotope.htm Isotopes Equal places Stable versus unstable/radiogenic (anthropogenic vs natural) N/Z = Neutrons/Protons when get to
Atmospheric Composition Matters: To Air Quality, Weather, Climate and More
 Atmospheric Composition Matters: To Air Quality, Weather, Climate and More Burkholder et al., ES&T, 2017 2 Overarching Research Need: Improve Prediction Capabilities via Incorporating/Integrating Composition,
Isotopes as tools. Isotopes Equal places Stable versus unstable/radiogenic (artificial vs natural) Examples
 Examples") Basics Examples Isotopes as tools http://ethomas.web.wesleyan.edu/ees123/isotope.htm Isotopes Equal places Stable versus unstable/radiogenic (artificial vs natural) N/Z = Neutrons/Protons when get tt to
Basics Examples Isotopes as tools http://ethomas.web.wesleyan.edu/ees123/isotope.htm Isotopes Equal places Stable versus unstable/radiogenic (artificial vs natural) N/Z = Neutrons/Protons when get tt to
Contamination of peat and moss samples 190 km from the Flin Flon Cu-Zn smelter, Canada: implications for exploration.
 Contamination of peat and moss samples 19 km from the Flin Flon Cu-Zn smelter, Canada: implications for exploration. Paul Polito, Kurt Kyser, Dave Lawie, Steve Cooke, Chris Oates Location of the Harmin
Understanding the contribution of naturally occurring radionuclides to the measured radioactivity in AWE Environmental Samples
 Understanding the contribution of naturally occurring radionuclides to the measured radioactivity in AWE Environmental Samples Dr Jonathan Burnett ASc Analytical Sciences PhD Supervisors Dr Richard Greenwood
Stable Isotopes & Biogeochemical Cycles NRES765, Fall 2011 Dr. Mae Gustin
 Stable Isotopes & Biogeochemical Cycles NRES765, Fall 2011 Dr. Mae Gustin isotope: from iso (same) and topos (place) specific combination of protons and neutrons in an atomic nucleus e.g. carbon, # protons
What is the future of Amazon
 What is the future of Amazon forests under climate change? -Increase in temperatures of ~3C -20% reduction in precipitation over 21 st cent. Two kinds of philosophy in predicting Amazon future Similar
CHIMICA DELL AMBIENTE E DEI BENI CULTURALI
 XIV CONGRESSO NAZIONALE DI CHIMICA DELL AMBIENTE E DEI BENI CULTURALI La chimica nella società sostenibile Rimini, 2-5 giugno 2013 ATTI DEL CONGRESSO www.socchimdabc.it La chimica nella società sostenibile
LAKE SEDIMENTS FROM THE KASHMIR HIMALAYAS: INVERTED 14C CHRONOLOGY AND ITS IMPLICATIONS
 [RADIOCARBON, VOL. 34, No. 3, 1992, P. 561-565] LAKE SEDIMENTS FROM THE KASHMIR HIMALAYAS: INVERTED CHRONOLOGY AND ITS IMPLICATIONS SHEELA KUSUMGAR, D. P. A GRA WAL, NARENDRA BHANDARI, R. D. DESHPANDE
A COMPARATIVE STUDY OF MONSOONAL AND NONMONSOONAL HIMALAYAN LAKES, INDIA
 A COMPARATIVE STUDY OF MONSOONAL AND NONMONSOONAL HIMALAYAN LAKES, INDIA SHEELA KUSUMGAR, D. P. AGRAWAL, R. D. DESHPANDE, RENGASWAMYRAMESH, CHHEMENDRA SHARMA and M. G. YADAVA Physical Research Laboratory,
Questions. 1. What kind of radiation dominates the first phase of radiation emission from a nuclear fireball?
 Questions 1. What kind of radiation dominates the first phase of radiation emission from a nuclear fireball? 2. What is the ignition temperature of wood? 3. What fuels a firestorm? Natural Radioactivity
Exploration of Nitrogen Total Deposition Budget Uncertainty at the Regional Scale
 Exploration of Nitrogen Total Deposition Budget Uncertainty at the Regional Scale Robin L. Dennis, Donna Schwede, Jesse Bash and Jon Pleim Atmospheric Modeling and Analysis Division NERL, EPA NADP Annual
IOP Conference Series: Earth and Environmental Science PAPER OPEN ACCESS
 IOP Conference Series: Earth and Environmental Science PAPER OPEN ACCESS Technogenic and natural radionuclides in the bottom sediments of the Sea of Azov: regularities of distribution and application to
Global Mercury Modeling at Environment Canada. Ashu Dastoor &Didier Davignon. Air Quality Research Division Environment Canada
 Global Mercury Modeling at Environment Canada Ashu Dastoor &Didier Davignon Air Quality Research Division Environment Canada Atmospheric Mercury Cycling in Environment Canada s Mercury Model - GRAHM Transport
Varve database. Grenoble, 29 June Pierre Francus, Jean-Philippe Jenny Antti Ojala, Arndt Schimmelmann, Bernd Zolitschka
 Varve database Grenoble, 29 June 2016 Pierre Francus, Jean-Philippe Jenny Antti Ojala, Arndt Schimmelmann, Bernd Zolitschka Global Varves Database Progress in the varves database Varve-related publications
Climate Change. Unit 3
 Climate Change Unit 3 Aims Is global warming a recent short term phenomenon or should it be seen as part of long term climate change? What evidence is there of long-, medium-, and short- term climate change?
Recent Climate History - The Instrumental Era.
 2002 Recent Climate History - The Instrumental Era. Figure 1. Reconstructed surface temperature record. Strong warming in the first and late part of the century. El Ninos and major volcanic eruptions are
Supplemental Information for. Thompson, L.G., et al. Ice Core Records of Climate Variability on the Third Pole
 1 1 2 3 4 5 6 7 8 Supplemental Information for Thompson, L.G., et al. Ice Core Records of Climate Variability on the Third Pole with Emphasis on the Guliya ice cap, western Kunlun Mountains 9 10 11 12
Gamma spectrometry for chronology of recent sediments Tracing human induced climate change in NW Africa
 Gamma spectrometry for chronology of recent sediments Tracing human induced climate change in NW Africa D. Pittauerová a, S. Mulitza b, H.W. Fischer a a b Institute of Environmental Physics, University
Approach Estimating Mercury Dry Deposition for AMNeT Leiming Zhang
 Approach Estimating Mercury Dry Deposition for AMNeT Leiming Zhang Air Quality esearch Division Science and Technology Branch Environment Canada, Toronto Gaseous oxidized Hg (GOM) Particulate-bound Hg
Development of the Global Environment
 Development of the Global Environment G302: Spring 2004 A course focused on exploration of changes in the Earth system through geological history Simon C. Brassell Geological Sciences simon@indiana.edu
Global Carbon Cycle - I
 Global Carbon Cycle - I OCN 401 - Biogeochemical Systems Reading: Schlesinger, Chapter 11 1. Overview of global C cycle 2. Global C reservoirs Outline 3. The contemporary global C cycle 4. Fluxes and residence
Modes of Climate Variability and Atmospheric Circulation Systems in the Euro-Atlantic Sector
 Modes of Climate Variability and Atmospheric Circulation Systems in the Euro-Atlantic Sector David Barriopedro 1,2 (1) Dpto. Física de la Tierra II, Universidad Complutense de Madrid (2) Instituto de Geociencias,
Terrestrial Mercury Dynamics
 Terrestrial Mercury Dynamics Plus: New Atmospheric Mercury Redox Chemistry 6 th GEOS- Chem Mee.ng May 7 th, 213 Bess Sturges Corbi@ corbi@@seas.harvard.edu Co- authors and collaborators: Elsie Sunderland,
Revisi&ng the GEOS- Chem atmospheric Hg simula&on: chemistry and emissions
 Revisi&ng the GEOS- Chem atmospheric Hg simula&on: chemistry and emissions Hannah M. Horowitz Daniel J. Jacob, Helen M. Amos, Theodore S. Dibble, Franz Slemr, Johan A. Schmidt, Daniel A. Jaffe, Seth Lyman,
The Mercury-Carbon Thermometer
 The Mercury-Carbon Thermometer - sedimentary mercury and organic carbon as a potential paleo-thermometer for Arctic aquatic systems Peter Outridge 1, Hamed Sanei, Fari Goodarzi, Gary Stern 3 and Paul Hamilton
Chemical Transport of Atmospheric Mercury over the Pacific
 Chemical Transport of Atmospheric Mercury over the Pacific C. Jerry Lin 1, Li Pan 1, David G. Streets 2, Carey Jang 3, and Terry Keating 4 1 College of Engineering, Lamar University, Beaumont, TX 2 ANL
Bayesian analysis of 210 P b dating
 Bayesian analysis of 210 P b dating Marco A Aquino-López Maarten Blaauw J Andrés Christen Nicole K. Sanderson arxiv:1710.03181v1 [stat.ap] 9 Oct 2017 October 10, 2017 Abstract In many studies of environmental
ATOC OUR CHANGING ENVIRONMENT
 ATOC 1060-002 OUR CHANGING ENVIRONMENT Class 22 (Chp 15, Chp 14 Pages 288-290) Objectives of Today s Class Chp 15 Global Warming, Part 1: Recent and Future Climate: Recent climate: The Holocene Climate
2. There may be large uncertainties in the dating of materials used to draw timelines for paleo records.
 Limitations of Paleo Data A Discussion: Although paleoclimatic information may be used to construct scenarios representing future climate conditions, there are limitations associated with this approach.
Sediment iron and phosphorus content in lakes Heney, des Cèdres, Bernard and Blue Sea. Yves Prairie Université du Québec à Montréal
 Sediment iron and phosphorus content in lakes Heney, des Cèdres, Bernard and Blue Sea Yves Prairie Université du Québec à Montréal February 2005 Introduction Iron is thought to play a fundamental role
EXPERIMENTAL DETERMINATION OF THE URANIUM ENRICHMENT RATIO
 NUCLER PHYSICS EXPERIMENTL DETERMINTION OF THE URNIUM ENRICHMENT RTIO. LUC Horia Hulubei National Institute for Physics and Nuclear Engineering (IFIN-HH), 407 tomistilor Street, PO Box MG-6, Magurele,
Terrestrial Climate Change Variables
 Terrestrial Climate Change Variables Content Terrestrial Climate Change Variables Surface Air Temperature Land Surface Temperature Sea Level Ice Level Aerosol Particles (acid rain) Terrestrial Climate
BIOGEOCHEMICAL CYCLES
 BIOGEOCHEMICAL CYCLES BASICS Biogeochemical Cycle: The complete path a chemical takes through the four major components, or reservoirs, of Earth s system (atmosphere, lithosphere, hydrosphere and biosphere)
Climate Changes: Past & Future (Ch 16) Iceberg 100km east of Dunedin, South Island, New Zealand, 2006
 Iceberg 100km east of Dunedin, South Island, New Zealand, 2006") Climate Changes: Past & Future (Ch 16) Climate change change in any statistical property of earth-atmosphere climate system in response to alteration of an external boundary condition or as an internal
Climate Changes: Past & Future (Ch 16) Climate change change in any statistical property of earth-atmosphere climate system in response to alteration of an external boundary condition or as an internal
Lake Levels and Climate Change in Maine and Eastern North America during the last 12,000 years
 Maine Geologic Facts and Localities December, 2000 Lake Levels and Climate Change in Maine and Eastern North America during the last 12,000 years Text by Robert A. Johnston, Department of Agriculture,
Data Analysis and Modeling with Stable Isotope Ratios. Chun-Ta Lai San Diego State University June 2008
 Data Analysis and Modeling with Stable Isotope Ratios Chun-Ta Lai San Diego State University June 2008 Leaf water is 18 O-enriched via transpiration δ 18 O vapor : -12 H 2 16 O H 2 18 O δ 18 O leaf : +8
Climate forcing volcanic eruptions: future extreme event occurrence likelihoods
 Climate Change and Extreme Events: Managing Tail Risks Workshop 2 3 February 2010 Washington DC Climate forcing volcanic eruptions: future extreme event occurrence likelihoods Willy Aspinall with apologies
HYPXIM: a second generation high spatial resolution hyperspectral satellite for the assessment of plant biodiversity
 HYPXIM: a second generation high spatial resolution hyperspectral satellite for the assessment of plant biodiversity S. Jacquemoud (1), D. Sheeren (2), X. Briottet (3), V. Carrère (4), R. Marion (5) &
1. Current acid rain data and trends.
 Lecture 24. Acid rain. Part3. Controlling acid rain. Objectives: 1. Current acid rain data and trends. 2. Acid rain control. Readings: Turco: p. 284-287; 1. Current acid rain data and trends. Monitoring
Quantitative assessment of soil erosion and deposition rates by 137 Cs measurements
 Quantitative assessment of soil erosion and deposition rates by 137 Cs measurements Authors Scope A.C. Brunner, Center for Development Research, University of Bonn, Germany Quantifying soil erosion and
Copyright is owned by the Author of the thesis. Permission is given for a copy to be downloaded by an individual for the purpose of research and
 Copyright is owned by the Author of the thesis. Permission is given for a copy to be downloaded by an individual for the purpose of research and private study only. The thesis may not be reproduced elsewhere
Sulfur Biogeochemical Cycle
 Sulfur Biogeochemical Cycle Chris Moore 11/16/2015 http://www.inorganicventures.com/element/sulfur 1 Sulfur Why is it important? 14 th most abundant element in Earth s crust Sulfate is second most abundant
Global Carbon Cycle - I
 Global Carbon Cycle - I Reservoirs and Fluxes OCN 401 - Biogeochemical Systems 13 November 2012 Reading: Schlesinger, Chapter 11 Outline 1. Overview of global C cycle 2. Global C reservoirs 3. The contemporary
Supplementary Materials for
 Supplementary Materials for The Shortest Known Period Star Orbiting our Galaxy's Supermassive Black Hole L. Meyer, A. M. Ghez, R. Schödel, S. Yelda, A. Boehle, J. R. Lu, T. Do, M. R. Morris, E. E. Becklin,
Modeling Radiological Consequences of Sever Accidents in BWRs: Review of Models Development, Verification and Validation
 Modeling Radiological Consequences of Sever Accidents in BWRs: Review of Models Development, Verification and Validation Mohamed GAHEEN Department of Research on Nuclear Safety and Radiological Emergencies,
Ammonia Emissions and Nitrogen Deposition in the United States and China
 Ammonia Emissions and Nitrogen Deposition in the United States and China Presenter: Lin Zhang Department of Atmospheric and Oceanic Sciences, School of Physics, Peking University Acknowledge: Daniel J.
Marl Prairie vegetation response to 20th century land use and its implications for management in the Everglades
 Marl Prairie vegetation response to 20th century land use and its implications for management in the Everglades C. Bernhardt, D. Willard, B. Landacre US Geological Survey Reston, VA USA U.S. Department
Extended abstract No. 281 PEAT INCREMENT IN THE OLD MIRES OF THE GREEN BELT OF FENNOSCANDIA IN KUHMO - KOSTAMUS WATERSHED AREA
 Extended abstract No. 281 PEAT INCREMENT IN THE OLD MIRES OF THE GREEN BELT OF FENNOSCANDIA IN KUHMO - KOSTAMUS WATERSHED AREA Tapio Lindholm Finnish Environment Institute, Mechelininkatu 34, FI-00250
Atmospheric Mercury Deposition Modeling
 Atmospheric Mercury Deposition Modeling Brief review and comments on remaining uncertainties Frank J. Marsik University of Michigan NADP Total Deposition Science Meeting October 28 th, 2011 Gaseous Dry
Ultratrace analysis of radionuclides by AMS
 Ultratrace analysis of radionuclides by AMS Francesca Quinto Contact information: francesca.quinto@kit.edu Karlsruhe Institute of Technology, Please insert a figure in the master transparency. KIT University
Supplementary Information for USArray Shear Wave Splitting Shows Seismic Anisotropy from Both Lithosphere and Asthenosphere
 GSA Data Repository 2015234 Supplementary Information for USArray Shear Wave Splitting Shows Seismic Anisotropy from Both Lithosphere and Asthenosphere Sutatcha Hongsresawat 1, Mark P. Panning 1, Raymond
A multi-proxy study of planktonic foraminifera to identify past millennialscale. climate variability in the East Asian Monsoon and the Western Pacific
 This pdf file consists of all pages containing figures within: A multi-proxy study of planktonic foraminifera to identify past millennialscale climate variability in the East Asian Monsoon and the Western
Using mathematical inverse theory to estimate respiratory and photosynthetic fluxes in a heterogeneous conifer canopy
 Using mathematical inverse theory to estimate respiratory and photosynthetic fluxes in a heterogeneous conifer canopy John M. Zobitz with David R. Bowling, Frederick R. Adler, James P. Keener, Jerome Ogée
Supplementary information. hair as a tracer for dietary and occupational exposure to. mercury
 Supplementary information Hg speciation and stable isotope signatures in human hair as a tracer for dietary and occupational exposure to mercury Laure Laffont 1,2,3 *, Jeroen E. Sonke 1,4 *, Laurence Maurice
Historical and Projected National and Regional Climate Trends
 Climate Change Trends for Planning at Sand Creek Massacre National Historic Site Prepared by Nicholas Fisichelli, NPS Climate Change Response Program April 18, 2013 Climate change and National Parks Climate
Lichen Radionuclide Baseline Research. By Loda Griffeth
 Lichen Radionuclide Baseline Research By Loda Griffeth Overview Definitions Importance Background: Radiation in Alaska Past Research Current Research Definitions Units Becquerel (Bq) = 1 Disintegrations/min
Medieval warmth confirmed at the Norse Eastern Settlement in. Greenland. GSA Data Repository G. Everett Lasher 1 and Yarrow Axford 1
 GSA Data Repository 2019096 1 2 Medieval warmth confirmed at the Norse Eastern Settlement in Greenland 3 G. Everett Lasher 1 and Yarrow Axford 1 4 5 1 Department of Earth and Planetary Sciences, Northwestern
Weather - the physiochemical state of the atmosphere during any short period of time.
 Weather - the physiochemical state of the atmosphere during any short period of time. Climate - the average physiochemical state of the atmosphere over the course of the year. Surface Ocean Temperatures
Externally forced and internal variability in multi-decadal climate evolution
 Externally forced and internal variability in multi-decadal climate evolution During the last 150 years, the increasing atmospheric concentration of anthropogenic greenhouse gases has been the main driver
Supplementary Figure 1. New downcore data from this study. Triangles represent the depth of radiocarbon dates. Error bars represent 2 standard error
 Supplementary Figure 1. New downcore data from this study. Triangles represent the depth of radiocarbon dates. Error bars represent 2 standard error of measurement (s.e.m.). 1 Supplementary Figure 2. Particle
Carbon Sequestration Potential from Coastal Wetlands Restoration Sites
 Carbon Sequestration Potential from Coastal Wetlands Restoration Sites Insert then choose Picture select your picture. Right click your picture and Send to back. Paul Krause, Alyssa Beach Emily Cooper,
Natural and anthropogenic climate change Lessons from ice cores
 Natural and anthropogenic climate change Lessons from ice cores Eric Wolff British Antarctic Survey, Cambridge ewwo@bas.ac.uk ASE Annual Conference 2011; ESTA/ESEU lecture Outline What is British Antarctic
Interaction matrices as a first step toward a general model of radionuclide cycling: Application to the 137 Cs behavior in a grassland ecosystem
 DOI: 10.1556/JRNC.268.2006.3.11 Journal of Radioanalytical and Nuclear Chemistry, Vol. 268, No.3 (2006) 503 509 Interaction matrices as a first step toward a general model of radionuclide cycling: Application
Joël Guiot, CEREGE, CNRS, Aix-Marseille University, Aix-en-Provence
 Joël Guiot, CEREGE, CNRS, Aix-Marseille University, Aix-en-Provence *1. Introduction *2. Paleodata syntheses and Holocene climate variations in the Mediterranean *3. Data-model comparison: large scale
Correction notice Pervasive oxygenation along late Archaean ocean margins
 Correction notice Pervasive oxygenation along late Archaean ocean margins Brian Kendall, Christopher T. Reinhard, Timothy W. Lyons, Alan J. Kaufman, Simon W. Poulton and Ariel D. Anbar The accompanying
Late Quaternary changes in the terrestrial biosphere: causes and consequences
 Late Quaternary changes in the terrestrial biosphere: causes and consequences Mats Rundgren Department of Geology Quaternary Sciences Lund University NGEN03 2014 The global carbon cycle CO 2 Ocean Marshak,
3. Carbon Dioxide (CO 2 )
") 3. Carbon Dioxide (CO 2 ) Basic information on CO 2 with regard to environmental issues Carbon dioxide (CO 2 ) is a significant greenhouse gas that has strong absorption bands in the infrared region and
3. Carbon Dioxide (CO 2 ) Basic information on CO 2 with regard to environmental issues Carbon dioxide (CO 2 ) is a significant greenhouse gas that has strong absorption bands in the infrared region and
1. 1 ( N, E) kg Tsinghua Tongfang Optical Disc Co., Ltd. All rights reserved. Vol. 22 No. 2 Apr.
 kg Tsinghua Tongfang Optical Disc Co., Ltd. All rights reserved. Vol. 22 No. 2 Apr.") 2 2 2 2 0 0 2 4 SCIENTIA GEOGRAPHICA SINICA Vol. 22 No. 2 Apr. 2 0 0 2 :1000-0690(2002) 02-0196 - 06 1 2 1 1 3 1 1 3 (1. 510640 2. 200062 3. 510650) : (SL) ( GC) 14 C (m) 0 10 cm (m) m m (T) m CO 2 0 10
2 2 2 2 0 0 2 4 SCIENTIA GEOGRAPHICA SINICA Vol. 22 No. 2 Apr. 2 0 0 2 :1000-0690(2002) 02-0196 - 06 1 2 1 1 3 1 1 3 (1. 510640 2. 200062 3. 510650) : (SL) ( GC) 14 C (m) 0 10 cm (m) m m (T) m CO 2 0 10
Human influence on terrestrial precipitation trends revealed by dynamical
 1 2 3 Supplemental Information for Human influence on terrestrial precipitation trends revealed by dynamical adjustment 4 Ruixia Guo 1,2, Clara Deser 1,*, Laurent Terray 3 and Flavio Lehner 1 5 6 7 1 Climate
We hope that these responses will meet to your expectations. We are looking forward to receiving your comments and decision. Typhaine GUILLEMOT
 Dr. Typhaine GUILLEMOT http://chrono-environnement.univ-fcomte.fr Laboratoire de Chrono-environnement Université de Franche-Comté 16, route de Gray F-25030 Besançon cedex T. +33 (0)3 81 66 62 55 (secr.
Stable Water Isotopes in the Atmosphere
 Stable Water Isotopes in the Atmosphere Jonathon S. Wright jswright@tsinghua.edu.cn Overview 1. Stable water isotopes (SWI) illustrate the tightly coupled nature of the earth system, and are useful tools
Climate-controlled multidecadal variability in North African dust transport to the Mediterranean: Supplementary Information
 GSA DATA REPOSITORY 2010004 Jilbert et al. Climate-controlled multidecadal variability in North African dust transport to the Mediterranean: Supplementary Information Construction of 210 Pb age models
Comparing 6 years of event-based rainfall deposition of mercury and major ions collected close to a coal-fired power plant with nearby NADP/MDN sites
 Comparing 6 years of event-based rainfall deposition of mercury and major ions collected close to a coal-fired power plant with nearby NADP/MDN sites A. ter Schure 1, J. Caffrey 2, W. Landing 3, N. Krishnamurthy
Analysis on the formation process of high dose rate zone in the northwest direction of the Fukushima Daiichi nuclear power plant
 Analysis on the formation process of high dose rate zone in the northwest direction of the Fukushima Daiichi nuclear power plant Jun. 13, 2011 Research group of Japan Atomic Energy Agency (JAEA) has analyzed
Supplementary Figure 1: Time series of 48 N AMOC maximum from six model historical simulations based on different models. For each model, the wavelet
 Supplementary Figure 1: Time series of 48 N AMOC maximum from six model historical simulations based on different models. For each model, the wavelet analysis of AMOC is also shown; bold contours mark
Bayesian Analysis of 210 Pb Dating
 Bayesian Analysis of 210 Pb Dating Marco A. Aquino-López, Maarten Blaauw, J. Andrés Christen, and Nicole K. Sanderson In studies of environmental change of the past few centuries, 210 Pb dating is often
Elkhorn Slough Marsh Stratigraphy
 Elkhorn Slough Marsh Stratigraphy Prehistoric marsh extent & recent sediment accretion Elizabeth Burke Watson, Ph.D. U.S. Environmental Protection Agency Narragansett, RI Paleoecology: Reconstruction of
Age constraints for groundwater using tritium concentrations:
 Anthropogenic Isotopes Reading: White s lectures #12 and 1 Faure and Mensing: Ch. 25 Also see: Ian D. Clark and P. Fritz, Environmental Isotopes in Hydrogeology, Lewis Publishers, 1997, 28 pages Guide
Assessment of atmospheric dispersion and radiological consequences for the Fukushima Dai-ichi Nuclear Power Plant accident
 Assessment of atmospheric dispersion and radiological consequences for the Fukushima Dai-ichi Nuclear Power Plant accident IRPA 13 - Fukushima session A.Mathieu, I.Korsakissok, D.Quélo, J.Groëll, M.Tombette,
Analysis of gross alpha, gross beta activities and beryllium-7 concentrations in surface air: their variation and statistical prediction model
 Iran. J. Radiat. Res., 2006; 4 (3): 155-159 Analysis of gross alpha, gross beta activities and beryllium-7 concentrations in surface air: their variation and statistical prediction model F.Arkian 1*, M.
Supporting Information for. Spatiotemporal Trends of Elemental Carbon and Char/Soot Ratios in
 1 2 3 4 Supporting Information for Spatiotemporal Trends of Elemental Carbon and Char/Soot Ratios in Five Sediment Cores from Eastern China Marginal Seas: Indicators of Anthropogenic Activities and Transport
Hydrologic control of carbon cycling and aged carbon discharge in the Congo River basin
 DOI: 1.138/NGEO2778 Hydrologic control of carbon cycling and aged carbon discharge in the Congo River basin Enno Schefuß, Timothy I. Eglinton, Charlotte L. Spencer-Jones, Jürgen Rullkötter, Ricardo De
Mapping the Baseline of Terrestrial Gamma Radiation in China
 Radiation Environment and Medicine 2017 Vol.6, No.1 29 33 Note Mapping the Baseline of Terrestrial Gamma Radiation in China Zhen Yang, Weihai Zhuo* and Bo Chen Institute of Radiation Medicine, Fudan University,
Climate Change and Predictability of the Indian Summer Monsoon
 Climate Change and Predictability of the Indian Summer Monsoon B. N. Goswami (goswami@tropmet.res.in) Indian Institute of Tropical Meteorology, Pune Annual mean Temp. over India 1875-2004 Kothawale, Roopakum
Heavy Rainfall Event of June 2013
 Heavy Rainfall Event of 10-11 June 2013 By Richard H. Grumm National Weather Service State College, PA 1. Overview A 500 hpa short-wave moved over the eastern United States (Fig. 1) brought a surge of
Lecture 28: Observed Climate Variability and Change
 Lecture 28: Observed Climate Variability and Change 1. Introduction This chapter focuses on 6 questions - Has the climate warmed? Has the climate become wetter? Are the atmosphere/ocean circulations changing?