|
|
|
- Tobias McDonald
- 5 years ago
- Views:
Transcription
 Author(s) Kim, Namgyun Citation Kyoto University ( 京都大学 )")

1 Title Numerical Study on Debris Flow Beha Dams( Dissertation_ 全文 ) Author(s) Kim, Namgyun Citation Kyoto University ( 京都大学 ) Issue Date URL Right Type Thesis or Dissertation Textversion ETD Kyoto University

2 Numerical Study on Debris Flow Behavior with Two Sabo Dams A dissertation submitted in partial fulfillment for the requirement Doctoral Degree in Civil and Earth Resources Engineering by Namgyun KIM Supervised by Prof. Hajime NAKAGAWA Disaster Prevention Research Institute River Disaster Prevention Systems Laboratory Department of Civil and Earth Resources Engineering Kyoto University Japan 2015
3 Abstract Debris flows are very dangerous phenomenon in mountainous areas throughout the world. Debris flows involve the fluidized flow of earth, rocks, vegetation etc. In addition to causing significant morphological changes along riverbeds and mountain slopes, every year, debris flows also continue to ruin lives and damage properties. Debris flow is the flow of a mixture water and solids, in which the solids are an assemblage of widely distributed grains. Therefore, an essential model of the mechanics of flow should simultaneously be considered. The rheological debris flow model depends on a variety of factors, such as sediment distribution, cohesive components, grain friction, and sediment concentration. Numerical models of debris flow based on the conservation of mass and momentum of the flow have been proposed by several researchers. These models can be classified as: the Bingham model, Dilatant model, Newtonian model, and non-linear viscoplastic models. However, the existing discrete element models that are suitable for discussing individual particle motion cannot treat solid-fluid interaction well, and more importantly, they cannot predict the macro behaviors, which is required in practice. Numerical simulations are important for ensuring that countermeasures will be efficient before construction. Countermeasures designed to reduce debris flow disasters can be classified into structural and non-structural measures. Structural measures include Sabo dams, guide levees and training channels. Sabo dams are commonly used to mitigate debris flows and they are effective countermeasures against debris flow disasters. On the other hand, non-structural measures include warning systems, proper land use in areas, reinforcement of houses, etc. To prevent or mitigate debris flow disaster, many efforts are made by the scientific and engineering communities in designing proper devices able to capture the debris flow volume. Sabo dams are an effective structural countermeasure for debris flow control. In fact, there are a many kinds of dams such as the closed-type, grid-type, slit-type, etc. In the closed-type Sabo dam, it is difficult to prevent it from losing its capturing capacity unless sediment is continuously removed. On the other hand, the open-type dam may keep its trapping capacity without sediment having to be removed. Design consideration of a Sabo dam is very important in deciding dam construction. The control function of such Sabo dams have been reported through a number of studies. In order to i
4 develop measures to increase the effectiveness of a Sabo dam, its control functions and design have been reported. In recent studies, experimental and numerical works have been performed in order to determine the general design criteria of Sabo dams. Nevertheless, there are few studies discussing the arrangement of Sabo dams. The main objective of this study is to study the debris flow reduction effect by a series of Sabo dams. Numerical simulations and experiments have been carried out so as to investigate the debris flow deposition volume of a series of Sabo dams, and also to estimate debris flow discharges at a Sabo dam site using overflow equations. A one-dimensional numerical simulation method of debris flows is presented. Numerical simulations of debris flow were conducted including overflow discharge at the dam point and laboratory experiments were performed to validate the simulation results. Comparisons between the numerical simulation results and laboratory experimental results show reasonable agreement. Application of the numerical model used here is recommended for calculating overflow discharge at Sabo dam sites and evaluating the sediment-capturing effects of Sabo dam arrangements. Keywords: debris flow, sabo dam, overflow discharge, discharge coefficient. ii
5 Acknowledgements I would never complete of my dissertation without the support of many people. I am deeply thankful to them. I am particularly grateful to my supervisor, Professor Hajime Nakagawa of Disaster Prevention Research Institute (DPRI), Kyoto University, for his valued guidance, advice, support, and encouragement while I carried my research work. I would also like to deeply grateful to Professor Kenji Kawaike of DPRI at Kyoto University, for his patience, support, caring, and guidance. Especially, he helped me when I had a hard time. I am deeply grateful to Prof. Hao Zhang and Prof. Masaharu Fujita for their valuable comments, and recommendations to refine the dissertation. I am also grateful to Ms. Iguchi Natsuyo for her helping when I was in trouble. Also, I grateful to Ms. Himuro Tomoko. Thanks to all of my colleagues with whom I studied while obtaining my PhD: Dr.Hiroshi Teraguchi, Dr. Hideaki Mizutani, Dr. Seungsoo Lee, Dr. Yeonjoong Kim, Dr. Amir Reza Mansoori, Dr. Masakazu Hashimoto, Mr. Shiro Nakanishi, Mr. Tomouki Ide, Mr. Masatoshi Ogura, Mr. Taichi Tachikawa, Mr. Osamu Kitaguchi, Mr. Shunsuke Hiratsuka, Mr. Nanahiro Tanaka, Mr. Taku Oomoto, Mr. Dongwoo Ko, Mr. Pawan Bhattarai, Mr. Rocky Talchabhadel, Ms. Yu Wang, Ms. Shoko Fujita, Mr. Shogo Harigae, Mr. Kei Nishio, Dr. Wansik Yu, Dr. Mikyung Choi, etc. Thank you for your advice and support. I am also greatly indebted to my previous supervisor Professor Byonghee Jun, Kangwon National University, Republic Korea for bringing me into this world and always caring me. I am also greatly indebted to prof. Kyewon Jun and prof. Byungsik Kim. I wish to express my greatest appreciation to the Monbukagakusho (Ministry of Education, Culture, Sports, Science, and Technology in Japan) for the financial support of my PhD study. The last word of acknowledgement I am sincerely grateful to my mother, Wonjung Choi. Namgyun KIM iii
6 Table of Contents Abstract i 1. Introduction General Literature Review Classification of Debris Flow Countermeasures Numerical Model of Debris Flow A series of Sabo Dams Objectives of the Research Outlines of the Dissertation Experiments on Arrangement of Sabo Dams General Laboratory Experiments Experiments of Debris flow Deposition by Arrangement of Sabo dams Experiments of Debris flow Discharge by Arrangement of Sabo dams Results and Discussions Deposition process by Arrangement of Sabo Dams Discharge and Sediment Concentration without a Sabo Dam 28 iv
7 2.3.3 Discharge and Sediment Concentration with a Sabo Dam Sediment Distributions Summary Numerical Simulation of Debris Flow with Arrangement of Sabo Dams General Analysis of Debris Flow Basic Equations Erosion and Deposition Velocity Equations Bottom Shear Stress Analysis of Arrangement of Sabo Dams Boundary Conditions of Sabo Dam Overflow Equations for Debris flow Discharge Solution Methods Calculation Method of Conservation of Momentum Calculation Method of Conservation of Mass and Bed Results and Discussions Compared with the Experimental Results Debris Flow Deposition Debris flow Discharge and Sediment Concentration Summary Estimation of Discharge Coefficient for Debris Flow General v
8 4.2 Experiment for Debris Flow Discharge Coefficient Theoretical Analysis Results and Discussions Discharge Coefficient by arrangement of Sabo Dam Discharge coefficient by Regression Analysis Summary Conclusions and Recommendations Conclusions Recommendations for Future Researches.. 99 References List of Figures. 105 List of Tables Curriculum Vitae Papers Based on the Thesis vi

9 CHAPTER 1 INTRODUCTION 1.1 General Sediment erosion, and the subsequent transport and deposition cycle is a natural phenomenon. Sediments are caused by localized torrential downpours, earthquakes, volcanic eruptions, and so forth. These sediments are transported by water, wind, or the force of gravity acting on the particles. So, there are many types of sediment movement like landslide, slope failure, rockfall, riverbank collapse, debris flow and so on(figure 1.1). However, these natural phenomena could be sediment-related disasters. Because urbanization continues to expand in mountainous areas, the risk of sediment-related disasters has increased. Since ancient times there have been many sediment-related disasters. At the same time, we have been controlling sediment-related disasters through countermeasures. However, we cannot protect ourselves from sediment-related disasters to save our properties and lives. Figure 1.1 Sediment-related disasters(photo source : DPWH, Japan) 1
10 Figure 1.2 Number of debris flow occurrences in Japan(Data source : MLIT, Japan) Figure 1.3 Number of dead and missing in Japan(Data source : MLIT, Japan) There are various types of mass movement involving water and sediments: lahars, debris flows, debris avalanches, granular flows, hyperconcentrated flows, and mud flows. It may difficult to distinguish one phenomenon from another. The criteria for making such distinctions are different from researcher to researcher. Debris flow is mass movement involving water and air. Debris flows have been defined by many previous researchers. The generic term debris flow can be divided into open-slope debris flow and channelized debris flow (Evans. 1982). It is a type of mass movement that involves water-charged, predominantly coarse-grained inorganic and organic material flowing rapidly down a steep confined, pre-existing channel (VanDine 1985). Debris flows occur when masses of poorly-sorted sediment, agitated and saturated with water surge down slopes in response to gravitational attraction. (Iverson 1997). Debris flow is a mixture of sediment and water flowing as if it was a continuous fluid driven by gravity, and it attains great mobility due to the enlarged void space saturated with water or slurry. (Takahashi 2
11 2007). Therefore, a debris flows starts upstream of mountainous area and is a common type of mass movement. Debris flows are found in mountainous environments, and they consist of fully saturated mixtures of water, sediment, and debris. Debris flows are widely recognized as one of the geomorphic processes in steep mountainous areas. Debris flows are initiated high on the slope of a hill when unconsolidated material becomes saturated and unstable or originate directly from landslides. They contain various particle sizes from fine material to large boulders from the channels and these large boulders accumulate at the front of the flow. It can flow down several kilometers and damage any residential areas at the foot of the mountain. Debris flows frequently cause extensive damage to property and loss of life. Because of their high density and speed, they have huge destruction power. In addition, debris flows can cause morphological changes, serious casualties, and damage to property. Figure 1.2 shows the number of occurrences of debris flow in Japan. Figure 1.3 shows the number of dead and missing due to debris flow in Japan. Debris flows occur annually and almost every year, people are threatened with debris flow disasters. Therefore, to mitigate debris flow hazard, it is important to understand debris flow through past events. Figure 1.4 shows the debris flow disaster that occurred on July 20, 2003 at the city of Minamata in Kumamoto Prefecture, Japan. Figure 1.5 shows the debris flow disaster that occurred on July 18, 2004 at the city of Sabae in Fukui Prefecture, Japan. Countermeasures designed to reduce debris flow disasters are classified into structural and nonstructural measures. Structural measures include Sabo dams, guide levees, and training channels, while non-structural measures include warning systems, proper land use in subject areas, reinforcement of houses etc. Sabo dams are an effective structural countermeasure to control debris flow. They play an important role in the management and development of a river basin. Sabo dams can be distinguished into two types: the closed and the open dam(di Silvio., 1990; Armanini et al., 1991). Closed-type Sabo dams intercept debris flow to downstream. In contrast, open-type Sabo dams are constructed with suitable openings in the body of the structure. Therefore, part of the sediment is allowed to pass through. These two types of Sabo dams are constructed in series along the channel. The advance of science and technology has led to better countermeasures for mitigating debris flow damage. To increase the effectiveness of Sabo dams, the control functions of such dams have been reported. Such Sabo dam functions have been described in many laboratory experimental studies and numerical simulation studies (Honda et al., 1997; Imran, J. et al., 2001). Also, considerable theoretical and numerical works have been undertaken on the size, shape and structure of Sabo dams (Mizuyama et al., 1988; Johnson et al., 1989). These studies contribute to technical standard guidelines on debris flows. 3

 5 Debris flow at Kuratsukuri, Miyama Town, Asuwa")
12 Figure 1.4 Debris flow at Hougawachi, Kumamoto Prefecture, Japan (Data source : Asia Air Survey Co., Ltd) Figure 1.5 Debris flow at Kuratsukuri, Miyama Town, Asuwa Gun, Fukui Prefecture Japan (Data source : SABO Dept. MLIT, Japan) 4
13 However, further studies are required in order to develop general guidelines on a series of Sabo dams. Few studies have reported the control functions of a series of Sabo dams. Therefore, the main objective of this study is to develop a reliable method to mitigate debris flow disasters with a series of Sabo dams through laboratory experiments and numerical simulations. 1.2 Literature review Classification of Debris Flow Various classifications of mass movement have been proposed. Varnes(1978) classified five kinematically distinct types of movement in the sequence: fall, topple, slide, spread, and flow. Takahashi(2001) classified subaerial mass flows consisting of granular materials focusing attention on the essential mechanisms for controlling the phenomena(figure 1.6). Table1.1 Varnes classification of slope movements Type of Movement Bedrock Type of material Engineering soils Predominantly Predominantly coarse fine Falls Rock fall Debris fall Earth fall Topples Rock topple Debris topple Earth topple Rotational Rock slump Debris slump Earth slump Slides Rock block Debris block Earth Block Translational slide slide slide Rock slide Debris slide Earth slide Lateral Spread Rock spread Debris spread Earth spread Rock flow Debris flow Earth flow Flows (deep creep) Soil creep Complex Combination of two or more principal types of movement 5
14 Figure 1.6 Takahashis classification of slope movements (Data source : Takahashi, T.: Debris flow: Mechanics, Prediction and Countermeasures) Countermeasures Countermeasures designed to reduce debris flow disasters are usually classified into structural and non-structural measures. Structural measures include Sabo dams, guide levees and training channels, while non-structural measures include warning systems, proper land use in subject areas, reinforcement of houses etc. Egashira(2007) classified measures into direct and indirect methods against landslides and debris flow(figure 1.7). Structural countermeasures are designed to effectively control debris flow occurrence, runoff, discharge and so on. On the other hand, nonstructural measures are designed to mitigate loss of property and life through systems like warning and evacuation. Structural countermeasures As mentioned above, there are several kinds of structural countermeasure against debris flow. One of them, the Sabo dam, is an effective structural countermeasure to control debris flow. The Sabo dam plays an important role in the management and development of a river basin. Sabo dams can be distinguished into two types: closed and open dams(di Silvio., 1990; Armanini et 6
15 Figure 1.7 Classification countermeasures against sediment hazards(egashira., 2007) (Data source : Egashira, S.: Review of Research Related to Sediment Disaster Mitigation) al., 1991). Closed-type Sabo dams intercept debris flow to downstream. In contrast, open-type Sabo dams are constructed with suitable openings in the body of the structure. Therefore part of the sediment is allowed to pass through. These two types of Sabo dam are constructed in series along the channel. Lateral walls(training channel) Laterals walls are constructed parallel to the desired path of the debris flow. Figure 1.8 shows the design of lateral walls along the lower portion of the transportation zone of Alberta Creek, Canada. Closed-type Sabo dam The closed-type Sabo dam is designed to mitigate debris flow or to stop debris flow. However, the closed-type dam is soon filled by sediment in areas of active sediment yield, decreasing its sediment storage capacity, thus, it cannot control debris flows successfully if it loses its storage capacity. Figure1.9 shows a closed-type Sabo dam before and after filled up sediment. 7

16 Open-type Sabo dam The purpose of the open-type Sabo dam is that it is an eco-friendly structure that self-cleans debris deposition upstream of the dam. The main part of the dam is composed of a grid, silt or screen structure. With an open-type Sabo dam, the upstream part and downstream part are continuous. Therefore, sediment carried by usual flow can take the deposited sediment and transport it downstream. However, self-cleaning is rarely occurs because the usual flow is not large enough to erode the deposited sediment. Figure 1.10 shows an open-type Sabo dam. Figure 1.8 Lateral walls(channel) (Data source: British Columbia) 8


17 (a) Before filled with up debris flow (b) After filled with up debris flow Figure 1.9 Debris flow captured by a closed-type Sabo dam. Oita Prefecture, Japan, 12 July, (Data source : MLIT) 9
 (b) Silt Sabo dam at Kanagawa Prefecture, Japan in 2003 (Data source: Kanagawa Prefectural government) (c)")
 (d) Debris breaker in Hodaka, Japan")


18 (a) Grid Sabo dam in Gifu Prefecture, Japan (Data source : Shresta et al., 2008) (b) Silt Sabo dam at Kanagawa Prefecture, Japan in 2003 (Data source: Kanagawa Prefectural government) (c) Ringnet (Data source : nbewegungen/projekte/kti_murgang/barrier_ EN) (d) Debris breaker in Hodaka, Japan 2014 Figure 1.10 Open-type Sabo Dam Non-Structural countermeasures In order to provide maximum protection for people s lives, it is important to establish nonstructural measures along with structural countermeasures because debris flows cannot be fully controlled by structural countermeasures. Non-structural countermeasures aim to mitigate damage by establishing disaster information communication systems. There are two main nonstructural countermeasures. The first is the warning and evacuation system. The other is the hazard map. Figure 1.11 shows non-structural countermeasures. 10
 (b)")
 Figure 1.")
19 (a) Warning and evacuation system (Data source : Wakayama Prefectural goverment) (b) Example of a hazard map(data source:ingv, Italy) Figure 1.11 Non-structure countermeasure 11
20 1.2.3 Numerical Model of Debris Flow Many researchers have developed various numerical models for the simulation of debris flow based on rheological models. The rheological properties depend on a variety of factors. Based on respective rheological models, dynamic approaches have been utilized. Respective rheological models can be classified into Bingham flow(johnson, 1970; Hunt, 1994), dilatant flow(bagnold, 1954; Takahashi, 1978), and turbulent flow(o Brien and Julien, 1993). At the same time, empirical-statistical approaches have been utilized. Takahashi (1991) presented empirical formulas for the thickness and probable maximum length of debris-flow deposits to delineate debris-flow hazard areas. Based on experimental data, Shieh and Tsai(1997) built the relationships among the maximum length, width and thickness of debris-flow- affected areas. These many kinds of numerical models developed can analyze debris flow and evaluate the control function of Sabo dams. However, an essential remaining problem is how the constitutive equation is obtained between particles and the interstitial fluid. Thus, flow is considered using a one-phase constant-density fluid model (O Brien et al., 1993) or a two-phase model (Takahashi and Nakagawa, 1994; Egashira et al., 1997). The one-phase model is usually used to analyze mud flow, whereas the two-phase model is used for simulation of granular flow. Lately, debris flow theories tend to utilize the two-phase model A series of Sabo Dams The Sabo dam is one of the most effective countermeasures to mitigate debris flow. The advance of science and technology has led to better countermeasures for mitigating debris flow damage. To increase the effectiveness of a Sabo dam, the control functions of such dams have been reported. Such Sabo dam functions have been described in many laboratory experimental studies and numerical simulation studies (Honda et al., 1997; Imran, J. et al., 2001). In the real field, not just one Sabo dam but several Sabo dams are installed on the channel to control the debris flow. Figure 1.12 shows a series-type Sabo dam. These plans should consider the relationships between each Sabo dam. Fujita et al.(2001), Nakatani et al.(2009) studied the function of a series of Sabo dams in sediment runoff control using a numerical simulation. However, further studies are required so as to develop general guidelines on a series of Sabo dams. Few studies have reported the control functions of a series of Sabo dams. 12
 (b) Concept of layout of driftwood countermeasure facilities(mlit) Fig.1.")
21 (a) A series of Sabo dams in Nagano Prefecture (Data source : (b) Concept of layout of driftwood countermeasure facilities(mlit) Fig.1.12 A series of Sabo Dam 13
22 1.3 Objectives of the research The main objective of this study is to study debris flow reduction effect by a series of Sabo dams through numerical simulations and laboratory experiments. Some of the objectives of this research are as follows. 1. To develop a one-dimensional numerical model of the debris flow reduction effect by a series of Sabo dams 2. To suggest a calculation method for estimating debris flow discharge at a series of Sabo dams. 3. To investigate the effectiveness of a series of Sabo dams in reducing the debris flow. 4. To suggest a discharge coefficient for a series of Sabo dams in the case of debris flow. 1.4 Outlines of the Dissertation This research consisting of five chapters is organized as follows. Chapter 1 presents a brief review of the previous literature, background to the work, and objectives of the study. Chapter 2 presents laboratory experimental studies to calculate debris flow outflow discharge and sediment concentration at a Sabo dam, and to obtain data on debris flow deposition upstream of a series of Sabo dams. Chapter 3 presents a numerical simulation model of debris flow with a series of closed-type Sabo dams. Overflow equations and free overfall equations are presented to evaluate debris flow discharge at the dam position. Chapter 4 presents a discharge coefficient for debris flow. The discharge coefficient of the overflow equations and free overfall equations is estimated through regression analysis. Chapter 5 summarizes the conclusions of the study and recommendations for the future researches. 14
23 CHAPTER 2 EXPERIMENTS ON ARRANGEMENT OF SABO DAMS 2.1 General In mountain areas, Sabo dams are an effective structure for the control of the debris flow. Sabo dams are installed to reduce sediment runoff by storing sediment in the channels of steep gullies to mild channel beds. Sabo dams have three functions when installed on channels: 1) to reduce sediment runoff volume; 2) to reduce the channel gradient; 3) to protect against failure of the sidewall of the valley. When installed on debris slides, the volume of reduction shall be distributed over the design sediment storage capacity of the Sabo dam. The sediment storage capacity of the Sabo dam is determined by normal sediment gradient and planned sediment gradient. Figure 2.1 shows the sediment storage capacity of Sabo dam. When a Sabo dam is installed on the channel, sediment starts to accumulate upstream of the Sabo dam due to debris flow. After the Sabo dam is filled up to a stable state by sediment, debris flow flows to downstream of the Sabo dam. At this time, some sediment is deposited temporarily on the stable slope because the gradient is changed more gently from channel gradient to normal sediment gradient. This amount of sediment is the potential storage volume. This sediment is removed by flat flow and once again the potential storage part is empty. When debris flow occurs again, this potential storage part catches the sediment. Through this process debris flow is controlled by the Sabo dam. Figure 2 shows the debris-flow-capturing process. 15

24 Figure 2.1 Sediment storage capacity of a Sabo dam. Figure. 2.2 Debris-flow-capturing process(mlit) As stated above, Sabo dams are installed not singly in one channel. When a series of Sabo dams is installed, the relationships among each of the Sabo dams are important for controlling the debris flow effectively. As shown in Figure 2.2, the spacing between Sabo dams depends on the channel gradient, dam height, and angle of deposition of material behind the dam. Chatwin et al. (1994) provides a formula for the spacing of Sabo dams: 16
25 L > H d tan (θ θ e ) (2.1) where L is the minimum between Sabo dams, H d is the height of dam, θ is original channel gradient, and θ e is the equilibrium bed slope. Minimum spacing between dams is determined by the capture volume of the Sabo dam. Since the evaluation of the control function of Sabo dams is based on the assumption that Sabo dams are initially filled with sediment up to the crest level, estimation of the sediment volume trapped by each Sabo dam is carried out based on the potential storage volume (V p ) of each dam, which can be defined by the equilibrium and initial bed deposition slopes. V p is described as follows. V p = (H d cosθ) 2 B 2 1 { tan (θ θ e ) 1 tan (θ θ 0 ) } (2.2) where H d is height of the dam, B is the flow width, and θ 0 is the initial bed slope of the storage area before the occurrence debris flow. Minimum spacing between Sabo dams is determined according to the potential storage volume. This potential storage volume is determined by the planned sediment gradient and normal sediment gradient. The slope of normal sediment gradient is half of the tangential value of the original bed slope. And the slope of the planned sediment gradient is two-thirds of the tangential value of the original bed slope. These values are derived from past disasters (Osansi 2010). Another way is where the storage volume of the Sabo dam can be changed according to the distance between two Sabo dams. In other words, the potential storage volume depends on the distance between two Sabo dams. 2.2 Laboratory Experiments To understand the reduction effects of debris flow discharge and to clarify debris flow deposition upstream of Sabo dams, experiments were carried out in two flumes located at the Ujigawa Open Laboratory of the Disaster Prevention Research Institute, Kyoto University, Kyoto, Japan. 17
. This flume is divided into two parts by a 10 cm high sand stopper.")
26 2.2.1 Experiments of Debris Flow Deposition by Arrangement of Sabo Dams Experimental setup Initially, a recirculating flume is used to study debris flow deposition upstream of Sabo dams. The flume length is 4.7 m, 20 cm high, 10 cm wide, slope 18 (Figure 2.3). This flume is divided into two parts by a 10 cm high sand stopper. The upper part of the flume is movable bed, and the lower part is fixed bed. In the movable bed, sediment deposition height is 10 cm. Debris flow is generated upstream of the sand stopper and generated debris flow flows to downstream of the sand stopper. At the downstream part of the flume, the first Sabo dam is set 10 cm above the outlet of the flume and the second Sabo dam is set at 30 cm, 55 cm, 80 cm, respectively, above the first Sabo dam(figure 2.4). The height of the Sabo dams is 6 cm high, the thickness is 1 cm, and they are the closed-type. At the upstream part of the flume, a sediment bed of 1.5 m long and 10 cm deep is positioned 3 m to 4.5 m upstream measured from the outlet of the flume (Figure 2.5). The sediment consists of gravel sand (G1 and G2) and silica sand (S1, S2, S3, S4, S5 and S6). Table 2.1 shows the median value of diameters and mixing ratio of the sediments. Figure 2.6 shows the particle size distribution of mixed sediment. Mixed sediment materials are mean diameter d m =2.86 mm maximum diameter d max =15 mm and density σ =2.65 g/cm 3 The internal friction angle of a sediment is tan φ = 0.7. Figure 2.3 Experimental flume 18

 15 10 4.26 2.56 1.85 0.94 0.67 0.")
27 Figure 2.4 Experimental Sabo dam Figure 2.5 Upstream deposited sediment Table 2.1 Sediment Material Type G1 G2 S1 S2 S3 S4 S5 S6 D 50 (mm) Ratio
. There are two pumps.")

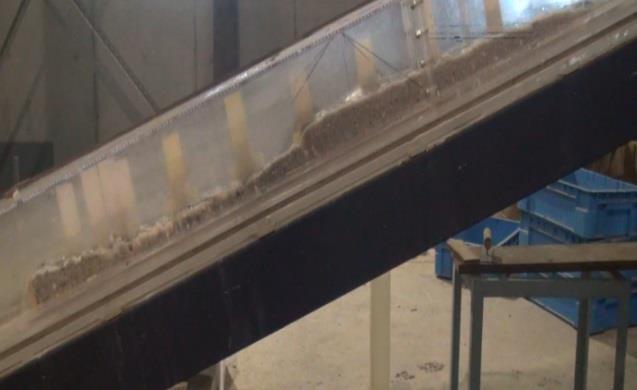
28 Figure 2.6 Particle size distribution of sediment materials Experimental methods To generate debris flow, water is supplied to the deposited sediment upstream of the flume. Under dry conditions, debris flow is not generated. Thus, before water is supplied, the deposited sediment bed should be saturated (Figure 2.7). There are two pumps. The main pump (a) supplies a constant water discharge to generate debris flow, and the other pump (b) supplies a little water discharge to saturate the sediment bed. While the bed is being saturated, the water level should be lower than the height of the sediment bed. If the water level is higher than the height of the sediment bed, the sediment bed will collapse. In order to prevent this situation, additional sediment is provided at the upstream end of the sediment bed. After fully saturating the sediment bed (a thin water layer is formed on the sediment bed), debris flow is generated by supplying the water using the main pump. The generated debris flow goes to the downstream part of the flume, and it is captured by the Sabo dams. This process is recorded by video cameras (Figure 2.8). 20


29 Figure. 2.7 Upstream part of the flume Figure. 2.8 Experimental method Experimental conditions Table 2.2 shows the experimental conditions. Experimental cases are divided by distance between two Sabo dams and supply water time. Case A and B mean that the durations of supply water are 10 and 20 seconds, respectively. Case 1, 2 and 3 mean that the distances between Sabo dams are 30cm, 55cm, and 80cm respectively. As the height of each Sabo dam is 6cm, the standard distance between two Sabo dams are around 55 cm through Equation (2.1). Therefore, the distance between the Sabo dams is set to be shorter and further, respectively, than the standard. 21
30 Table 2.2 Experimental conditions Supply water Distance between Experiment Time discharge each dam no. (sec) (cm 3 /s) (cm) Case.A Case.A Case.A Case.B Case.B Case.B Movable bed height (cm) 10 Table 2.3 Experimental conditions Supply water Distance of Experiment Time Discharge each dam No. (sec) (cm 3 /s) (cm) Case.C Case.C Case.C Movable bed height (cm) Experiments of Debris flow Discharge by Arrangement of Sabo Dams This experimental method is similar to the above experimental method. A recirculating flume of 6.5m long, 10cm wide, 13cm deep, and with a slope of 18 was used. Movable bed height is 8 cm. The first Sabo dam is set at the downstream end of the flume, and the second Sabo dam is set 30cm, 55cm and 80cm, respectively, far from the first Sabo dam. Table 2.3 shows the experimental conditions. This condition is the same as that of Case B except flume length. The reason for separating divide Case B and C even under the same conditions that Case B is for debris flow capture volume, and Case C is for debris flow discharge, and debris flow deposition upstream of Sabo dam. To measure the debris flow discharge and sediment concentration, sampler boxes were used. Through the video camera, the residence time of debris flow in each sampler box was calculated. Figure 2.9 shows the sampler box under the flume mouth. This measurement was conducted 22
 during the course of the experiment.")
31 several times under same experimental conditions in order to obtain reliable data. However, it was difficult to measure the debris flow discharge and sediment at the second Sabo dam(upper Sabo dam) during the course of the experiment. Therefore, the positions of the Sabo dam and sediment bed were moved. Figure 2.10 shows the positions of Sabo dam and the sediment bed. Figure 2.9 sampler boxes (a) Measuring debris flow discharge at the first located Sabo dam (lower Sabo dam) (b) Measuring debris flow discharge at the first Sabo dam (Upper Sabo dam) Figure 2.10 Experimental setup 23

32 2.3 Results and Discussions Deposition Process by Arrangement of Sabo Dams Figure 2.11 shows the total debris flow capture volume at each Sabo dam. Case B-2 shows the biggest value of total debris flow capture volume at the lower Sabo dam. And debris flow captured volume is similar to each other. By the way, Case A-1, Case B-1, and Case B-2 the upper Sabo dam was buried (Figure 2.13). This means that the distance between Sabo dams was insufficient. Figure 2.12 and Figure 2.13 show the final debris flow deposition by arrangement of Sabo dams. From the figure, the longer the water supply time, the higher the deposition height and the longer the deposition length. The reason is that, in Case A, the generated debris flow was almost completely captured by two Sabo dams. There was a small amount of debris flow discharge at the outlet of the flume As mentioned above, Case A-1, Case B-1, and Case A-2 show that the upper Sabo dam was buried by debris flow. This means that the planned sediment gradient of the lower Sabo dam was changed due to the upper Sabo dam. As the planned sediment gradient changed, the potential storage volume is changed. Figure 2.14 shows the debris flow deposition according to the change of duration in Case C-1, Case C-2, Case C-3. In this figure, Time 0 means that the debris flow s arrival time to the upper Sabo dam. Debris flow is deposited by the Sabo dams and the deposited sediment in the most upstream area of the deposition is eroded by the coming debris flow at the upper Sabo dam. Fig.2.11 Debris flow captured volume 24
33 (a) Case.A-1, B-1 (b) Case.A-2, B-2 (c) Case.A-3, B-3 Figure 2.12 Final debris flow deposition upstream of the Sabo dams 25


34 Case A-1, B-1 Case A-2, B-2 Case A-3, B-3 Figure 2.13 Final debris flow deposition upstream of the Sabo dams(picture) 26
35 (a) Case C-1, (b) Case C-2, (c) Case C-3, Figure 2.14 Debris flow deposition process upstream of Sabo dams 27
36 2.3.2 Discharge and Sediment Concentration without a Sabo Dam To calculate the discharge and sediment concentration, experimental data of Case C was used. Before measuring the debris flow discharge and sediment concentration at the Sabo dam, a preparatory experiment was conducted without Sabo dams. In the following figures, time 0 means that the debris flow s arrival time to the downstream end of the flume. Figure 2.15 shows the clear water discharge at the outlet of the flume. There is no sediment bed in this case. Figure 2.16 shows the debris flow discharge, sediment discharge, and sediment concentration at the outlet of the flume. In this case, there is sediment bed at the upstream of the flume. Debris flow peak discharge was 872 cm 3 /s, and peak sediment discharge was cm 3 /s, sediment concentration indicated 35~40%. Figure 2.15 Clear water discharge at the outlet flume without Sabo dam 28
37 (a) Debris flow discharge and sediment discharge Sediment concentration Fig2.16 Debris flow discharge, sediment discharge, and sediment concentration without Sabo dam 29
38 2.3.3 Discharge and Sediment Concentration with a Sabo Dam Figure 2.17 shows the debris flow discharge at the dam point. In this graph, Time 0 means the time of starting to supply clear water in the flume. The start time of the red color means the overflow time at upper Sabo dam. The start time of the green color means the overflow time at lower Sabo dam. The start time of the blue color has no meaning, because the value of blue color is calculated at outlet of Sabo dam. It is just moved to time 12sec to compare no Sabo dam case and with Sabo dam case easily. As the debris flow goes by the Sabo dam, discharge was decreased. Also, sediment discharge was decreased. In the case of no Sabo dam, debris flow peak discharge was 872 cm 3 /s and peak sediment discharge was cm 3 /s. Peak debris flow discharge in Case C-1 was decreased to 619 cm 3 /s at the upper Sabo dam and to cm 3 /s at the lower Sabo dam. Sediment peak discharge was decreased to cm 3 /s at the upper Sabo dam and cm 3 /s at the lower Sabo dam. Peak debris flow discharge in Case C-2 was decreased to cm 3 /s at the upper Sabo dam and to cm 3 /s at the lower Sabo dam. Sediment peak discharge was decreased to cm 3 /s at the upper Sabo dam and to cm 3 /s at the lower Sabo dam. Peak debris flow discharge in Case C-3 was decreased to cm 3 /s at the upper Sabo dam and to cm 3 /s at the lower Sabo dam. Sediment peak discharge was decreased to cm 3 /s at the upper Sabo dam and to cm 3 /s at the lower Sabo dam. Table 2.4 shows the decrease rate of debris flow and sediment. Decrease rate is calculated as follows: Decrease rate at the upper Sabo dam Decrease rate(%) = 1 ( Peak discharge at the upper Sabo dam Peak discharge in case of No Sabo dam ) 100 (2.1) Decrease rate at the lower Sabo dam Decrease rate(%) = 1 ( Peak discharge at the lower Sabo dam ) 100 (2.2) Peak discharge at upper Sabo dam Total decrease rate Total decrease rate(%) = 1 ( Peak discharge at the lower Sabo dam Peak discharge in case of No Sabo dam ) 100 (2.3) 30
39 From the table, the greater the distance between two Sabo dams, the higher decrease rate of debris flow and sediment discharge. Figure 2.18 shows the sediment concentration. In the case of no Sabo dam, sediment concentration is consistent at around 35%. As the debris flows past the upper Sabo dam, sediment concentration decreased to around 30% and when passing the lower Sabo dam, sediment concentration further decreased. However, overflowed debris flow at the lower Sabo dam does not have a consistent sediment concentration. The initial sediment concentration is lower than 5%. This means that debris flow is not fully developed reaches at the lower Sabo dam. As debris flow overflows the Sabo dam, sediment is captured by the Sabo dam. Therefore, the forefront of the debris flow has a low sediment concentration. Table 2.4 Debris flow and sediment peak discharge No dam Case C-1 Case C-2 Case C-3 Debris flow Sediment Debris flow Sediment Debris flow Sediment Debris flow Sediment upper lower upper lower upper lower upper lower upper lower upper lower Peak discharge (cm 3 /s) Decrease Rate (%) Total decrease Rate (%) 31
40 (a) Case.C-1 (b) CaseC-2 (c) CaseC-3 Figure 2.17 Debris flow discharge at each Sabo dams 32
41 (a) Case.C-1 (b) CaseC-2 (c) CaseC-3 Figure 2.18 Sediment concentration at each Sabo dams 33
42 2.3.4 Sediment Distributions Debris flow transports sediment of various sizes from fine particles to large boulders. According to grain size, the debris flow properties change. Grain size distribution analyses were performed to find the median grain diameter and how the grain size changes as debris flow is captured by the Sabo dam. Figure 2.19 shows the grain size distribution. All of cases show the same aspects. The median value of the sediment captured by the upper Sabo dam was smaller than sediment captured by the lower Sabo dam. And the median value of the sediment that captured by the lower Sabo dam was smaller than the sediment captured by sampler boxes. Sediment in the sampler boxes means that outflowed debris flow at the outlet of the flume. In reality, the forefront part of debris flow have big boulders. Therefore it is expected that the median value of the sediment captured by the upper Sabo dam is larger than that of sediment captured by the lower Sabo dam. However, the experimental results represent against the real situation. This is because the flume length is not enough to make a fully developed debris flow. In other words, if flume length is enough long to make that big boulders move in front part of debris flow in the equilibrium bed gradient, the median value of the sediment captured by upper Sabo dam will bigger than that of sediment captured by lower Sabo dam. Table 2.5 Sediment size distribution (unit : mm) Sediment CaseC-1 CaseC-2 CaseC-3 bed upper lower outer upper lower outer upper lower outer Median diameter 34

43 (a) Case C-1 (b) Case C-2 (c) Case C-3 Figure 2.19 Sediment Distributions 35
44 2.4 Summary This chapter describes the experimental setup and method in order to measure the debris flow discharge and debris flow deposition by arrangement of Sabo dams. Debris flow deposition at each Sabo dams could be measured during the course of the experiment. However measuring the debris flow discharge at the each Sabo dams are difficult during the course of the experiment. Therefore, to obtain the debris flow discharge at each Sabo dams, experiments were carried out two times in same conditions. First time, debris flow discharge is measured at the lower Sabo dam. Second time, debris flow discharge is measured at the upper Sabo dam through change the position of Sabo dam and sediment bed. From the debris flow deposition results, lower Sabo dam was buried in Case A-1, Case B-1 and Case A-2. This means that the planned sediment gradient of the lower Sabo dam was changed by upper Sabo dam. Because of upper Sabo dam, debris-flow-capturing capacity of lower Sabo dam was changed. Therefore, the distance between Sabo dams should be determined considering upper Sabo dam s affects to debris-flow-capturing capacity of lower Sabo dam. From the debris flow discharge results, debris flow discharge, and sediment concentration were decreased as debris flowed past the Sabo dam. However, the sediment concentration at lower Sabo dam was lower than 5% in the beginning, and rise up to around 30%. These experimental results are compared with the simulation results in chapter 3. 36
45 CHAPTER 3 NUMERICAL SIMULATION OF DEBRIS FLOW WITH ARRANGEMENT OF SABO DAMS 3.1 General A number of countries have been affected by debris flows. Recently, the risk of debris flow has increased owing to global climatic change. This has led to an understanding of the physical mechanisms that govern the triggering of debris flow, their mobilization along the channel, deposition in the fan areas and so on. Many researchers of a variety of countries studies have been conducted in Japan, Korea, China, US, Canada, France, Switzerland, Italy and so on. Many numerical models of debris flow as a mixture of sediment and water have been developed. Bagnold(1954) presented his dilatant fluid model, and a large number of other constitutive laws have been put forward. Takahashi(1991) gives a critical account of the mechanisms of debris flow. He used the model equations of the two-phase model, which were simplified to a one-phase model. Similarly, Chen(1987) presents a detailed analysis of rheological models. Scheiwiller & Hutter (1982) study the formulation of the constitutive relations for granular materials under rapid shearing. Campbell(1990) reviews the interaction rules for collision. And Straub(1995) demonstrates in a voluminous dissertation its use in pyroclastic flows. Table 3.1 shows the hierarchy of debris flow models. In this study, a two-phase model was chosen. An important concept is the mechanism of solidliquid phase flow. Respective rheological models can be classified as Bingham flow, dilatant flow, and turbulent flow of high-concentration flow. Bingham flows have been studied with fine 37
46 Table 3.1 Varnes classification of slope movements Single-phase model Two-phase model Diffusive model Balance relations Mixture mass Mixture momentum Solid mass Fluid mass Solid momentum Fluid momentum Solid mass Fluid mass Mixture momentum Constitutive relations Mixture stress Solid stress Fluid stress Interaction force Diffusive mass flux Mixture stress Mixture meaning : Deposition and Thermodynamics solids + fluids erosion can be implies that the Deposition and incorporated. model is Remarks erosion processes allow no spate The model appropriate when appropriate only in a hydraulic-type treatment of water density variations formulation and sediments over depth are significant. Incorporation of Incorporation of Incorporation of Possible extensions fluctuation energy balance relations for mixtures. fluctuation energy balance relations for fluids and fluctuation energy balance relations for mixtures. solids particles, yield shear stress and apparent coefficient of viscosity. Study of dilatant flows requires two kinds of methodology for the flow mechanism. One is where the shear stress of flow can be evaluated from energy loss due to the non-elastic properties of particles during the collision of particles. The other is where the shear stress of flow can be evaluated as a component of the repulsive force in the flow direction due to the elastic properties of particles during the collision of particles. The turbulent flow analysis method is not being utilized systematically. Only few experimental studies have been reported. The advance of science and technology has led to better countermeasures for mitigating debris flow damage. To increase the effectiveness of Sabo dams, the control functions of such dams have been reported. Such Sabo dam functions have been described in many theoretical and numerical simulation studies (Honda et al., 1997; Imran, J. et al., 2001). Also, considerable theoretical and numerical works have been conducted on the size, shape and structure of Sabo 38
47 dams (Mizuyama et al., 1988; Johnson et al., 1989; Deymier et al., 1994). These studies contribute to technical standard guidelines on debris flows. Thus, there are studies on methods of evaluating the control function of a series of Sabo dams(osti et al., 2008). However, further studies are required so as develop general guidelines on a series of Sabo dams. Few studies have reported the control functions of a series of Sabo dams. This paper describes a methodological approach for estimating debris flow discharge at a series of Sabo dams, and proposes equations for evaluating the effectiveness of a series of closed-type Sabo dams. A one-dimensional numerical model of debris flow is presented. Numerical simulations were conducted including debris flow overflow at the dam point and analyzed with boundary conditions. 3.2 Analysis of Debris Flow Basic Equations Debris flows are fluid mixtures that consist of granular materials and water. The equations used are the depth-averaged one-dimensional momentum and continuity equations. The equations for the mass conservation of sediment-water mixture and mass conservation of sediment are as follows. Momentum equation of sediment and water flow mixture: M t + β (um) x = gh sin θ b gh cos θ b h x τ b ρ T (3.1) Continuity equation of flow mixture: h t + M x = i{c + (1 C )s b } (3.2) Continuity equation of sediment particles: (Ch) + (CM) = ic t x (3.3) 39
48 where, M (= uh) is the x components of the flow flux, x is the flow direction coordinate, t is time, β is the momentum correction factor equal to 1.25 for a stony debris flow (Takahashi et al., 1992), u is the components of mean velocity, g is the acceleration of gravity, h is flow depth, θ b is the bed slope, τ b is components of the resistance to flow, ρ T is mixture density (ρ T = σc + (1 C)ρ), σ is density of the sediment particles, ρ is density of the water, i is erosion (> 0)or deposition( 0)velocity, C is the sediment concentration in the flow, C is maximum sediment concentration in the bed, and s b is the degree of saturation in the sediment bed equal to 1 for a fully saturated sediment bed. The equation of bed variation due to erosion or deposition is given as follows: z b t = i (3.4) where, z b is the erosion or deposition thickness of the bed measured from the original bed surface elevation. In a fixed bed, z b equals 0. In fact, the sediment in a fixed bed should be contained in the flow parts when erosion occurs. However there is no sediment in a fixed bed Erosion and Deposition Velocity Equations Erosion and deposition velocity i are source terms. These equations to analyze the process of debris flow development and decline by erosion and deposition on the sediment bed have been given by Takahashi et al.(1992) and Egashira et al.(1993a) Takahashi et al. s equations Erosion velocity, if C < C : i = δ C C C C M d m (3.5) Deposition velocity, if C C : i = δ C C C C M d m (3.6) 40
49 where, δ is the erosion coefficient, δ is the deposition coefficient, d m is the mean diameter of the sediment, and C is the equilibrium sediment concentration described as follows (Nakagawa et al., 2003). If tanθ w >0.138, a stony type debris flow occurs, and C = ρ m tan θ w (σ ρ m )(tan φ tan θ w ) (3.7) If 0.03< tanθ w 0.138, an immature type of debris flow occurs, and 2 ρ m tan θ w C = 6.7 { (σ ρ m )(tan φ tan θ w ) } (3.8) If tanθ w 0.03, a turbulent water flow with bed load transport occurs, and C = (1 + 5 tan θ w) tan θ w 2 σ (1 α τ c 0 ) (1 α 2 ρ 1 τ 0 τ c ) (3.9) τ m α 0 2 = 2{0.425 (σ/ρ T) tan θ w /(σ/ρ T 1)} 1 (σ/ρ T ) tan θ w /(σ/ρ T 1) (3.10) τ c = tan θ w (3.11) where, θ w is the water surface gradient, ρ m is the density of the interstitial muddy fluid, φ is the internal friction angle of the sediment τ c is the non-dimensional critical shear stress and τ is the non-dimensional shear stress. Egashira et al. s equations Egashirea (1993a) proposed an erosion rate formula assuming that the bed slope is always adjusted to its equilibrium value in case of debris flows over erodible bed. The erosion and deposition equations are as follows: i = u C tan(θ e θ b ) (3.12) where, u is the depth-averaged velocity of the debris flow body, θ e is the equilibrium bed slope 41
50 corresponding to the sediment concentration of the debris flow body as follows. ( σ θ e = tan 1 ρ 1)C { ( σ tan φ} (3.13) ρ 1) C + 1 Sediment erosion takes place when the bed slope is steeper than the equilibrium bed slope resulting in a negative value of deposition occurring Bottom Shear Stress Takahashi et al. s constitutive equations and bottom shear stress The constitutive equations of Takahashi et al. (1997) are described as follows: Figure 3.1Coordinates of uniform debris flow τ = τ y + a i sin α i {( C 1/3 2 ) 1} σd 2 C m ( u 2 z ) (3.14) τ y = p s tan φ (3.15) where, a i is the experiment constant, α i is the collision angle of the particle (a i sin α i = 0.02)(Takahashi et al., 1992), z is the coordinate perpendicular to the bed and positive upward 42
51 in the normal direction of flow (figure 3.1), and p s is static pressure which can be expressed as follows. p s = α e (σ ρ)cg(h z) cos θ (3.16) in which α e is the mean grain concentration above height z, and α e is the ratio of the quasistatic skeletal pressure to the total pressure. This is given as α e = { ( C C 3 C C 3 ) 0 ; C C 3 m ; C 3 < C C 1 ; C C (3.17) where, C 3 is the particle concentration in a volume larger than that particles move with enduring contact with each other(c 3 = 0.48). Exponent m is unknown at present. So m = 1 is used. The bottom shear stress for debris flow is derived by substituting the constitutive equations into the momentum conservation equation under steady and uniform flow conditions. The momentum conservation equation is given as follows: τ(z) = ρ T g(h z) sin θ (3.18) where, τ(z) is the shear stress at any distance from the bed along the z-axis. By substituting the constitutive equations of Takahashi et al. (1997) in the momentum equation, the following equation is obtained. 2 u z = du dz = [ ρ T g(h z) sin θ α e (σ ρ)cg(h z) cos θ tan φ a i sin α i {( C 1/3 2 2 C ) 1} σd m ] (3.19) By introducing dimensionless quantities as u = u/ gh and z = z/h, the above equation is modified as follows: u = K z T sin θ h (1 z ) 2 (3.20) d m 43
52 u(z ) u = 2 3 K T h d m {1 (1 z ) 2 } (3.21) u u = 2 5 K T h d m (3.22) u = gh sin θ (3.23) K T = tan φ ρ T α e (σ ρ)c tan θ a i sin α i {( C { C 1/3 ) 1} 2 } 2 (3.24) where, u is the friction velocity. The yield stress is given as follows: τ y = p s tan φ = f(c)(σ ρ)cgh cos θ tan φ (3.25) The coefficient of resistance f b is calculated by assuming the equilibrium state to be ρ T gh sin θ = f(c)(σ ρ)cgh cos θ tan φ + ρf b u u (3.26) The following equation is obtained by solving the above equation f b = gh sin θ (ρ tan φ T f(c)(σ ρ)c tan θ ) ρu 2 (3.27) By using Equations (3.22) and (3.23), Equation (3.27) can be given as f b = 1 2 (σ/ρ) 8 {(C /C) 1/3 1} 2 (d m h ) (3.28) The bottom shear stress for debris flow is derived as follows. For a fully developed stony debris flow (C > 0.4C ) 44
53 τ b = ρ 2 T 8 (d m h ) u u (3.29) {C + (1 C)ρ/σ}{(C C) 1/3 1} 2 For an immature debris flow(0.02 C 0.4C ) τ b = ρ T 0.49 (d m h ) 2 u u (3.30) For a turbulent flow(c < 0.02) τ b = ρgn2 u u h 1/3 (3.31) Egashira et al. s constitutive equations and bottom shear stress The constitutive equations of Egashira et al.(1997) are given as follows: τ = τ y + σk d (1 e 2 )C 1/3 d m 2 ( u z ) 2 (1 C) 5/3 + ρk f C 2/3 d 2 m ( u 2 z ) (3.32) τ y = p s tan φ (3.33) where, e is the restitution of sediment particles, and k d = and k f =0.16 are empirical constants. The static pressure is described as follows: p s = α e (σ ρ)cg(h z) cos θ (3.34) in which α e is described as α e = ( C 1/5 ) C (3.35) By substituting the constitutive equations of Egashira et al. (1997) in the momentum equation, the following equations are obtained. u = K z H sin θ h (1 z ) 2 (3.36) d m 45
54 u(z ) u = 2 3 K E h d m {1 (1 z ) 3/2 } (3.37) u u = 2 5 K E h d m (3.38) ( σ ρ 1) C + 1 (σ tan φ ρ 1) Cf(C) tan θ K E = { (1 C) k 5/3 f C 2/3 d 2 m ( u 2 } z ) + k g (σ/ρ)(1 e 2 )C 1/3 2 (3.39) Yield stress is described as τ y = p s tan φ = f(c)(σ ρ)cgh cos θ tan φ (3.40) The coefficient of resistance f b is calculated as follows: f b = 25 4 {k (1 C) 5/3 f C 2/3 + k g (σ/ρ)(1 e 2 )C 1/3 } ( d 2 m h ) (3.41) The bottom shear stress is derived as Figure 3.2Ratio of the quasi-static skeletal pressure to the total pressure according to Takahashi et al. (1997) and Egashira et al. (1997) 46
55 τ b = τ y + ρ 25 4 f {k (1 C) 5/3 f C 2/3 + k g (σ/ρ)(1 e 2 )C 1/3 } ( d 2 m h ) u u (3.42) Figure 3.2 shows the ratio of the quasi-static skeletal pressure to the total pressure 3.3 Analysis of Arrangement of Sabo Dams Boundary conditions of Sabo dam Figure 3.3 Definition of the variables The closed-type Sabo dam is set at the grid line where discharge is calculated (Figure 3.3). The grid size is 5 cm. The flow surface gradient, θ w,i, and bed gradient, θ b,i, are calculated at the center of the cell. Flow surface gradient θ w,i and bed gradient θ b,i are calculated by the average of each value of θ w,i+1, θ b,i+1 and θ w,i 1, θ b,i 1. However, if there is a Sabo dam, the calculation method is changed as follows: Gradient at the dam point (z i 1/2 < z dam ): θ b = tan 1 z i 3/2 z i 1/2 Δx (3.43) 47
56 θ w = tan 1 z i 3/2 z i 1/2 + h i 3/2 h i 1/2 Δx (3.44) Gradient at the dam point (z i 1/2 z dam ); θ b = tan 1 z i 3/2 z i+1/2 2Δx (3.45) θ w = tan 1 z i 3/2 z i+1/2 + h i 3/2 h i+1/2 2Δx (3.46) Overflow Equations for Debris Flow Discharge Figure 3.4 Overflow situation Figure 3.5 Free overfall situation 48
57 Sabo dams involve obstructing the path of flow. This is a vertical obstruction over which the debris must flow such as a weir. At that time, outflow discharge at the dam point can be calculated using certain equations. To calculate debris flow discharge at the dam point, the overflow equation and free overfall equation are applied. Figure 3.4 and 3.5 shows the overflow equation and free overfall equation by debris flow deposition upstream of Sabo dam. Overflow equation (complete overflow): ( h i+1/2 h i 1/2 2 3 ) M i = c 1 h i 1/2 2gh i 1/2 (3.47) Overflow equation (incomplete overflow): ( h i+1/2 h i 1/2 > 2 3 ) M i = c 2 h i+1/2 2g(h i 1/2 h i+1/2 ) (3.48) Free overfall equation: (Z i 1/2 > Z dam ) M i = c 3 h i 1/2 gh i 1/2 (3.49) Table 3.2 Flow conditions at Sabo dam Condition Calculated M i Flow 1 z i 1/2 + h i 1/2 z dam 0 Flow 2 Flow 3 z i 1/2 + h i 1/2 > z dam z i 1/2 < z dam z i+1/2 + h i+1/2 z dam z i 1/2 + h i 1/2 > z dam z i 1/2 < z dam z i+1/2 + h i+1/2 > z dam Overflow equation (Complete flow) (Equation. 3.47) Overflow equation (Complete flow, Incomplete flow) (Equation. 3.47,3.48) Flow 4 z i 1/2 + h i 1/2 > z dam z i 1/2 z dam z i+1/2 + h i+1/2 z dam Free overfall equation (Equation. 3.48) Flow 5 z i 1/2 + h i 1/2 > z dam z i 1/2 z dam z i+1/2 + h i+1/2 > z dam Momentum equation (Equation. 3.1) 49
58 where, M i is the debris flow discharge per unit width at the dam point, c is the overflow coefficient, and h i is the overflow depth. As the overflow equation and free overfall equation are adjusted at the dam point, flow conditions are changed by the bed elevation (Table 3.2). In flow Condition 1, the deposition height plus flow depth is less than the height of the Sabo dam. In this condition, debris flow does not overflow the Sabo dam. Therefore, the flow discharge is equal to zero. In flow Condition 2, the deposition height plus flow depth is higher than the height of the Sabo dam. And the deposition height does not reach the dam crown. In this condition, the overflow(complete overflow) equation is applied. Flow Condition 3 is the same as Flow condition 2, but there is deposition in front of the Sabo dam. So the flow height in front of the Sabo dam is sometimes higher than that behind the Sabo dam. Therefore, the incomplete flow equation is applied. In flow condition 4, the debris flow deposition height is higher than the dam height. In this case, the free overfall equation is applied. Flow Condition 5 is the same to flow condition 4, but debris flow is also deposited in front of the Sabo dam due to the lower Sabo dam. At that time, the deposition height in front of the Sabo dam is higher than the Sabo dam, and the momentum equation is applied because this case is same as the no Sabo dam case. 3.4 Solution Methods Calculation Method of Conservation of Momentum The leap-frog scheme is one of the most ordinary methods of finite differential. This scheme is used for the governing equations in the coordinate system of Figure 3.6. When the values of scalar Figure 3.6 Definition of arrangement of variables on meshes 50
59 Figure 3.7 Method of advancing the calculation quantities such as h, c and z b are given or obtained from the beginning to step n+1(t = (n + 1)Δt), and the values of vector quantities M are given or obtained to step n, the value of vector M i n+2 in Figure 3.7 can be obtained from following finite differential equation: M n+2 n i M i + β(xdx) = g 2Δt g n+1 + h i 1 h i n+1 2 cos θ m n+1 n+1 + h i 1 h i n+1 h i 1 h i+ 1 2 Δx n+1 n sin θ m n+1 1 ρ (τ y + ρf M i n+2 n + M i M i n (3.50) T 2h h ) in which XDX is a convection term. This term is calculated with following condition on u i+1/2 and u. i 1/2 XDX = { u n i M n i u n i 1 Δx u n i+1 n M i 1 u n i M n i 0 Δx M n i+1 u n n i M i Δx 0 u n n i 1 M i 1 Δx u n n i 0, u i 1 u n n i 0, u i 1 < 0 u n n i < 0, u i 1 u n n i < 0, u i < 0 (3.51) 51
60 u i n = h i M i n n+1 n+1 + h (3.52) 1 i 2 The calculation of the above gives M i n+2 in the following equation. M i n+2 = gh sin θ n+1 n+1 m gh cos θ h i+1/2 n+1 m β(xdx) τ y ρ + ( 1 T 2Δt ρ ρ f 1 T ( 1 2Δt + ρ ρ f 1 n T 2h M i h ) n+1 h i 1/2 Δx n 2h M i h ) M i n (3.53) in which, h = h i+1/2 n+1 n+1 + h i 1/2 2 (3.54) ρ T = (σ ρ)c + ρ (3.55) C = C i+1/2 n+1 n+1 + C i 1/2 2 (3.56) sin θ n+1 m = sin θ i+1/2 n+1 n+1 + sin θ i 1/2 2 (3.57) cos θ n+1 m = cos θ i+1/2 n+1 n+1 + cos θ i 1/2 2 (3.58) θ n+1 i+1/2 = tan 1 ( z i+1/2 n+1 n+1 z i 1/2 Δx ) (3.59) τ y = f(c )(σ ρ)c cos θ m n+1 tan φ (3.60) 52
61 3.4.2 Calculation Method of Conservation of Mass and Bed When the values of vector properties M are given or obtained from the beginning to step n+2(t = (n + 2)Δt), and the values of scalar quantities such as h, c and z b are given or obtained to step n+1, the value of scalar z n+3 b, h n+3 n+3 i+1/2 i+1/2, and C i+1/2 in Figure3.7 can be obtained from following finite differential equations. h n+3 i+1/2 n+1 h i+1/2 2Δt + M i+1 n+2 n+2 M i n+1 = i Δx i+1/2 (3.61) (Ch) n+3 i+1/2 n+1 (Ch) i+1/2 2Δt + CXDX = i n+1 i+1/2 C (3.62) CXDX = { C n+1 i+1/2 M n+2 i+1 C n+1 n+2 i 1/2 M i Δx C n+1 i+1/2 M i+1 n+2 C i+1/2 Δx n+1 M i n+2 C n+1 i+3/2 M n+2 i+1 C i 1/2 Δx C n+1 i+3/2 M n+2 i+1 C i 1/2 Δx n+1 M i n+2 n+1 M i n+2 M n+2 i 0, M n+2 i+1 0 M n+2 i 0, M n+2 i+1 < 0 M n+2 i < 0, M n+2 i+1 < 0 M n+2 i < 0, M n+2 i+1 0 (3.63) z n+3 i+1/2 n+1 z i+1/2 2Δt n+1 = i i+1/2 (3.64) 3.5 Results and Discussions Compared with the Experimental Results According to overflow equations and free overfall equations, debris flow discharge, sediment concentration, and debris flow deposition upstream of Sabo dam are calculated by arrangement of Sabo dams. Here, all of discharge coefficients, c 1, c 2, and c 3, are used as 1.0. And, the other parameters of the numerical simulation are shown in Table
62 Table 3.3 Parameters for numerical simulation Parameter Unit Value Grid size (Δx) cm 5 Time interval (Δt) sec Calculation time (Q time) sec 60 Density of a sediment particle (σ) g/cm Density of a water (ρ) g/cm 3 1 Interstitial muddy fluid g/cm Tangent of the internal friction angle of sediment (tanϕ) Volumetric concentration of the solids in the bed (C *) Limitative sediment concentration (C 3) Erosion coefficient (δ e) Deposition coefficient (δ d) Debris Flow Deposition Figure 3.8 and figure 3.9 show the simulated results and experimental results of final debris flow deposition upstream of a series of Sabo dams in case A, and Case B. And, Figure 3.10 and figure 3.11 show the simulated results and experimental results of debris flow deposition process upstream of a series of Sabo dams in Case C. In this graph, Time 0 means the debris flow s arrival time to the upper Sabo dam. The dotted line is the experimental results and the solid line is the simulation results. From the figure, the simulation results are in fair agreement with the experimental results. This is because a decrease in distance of between dams is able to increase the equilibrium bed slope by the upper Sabo dam. However, some discrepancies are found in the shape of the deposition between the simulated results and the experimental results. The height of deposition in the experimental results is higher than simulation results which use Takahashi et al. s(1992) equations. The simulation results are underestimated. In contrast, simulation results which use Egashira et al. s(1993a) equations are overestimated. This simulation results of debris flow deposition length is longer than experimental results. Therefore, when the Takahashi et al. s(1992) equations are used, more feasible coefficient of erosion velocity and coefficient of deposition velocity are required. And when Egashira et al. s(1993a) equations are used, experimental method should be changed because this equation is more applicable to the movable bed. 54
63 (a) Case A-1, Case B-1 (b) Case A-2, Case B-2 (c) Case A-3, Case B-3 Figure 3.8 Final debris flow deposition upstream of the Sabo dam (equations of Takahashi et al.) 55
64 (a) Case A-1, Case B-1 (b) Case A-2, Case B-2 (c) Case A-3, Case B-3 Figure 3.9 Final debris flow deposition upstream of the Sabo dam (equations of Egashirea et al.) 56
65 (a) Case C-1 (b) Case C-2 (c) Case C-3 Figure 3.10 Debris flow deposition process upstream of the Sabo dam (equations of Takahashi et al.) 57
66 (a) Case C-1 (b) Case C-2 (c) Case C-3 Figure 3.11 Debris flow deposition process upstream of the Sabo dam (equations of Egashira et al.) 58
67 3.5.2 Debris Flow Discharge and Sediment Concentration Figure 3.12 shows the experimental result and simulation result of clear water discharge at the outlet flume without Sabo dam. There is no sediment bed in this case. The simulation result matches with the experimental result. Figure 3.13 shows the debris flow discharge, sediment discharge and sediment concentration at the outlet of flume compared with the experimental results. In this graph, Time 0 means the debris flow s arrival time to outlet flume. The simulated results using Takahashi et al. s(1992) equations, debris flow peak discharge was cm 3 /s, peak sediment discharge was cm 3 /s. Sediment concentration indicated 35~40%. The simulated results using Egashira et al. s(1993a) equations, debris flow peak discharge was cm 3 /s, peak sediment discharge was cm 3 /s. Sediment concentration indicated 35~40%. Figure 3.14 and Figure 3.15 show the simulated results and experimental results of debris flow discharge and sediment concentration using Takahashi et al. s(1992) equations. Figure 3.16 and Figure 3.17 show the simulated results and experimental results of debris flow discharge and sediment concentration using Egashira et al. s(1993a) equations. In these graph, Time 0 means the start time of supplying clear water in the flume. The start time of the red color means the overflow time at upper Sabo dam. The start time of the green color means the overflow time at lower Sabo dam. The start time of the blue color has no meaning, because the value of blue color is calculated at outlet of Sabo dam. It is just moved to time 12sec to compare no Sabo dam case and with Sabo dam case easily. Table 3.4 shows the debris flow peak discharge. In the experimental results, debris flow discharge is calculated at the downstream end of the flume under the no Sabo Dam case. The simulated results of debris flow discharge are consistent with the experimental results. Through Figure 3.12 Clear water discharge at the outlet flume without Sabo Dam 59
68 the series of Sabo dams, the total discharge of debris flow and peak discharge is decreased. The total average peak discharge rate is 48.4% in the experimental results, 45.3% in the simulation results using Takahashi et al.(1992) s equation, 49.4% in the simulation results using Egashira et al. (1993a)s equation. However, the greater the distance between two Sabo dams, the higher the rate of total discharge decrease. In the experimental results, total debris flow decrease rate is 43.8% in Case C-1, 48.8% in Case C-2, and 52.6% in Case C-3. In the simulation results using Takahashi et al.(1992) s equation, total debris flow decrease rate is 44.1% in Case C-1, 45.8% in Case C-2, and 46.1% in Case C-3. In the simulation results using Egashira et al.(1993a) s equation, total debris flow decrease rate is 44.2% in Case C-1, 50.8% in Case C-2, and 53.3% in Case C-3. (a) Debris flow and sediment discharge (b) Sediment concentration Figure 3.13 Debris flow discharge and sediment concentration at the outlet flume without Sabo Dam 60
69 The greater the distance between two Sabo dams, the easier it is to form a fully developed debris flow. The average decrease rate of the upper Sabo dam is 29.8% in the experimental results, 37.9% in the simulation results using Takahashi et al.(1992) s equation and 33.3% in the simulation results using Egashira et al.(1993a) s equation. However, the average decrease rate of the lower Sabo dam is 26.4% in the experimental results, 11.8% in the simulation results using Takahashi et al.(1992) s equation and 21.2% in the simulation results using Egashira et al.(1993a) s equation. The efficiency of the decrease rate of debris flow peak discharge at the lower Sabo dam is less than that of the upper Sabo dam. The simulated results of reduction of debris flow discharge using Takahashi et al.(1992) s equation were in good agreement with the experimental results. The simulated results of reduction of debris flow discharge using Egashira et al.(1992) s were overestimated compared with the simulated results of reduction of debris flow discharge using Takahashi et al.(1992) s equation. Nevertheless, the simulated results of reduction of debris flow discharge using Egashira et al.(1992) s were suited with experimental results. Therefore, the simulation results of debris flow discharge and sediment concentration using both equations were agreeable with the experimental results. 61
70 Case. C-1 Case. C-2 Case.C-3 Figure 3.14 Debris flow discharge of the Sabo dams (equation of Takahashi et al.) 62
71 Case. C-1 Case. C-2 Case.C-3 Figure 3.15 Sediment concentration(equation of Takahashi et al.) 63
72 Case. C-1 Case. C-2 Case.C-3 Figure 3.16 Debris flow discharge of the Sabo dams(equation of Egashira et al.) 64
73 Case. C-1 Case. C-2 Case.C-3 Figure 3.17 Sediment concentration(equation of Egashira et al.) 65
74 Table 3.4 Debris flow peak discharge Total Peak Decrease decrease Discharge(cm 3 /s) Rate (%) Rate(%) No Dam Upper Case C Lower Experiment Upper Case C Lower Upper Case C Lower No Dam Upper Simulation Case C Lower (equation of Upper Takahashi et Case C Lower al.) Upper Case C Lower No Dam Upper Simulation Case C Lower (equation of Upper Egashira et Case C Lower al.) Upper Case C Lower Summary This chapter describes the developed numerical model to simulate the debris flow discharge at the dam point and presents the debris flow deposition process according to arrangement of Sabo dams. First, in the debris flow deposition results, the simulated results using Takahashi et al. s(1992) equations were underestimated compared with the experimental results. In contrast, 66
75 the simulated results using Egashira et al. s(1993a) equations were overestimated compared with the experimental results. However, the simulated results using both equations were agreeable with the experimental results. Second, Debris flow discharge is calculated by the overflow equations and the free overfall equations. The standard to divide the overflow situation and free overfall situation is debris flow deposition height upstream of Sabo dam. When the debris flow deposition is higher than Sabo dam elevation, a free overfall equations are applied, and when debris flow deposition is lower than Sabo dam elevation, an overflow equations are applied. Only in Case C- 1, a complete overflow situation, an incomplete overflow situation and free overfall situation appeared. In case Case C-2 and C-3 does a complete flow situation, and free overfall situation appeared. The simulated results of reduction of debris flow discharge were in good agreement with the experimental results. Also the simulated results of debris flow concentration at the dam point were in agreement with the experimental results. 67
76 CHAPTER 4 ESTIMATION OF THE DISCHARGE COEFFICIENT FOR DEBRIS FLOW 4.1 General Weirs are barriers vertically located to the main direction of water movement. They are widely used for measuring the flow of liquids in flumes and open channels. The most common types of weir are the broad-crested weir, the sharp-crested weir and the circular-crested weir. They are frequently used to measure the flow of water in laboratories and in small natural streams. A properly designed and operated weir of a given geometry has a unique discharge. So a large number of empirical discharge formulas have been proposed for weirs according to the relationship between flow depth and discharge. Many kinds of weirs and discharge formulas have been extensively studied using classical physics and experimental analyses to understand the characteristics of flow and to determine the coefficient of discharge. This coefficient represents effects not considered in the derivation of the equations used to estimate discharge from the flow depth. Such effects include viscosity, capillarity, surface tension, velocity distribution and streamline curvature attributable to weir contraction (Aydin et al., 2011). The coefficients of discharge of full-width rectangular weirs and contracted rectangular notches are reported to be a function of the head-weir height ratio and width-contraction ratio(kindsvater and Carter 1957). Harrison (1967) presented a new coefficient of discharge for a streamlined broad-crested weir based on critical flow theory. Farhoudi and Shahalami (2005) proposed the flow pattern governing the hydraulic principles of rectangular broadand short-crested weirs. 68
77 Gonzalez & Chanson (2007) conducted experiments in near-full-scale broad-crested weir. Based on their investigations, theoretical equations have been presented for ideal flow from which approximate ratings can be obtained to within reasonable accuracy with an empirical discharge coefficient. The ratings for a wide variety of shapes and sizes of these weirs were computed with the model and fit to an empirical equation. However, these equations are for clear water; there are few works on debris flow. In this study, experiments were conducted in an open channel, i.e., a rectangular flume. Measuring the flow rate of debris flow involves some type of obstruction in the path of the flow. In the experiment, a Sabo dam of 6 cm in height, 10 cm width, and 1 cm in thickness was used like a weir. A weir is a vertical obstruction that the debris flow must flow over. The measured flow depth, volume, and weight of debris flow were used to calculate the debris flow overflow discharge coefficient in an overflow equation. In the numerical model, a complete flow equation, and free overfall equation were used. To determine the discharge coefficient for each equation, regression analysis was conducted. 4.2 Experiment for Debris Flow Discharge Coefficient The experimental method is almost the same as the above experimental method (Figure 4.1). For a rectangular flume, the experimental condition is the same. However the sediment distribution and material of at the bottom of the flume is changed. This is because debris flow deposition upstream of Sabo dams is very rapid and it is difficult to find the deposition height by a video camera due to gravel sand (Figure 4.2). For this reason, in this condition, the overflow situation is very short (figure 4.3). Therefore, to clear the debris flow deposition upstream of Sabo dams and to slow the debris flow velocity, some conditions are changed. Table 4.1 shows the experimental conditions. The sediment used is silica sand(s1, S2, S3, S4, S5, and S6). The mixed sediment materials have a mean diameter of d m = 2.45 mm, and a maximum diameter d max = 4.26 mm. Table 4.1 shows the sediment material and Figure 4.4 shows the particle size distribution of sediment Table 4.1 Experimental conditions Supply water Time Mean diameter Experiment no. discharge (sec) (mm) (cm 3 /s) Case.D

78 materials. The material of the flume bottom is changed to make slow the debris flow velocity (Figure 4.5). Therefore, a test experiment was conducted to change the roughness coefficient using Manning s equation. Through the text experiment, roughness coefficient n is equal to 0.02 s/m 1/3. Q = 1 n R2/3 I 1/2 wh (4.1) where Q is the discharge, R is the hydraulic radius, I is the slope of the hydraulic grade line, w is the width of flume, and H is the flow depth. Figure 4.1 Experimental setup Figure. 4.2 Debris flow hit the deposited sediment 70


79 Fig.4.6 Definition of the variables Figure 4.3 Time changeable to debris flow deposition Figure 4.4 Particle size distribution of sediment materials Figure 4.5 Bottom of the flume 71
A STUDY ON DEBRIS FLOW OUTFLOW DISCHARGE AT A SERIES OF SABO DAMS
 A STUDY ON DEBRIS FLOW OUTFLOW DISCHARGE AT A SERIES OF SABO DAMS Namgyun KIM *, Hajime NAKAGAWA **, Kenji KAWAIKE *** and Hao ZHANG **** Abstract Debris flows are very dangerous phenomena in mountainous
A STUDY ON DEBRIS FLOW DEPOSITION BY THE ARRANGEMENT OF SABO DAM
 Annual Journal of Hydraulic Engineering, JSCE, Vol.57, 2013, February A STUDY ON DEBRIS FLOW DEPOSITION BY THE ARRANGEMENT OF SABO DAM Namgyun Kim 1, Hajime NAKAGAWA 2, Kenji KAWAIKE 3, and Hao ZHANG 4
Prediction of landslide-induced debris flow hydrograph: the Atsumari debris flow disaster in Japan
 Monitoring, Simulation, Prevention and Remediation of Dense and Debris Flows 27 Prediction of landslide-induced debris flow hydrograph: the Atsumari debris flow disaster in Japan H. Takaoka 1, H. Hashimoto
Development of Kanako, a wide use 1-D and 2-D debris flow simulator equipped with GUI
 Monitoring, Simulation, Prevention and Remediation of Dense Debris Flows II 49 Development of Kanako, a wide use 1-D and 2-D debris flow simulator equipped with GUI K. Nakatani, T. Wada, Y. Satofuka &
Experimental Study of the Sediment Trap Effect of Steel Grid-Type Sabo Dams
 Experimental Study of the Sediment Trap Effect of Steel Grid-Type Sabo Dams Teruyoshi TAKAHARA 1 and Kazuki MATSUMURA 1 1 Graduate school of Agriculture, Kyoto Pref. University (1-5 Shimogamonakaragicyo,
PREDICTION OF RUN-OUT PROCESS FOR A DEBRIS FLOW TRIGGERED BY A DEEP RAPID LANDSLIDE
 DOI: 10.4408/IJEGE.2011-03.B-053 PREDICTION OF RUN-OUT PROCESS FOR A DEBRIS FLOW TRIGGERED BY A DEEP RAPID LANDSLIDE Y. NISHIGUCHI (*), T. UCHIDA (*), K. TAMURA (*) & Y. SATOFUKA (**) (*) Public Works
EFFECT OF SAND MINING ACTIVITY ON THE SEDIMENT CONTROL SYSTEM (A CASE STUDY OF SOMBE-LEWARA RIVER, DONGGALA, INDONESIA)
") Civil Engineering Forum Volume XXI/1 - January 01 EFFECT OF SAND MINING ACTIVITY ON THE SEDIMENT CONTROL SYSTEM (A CASE STUDY OF SOMBE-LEWARA RIVER, DONGGALA, INDONESIA) Y. A. Bawias Agency of Public Works,
Civil Engineering Forum Volume XXI/1 - January 01 EFFECT OF SAND MINING ACTIVITY ON THE SEDIMENT CONTROL SYSTEM (A CASE STUDY OF SOMBE-LEWARA RIVER, DONGGALA, INDONESIA) Y. A. Bawias Agency of Public Works,
Debris flow: categories, characteristics, hazard assessment, mitigation measures. Hariklia D. SKILODIMOU, George D. BATHRELLOS
 Debris flow: categories, characteristics, hazard assessment, mitigation measures Hariklia D. SKILODIMOU, George D. BATHRELLOS Natural hazards: physical phenomena, active in geological time capable of producing
Experimental Study on Effect of Houses on Debris-Flow Flooding and Deposition in Debris Flow Fan Areas
 DATA ACQUISITION AND MODELLING (MONITORING, PROCESSES, TECHNOLOGIES, MODELS) Experimental Study on Effect of Houses on Debris-Flow Flooding and Deposition in Debris Flow Fan Areas Kana Nakatani, Dr. 1
Mass Wasting. Requirements for Mass Wasting. Slope Stability. Geol 104: mass wasting
 Mass Wasting Movement of earth materials downslope, driven by Gravitational Forces. Landslides - general term for rock or soil movement. In U.S., on average, mass wasting causes 1 to 2 billion dollars
EFFECT OF TWO SUCCESIVE CHECK DAMS ON DEBRIS FLOW DEPOSITION
 DOI: 10.4408/IJEGE.2011-03.B-116 EFFECT OF TWO SUCCESIVE CHECK DAMS ON DEBRIS FLOW DEPOSITION Farouk Maricar (*), Haruyuki Hashimoto (*), Shinya Ikematsu (*) & Tomohiro Miyoshi (*) (*) Department of Civil
Mass Wasting. Revisit: Erosion, Transportation, and Deposition
 Mass Wasting Revisit: Erosion, Transportation, and Deposition While landslides are a normal part of erosion and surface processes, they can be very destructive to life and property! - Mass wasting: downslope
Internationales Symposion INTERPRAEVENT 2004 RIVA / TRIENT
 APPLICATION TO PAST DISASTERS OF A METHOD OF SETTING APPLICATION THE RANGE TO OF PAST DEBRIS DISASTERS FLOW OF DAMAGE A METHOD TO HOUSES OF SETTING THE RANGE OF DEBRIS FLOW DAMAGE TO HOUSES Hideaki Mizuno
Deep-Seated Landslides and Landslide Dams Characteristics Caused by Typhoon Talas at Kii Peninsula, Japan
 Deep-Seated Landslides and Landslide Dams Characteristics Caused by Typhoon Talas at Kii Peninsula, Japan Hefryan Sukma KHARISMALATRI*,1, Hitomi KIKUCHI 1, Yoshiharu ISHIKAWA 1, Takashi GOMI 1, Katsushige
8 Current Issues and Research on Sediment Movement in the River Catchments of Japan
 8 Current Issues and Research on Sediment Movement in the River Catchments of Japan YUTAKA ICHIKAWA INTRODUCTION Prediction of sediment movement is one of the challenging tasks in water-related research.
GENERAL. CHAPTER 1 BACKGROUND AND PURPOSE OF THE GUIDELINES Background of the Guidelines Purpose of the Guidelines...
 GENERAL CHAPTER 1 BACKGROUND AND PURPOSE OF THE GUIDELINES... 1 1.1 Background of the Guidelines... 1 1.2 Purpose of the Guidelines... 3 CHAPTER 2 APPLICATION OF THE GUIDELINES... 3 2.1 Potential Users
LOCATIONS OF SELECTED MITIGATION SITES IN JAPAN
 LOCATIOS OF SELECTED MITIGATIO SITES I JAPA Hyogo prefecture near Kobe, Japan Hyogo province Gifu province Osaka Kobe Gifu prefecture near Takayama, Japan akao Kamikochi ational Park Mount Yake Tateyama
Mass Wasting: The Work of Gravity
 Chapter 15 Lecture Earth: An Introduction to Physical Geology Twelfth Edition Mass Wasting: The Work of Gravity Tarbuck and Lutgens Chapter 15 Mass Wasting The Importance of Mass Wasting Slopes are the
Sediment trapping efficiency of modular steel check dam in laboratory experiment and field observation
 Sediment trapping efficiency of modular steel check dam in laboratory experiment and field observation Su-Chin CHEN 1, Hiroshi KOKURYO 2, Shuan-Pei AN 1, Sheng-Jui LU 1, and Hui-Kai HUANG 1* 1 Department
Chapter 11 10/30/2013. Mass Wasting. Introduction. Factors That Influence Mass Wasting. Introduction. Factors That Influence Mass Wasting
 Introduction Chapter 11 Mass wasting - The downslope movement of material resulting from the force of gravity. Mass Wasting Mass wasting results when the force of gravity acting on a slope exceeds the
The Impacts of Debris Torrents in Caribbean Coast of Honduras, Central America
 Journal of Coastal Research SI 75 1347-1351 Coconut Creek, Florida 2016 The Impacts of Debris Torrents in Coast of Honduras, Central America Sungduk Kim,Hojin Lee, and Kye-Won Jun * The School of Civil
APPLICATION TO PAST DISASTERS OF A METHOD OF SETTING THE RANGE OF DEBRIS FLOW DAMAGE TO HOUSES
 APPLICATION TO PAST DISASTERS OF A METHOD OF SETTING THE RANGE OF DEBRIS FLOW DAMAGE TO HOUSES Hideaki MIZUNO Senior Researcher Erosion and Sediment Control National Institute for Land and Infrastructure
Avalanches. Avalanche s
 Avalanches Avalanche s Avalanches were first imagined as giant snowballs which increased in size from accretion of underlying snow What are avalanches? They are flows which move under the influence of
Erosion Surface Water. moving, transporting, and depositing sediment.
 + Erosion Surface Water moving, transporting, and depositing sediment. + Surface Water 2 Water from rainfall can hit Earth s surface and do a number of things: Slowly soak into the ground: Infiltration
Analysis of soil failure modes using flume tests
 Analysis of soil failure modes using flume tests A. Spickermann & J.-P. Malet Institute of Earth Physics, CNRS UMR 751, University of Strasbourg, Strasbourg, France Th.W.J. van Asch, M.C.G. van Maarseveen,
GG101 Lecture 22: Mass Wasting. Soil, debris, sediment, and broken rock is called regolith.
 GG101 Lecture 22: Mass Wasting Mass Wasting is the movement of rock and soil down a slope due to the force of gravity. Soil, debris, sediment, and broken rock is called regolith. Mass wasting creates broad
Rivers T. Perron
 1 Rivers T. Perron 12.001 After our discussions of large-scale topography, how we represent topography in maps, and how topography interacts with geologic structures, you should be frothing at the mouth
Zainab Mohamed Yusof*, Syura Fazreen Hamzah 1 & Shahabuddin Amerudin 2
 Malaysian Journal of Civil Engineering 29 Special Issue (1):100-117 (2017) EROSION CHARACTERISTICS OF A MEDIUM SAND BREACHED EMBANKMENT Zainab Mohamed Yusof*, Syura Fazreen Hamzah 1 & Shahabuddin Amerudin
Nevado Del Ruiz, Lahars
 Nevado Del Ruiz, 1985 - Lahars Lecture Objectives -Basics of lahars: definition, characteristics -Ruiz case study: hazards, impacts Mt. Pinatubo lahar footage by Mike Dolan (MTU) Mt. Pinatubo lahar footage
River Embankment Failure due to Overtopping - In Case of Non-cohesive Sediment -
 Nov 4, 2014 2014 International Workshop on Typhoon and Flood River Embankment Failure due to Overtopping - In Case of Non-cohesive Sediment - Prof. Hajime NAKAGAWA Prof. of Disaster Prevention Research
PRESSURE AND SCOURING AROUND A SPUR DIKE DURING THE SURGE PASS
 Annual Journal of Hydraulic Engineering, JSCE, Vol.3, 3, February PRESSURE AND SCOURING AROUND A SPUR DIKE DURING THE SURGE PASS Tomasz MIODUSZEWSKI and Shiro MAENO Student Member of JSCE, Doctoral Student,
Why Geomorphology for Fish Passage
 Channel Morphology - Stream Crossing Interactions An Overview Michael Love Michael Love & Associates mlove@h2odesigns.com (707) 476-8938 Why Geomorphology for Fish Passage 1. Understand the Scale of the
A Numerical Method for Determine the Dredging Requirements for Channel Restoration Using Alishan Creek in Central Taiwan as an Example
 A Numerical Method for Determine the Dredging Requirements for Channel Restoration Using Alishan Creek in Central Taiwan as an Example Instructors : Dr. Jie-Dar Cheng Dr. Honglay Chen Dr. Chao-Yuan Lin
Measurement of bed load with the use of hydrophones in mountain torrents
 222 Erosion ami Sediment Transport Measurement in Rivers: Technological and Methodological Advances (Proceedings ol'lhe Oslo Workshop. June 2002). IAHS Publ. 283. 2003. Measurement of bed load with the
Analysis of soil failure modes using flume tests
 Analysis of soil failure modes using flume tests A. Spickermann & J.-P. Malet CNRS UMR 7516, School and Observatory of Earth Sciences, University of Strasbourg, Strasbourg, France Th.W.J. van Asch, M.C.G.
Debris flow hazard mapping with a random walk model in Korea
 Risk Analysis VII PI-627 Debris flow hazard mapping with a random walk model in Korea H.-J. Youn, C.-W. Lee & C.-S. Woo Korea Forest Research Institute, Korea Abstract Recently, the sediment-related disasters,
GUIDELINES FOR CONSTRUCTION TECHNOLOGY TRANSFER DEVELOPMENT OF WARNING AND EVACUATION SYSTEM AGAINST SEDIMENT DISASTERS IN DEVELOPING COUNTRIES
 GUIDELINES FOR CONSTRUCTION TECHNOLOGY TRANSFER DEVELOPMENT OF WARNING AND EVACUATION SYSTEM AGAINST SEDIMENT DISASTERS IN DEVELOPING COUNTRIES MARCH 2004 Ministry of Land, Infrastructure and Transport
( Your responses must be complete, using terminology and concepts.
 Running head: ARTICLE SUMMARY 1 Question Topic: Summary of information about website http://www.tulane.edu/~sanelson/geol204/masswastproc.htm Pages: 3 Sources: 4 Format: APA Deadline: 24 hours Instructions:
AN APPROACH TO THE CLASSIFICATION OF SLOPE MOVEMENTS
 Training/workshop on Earthquake Vulnerability and Multi-Hazard Risk Assessment: Geospatial Tools for Rehabilitation and Reconstruction Effort 13 31 March 2006, Islamabad, Pakistan AN APPROACH TO THE CLASSIFICATION
SLOPE FAILURE SLOPES. Landslides, Mudflows, Earthflows, and other Mass Wasting Processes
 GEOL g406 Environmental Geology SLOPE FAILURE Landslides, Mudflows, Earthflows, and other Mass Wasting Processes Read Chapter 5 in your textbook (Keller, 2000) Gros Ventre landslide, Wyoming S. Hughes,
U.S. Army Corps of Engineers Detroit District. Sediment Trap Assessment Saginaw River, Michigan
 U.S. Army Corps of Engineers Detroit District December 2001 December 2001 This report has been prepared for USACE, Detroit District by: W.F. BAIRD & ASSOCIATES LTD. 2981 YARMOUTH GREENWAY MADISON, WISCONSIN
AN EXPERIMENTAL STUDY ON SAND DUNE SEDIMENT TRANSPORT DUE TO TSUNAMI OVERWASH. K M Ahtesham Hossain Raju 1 and Shinji Sato 2
 AN EXPERIMENTAL STUDY ON SAND DUNE SEDIMENT TRANSPORT DUE TO TSUNAMI OVERWASH K M Ahtesham Hossain Raju 1 and Shinji Sato 2 Response of sand dune when overwashed by tsunami or storm surge, is investigated
Experimental Study for Investigating the Impact Force on a Wooden House by Driftwood in Steady and Unsteady Surge-type Flow
 Experimental Study for Investigating the Impact Force on a Wooden House by Driftwood in Steady and Unsteady Surge-type Flow K. Miyahara 1 and N. Tanaka 2 1 Graduate School of Science and Engineering, Saitama
Numerical Study of Relationship Between Landslide Geometry and Run-out Distance of Landslide Mass
 Numerical Study of Relationship Between Landslide Geometry and Run-out Distance of Landslide Mass Muneyoshi Numada Research Associate, Institute of Industrial Science, The University of Tokyo, Japan Kazuo
Hydraulics Prof. Dr. Arup Kumar Sarma Department of Civil Engineering Indian Institute of Technology, Guwahati
 Hydraulics Prof. Dr. Arup Kumar Sarma Department of Civil Engineering Indian Institute of Technology, Guwahati Module No. # 04 Gradually Varied Flow Lecture No. # 07 Rapidly Varied Flow: Hydraulic Jump
Considerations on debris-flow hazard analysis, risk assessment and management.
 European Geosciences Union General Assembly 2008, 14-18 April, Vienna Considerations on debris-flow hazard analysis, risk assessment and management. A. Remaître 1, J.-P. Malet 1, O. Maquaire 2 1. CNRS
Pore Water Pressure Contribution to Debris Flow Mobility
 American Journal of Environmental Sciences 5 (4): 487-493, 2009 ISSN 1553-345X 2009 Science Publications Pore Water Pressure Contribution to Debris Flow Mobility Chiara Deangeli DITAG-Department of Land,
Summary. Streams and Drainage Systems
 Streams and Drainage Systems Summary Streams are part of the hydrologic cycle and the chief means by which water returns from the land to the sea. They help shape the Earth s surface and transport sediment
Study of Pile Interval of Landslide Restraint Piles by Centrifuge Test and FEM Analysis
 Disaster Mitigation of Debris Flows, Slope Failures and Landslides 113 Study of Pile Interval of Landslide Restraint Piles by Centrifuge Test and FEM Analysis Yasuo Ishii, 1) Hisashi Tanaka, 1) Kazunori
Factors affecting confluence scour
 & Wang (eds) River Sedimentation 1999., Balkema, Rotterdam. ISBN 9 9 3. 17 19 Factors affecting confluence scour R. B. Rezaur & A. W. Jayawardena. Department of Civil Engineering, The University of Hong
OIKOS > landslide > mechanism >predisposing causes
 predisposing causes and trigger OIKOS > landslide > mechanism >predisposing causes Landslides are events that occur in space and time. As such, it is usually possible to identify both one or more landslide
Flash flood disaster in Bayangol district, Ulaanbaatar
 Flash flood disaster in Bayangol district, Ulaanbaatar Advanced Training Workshop on Reservoir Sedimentation Management 10-16 October 2007. IRTCES, Beijing China Janchivdorj.L, Institute of Geoecology,MAS
River Response. Sediment Water Wood. Confinement. Bank material. Channel morphology. Valley slope. Riparian vegetation.
 River Response River Response Sediment Water Wood Confinement Valley slope Channel morphology Bank material Flow obstructions Riparian vegetation climate catchment vegetation hydrological regime channel
27. Running Water I (p ; )
") 27. Running Water I (p. 424-436; 440-444) Hydrosphere How much of the Earth s surface is covered by water? Earth's water is collectively called the and is stored in a number of so-called as follows: 1.
27. Running Water I (p. 424-436; 440-444) Hydrosphere How much of the Earth s surface is covered by water? Earth's water is collectively called the and is stored in a number of so-called as follows: 1.
Essential Questions. What is erosion? What is mass wasting?
 Erosion Essential Questions What is erosion? What is mass wasting? What is Erosion? Erosion The transportation of sediment from one area to another Caused mainly by running water but also caused by glaciers,
Sediment Transport Mechanism and Grain Size Distributions in Stony Bed Rivers. S.FUKUOKA 1 and K.OSADA 2
 Sediment Transport Mechanism and Grain Size Distributions in Stony Bed Rivers S.FUKUOKA 1 and K.OSADA 1 Professor, Research and Development Initiative, Chuo-University, 1-13-7 Kasuga Bunkyo-ku, Tokyo,
Overview of fluvial and geotechnical processes for TMDL assessment
 Overview of fluvial and geotechnical processes for TMDL assessment Christian F Lenhart, Assistant Prof, MSU Research Assoc., U of M Biosystems Engineering Fluvial processes in a glaciated landscape Martin
3/8/17. #20 - Landslides: Mitigation and Case Histories. Questions for Thought. Questions for Thought
 #20 - Landslides: Mitigation and Case Histories Web Exercise #3 (Volcanoes) Due Wednesday There is a 2-point penalty for every day the assignment is late. Exam 1 Scores Scores and exam key are posted Vaiont
The effectiveness of check dams in controlling upstream channel stability in northeastern Taiwan
 Erosion, Debris Mows and Environment in Mountain Regions (Proceedings of the Chengdu Symposium, July 1992). IAHS Publ. no. 209, 1992. 423 The effectiveness of check dams in controlling upstream channel
An investigation on the impacts of density currents on the sedimentation in dam reservoirs using TCM model; case study: Maroon dam
 University of Wollongong Research Online Faculty of Engineering and Information Sciences - Papers: Part A Faculty of Engineering and Information Sciences 2013 An investigation on the impacts of density
1. INTRODUCTION. EXAMPLE OF SECHILIENNE ROCKFALL (France)
") FORM OSE POST-GRADUATE COURSE Landslide vulnerability and risk 1 FORM OSE POST-GRADUATE COURSE Landslide vulnerability and risk 2 FORM OSE POST-GRADUATE COURSE Landslide vulnerability and risk 3 Christophe
FORM OSE POST-GRADUATE COURSE Landslide vulnerability and risk 1 FORM OSE POST-GRADUATE COURSE Landslide vulnerability and risk 2 FORM OSE POST-GRADUATE COURSE Landslide vulnerability and risk 3 Christophe
Ch. 8: Mass Movements, Wind and Glaciers
 Ch. 8: Mass Movements, Wind and Glaciers Every day the landscape around us undergoes changes. Changes that are powered by gravity alone are called mass movement or mass wasting. Mass movement includes
Earthquake hazards. Aims 1. To know how hazards are classified 2. To be able to explain how the hazards occur 3. To be able to rank order hazards
 Earthquake hazards Aims 1. To know how hazards are classified 2. To be able to explain how the hazards occur 3. To be able to rank order hazards Types of hazard Primary A direct result of the earthquake
Mass Movements, Wind, and Glaciers
 Mass Movements,, and Glaciers SECTION 8.1 Mass Movement at Earth s Surface In your textbook, read about mass movement. Use each of the terms below just once to complete the passage. avalanche creep landslide
MASS MOVEMENTS, WIND, AND GLACIERS
 Date Period Name MASS MOVEMENTS, WIND, AND GLACIERS SECTION.1 Mass Movements In your textbook, read about mass movements. Use each of the terms below just once to complete the passage. avalanche creep
NUMERICAL ANALYSIS OF THE BED MORPHOLOGY IN THE REACH BETWEEN CABRUTA AND CAICARA IN ORINOCO RIVER.
 NUMERICAL ANALYSIS OF THE BED MORPHOLOGY IN THE REACH BETWEEN CABRUTA AND CAICARA IN ORINOCO RIVER. Raul A CABRITA F MEE13634 Supervisor: Shinji EGASHIRA ABSTRACT The present study aims to evaluate numerically
Chapter 2: Landslides and Debris Flows
 Chapter 2: Landslides and Debris Flows Chapter 2: Landslides and Debris Flows Landslides and debris flows are among the major causes of flash floods in the Himalayan region as the rock, earth, debris,
WASHLOAD AND FINE SEDIMENT LOAD. By Hyoseop S. Woo, 1 Pierre Y. Julien, 2 M. ASCE, and Everett V. Richardson/ F. ASCE
 WASHLOAD AND FINE SEDIMENT LOAD By Hyoseop S. Woo, 1 Pierre Y. Julien, 2 M. ASCE, and Everett V. Richardson/ F. ASCE INTRODUCTION Einstein (3) does not take credit for designing the washload concept, but
UGRC 144 Science and Technology in Our Lives/Geohazards
 UGRC 144 Science and Technology in Our Lives/Geohazards Session 3 Understanding Earthquakes and Earthquake Hazards Lecturer: Dr. Patrick Asamoah Sakyi Department of Earth Science, UG Contact Information:
International Journal of Modern Trends in Engineering and Research e-issn No.: , Date: April, 2016
 International Journal of Modern Trends in Engineering and Research www.ijmter.com e-issn No.:2349-9745, Date: 28-30 April, 2016 Landslide Hazard Management Maps for Settlements in Yelwandi River Basin,
PART 2:! FLUVIAL HYDRAULICS" HYDROEUROPE
 PART 2:! FLUVIAL HYDRAULICS" HYDROEUROPE 2009 1 HYDROEUROPE 2009 2 About shear stress!! Extremely complex concept, can not be measured directly!! Computation is based on very primitive hypotheses that
GEOMORPHIC CHANGES OF A LANDSLIDE DAM BY OVERTOPPING EROSION
 DOI: 10.4408/IJEGE.2011-03.B-087 GEOMORPHIC CHANGES OF A LANDSLIDE DAM BY OVERTOPPING EROSION K. Yoshino (*), T. Uchida (*), T. shimizu (*) & K. Tamura (*) (*) Incorporated Administrative Agency, Public
Effect of plan layout on the sediment control efficiency of slit-check dams for stony type debris flows mitigation
 River Basin Management VIII 259 Effect of plan layout on the sediment control efficiency of slit-check dams for stony type debris flows mitigation M. Silva 1, S. Costa 1 & A. H. Cardoso 2 1 AQUALOGUS,
Special edition paper
 Development of a System for Natural Disaster Risk Factor Evaluation by the EADaS Method Ryuji Oshima* Asako Togari* Masahiko Tomori* Natural disasters of a variety of scales occur along railway lines,
Surface Water Short Study Guide
 Name: Class: Date: Surface Water Short Study Guide Multiple Choice Identify the letter of the choice that best completes the statement or answers the question. 1. The three ways in which a stream carries
EXPERIMENTAL STUDY ON RIVER DYKE BREACH CHARACTERISTICS DUE TO OVERTOPPING
 EXPERIMENTAL STUDY ON RIVER DYKE BREACH CHARACTERISTICS DUE TO OVERTOPPING Pawan Kumar BHATTARAI *, Hajime NAKAGAWA **, Kenji KAWAIKE *** and Hao ZHANG **** Abstract Every year flood discharge induced
Large-Scale Sediment Inflow and Bed-Variation from 12th Typhoon (2011) in the Asahi River Basin
 in the Asahi River Basin") ICHE 214, Hamburg - Lehfeldt & Kopmann (eds) - 214 Bundesanstalt für Wasserbau ISBN 978-3-93923-32-8 Large-Scale Sediment Inflow and Bed-Variation from 12th Typhoon (211) in the Asahi River Basin Y. Tsukamoto
ICHE 214, Hamburg - Lehfeldt & Kopmann (eds) - 214 Bundesanstalt für Wasserbau ISBN 978-3-93923-32-8 Large-Scale Sediment Inflow and Bed-Variation from 12th Typhoon (211) in the Asahi River Basin Y. Tsukamoto
mountain rivers fixed channel boundaries (bedrock banks and bed) high transport capacity low storage input output
 high transport capacity low storage input output") mountain rivers fixed channel boundaries (bedrock banks and bed) high transport capacity low storage input output strong interaction between streams & hillslopes Sediment Budgets for Mountain Rivers Little
mountain rivers fixed channel boundaries (bedrock banks and bed) high transport capacity low storage input output strong interaction between streams & hillslopes Sediment Budgets for Mountain Rivers Little
Debris flow modelling accounting for large boulder transport
 Monitoring, Simulation, Prevention and Remediation of Dense and Debris lows III 9 Debris flow modelling accounting for large boulder transport C. Martinez 1,. Miralles-Wilhelm 1 & R. Garcia-Martinez 1
A discussion on the velocity of debris flow
 Erosion, Debris Flows and Environment in Mountain Regions (Proceedings of the Chengdu Symposium, July 1992). IAHS Publ. no. 209, 1992. 369 A discussion on the velocity of debris flow ZHU PENGCHENG Institute
EROSION AND DEPOSITION
 CHAPTER 8 EROSION AND DEPOSITION SECTION 8 1 Changing Earth s Surface (pages 252-255) This section explains how sediment is carried away and deposited elsewhere to wear down and build up Earth s surface.
A Roundup of Recent Debris Flow Events in Taiwan
 2015 International Workshop on Typhoon and Flood APEC Experience Sharing on Hazardous Weather Events and Risk Management A Roundup of Recent Debris Flow Events in Taiwan Hsiao-Yuan(Samuel) Yin Ph.D. sammya@mail.swcb.gov.tw
3/3/2013. The hydro cycle water returns from the sea. All "toilet to tap." Introduction to Environmental Geology, 5e
 Introduction to Environmental Geology, 5e Running Water: summary in haiku form Edward A. Keller Chapter 9 Rivers and Flooding Lecture Presentation prepared by X. Mara Chen, Salisbury University The hydro
Chapter 7 Mudflow Analysis
 Chapter 7 Mudflow Analysis 7.0 Introduction This chapter provides information on the potential and magnitude of mud floods and mudflows that may develop in Aspen due to rainfall events, snowmelt, or rain
ES 105 Surface Processes I. Hydrologic cycle A. Distribution % in oceans 2. >3% surface water a. +99% surface water in glaciers b.
 ES 105 Surface Processes I. Hydrologic cycle A. Distribution 1. +97% in oceans 2. >3% surface water a. +99% surface water in glaciers b. >1/3% liquid, fresh water in streams and lakes~1/10,000 of water
EXAMPLES (SEDIMENT TRANSPORT) AUTUMN 2018
 AUTUMN 2018") EXAMPLES (SEDIMENT TRANSPORT) AUTUMN 2018 Q1. Using Cheng s formula estimate the settling velocity of a sand particle of diameter 1 mm in: (a) air; (b) water. Q2. Find the critical Shields parameter diameter
EXAMPLES (SEDIMENT TRANSPORT) AUTUMN 2018 Q1. Using Cheng s formula estimate the settling velocity of a sand particle of diameter 1 mm in: (a) air; (b) water. Q2. Find the critical Shields parameter diameter
The Effects of Hydraulic Structures on Streams Prone to Bank Erosion in an Intense Flood Event: A Case Study from Eastern Hokkaido
 Symposium Proceedings of the INTERPRAENENT 2018 in the Pacific Rim The Effects of Hydraulic Structures on Streams Prone to Bank Erosion in an Intense Flood Event: A Case Study from Eastern Hokkaido Daisuke
Testing various constitutive equations for debris flow modelling
 Hydrology, Water Resources and Ecology in Headwaters (Proceedings of the HeadWater'98 Conference held at Meran/Merano, Italy, April 1998). IAHS Publ. no. 48, 1998. 49 Testing various constitutive equations
UGRC 144 Science and Technology in Our Lives/Geohazards
 UGRC 144 Science and Technology in Our Lives/Geohazards Flood and Flood Hazards Dr. Patrick Asamoah Sakyi Department of Earth Science, UG, Legon College of Education School of Continuing and Distance Education
Flow and Bed Topography in a 180 Curved Channel
 Flow and Bed Topography in a 180 Curved Channel Jae Wook Jung 1, Sei Eui Yoon 2 Abstract The characteristics of flow and bed topography has been analyzed by changing the bed materials in a 180-degree,
11/12/2014. Running Water. Introduction. Water on Earth. The Hydrologic Cycle. Fluid Flow
 Introduction Mercury, Venus, Earth and Mars share a similar history, but Earth is the only terrestrial planet with abundant water! Mercury is too small and hot Venus has a runaway green house effect so
SEDIMENTATION AND ITS COUNTERMEASURE AT THE OFF-TAKE AREA OF NEW DHALESWARI RIVER
 SEDIMENTATION AND ITS COUNTERMEASURE AT THE OFF-TAKE AREA OF NEW DHALESWARI RIVER Tanjir Saif AHMED* MEE15634 Supervisors: Prof. EGASHIRA Shinji** Assoc. Prof. YOROZUYA Atsuhiro*** ABSTRACT Present study
THE HYDRAULIC PERFORMANCE OF ORIENTED SPUR DIKE IMPLEMENTATION IN OPEN CHANNEL
 Tenth International Water Technology Conference, IWTC10 2006, Alexandria, Egypt 281 THE HYDRAULIC PERFORMANCE OF ORIENTED SPUR DIKE IMPLEMENTATION IN OPEN CHANNEL Karima Attia 1 and Gamal El Saied 2 1
What is weathering and how does it change Earth s surface? Answer the question using
 7 th Grade Lesson What is weathering and how does it change Earth s surface? Answer the question using the sentence frame. You have 4 minutes. Weathering is. This changes the Earth s surface because. 1
Ch 10 Deposition Practice Questions
 1. Base your answer to the following question on the data table below. Six identical cylinders, A through F, were filled with equal volumes of sorted spherical particles. The data table shows the particle
Landslides & Debris Flows
 T.#Perron# #12.001# #Landslides#&#Debris#Flows# 1# Landslides & Debris Flows Many geologic processes, including those shaping the land surface, are slowacting, involving feedbacks that operate over many
What Are Disasters? The Rescue Kids Trio!
 The Rescue Kids Trio! What Are Disasters? This manual was made possible through funding by the Council of Local Authorities for International Relations. Disasters and emergency preparedness Emergency preparedness
In Issue of International Sabo News Letter
 In Issue of International Sabo News Letter I had an opportunity to make a keynote speech on March 18 2003 at the session on Sedimentrelated Issues at the 3rd World Water Forum held in (Kyoto) Japan. Chairing
Need of Proper Development in Hilly Urban Areas to Avoid
 Need of Proper Development in Hilly Urban Areas to Avoid Landslide Hazard Dr. Arvind Phukan, P.E. Cosultant/Former Professor of Civil Engineering University of Alaska, Anchorage, USA RI District Governor
Introduction: What is Mass Wasting? (1)
") Mass Wasting Introduction: What is Mass Wasting? (1) Mass wasting is the downslope movement of regolith and masses of rock under the pull of gravity. Mass wasting is a basic part of the rock cycle. Weathering,
Mass Wasting Introduction: What is Mass Wasting? (1) Mass wasting is the downslope movement of regolith and masses of rock under the pull of gravity. Mass wasting is a basic part of the rock cycle. Weathering,