G 3. AN ELECTRONIC JOURNAL OF THE EARTH SCIENCES Published by AGU and the Geochemical Society
|
|
|
- Phyllis Whitehead
- 5 years ago
- Views:
Transcription

1 Geosystems G 3 AN ELECTRONIC JOURNAL OF THE EARTH SCIENCES Published by AGU and the Geochemical Society Article Volume 10, Number 9 1 September 2009 Q09X08, doi: /2008gc ISSN: Structural variations of arc crusts and rifted margins in the southern Izu-Ogasawara arc back arc system Narumi Takahashi and Shuichi Kodaira Institute for Research on Earth Evolution, Japan Agency for Marine-Earth Science and Technology, Showa-machi, Kanazawa-ku, Yokohama , Japan (narumi@jamstec.go.jp) Yoshiyuki Tatsumi Institute for Research on Earth Evolution, Japan Agency for Marine-Earth Science and Technology, 2-15 Natsushima-cho, Yokosuka , Japan Mikiya Yamashita, Takeshi Sato, Yuka Kaiho, Seiichi Miura, and Tetsuo No Institute for Research on Earth Evolution, Japan Agency for Marine-Earth Science and Technology, Showa-machi, Kanazawa-ku, Yokohama , Japan Kaoru Takizawa Institute for Research on Earth Evolution, Japan Agency for Marine-Earth Science and Technology, Showa-machi, Kanazawa-ku, Yokohama , Japan Also at Nippon Marine Enterprises, Ltd., Yokosuka , Japan Yoshiyuki Kaneda Institute for Research on Earth Evolution, Japan Agency for Marine-Earth Science and Technology, 2-15 Natsushima-cho, Yokosuka , Japan [1] We carried out a reflection/refraction seismic survey across the southern Izu-Ogasawara arc back arc system, covering three arcs with different crustal ages. The oldest Eocene arc has middle and lower crust with high velocities of and km/s, respectively, suggesting denser crustal materials. The current volcanic arc has middle and lower crust with lower velocities of and km/s, suggesting advanced crustal differentiation. The crust-mantle transition layer, with a velocity of km/s, is distributed beneath the current volcanic arc and the rear arc, suggesting a pool of dense materials emanating from the crust through the crustal growth. These structural differences between the Eocene arc and current arc indicate a difference of crustal growth based on basaltic and andesitic magmas according to known petrologic studies. Commonly, rifted crusts have lower crusts with high velocities of over 7.0 km/s, and the arc back arc transition zone also has a thinner more reflective crust that may have been affected by postrifting magmatism. Components: 11,643 words, 13 figures, 1 table. Keywords: Izu-Bonin; seismic structure; crustal growth; OBS; arc back arc system; rifted crust. Index Terms: 8185 Tectonophysics: Volcanic arcs; 7205 Seismology: Continental crust (1219); 3025 Marine Geology and : Marine seismics (0935, 7294). Received 1 July 2008; Revised 11 May 2009; Accepted 19 June 2009; Published 1 September Copyright 2009 by the American Geophysical Union 1 of 28
2 Takahashi, N., S. Kodaira, Y. Tatsumi, M. Yamashita, T. Sato, Y. Kaiho, S. Miura, T. No, K. Takizawa, and Y. Kaneda (2009), Structural variations of arc crusts and rifted margins in the southern Izu-Ogasawara arc back arc system, Geochem. Geophys. Geosyst., 10, Q09X08, doi: /2008gc Theme: Izu-Bonin-Mariana Subduction System: A Comprehensive Overview Guest Editors: S. Kodaira, S. Pozgay, and J. Ryan 1. Introduction [2] Oceanic island arcs, developed by the subduction of a basaltic oceanic plate beneath another oceanic plate, are one of the best locations in which to study the crustal evolution that produces continents. The Izu- Ogasawara arc is located in the western Pacific. Although it is known that the northern Izu-Ogasawara arc (NIA) has middle crust with a P wave velocity (Vp) of 6 km/s composed of continental felsic/intermediate materials [Suyehiro et al., 1996], the process that yields this felsic/intermediate middle crust could prove to be one of the keys to understanding the crustal evolution from oceanic crusts to continents. [3] Structural characteristics of oceanic island arcs are not always similar to each other. Some of the major characteristics for the NIA crust are as follows: middle crust has a Vp of 6 km/s, thin upper part of the lower crust has a Vp of km/s, and thick lower crust has a Vp of km/s [Takahashi et al., 1998]. Kodaira et al. [2007a] modeled the velocity structure along the volcanic front in the NIA and the southern Izu-Ogasawara arc (SIA) and found that a layer with an average Vp of 7.4 km/s underlies lower crust. Sato et al. [2009] showed that the Vp of this layer are km/s and suggested that it is composed of a mixture of crust/mantle materials below the lower crust. The above mentioned structural characteristics, which are components of the middle crust (Vp = 6 km/s) and the thick lower crust, were also detected in other island arcs, which are the Mariana arc, West Mariana Ridge [Calvert et al., 2008; Takahashi et al., 2008] and Tonga arc [Crawford et al., 2003]. However, the Aleutian arc has different structural characteristics. The central Aleutian arc has thin upper crust, thin middle crust (Vp = km/s), and thick lower crust (Vp = km/s) [Holbrook et al., 1999]. According to the Aleutian active source seismic studies [Holbrook et al., 1999; Fliedner and Klemperer, 1999, 2000; Lizarralde et al., 2002; Shillington et al., 2004], the characteristics of the Aleutian arc are an upper crust with a Vp of approximately 6 km/s, a middle crust with a Vp of over 6.5 km/s, and a lower crust with a high Vp of over 7 km/s. [4] The reason for these structural differences is still unknown. According to suggestions that arc evolution assists in directing dense, and mafic crustal materials toward the mantle [Kay and Kay, 1993; Jull and Kelemen, 2001; Tatsumi et al., 2008], the degree of arc evolution could be one of the candidates for inducing velocity variations. Tatsumi et al. [2008] estimated the mineral compositions of the arcs produced using two different scenarios: the mantle-derived basalt and mantle-derived andesite models. The former causes by underplating basaltic primary magma, and the latter uses andesitic primary magmas. Primary andesitic magmas have been suggested to be produced under high-temperature environments [Tatsumi, 2000]. Tatsumi et al. [2008] concluded that the mantle-derived andesite model causes the high Vp in the middle and lower crust. The SIA is one of the best targets for investigating the degree of arc crustal evolution because it has three arcs with different crustal ages: the extinct Ogasawara Ridge produced during the Eocene (OR), the current volcanic arc (CVA), and the extinct rear arc produced in the Oligocene and Miocene (RA) (Figure 1). [5] Structural changes are also brought about by crustal rifting. In this study area, there are two back-arc basins formed by rifting: the Ogasawara Trough (OT) lies between the OR and the CVA, and the Nishinoshima Trough (NT) is between the CVA and the RA. The OT is bounded by normal faults and was formed by rifting during the Eocene [Ishizuka et al., 2006a] and the NT was also formed by rifting [Yuasa and Murakami, 1985]. It is important to find structural commonalities in these rifted crusts in order to understand the structural change brought by the rifting. The Shikoku Basin (SB), which is a back-arc basin formed through arc rifting, is located to the west of the RA. The SB margins might have clues to understanding the arc evolution brought about by crustal rifting. [6] Although the SIA has structures important for understanding arc crustal growth, there have been few controlled seismic experiments to understand 2of28

3 Figure 1. Bathymetry of the SIA around the experimental region. The thick gray line and red circles indicate the locations of the air gun shooting line and OBSs, respectively. Numerals denote the site numbers of the OBSs. The contour interval is 1,000 m. The inset shows the bathymetry of the entire Izu-Ogasawara-Mariana arc with a 2,000-m contour line. WMR, the West Mariana Ridge; MT, Mariana Trough; MA, Mariana arc. The double-pointed arrow indicates the area shown in Figure 13. the velocity structure across the entire SIA. Therefore, we carried out a seismic experiment across the SIA using 110 ocean bottom seismographs (OBSs) and an air gun array with a total capacity of 12,000 cubic inches (197 L) to obtain the velocity structure. The final goal of this paper is to answer why there are crustal variations among oceanic island arcs and what arc rifting brings inside the crust. In this paper, we show that Eocene arc is composed of denser materials than other two arcs and that high-velocity lower crust identified beneath rifted crust commonly is constructed by magmatic underplating rather than serpentinized mantle. 2. Tectonic Setting [7] The entire Izu-Ogasawara arc was formed by intraoceanic subduction [Karig and Moore, 1975; Hall et al., 1995], which began when the direction of the Pacific Plate changed from NW to WNW at 50 Ma [Sharp and Clague, 2006]. The current speed of the Pacific Plate subduction is approximately mm/a [Seno et al., 1993]. The infant island arc, including the OR and part of the Mariana frontal arc, was produced by boninitic volcanism beginning in the Eocene [Pearce et al., 1992; Ishizuka et al., 2006a]. The old oceanic crust before the production of the Eocene arc was accumulated around the inner trench slope of the Izu-Ogasawara trench [DeBari et al., 1999]. Volcanism in the Eocene arc continued until the Oligocene and decreased at 27 Ma [e.g., Taylor, 1992]. Although the distribution of the Eocene and Oligocene volcanism have not yet been specified, Kodaira et al. [2008] suggested that the Oligocene arc is located beneath the current rear arc on the basis of correlations between the crustal structures of the CVA 3of28
4 and the RA. Volcanogenic sediments collected in the NIA fore arc by ocean drilling indicate that volcanic ash does not exist at Ma [Taylor, 1992]. This period of inactive volcanism corresponds to that of the back-arc opening, which separates the Kyushu Palau Ridge from the NIA. Okino et al. [1994] indicated that the period of the SB opening was Ma. The Parece Vela Basin also opened around the same time at Ma [Okino et al., 1998]. Arc volcanism activated again at 17 Ma in the Miocene [Taylor, 1992]. The volcanism, active from the Miocene to the Pliocene, extended as far as 120 km west of the current volcanic front, i.e., from the RA to the CVA [Ishizuka et al., 2006b]. Thereafter, the most recent volcanism in the period between the Pliocene and the Quaternary occurred within 40 km of the volcanic front [Ishizuka et al., 2006b]. [8] The local tectonic setting for the SIA is as follows: the OR with a boninitic materials was constructed between 48 Ma (Eocene) and 30 Ma (Oligocene) [Ishizuka et al., 2006a]; the RA, including the extinct Tenpo Seamounts, formed during the Miocene until the SB opening ceased [Ikari and Nishimura, 1991]; and the current arc including the active volcanic front was active during the Pliocene-Quaternary period [Ishizuka et al., 2006b]. Yuasa [1991] suggested that the Eocene volcanics was distributed widely at not only the current OR but also the volcanic front, and Stern and Bloomer [1992] indicated that the crustal production rate during the Eocene was several times greater than the current rate. The distribution for the entire Eocene volcanics, however, has not yet been specified. The OT was produced by rifting at Ma [Ishizuka et al., 2006a]. After the Oligocene volcanism, the SB opening propagated from the northtothesouthduringtheriftingperiodforthesia, then, the Parece Vela Basin opening propagated from south [Okino et al., 1994; Sdrolias et al., 2004]. Yuasa [1991] suggested that the Parece Vela Basin opening cut into the SIA and the northern edge corresponds to the NT. Kodaira et al. [2008] suggested that the NT activated as part of the Oligocene rift. The age of the NT sediments identified, however, is after the Pliocene [Higuchietal., 2007], and the origin of the NT is not yet understood. 3. Seismic Experiment and Data Characterization [9] To detect the structural variations of the SIA crust, we carried out a seismic experiment across the entire SIA using the R/V Kaiyo of the Japan Agency for Marine-Science and Technology (JAMSTEC) [Kaiho et al., 2005]. In order to understand the entire crustal evolution for the region, we ran a long offset seismic line from the trench to the back arc. This enabled us to construct a velocity model of the whole arc transecting down to the mantle. The seismic line runs from the inner trench slope to the western SB through the OR, OT, CVA, NT, and the RA (Figure 1). We deployed 110 OBSs on the line at intervals of 5 km and employed an air gun array with a total capacity of 12,000 cubic inches (197 L). The shooting interval was 200 m. [10] To obtain entire crustal structures achieving our scientific goal, observing distinct reflections and refractions from the long offsets was required. Continuous reflections are useful to identify extent of layers with different compositions. Identifying structural characteristics is difficult in thin rifted crust and crusts with large interval velocity contrasts, because the tomographic inversion smoothes these abrupt structural changes. Constructing the layered structure using the reflection distribution is useful to overcome the smoothing effect of the tomographic inversion. Our data quality is sufficient for modeling the arc structure, and almost all of the OBS record sections have long first arrivals to an offset of km. Here, we show nine vertical sections of the OBSs to introduce the data characterization representative for each ridge and basin (Figure 2). Site 6, site 17, site 33, site 44, site 53, site 74, site 87 and site 108 were deployed on the inner trench slope, the OR, the OT, the CVA, the eastern edge of the NT, the RA, the eastern SB, Figure 2. Example of the vertical component of OBSs and comparison between the calculated and observed traveltimes. A deconvolved filter and a band-pass filter (5 15 Hz) are applied. The horizontal and vertical axes are offset from the OBS (km), and the traveltime is reduced by 8 km/s (s). Puc, Pmc, Plc, and Pn indicate the calculated refractions through the upper, middle, and lower crust and the upper mantle, respectively, and Pum, Pml, and PmP indicate the calculated reflections from the middle and lower crust and the Moho, respectively; these are calculated using forward modeling. The gray lines and red dotted lines indicate the calculated traveltimes using a layered and a tomographic final model, respectively. The colored thick lines and widths indicate the observed traveltimes and picking error, respectively. (a and b) Site 6, (c and d) site 17, (e and f) site 33, (g and h) site 44, (i and j) site 53, (k and l) site 74, (m and n) site 87, and (o and p) site of28


5 3 G takahashi et al.: crustal structure of southern izu-ogasawara arc /2008GC Figure 2 Geochemistry Geosystems 5 of 28


6 3 G takahashi et al.: crustal structure of southern izu-ogasawara arc /2008GC Figure 2. (continued) Geochemistry Geosystems 6 of 28
7 Figure 2. (continued) 7of28


8 3 G takahashi et al.: crustal structure of southern izu-ogasawara arc /2008GC Figure 2. (continued) Geochemistry Geosystems 8 of 28
9 and the western SB respectively. These record sections have clear refractions as first phases and some reflections within the crust. We modeled a crustal structure mainly to satisfy these traveltimes for refractions and reflections. [11] The western side of site 6 has clear refractions until an offset of about 200 km and clear reflections at offsets of 15 30, 40 to 20, and 100 to 40 km (Figure 2a). On the eastern side, reflections are traced until an offset of 40 km. In particular, the reflections identified at offsets of km have relatively large amplitudes. At the far side of an offset, we traced large amplitude reflections with no refractions. Site 17 also indicates clear refractions until an offset of 120 km (Figure 2b). On the eastern side, refractions are traced until an offset of 80 km, and clear reflections with large amplitudes are identified at offsets of km and a traveltime of 6 s. The western side of site 33 has first phase undulations corresponding to the severe topography (Figure 2c). Clear reflections are observed at offsets of and km on the eastern side and offsets of 75 to 40 km on the western side. Site 44 also has clear refractions on both sides until an offset of 100 km and reflections with large amplitudes at offsets of 40 50, 50 80, and 60 to 25 km (Figure 2d). At site 53, refractions are observed as first phases until offsets of 80 and 100 km on both sides (Figure 2e). Clear reflections are identified at offsets 40 75, and km on the eastern side. Site 74 indicates refractions as the first phases until far offsets of over 100 km on both sides, and the apparent Vp of refractions in the western side becomes 8 km/s near the offset of 25 km (Figure 2f). Clear reflections are observed at eastern offsets of km and 30 to 20 km. Site 87 has very short offsets with an apparent Vp of less than 8 km/s (Figure 2g). Site 108 has clear refractions as the first phases until offsets of over 100 km, with apparent velocities indicating severe undulation at offsets of km and corresponding to the Kinan Seamount Chain. 4. Data Analysis [12] To obtain a velocity structure with high resolution, we employed a tomographic inversion technique using first arrivals [Zhang et al., 1998] and a diffraction stack migration approach using traced reflections [Fujie et al., 2006]. Forward modeling using a layered model [Zelt and Smith, 1992; Zelt and Ellis, 1988] was then used to fit the traveltimes and amplitudes of the reflections. An elastic modeling using finite difference wave propagation code (E3D) [Larsen and Grieger, 1998] was employed to confirm the amplitudes of the refractions and reflections. [13] First, we carried out the tomographic inversion using a simple initial model to detect lateral variations of the crustal structure (Figure 3). On the basis of the seismic structure obtained from previous studies [Suyehiro et al., 1996; Takahashi et al., 2007], the initial model with sedimentary layers citing velocity tables obtained using reflection data was composed of a homogeneous thin crust (6 km thick) beneath the back arc and a thick crust (20 km thick) beneath the arc region (Figure 3a). This initial tomographic inversion comprised two steps: the first step was carried out for the shallow section using limited first arrivals within an offset of 20 km. Using the results of the first step, we carried out the inversion in the second step using all of the first arrivals (Figure 3b). We repeated the iteration until the RMS residuals reached minimum values of less than 100 ms. We then mapped the reflection arrivals on the velocity image using the diffraction stack migration approach [Fujie et al., 2006] (Figure 3c). We constructed a new initial model, shown in Figure 3d, with variations of the crustal thickness based upon the image shown in Figure 3c. We included the subducting oceanic crust in this model. We carried out the tomographic inversion again and obtained the final result from the second inversion (Figure 3e). We then obtained a velocity image with reflectors as mentioned above (Figure 3f). The grid size for these tomographic inversions was 500 m 500 m. We estimated the picking error for each trace depending upon the signal-to-noise ratio, with a maximum of 200 ms. Figure 4 shows the final tomographic image obtained from the result of a checkerboard test used to identify the reliable region and its interpretations. In the checkerboard test, we adopted a Vp perturbation of 5% and two perturbation grid sizes of 10 km 5 km for regions shallower than 10 km and 20 km 10 km for regions deeper (Figure 4b). We regard portions having a clear positive-negative perturbation pattern as the resolved areas. Most of the traveltime residuals fall within ±100 ms (Figure 5). [14] Although the above tomographic inversion is advantageous for constructing lateral heterogeneous velocity images, it is impossible to use for modeling the reflection traveltimes. Therefore, we constructed a layered model with a velocity contrast by performing conventional forward modeling for each layer [Zelt and Smith, 1992; Zelt and Ellis, 1988] using the traveltimes of the identified reflec- 9of28

10 Figure 3 10 of 28
 Result using the checkerboard test. (c) Reflections mapped on the final model with interpretations. UC, MC, and LC denote the upper, middle, and lower crust, respectively.")
11 Figure 4. Tomographic inversion results. Contour interval is 0.2 km/s. (a) The obtained final velocity model. The darker colored region indicates a low-resolution area estimated from Figure 4b. (b) Result using the checkerboard test. (c) Reflections mapped on the final model with interpretations. UC, MC, and LC denote the upper, middle, and lower crust, respectively. Reflector A is located only beneath the volcanic front and along a contour line of 7.6 km/s. tions and refractions in order to distinguish continuous layers (Figure 6). We selected four layers as the targets to be distinguished using continuous reflectors (A E in Figures 4c and 6c 6g). The forward modeling result was confirmed by calculations of the RMS traveltime residuals and chisquare values which denote the RMS traveltime residuals normalized by the picking error and by comparing the observed and calculated traveltimes (Figure 7). The node interval for the forward modeling is 5 km, which is similar to the OBS interval. Therefore, the velocity structure from forward modeling has a resolution for lateral variation of about 5 km. After the construction of the Figure 3. Tomographic inversion process. Contour interval is 0.2 km/s. (a) Initial model of the first inversion. (b) Result of the first inversion. (c) Reflection mapping projected on Figure 3b. The darker colored regions show large numbers of mapped reflection arrivals as compared to the light regions. (d) Initial model of the second inversion reconstructed based on Figure 3c. (e) Results from the second inversion. (f) Reflection mapping projected on Figure 3e. 11 of 28
12 Figure 5. Traveltime residuals between the observed and calculated values using the final velocity model (Figure 4a). (a) The total RMS residual for all the OBSs with the error bar indicated by 1s. (b) RMS traveltime residuals of each OBS. velocity model, we verified an error range of Vp, indicating the minima of the RMS residuals and chi-square values by using the simplified Vp value to confirm the specified structural characteristics (Figure 8). [15] To model the amplitudes of deep reflections from interface E beneath the CVA, we calculated the amplitudes of the reflections using E3D software [Larsen and Grieger, 1998] and determined the velocity contrast by trial and error. Such reflections are observed on some OBSs that were deployed around the current active arc, from site 33 to site 54. Although it is difficult to quantitatively evaluate the consistency between the synthetic and observed seismograms, we formulated the synthetic seismograms by changing the velocity contrast with intervals of 0.1 km/s (Figure 9). 5. Seismic Structure of the SIA [16] We obtained two velocity models using the abovementioned analysis flow: one is a tomographic image and the other is a layered structure. These two velocity models are very similar to each other and have common structural characteristics. We identified seven regions on the basis of the obtained structural characteristics: the OR, OT, CVA, NT, RA, the arc back arc transition zone (ABT) between the RA and the SB, and the SB (Figure 10). We extracted the crustal layers of each area on the basis of the continuous interface distribution and the Vp, as described in section 4.1. Although there are velocity variations within each layer, we differentiate them as the upper, middle, and lower crust, and a crust-mantle transition layer (CMTL) (Figure 10a). In this section, we summarize the characteristics and reliability of the velocity model with a layered structure (Figures 10b and 10c) Reliability of the Velocity Model [17] In this study, velocities down to the upper mantle are generally resolved along the entire profile on the basis of the results of the checkerboard test. The maximum depths of the resolved area from beneath the SB to the ABT, the RA to the NT, and the CVA to the OR are approximately 15, 20, and 25 km, respectively (Figure 4b). Figure 6. Forward modeling results based on Figure 4c. Contour interval is 0.2 km/s. (a) Obtained layered velocity model. The darker colored region indicates a low-resolution area. UC, MC, and LC denote the upper, middle, and lower crust, respectively. (b) Raypaths with every 20 rays of refractions used for the construction of the layered model. Break lines indicate the boundaries of each layer. (c g) Raypaths with every 20 rays of reflections from interfaces A, B, C, D, and E. 12 of 28

13 Figure 6 13 of 28
14 [18] For forward modeling on the layered model, we confirmed the reliability of the velocity model as shown in section 4, and modeled the offset ranges and amplitudes for observed refractions changing the velocity gradients of each layer. The error for each Vp was confirmed by using the RMS traveltime residuals and is estimated to be ±0.1 km/s. The RMS traveltime residuals of the refractions through the upper, middle, and lower crust, the CMTL, and the upper mantle are 88, 92, 105, 130, and 172 ms, respectively. The chi-square values of these refractions are 3.509, 1.694, 1.687, 1.284, and [19] As shown by Figure 8, we estimated the Vp ranges for the middle crusts beneath the RA (Figure 8a), the CVA (Figure 8b), and the OR (Figure 8c), and the lower crusts beneath the ABT (Figure 8d), the NT (Figure 8e), and the OT (Figure 8f). In this test, we estimated the Vp error using each time difference between the minimum peaks of the profiles for the RMS traveltime residuals and chi-square values. By adding the time difference to Vp step used in this test (0.1 km/s), the Vp errors for the middle crusts beneath the RA, CVA, and OR are 0.1, 0.2, and 0.2 km/s, respectively. The Vp errors for the lower crusts beneath the ABT, NT, and OT are 0.4, 0.2, and 0.3 km/s, respectively. On the basis of the test results, we concluded that the Vp for the middle crust of the OR is larger than for the others, and that the Vp of the lower crust for the three trough regions are higher than for the typical oceanic crust beneath the Pacific seafloor with a depth of over 2.5 km (6.81 ± 0.16 km/s [Shor et al., 1970]). [20] In order to model the amplitudes of deep reflections from interface E, we constructed some models with a velocity contrast ranging from 0.1 to 0.3 km/s. Figure 9 shows an example of this modeling for site 49. Assuming the velocity contrast of interface E to be 0.3 km/s, the amplitudes of the modeled reflections are consistent with the observed ones (Figures 9a and 9b). However, a velocity contrast of 0.1 km/s yields relatively small amplitudes of reflections at an offset of km (Figure 9c). The error in the Vp determined by modeling the reflection amplitudes is estimated to be approximately 0.2 km/s. On the other hand, a velocity contrast of 0.5 km/s at interface D yields reasonable reflections with similar amplitudes to those observed (Figure 9) Ogasawara Ridge [21] The OR is located at a distance of km on Figure 10 on the basis of the shape of the Moho and the distribution of the middle crust. The maximum crustal thickness is approximately 18 km. Under the thin sedimentary layer, we confirmed four layers: the basement layer and the upper, middle, and lower crust. Their velocities are shown in Table 1. [22] On this ridge, the upper crust has a Vp of approximately 6 km/s; toward the west it thickens and the Vp decreases. The middle crust is pinched out at both ends and the maximum thickness is approximately 6 km. Although the lower crust has a constant thickness of approximately 9 km except for the ends, the Vp parting the center position is slightly faster than the surrounding region. As observed by the continuous reflectors, the tops of the upper, middle, and lower crust and the Moho are likely to have velocity contrast. The Vp of the easternmost mantle wedge is 7.6 km/s, which is lower than Vp of mantle materials (7.8 km/s [Christensen, 1996]). [23] Although no refractions beneath the subducting plate were observed, we observed reflections from the top and inside of the plate. Assuming the velocities of oceanic layers 2 and 3 to be and km/s, respectively, we modeled the Pacific Plate subducting beneath the OR. The subducting oceanic crust is tangential to this ridge at a range of km and a depth of 18 km Ogasawara Trough [24] The OT is located at a distance of km on Figure 10c. The crustal thickness is generally km and increases toward both sides. Underlying a thick sedimentary layer and the basement, we identified two layers: the upper (Vp = km/s) and lower crust (Vp = km/s). There is no middle crust with a Vp of km/s identified beneath the OR. The mantle Vp is constant at 7.8 km/s and lateral variation was not detected. Figure 7. Comparison of traveltimes between the observed and calculated values. The black dots and colored lines indicate the observed and calculated traveltimes, respectively. The widths of the colored lines indicate the selection error. Pmc, Plc, and Pn denote the refractions from the middle and lower crust and the upper mantle respectively. PmP denotes the reflections from the Moho. (a) Site 1, (b) site 10, (c) site 20, (d) site 30, (e) site 40, (f) site 50, (g) site 60, (h) site 70, (i) site 80, (j) site 90, (k) site 100, and (l) site of 28
15 Figure 7 15 of 28
16 Figure 7. (continued) 16 of 28
17 Figure 8. Reliability test. The solid and broken lines indicate the RMS residuals between the observed and calculated traveltimes and the chi-square values, respectively. (a) Middle crust beneath the RA. (b) Middle crust beneath CVA. (c) Middle crust beneath the OR. (d) Lower crust beneath the ABT. (e) Lower crust beneath the NT. (f) Lower crust beneath the OT. 17 of 28
18 Figure 9. Example of amplitude modeling for reflector E. All the traces are filtered through Hz. Blue and red arrows show the reflections from interfaces D and E. (a) Observed record section. Geometrical amplitude correction is applied. (b) Synthetic seismograms using a model with 0.3 km/s as the velocity contrast at reflector A. (c) Synthetic seismograms using a model with 0.1 km/s. [25] The western half of the upper crust is thicker than on the eastern side and its Vp ( km/s) is lower than that on the eastern side ( km/s). At the center of the trough, we identified a sharppointed structure (like an intrusive body) with a relatively high Vp of approximately 6 km/s. The thickness of the lower crust increases westward from 6 to 8 km. Its Vp is relatively high with a maximum value of 7.4 km/s. The Vp of the lower crust decreases to km/s at the western boundary with the CVA. A reflector inside the lower crust, which is discontinuous toward the OR and the CVA, coincides with a contour line of 7.2 km/s (Figure 4c) Current Volcanic Arc [26] The CVA is located at a distance of km on Figure 10c. The crustal thickness has a maximum of approximately 20 km and thins toward both ends. The crust is composed of five layers, which are similar to the OR. Underneath the sedimentary layer, we identified the basement layer, and the upper, middle, and lower crust. Their 18 of 28
 Geological interpretation. (b) Western half of the model from the center of the SB to the NT.")
19 Figure 10. Details of the layered model. Numerals denote the P wave velocity (km/s). Contour interval is 0.2 km/s. (a) Geological interpretation. (b) Western half of the model from the center of the SB to the NT. (c) Eastern half of the model from the CVA to the OR. 19 of 28
20 Table 1. Comparisons of Velocity, Crustal Volume, and Proportion Among Three Arcs and Aleutians Rear Arc Current Volcanic Arc Ogasawara Ridge Aleutian Arc Region Distance (km) Vp (km/s) Upper crust Volume (km 3 /km) Proportion (%) Vp (km/s) Middle crust Volume (km 3 /km) Proportion (%) Vp (km/s) Lower crust Volume (km 3 /km) Proportion (%) Whole crust Average Vp (km/s) 6.61 (6.93) 6.47 (6.71) 6.71 Volume (km 3 /km) 1,163 1,281 1,674 velocities are shown in Table 1. In addition, there is the CMTL with a Vp of km/s between the lower crust and upper mantle. [27] The model exhibits markedly strong lateral variations in the middle and lower crust. The middle crust has a maximum thickness of approximately 5 km immediately beneath the volcanic front. The Vp beneath the volcanic front and beneath the next western topographic high (distance = 320 km) are and km/s, respectively. The Vp of the lower crust immediately beneath the volcanic front is km/s, which is lower than for the OT. A reflector inside the lower crust is identified in the eastern half and discontinuous to the western part (distance = 380 km; Figure 4c). [28] The CMTL with a Vp of km/s is distributed beneath the CVA. A velocity contrast on interface E (Figure 4c) between this transition layer and the upper mantle reaches a maximum of 0.3 km/s immediately beneath the volcanic front. This layer thins beneath the OT and is obscured toward the west. The upper mantle Vp beneath this transitional layer is 7.9 km/s, which is close to velocities of mantle materials (7.8 km/s [Christensen, 1996]). Beneath interface E, a few reflectors also exist in the upper mantle; however, they are laterally discontinuous Nishinoshima Trough [29] The NT is located at a distance of km on Figure 10b. The crustal thickness is approximately 10 km. The mantle Vp is 7.9 km/s. The crust is composed of four layers beneath the sedimentary layer, the basement layer and the upper (Vp = km/s), middle (Vp = km/s), and lower crust (Vp = km/s). [30] The upper crust with a maximum thickness of approximately 2 km underlying the basement has a Vp of km/s. The thickness beneath the eastern side is higher than that beneath the western side. The middle crust is thin beneath this trough and is indicated by the continuous distribution of the reflections from the middle and lower crust (Figures 6d and 6e). The lower crust also becomes thin toward the center of the trough and the minimum thickness is approximately 5 km Rear Arc [31] The topographic high located in a range of km on Figure 10b is named the Tenpo Seamount, which is one of the seamounts in the RA. The crustal thickness has a maximum of 16 km and decreases toward both ends. The crustal composition is similar to the CVA. The velocities of the upper, middle and lower crust are shown in Table 1, and the Vp of the lower crust is faster than that of the CVA. [32] The thickness of the upper crust is lowest in the central part of the RA and thickens toward both flanks. The middle crust is the thickest in the central part and decreases toward both flanks. The lowest Vp of 6.6 km/s within the lower crust is distributed at the center of this seamount. However, the Vp increases westward and is over 7.3 km/s beneath the boundary between the RA and the ABT. Beneath the lower crust, the CMTL has a maximum Vp of 7.6 km/s. This Vp is significantly 20 of 28
21 lower than the typical mantle Vp (8.0 km/s) and is similar to that beneath the CVA. However, it increases toward both of the ridge ends, becoming km/s. Furthermore, this low Vp does not extend to the deep reflector at the depth of approximately 27 km (Figures 4c and 10). The reflector is discontinuous next to both the ABT and the NT Arc Back Arc Transition Zone Beneath the Eastern Shikoku Basin [33] We see a high-velocity lower crust (HVLC) with a Vp of over 7.0 km/s at a distance of km on Figure 10b, which is greater than that of a typical oceanic crust [White et al., 1992]. In this paper, the region with the HVLC has been named as the ABT. The Koka Seamount is composed of a basement layer and an upper, middle, and lower crust beneath the sedimentary layer. For the other region except the Koka Seamount, we identified two major layers: the upper and lower crust. Although the error for the high Vp within the lower crust is relatively large, it is still probably faster than that the one bordering the west side, as described in section 5.1. [34] The velocity model of the ABT is characterized by a middle crust with a Vp of km/s only beneath the Koka Seamount and the HVLC. The lower crust with a high Vp thickens beneath the Koka Seamount and the Moho probably deepens underneath. The Vp of the lower crust in the eastern half (distance: km) is over 7.2 km/s, and it is greater than that in the western half (distance: km), which is in the range of km/s. There is high reflectivity in the lower crust (distance: km). As shown in Figure 4c, regions with high reflectivity are located within the areas having a Vp of over 7.0 km/s. The upper mantle is almost homogeneous with a Vp of km/s Shikoku Basin [35] The SB is one of the back-arc basins between the Izu-Ogasawara arc and the Kyushu-Palau Ridge and broadly occupies the northern Philippine Sea. The area, except for the region including the HVLC, is located at a distance of 0 75 km on Figure 10b. The crustal thickness is approximately 6 km. The mantle Vp is km/s and similar to that of a typical mantle (8.0 km/s) [Christensen and Mooney, 1995]. The crust is composed of three layers beneath the sedimentary layer: a basement layer and the upper (Vp = km/s) and the lower crust (Vp = km/s). The lower crust is homogeneous with a thickness of 2 3 km and a constant Vp. 6. Discussion [36] As described in the introduction, there are differences of the structural characteristics of island arcs, such as the Izu-Ogasawara-Mariana arc and the Aleutian arc. The processes controlling arc growth may be the key to understanding the different crustal structures in these arcs. Here, we discuss how the structural variations are brought about in view of the crustal growth process. In order to achieve our goal, we take following steps: [37] 1. We note the structural variations among the different arcs: the oldest OR from the Eocene, the current active CVA, and the extinct RA from the Miocene and summarize their structural commonalities and differences. [38] 2. We discuss the possibility that such variations can be brought about by crustal growth based upon two different petrologic scenarios. [39] 3. We compare the velocity model of the Izu- Ogasawara-Mariana arc with that of the Aleutian arc. Because both arcs include boninitic materials, finding common characteristics between them is significant. [40] 4. We note the structural commonalities among rifted crusts as another candidate for causing crustal alterations. Although the crustal growth of the Izu-Ogasawara-Mariana arc was accompanied by back-arc opening, the Aleutian arc has no back-arc basins. The influences of the tectonic differences for crustal growth are discussed Structural Variation of Arcs [41] As mentioned above, the three arcs in this region (the OR, the CVA, and the RA) have three layers beneath the basement in common: the upper, middle, and lower crust. Here, we compare the Vp volume profiles for these arcs on the basis of tomographic images and the layered model (Figure 11). The profiles of the three arcs using both the tomographic image and the layered model are roughly similar, although the effects of smoothing on the tomographic image may be slightly excessive when identifying the characteristics of the shallow crust. The OR has two major peaks at velocities of 6.6 and 7.1 km/s (Figure 11a). The CVA has three peaks at velocities of 6.3, 6.9, and 7.6 km/s (Figure 11b). The RA has two major peaks at velocities of 6.3 and 7.3 km/s (Figure 11c). 21 of 28
22 Figure 11. Comparison of the velocity-area profiles between the tomographic model and layered model. Bar and line graphs indicate areas calculated using the layered and tomographic models, respectively. (a) OR. (b) CVA. (c) RA. [42] We compared these profiles to identify commonalities and differences in the structural characteristics of these arcs (Figure 12a). The most remarkable characteristic on the OR profile is the peak at a Vp of over 6.5 km/s corresponding to the middle crust. On the other hand, the peaks beneath the CVA and the RA are both located at Vp of less than 6.5 km/s. For the lower crust, the OR and the RA have a peak between 7.0 and 7.5 km/s, whereas the peak for the CVA is located between 6.8 and 7.0 km/s. As shown in Table 1, the velocities beneath the OR are the highest for all crustal layers. The CMTL with a Vp peak of 7.6 km/s is distributed beneath the CVA and the RA. Sato et al. [2009] indicated that a CMTL with a Vp of km/s observed beneath the entire current volcanic front is composed of a mixture of dense crustal materials and mantle materials. A CMTL with a Vp of less than 8.0 km/s also exists beneath the RA; however, the low Vp does not extend to the interface beneath the Moho. The relatively slow mantle Vp was also detected beneath the OR; however, it is difficult to evaluate whether the origin is the CMTL brought about by crustal growth or mantle materials serpentinized by subduction. Therefore, we do not discuss the slow mantle Vp beneath the OR separately from the discussion of the CMTL. [43] Approximately 50% of the total crustal volume of all three arcs is made up of the lower crust. The upper and middle crusts occupy 11 18% and 17 26% of these arcs, respectively. These values are consistent with those for the Mariana arc proposed by Takahashi et al. [2007]. Although the values of these crustal layers are roughly similar to each other, the bulk Vp of the OR crust (6.71 km) is the highest (Table 1). The Vp of the CVA and the RA are 6.44 and 6.61 km/s, respectively, and the CVA has the lowest Vp Crustal Growth Processes for Three Arcs [44] Although the proportions of the crustal layers are similar to each other, Vp variations in the middle and the lower crust can be seen. According to Behn and Kelemen [2003], one of the origins for the Vp variations may be the SiO 2 and MgO content. The process of one of crustal growth models could be regarded as removal of dense and mafic materials [Tatsumi et al., 2008]. There- Figure 12. Comparison of the velocity-area profiles among seven regions. (a) Three arc regions. Solid, dashed, and short-dashed lines denote the profiles of the OR, CVA, and RA, respectively. (b) Three rifted regions and the SB. The solid, dashed, short-dashed, and dotted lines denote the profiles of the OT, NT, ABT, and SB, respectively. 22 of 28
23 fore, possible origins to bring about these Vp variations might be (1) different models for the crustal growth or (2) the degree of the crustal growth. Here, we discuss which origin is possible comparing the CVA with the OR and the RA. [45] The structural differences between the CVA and the OR may have been brought about by different scenarios of crustal growth. According to Tatsumi et al. [2008] introduced in section 1, their Vp profiles for the mantle-derived basalt model and the mantle-derived andesite model are consistent with those obtained beneath the CVA and the OR in this study, respectively. For example, the petrologic Vp profile [Tatsumi et al., 2008] indicates that the velocities of the middle crusts estimated using the mantle-derived basalt and andesite models are and km/s, respectively. This suggests that the crustal growth processes producing the middle crusts for the CVA and the OR are quite different. Because the OR is known as the boninitic arc [Ishizuka et al., 2006a], this result is also consistent with the background geology. The Vp of the lower crust beneath the OR is also faster than that beneath the CVA. In other words, an area with a Vp of less than 7 km/s beneath the OR, corresponding to the upper part of the lower crust studied by Tatsumi et al. [2008], is narrower and limited mainly within a region near the CVA. This suggests that the OR crust remains dense and is composed of mafic materials. [46] The RA has lower crust with a high Vp and higher bulk crustal Vp compared to the lower crust of the CVA. Because the structural characteristics of the RA (the Vp of the middle crust, the Vp of less than 7 km/s in the lower crust and the CMTL) are common to those beneath the CVA, the crustal compositions are probably similar. According to Tatsumi et al. [2008], the CVA was produced with the mantle-derived basalt model. On the other hand, the deep reflector beneath the CVA has velocity contrast between 7.6 and 7.9 km/s, whereas the RA has no deep reflectors with such a velocity contrast. The average Vp of the CMTL beneath the RA is higher than that beneath the CVA. These characteristics suggest that the transformation of the dense crustal materials to the CMTL, as discussed by Tatsumi et al. [2008] and Takahashi et al. [2007]. Sato et al. [2009] suggests that the velocity variation in the CMTL is induced by the variation in the proportions of the dense crustal materials and mantle materials. Because the transformation of the dense crustal materials to the mantle needs a heat supply accompanied by materials rising from the slab [Tatsumi et al., 2008], it has been suggested that the RA underwent a shorter crustal growth process compared to the CVA. Indeed, the RA along this seismic line corresponds with the Tempo Seamount, which is an extinct seamount formed at 15 Ma just before the end of the SB opening [Ikari, 1991]. However, undifferentiated mafic materials may not be the only reason for the HVLC because the HVLC beneath the RA is distributed continuously until the ABT. Because such a HVLC is sometimes identified beneath continental margins, the rifting process, discussed in section 6.4, may have contributed to the development of the layer. [47] As one of candidates brought above velocity differences of each layer, a difference among thermal structures of arcs is possible, because the CVA is currently active and the OR is inactive. However, we consider that the influence of thermal structure is limited. Kitamura et al. [2003] modeled the velocity structure of the Izu-Ogasawara arc on the basis of the velocity measurement and adopted a temperature derivative of km/s C [Rudnick and Fountain, 1995] and adopted the maximum thermal gradient of 40 C/km according to heat flow measurements for this arc [Yamazaki, 1992] and a study of Japan arc [Nakajima and Arima, 1998]. Furukawa [1993] used 25 C/km as a thermal gradient of typical arcs. The high temperature such as 1000 C at a bottom of the crust bring the melt in the crust according to Tatsumi et al. [2008], however, such anomalous structures are not identified in this study. Therefore, above temperature derivative and thermal gradient are reasonable. According to Christensen and Mooney [1995], the influence of temperature on seismic velocity has received only limited attention. In addition, it may be difficult to explain the differences of crustal proportions difference using gradual change of the temperature. We believe that a difference of the crustal composition bring the structural difference Comparison of the Crustal Structure With the Aleutian Arc [48] The Aleutian intraoceanic arc is located on the southern margin of the Bering Sea connecting the Kamchatka Peninsula and the Alaska continent [Creager and Boyd, 1991].Inthissection,onthe basis of the velocity structures of the Izu-Ogasawara- Mariana region [Suyehiro et al., 1996; Takahashi et al., 2007; Kodaira et al., 2007a, 2007b], we discuss why there are two types of velocity structures in the same oceanic island arc. 23 of 28
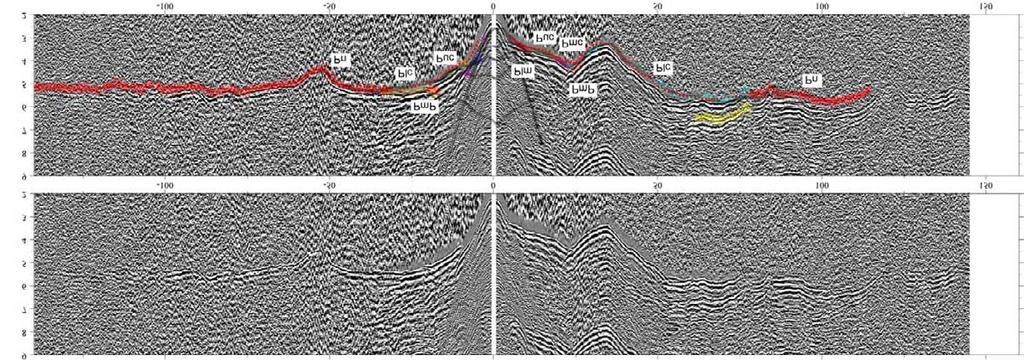
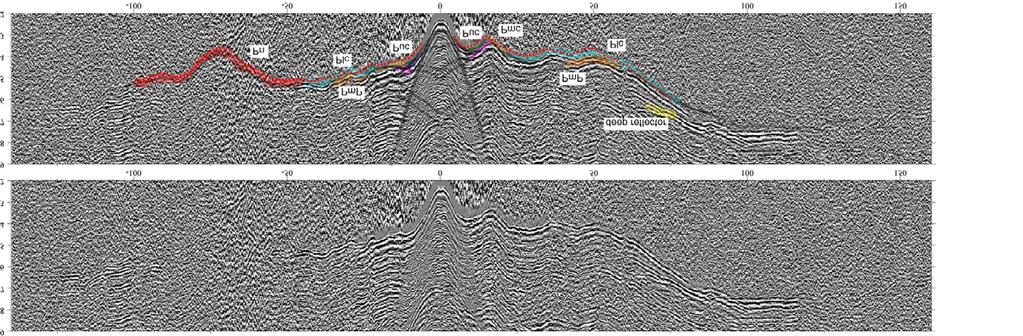
24 [49] We compared the velocity structures between the CVA, OR, and the Aleutian arc and found that the Aleutian arc has similar structural characteristics to the OR. From the many studies on the Aleutian arc [e.g., Holbrook et al., 1999; Fliedner and Klemperer, 1999, 2000; Lizarralde et al., 2002; Shillington et al., 2004], we selected a velocity structure across the arc summarized by Holbrook et al. [1999] because the experimental geometry (including the OBSs) of the seismic survey was similar to that used in this study. Because their seismic line is far away from western Alaska, we believe that their velocity model is not influenced by the structure of the Alaska continental crust. [50] The Aleutian arc may have similar crustal growth process as the OR. The Aleutian velocity model has three crustal layers; the upper (Vp = km/s), the middle (Vp = km/s), and the lower crust (Vp = km/s). These structural characteristics of the central Aleutian arc are common to the OR. Moreover, their background geologies are also similar. The profile of the MgO content along the volcanoes of the Aleutian arc summarized by Kelemen et al. [2003], and the MgO content beneath the velocity model of Holbrook et al. [1999] shows a relatively larger MgO content compared to the OR with a maximum of 13.5 wt%, although there are variations of up to 4.0 wt%. Therefore, this suggests that the Aleutian arc experienced boninitic volcanism like the OR and that boninitic materials are included within the arc. [51] Shillington et al. [2004] obtained the structural variation along the Aleutian arc and suggested that the crust was produced under conditions with higher heat flow and lower pressure. Studies around the Izu- Ogasawara-Mariana arc also suggest that boninites were produced under conditions with high heat flow. Pearce et al. [1992] proposed the subduction of an actively spreading ridge beneath the young lithosphere. Ishizuka et al. [2006a] proposed that the boninitic arc crustal growth accompanied the sinking of the Pacific Plate with a trench retreat and adiabatic upwelling of the asthenosphere at Ma. The adiabatic upwelling of the asthenosphere may have induced higher heat flow in the mantle wedge beneath the spreading fore-arc and boninitic volcanism in that region. In view of the conditions to produce boninites, the abovementioned studies show commonalities between the Izu-Ogasawara arc and Aleutian arc. [52] We suggest that the structural differences identified between the Izu-Ogasawara arc and the Aleutian arc originate from differences in the crustal growth scenario as proposed by Tatsumi et al. [2008]. The crust beneath the CVA developed from basaltic primary magma. On the other hand, the crusts beneath the OR and the part of the Aleutian arc shown by Holbrook et al. [1999] may have developed from andesitic primary magma instead Commonalities and Differences in the Rifted Crust [53] As described in section 5, the main survey line crosses the rifted region at the HVLC, the OT, NT, and the ABT. These structures are characterized by the high Vp of the lower crust at over km/s (Figure 10). The Vp volume functions clearly show that the Vp peaks in the rifted regions are 7.1 or 7.3 km/s, which is significantly higher than for the SB (Figure 12b). The function for the SB region has a peak at a Vp of 6.7 km/s and no peaks at Vp of km/s (Figure 12b). [54] The HVLC can effectively be seen beneath the continental margins. Although the continental margins are divided into two types, volcanic continental margins and nonvolcanic margins [e.g., White et al., 2003], there exist two corresponding scenarios producing the HVLC. One candidate is the dense crustal materials confirmed to exist beneath the volcanic continental margin [Holbrook et al., 1994]. The other candidate is serpentinized peridotites not crustal materials, which have been confirmed beneath part of the nonvolcanic continental margin [Dean et al., 2000]. The former is characterized by flood basalts on the seafloor and a large volume of the HVLC. The latter is characterized by detachment faults cutting through the entire crust and a small volume of the HVLC. However, the reflection profiles around three rifted regions have neither seaward dipping reflectors from the flood basalts nor large detachment faults (Figure 13). We consider the former as the cause for the HVLC because of the following discussion. The volume of the dense crustal materials can be small in an environment with mantle temperatures of less than 1350 C [Parkin and White, 2008] and unaccompanied by seaward dipping reflectors. The latter case often accompanies weak Moho reflections, according to Dean et al. [2000] and Chian et al. Figure 13. Time migrated section of the MCS profile. Solid triangles show locations of intrusive bodies. (a) Entire section around the ABT region. (b) Close-up of the western region of the Koka Seamount. (c) Close-up of the eastern region of Koka Seamount. The two boxes in Figure 13a indicate regions shown in Figures 13b and 13c. 24 of 28

25 Figure of 28
Subduction zones 3 arc magmatism
 5. 3 Subduction zones 3 arc magmatism Where can we observe magmatic/volcanic activities along subduction zones? Characteristics of arc magmatism (vs. mid-ocean ridge/intraplate magmatism) Structure of
Multi-channel seismic reflection experiments in Izu-Ogasawara arc cruises-
 JAMSTEC Report of Research and Development, Volume 4, November 2006, 1 12 Multi-channel seismic reflection experiments in Izu-Ogasawara arc -2005 cruises- K. Takizawa 1, T. Tsuru 2, Y. Kaiho 1, M. Yamashita
Wide-angle refraction experiments in the Daito Ridges region at the northwestern end of the Philippine Sea plate
 Nishizawa et al. Earth, Planets and Space 2014, 66:25 FULL PAPER Open Access Wide-angle refraction experiments in the Daito Ridges region at the northwestern end of the Philippine Sea plate Azusa Nishizawa
Data Repository Item
 Data Repository Item 2009003 An abrupt transition from magma-starved to magma-rich rifting in the eastern Black Sea Donna J. Shillington, Caroline L. Scott, Timothy A. Minshull, Rosemary A. Edwards, Peter
Plate Tectonics: The New Paradigm
 Earth s major plates Plate Tectonics: The New Paradigm Associated with Earth's strong, rigid outer layer: Known as the lithosphere Consists of uppermost mantle and overlying crust Overlies a weaker region
A) B) C) D) 4. Which diagram below best represents the pattern of magnetic orientation in the seafloor on the west (left) side of the ocean ridge?
 B) C) D) 4. Which diagram below best represents the pattern of magnetic orientation in the seafloor on the west (left) side of the ocean ridge?") 1. Crustal formation, which may cause the widening of an ocean, is most likely occurring at the boundary between the A) African Plate and the Eurasian Plate B) Pacific Plate and the Philippine Plate C)
1. Crustal formation, which may cause the widening of an ocean, is most likely occurring at the boundary between the A) African Plate and the Eurasian Plate B) Pacific Plate and the Philippine Plate C)
Marine Science and Oceanography
 Marine Science and Oceanography Marine geology- study of the ocean floor Physical oceanography- study of waves, currents, and tides Marine biology study of nature and distribution of marine organisms Chemical
Plate Tectonics. entirely rock both and rock
 Plate Tectonics I. Tectonics A. Tectonic Forces are forces generated from within Earth causing rock to become. B. 1. The study of the origin and arrangement of Earth surface including mountain belts, continents,
Plate Tectonics. Structure of the Earth
 Plate Tectonics Structure of the Earth The Earth can be considered as being made up of a series of concentric spheres, each made up of materials that differ in terms of composition and mechanical properties.
Structural factors controlling the rupture process of a megathrust earthquake at the Nankai trough seismogenic zone
 Geophys. J. Int. (2002) 149, 815 835 Structural factors controlling the rupture process of a megathrust earthquake at the Nankai trough seismogenic zone S. Kodaira, 1 E. Kurashimo, 2 J.-O. Park, 1 N. Takahashi,
PLATE TECTONICS. Continental Drift. Continental Drift. Continental Drift. Continental Drift- Wegener s Evidence
 Continental Drift PLATE TECTONICS E.B. Taylor (1910) and Alfred Wegener (1915) published on Continental Drift. Continental Drift Wegener s evidence 1. Fit of the Continents 2. Fossil Evidence 3. Rock Type
The continental lithosphere
 Simplicity to complexity: The continental lithosphere Reading: Fowler p350-377 Sampling techniques Seismic refraction Bulk crustal properties, thickness velocity profiles Seismic reflection To image specific
R/V Kairei Cruise Report KR Seismic study in the northwestern Pacific region. Jan. 4, 2011 Jan. 20, 2011
 R/V Kairei Cruise Report KR11-01 Seismic study in the northwestern Pacific region Jan. 4, 2011 Jan. 20, 2011 Japan Agency for Marine-Earth Science and Technology (JAMSTEC) Contents: 1.Cruise Information:
The influence of short wavelength variations in viscosity on subduction dynamics
 1 Introduction Deformation within the earth, driven by mantle convection due primarily to cooling and subduction of oceanic lithosphere, is expressed at every length scale in various geophysical observations.
Dynamic Crust Practice
 1. Base your answer to the following question on the cross section below and on your knowledge of Earth science. The cross section represents the distance and age of ocean-floor bedrock found on both sides
ANOTHER MEXICAN EARTHQUAKE! Magnitude 7.1, Tuesday Sept. 19, 2017
 ANOTHER MEXICAN EARTHQUAKE! Magnitude 7.1, Tuesday Sept. 19, 2017 Why is there no oceanic crust older than 200 million years? SUBDUCTION If new oceanic crust is being continuously created along the earth
Earth s Continents and Seafloors. GEOL100 Physical Geology Ray Rector - Instructor
 Earth s Continents and Seafloors GEOL100 Physical Geology Ray Rector - Instructor OCEAN BASINS and CONTINENTAL PLATFORMS Key Concepts I. Earth s rocky surface covered by of two types of crust Dense, thin,
USU 1360 TECTONICS / PROCESSES
 USU 1360 TECTONICS / PROCESSES Observe the world map and each enlargement Pacific Northwest Tibet South America Japan 03.00.a1 South Atlantic Arabian Peninsula Observe features near the Pacific Northwest
An Introduction of Aleutian Subduction Zone. Chuanmao Yang, Hong Yang, Meng Zhang, Wenzhong Wang 2016/04/29
 An Introduction of Aleutian Subduction Zone Chuanmao Yang, Hong Yang, Meng Zhang, Wenzhong Wang 2016/04/29 Outline General Introduction Formation history Structure from seismic study geochemical features
6. In the diagram below, letters A and B represent locations near the edge of a continent.
 1. Base your answer to the following question on the cross section below and on your knowledge of Earth science. The cross section represents the distance and age of ocean-floor bedrock found on both sides
UNIT 3 GEOLOGY VOCABULARY FLASHCARDS THESE KEY VOCABULARY WORDS AND PHRASES APPEAR ON THE UNIT 3 CBA
 UNIT 3 GEOLOGY VOCABULARY FLASHCARDS THESE KEY VOCABULARY WORDS AND PHRASES APPEAR ON THE UNIT 3 CBA A map that shows Earth s Topographic Map surface topography, which is Earth s shape and features Contour
Geography of the world s oceans and major current systems. Lecture 2
 Geography of the world s oceans and major current systems Lecture 2 WHY is the GEOMORPHOLOGY OF THE OCEAN FLOOR important? (in the context of Oceanography) WHY is the GEOMORPHOLOGY OF THE OCEAN FLOOR important?
Plate Tectonics: A Scientific Revolution Unfolds
 Chapter 2 Lecture Earth: An Introduction to Physical Geology Eleventh Edition Plate Tectonics: A Scientific Revolution Unfolds Tarbuck and Lutgens From Continental Drift to Plate Tectonics Prior to the
Drilling into the Memory of the Earth An Introduction to International Ocean Discovery Program
 Drilling into the Memory of the Earth An Introduction to International Ocean Discovery Program Y. Tatsumi (Dept. Earth & Planetary Sciences) Why is this planet to be the Earth? This is a fundamental question
We A10 12 Common Reflection Angle Migration Revealing the Complex Deformation Structure beneath Forearc Basin in the Nankai Trough
 We A10 12 Common Reflection Angle Migration Revealing the Complex Deformation Structure beneath Forearc Basin in the Nankai Trough K. Shiraishi* (JAMSTEC), M. Robb (Emerson Paradigm), K. Hosgood (Emerson
Chapter 2 Plate Tectonics and the Ocean Floor
 Chapter 2 Plate Tectonics and the Ocean Floor Matching. Match the term or person with the appropriate phrase. You may use each answer once, more than once or not at all. 1. hydrothermal vents A. convergent
Full file at
 Essentials of Oceanography, 10e (Trujillo/Keller) Chapter 2 Plate Tectonics and the Ocean Floor Match the term with the appropriate phrase. You may use each answer once, more than once or not at all. A)
The Sea Floor. Chapter 2
 The Sea Floor Chapter 2 Geography of the Ocean Basins World ocean is the predominant feature on the Earth in total area Northern Hemisphere = 61% of the total area is ocean. Southern Hemisphere = about
The Lithosphere and the Tectonic System. The Structure of the Earth. Temperature 3000º ºC. Mantle
 The Lithosphere and the Tectonic System Objectives: Understand the structure of the planet Earth Review the geologic timescale as a point of reference for the history of the Earth Examine the major relief
Continental Margin Geology of Korea : Review and constraints on the opening of the East Sea (Japan Sea)
") Continental Margin Geology of Korea : Review and constraints on the opening of the East Sea (Japan Sea) Han-Joon Kim Marine Satellite & Observation Tech. Korea Ocean Research and Development Institute
Continental Margin Geology of Korea : Review and constraints on the opening of the East Sea (Japan Sea) Han-Joon Kim Marine Satellite & Observation Tech. Korea Ocean Research and Development Institute
1.4 Notes: Plates Converge or Scrape Past Each Other Think About Tectonic Plates Push Together at Convergent Boundaries
 1.4 Notes: Plates Converge or Scrape Past Each Other Think About If new crust is created at divergent boundaries, why does the total amount of crust on Earth stay the same? Tectonic Plates Push Together
Practice Questions: Plate Tectonics
 Practice Questions: Plate Tectonics 1. Base your answer to the following question on The block diagram below shows the boundary between two tectonic plates. Which type of plate boundary is shown? A) divergent
Multi-channel seismic reflection survey in the northern Izu-Ogasawara island arc KR07-09 cruise
 JAMSTEC Report of Research and Development, Volume 7, March 2008, 31 41 Multi-channel seismic reflection survey in the northern Izu-Ogasawara island arc KR07-09 cruise Tetsuo No 1, Kaoru Takizawa 1, Narumi
Plate Tectonics Tutoiral. Questions. Teacher: Mrs. Zimmerman. Plate Tectonics and Mountains Practice Test
 Teacher: Mrs. Zimmerman Print Close Plate Tectonics and Mountains Practice Test Plate Tectonics Tutoiral URL: http://www.hartrao.ac.za/geodesy/tectonics.html Questions 1. Fossils of organisms that lived
Velocity-Interface Structure of the Southwestern Ryukyu Subduction Zone from EW OBS/MCS Data
 Marine Geophysical Researches 22: 265-287, 2001. 2002 Kluwer Academic Publishers. Printed in the Netherlands. Velocity-Interface Structure of the Southwestern Ryukyu Subduction Zone from EW9509-1 OBS/MCS
Full file at
 Chapter 2 PLATE TECTONICS AND PHYSICAL HAZARDS MULTIPLE-CHOICE QUESTIONS 1. What direction is the Pacific Plate currently moving, based on the chain of Hawaiian Islands with only the easternmost island
Plate Tectonics Lab II: Background Information
 Plate Tectonics Lab II: Background Information This lab is based on a UW ESS101 Lab. Note: Hand in only the Answer Sheet at the back of this guide to your Instructor Introduction One of the more fundamental
Continental Drift and Plate Tectonics
 Continental Drift and Plate Tectonics Continental Drift Wegener s continental drift hypothesis stated that the continents had once been joined to form a single supercontinent. Wegener proposed that the
Plates & Boundaries The earth's continents are constantly moving due to the motions of the tectonic plates.
 Plates & Boundaries The earth's continents are constantly moving due to the motions of the tectonic plates. As you can see, some of the plates contain continents and others are mostly under the ocean.
3. PLATE TECTONICS LAST NAME (ALL IN CAPS): FIRST NAME: PLATES
: FIRST NAME: PLATES") LAST NAME (ALL IN CAPS): FIRST NAME: PLATES 3. PLATE TECTONICS The outer layers of the Earth are divided into the lithosphere and asthenosphere. The division is based on differences in mechanical properties
LAST NAME (ALL IN CAPS): FIRST NAME: PLATES 3. PLATE TECTONICS The outer layers of the Earth are divided into the lithosphere and asthenosphere. The division is based on differences in mechanical properties
Why Does Oceanic Crust Sink Beneath Continental Crust At Convergent Boundaries
 Why Does Oceanic Crust Sink Beneath Continental Crust At Convergent Boundaries What is the process by which oceanic crust sinks beneath a deep-ocean Why does oceanic crust sink beneath continental crust
Introduction To Plate Tectonics Evolution. (Continents, Ocean Basins, Mountains and Continental Margins)
") Introduction To Plate Tectonics Evolution (Continents, Ocean Basins, Mountains and Continental Margins) Geo 386 (Arabian Shield Course) Dr. Bassam A. A. Abuamarah Mohanna G E O 3 8 6 A R A B I A N G E
Introduction To Plate Tectonics Evolution (Continents, Ocean Basins, Mountains and Continental Margins) Geo 386 (Arabian Shield Course) Dr. Bassam A. A. Abuamarah Mohanna G E O 3 8 6 A R A B I A N G E
OCN 201 Physiography of the Seafloor
 OCN 201 Physiography of the Seafloor Hypsometric Curve for Earth s solid surface Note histogram Hypsometric curve of Earth shows two modes. Hypsometric curve of Venus shows only one! Why? Ocean Depth vs.
OCN 201 Seafloor Spreading and Plate Tectonics. Question
 OCN 201 Seafloor Spreading and Plate Tectonics Question What was wrong from Wegener s theory of continental drift? A. The continents were once all connected in a single supercontinent B. The continents
Seismic structure of western end of the Nankai trough seismogenic zone
 JOURNAL OF GEOPHYSICAL RESEARCH, VOL. 107, NO. B10, 2212, doi:10.1029/2000jb000121, 2002 Seismic structure of western end of the Nankai trough seismogenic zone Narumi Takahashi, Shuichi Kodaira, Ayako
29. IMPLICATIONS OF DEEP SEA DRILLING, SITES 186 AND 187 ON ISLAND ARC STRUCTURE
 29. IMPLICATIONS OF DEEP SEA DRILLING, SITES 186 AND 187 ON ISLAND ARC STRUCTURE John A. Grow 1, Marine Physical Laboratory, Scripps Institution of Oceanography, La Jolla, California INTRODUCTION Pacific
The Ocean Floor Earth Science, 13e Chapter 13
 The Ocean Floor Earth Science, 13e Chapter 13 Stanley C. Hatfield Southwestern Illinois College The vast world ocean Earth is often referred to as the blue planet Seventy-one percent of Earth s surface
UNIT 6 PLATE TECTONICS
 UNIT 6 PLATE TECTONICS CONTINENTAL DRIFT Alfred Wegner proposed the theory that the crustal plates are moving over the mantle. He argued that today s continents once formed a single landmass, called Pangaea
Plate Tectonics. Essentials of Geology, 11 th edition Chapter 15
 1 Plate Tectonics Essentials of Geology, 11 th edition Chapter 15 2 3 4 5 6 7 8 9 10 11 12 13 14 15 Plate Tectonics: summary in haiku form Alfred Wegener gave us Continental Drift. Fifty years later...
60% water. Big Bang: 14,000 millions years ago The Earth originated about 4,500 millions years ago its orbit allows water to exist in a liquid state!
 Ch2. The Sea Floor #1 Why geology of the oceans? Marine habitats are directly shaped by geological processes The form of the coastlines The depth of the water Type of bottom (muddy, sandy, rocky) #2 Geological
L.O: THE CRUST USE REFERENCE TABLE PAGE 10
 USE REFERENCE TABLE PAGE 10 1. The oceanic crust is thought to be composed mainly of A) granite B) sandstone C) basalt D) rhyolite 2. To get sample material from the mantle, drilling will be done through
Before Plate Tectonics: Theory of Continental Drift
 Before Plate Tectonics: Theory of Continental Drift Predecessor to modern plate tectonics Shape and fit of the continents was the initial evidence Snider-Pelligrini (1858) Taylor (1908) Wegner (1915) Fig.
A seismic refraction study of the Cocos plate offshore Nicaragua and Costa Rica Harm Van Avendonk (UTIG, UT Austin)
") A seismic refraction study of the Cocos plate offshore Nicaragua and Costa Rica Harm Van Avendonk (UTIG, UT Austin)! October 18, 2012 "#$%&'($)*!+,!-&./(!01!2/(+! Plate tectonics:!!large fluxes of solids
A seismic refraction study of the Cocos plate offshore Nicaragua and Costa Rica Harm Van Avendonk (UTIG, UT Austin)! October 18, 2012 "#$%&'($)*!+,!-&./(!01!2/(+! Plate tectonics:!!large fluxes of solids
Seismic Anisotropy and Mantle Flow in the Izu-Bonin-Mariana Subduction System
 Seismic Anisotropy and Mantle Flow in the Izu-Bonin-Mariana Subduction System Matthew J. Fouch (Department of Geological Sciences, Arizona State University, Tempe, AZ 85287, email: fouch@asu.edu) INTRODUCTION
Yanbu University College. General Studies Department. PHSC001 Course. Chapter9 (Basic Geology: Earthquakes and volcanoes ) Worksheet Solutions
 Worksheet Solutions") Yanbu University College General Studies Department PHSC001 Course Chapter9 (Basic Geology: Earthquakes and volcanoes ) Worksheet Solutions Phsc001 worksheet9 solutions, yuc Page 1-6 Chapter 9 worksheet
Yanbu University College General Studies Department PHSC001 Course Chapter9 (Basic Geology: Earthquakes and volcanoes ) Worksheet Solutions Phsc001 worksheet9 solutions, yuc Page 1-6 Chapter 9 worksheet
Late 20 th Century Tests of the Continental Drift Hypothesis
 Late 20 th Century Tests of the Continental Drift Hypothesis 5 Characteristics of the Ocean Trenches Unless otherwise noted the artwork and photographs in this slide show are original and by Burt Carter.
Plate Tectonics. A. Continental Drift Theory 1. Early development 2. Alfred Wegener s mechanism
 Plate Tectonics A. Continental Drift Theory 1. Early development 2. Alfred Wegener s mechanism B. Seafloor Spreading 1. Earthquakes and volcanoes 2. Seafloor maps and dates 3. Continental drift revisited
Moho (Mohorovicic discontinuity) - boundary between crust and mantle
 - boundary between crust and mantle") Earth Layers Dynamic Crust Unit Notes Continental crust is thicker than oceanic crust Continental Crust Thicker Less Dense Made of Granite Oceanic Crust Thinner More Dense Made of Basalt Moho (Mohorovicic
Earth Layers Dynamic Crust Unit Notes Continental crust is thicker than oceanic crust Continental Crust Thicker Less Dense Made of Granite Oceanic Crust Thinner More Dense Made of Basalt Moho (Mohorovicic
Chapter Two. Figure 02_02. Geography of the Ocean Basins. The Sea Floor
 Chapter Two The Sea Floor Geography of the Ocean Basins Figure 02_02 The world ocean is the predominant feature on the Earth in total area. In the Northern Hemisphere, 61% of the total area is ocean. In
Geologic Evolution of Latin America. Plate Tectonics: General Concepts & Applications to Latin America
 Geologic Evolution of Latin America Plate Tectonics: General Concepts & Applications to Latin America Structure of Earth: 3 major divisions of Core, Mantle, and Crust Upper mantle differs in the way that
ARC CRUST AND MANTLE EVOLUTION: THE ORIGIN OF ALONG- AND ACROSS-ARC VARIATIONS
 ARC CRUST AND MANTLE EVOLUTION: THE ORIGIN OF ALONG- AND ACROSS-ARC VARIATIONS Yoshihiko Tamura 1, Jun-Ichi Kimura 1 1 IFREE, JAMSTEC, Yokosuka 237-0061, Japan Abstract Along- and Across-Arc (AAA) variations
Tomography of the 2011 Iwaki earthquake (M 7.0) and Fukushima
 and Fukushima") 1 2 3 Auxiliary materials for Tomography of the 2011 Iwaki earthquake (M 7.0) and Fukushima nuclear power plant area 4 5 6 7 8 9 Ping Tong 1,2, Dapeng Zhao 1 and Dinghui Yang 2 [1] {Department of Geophysics,
1 2 3 Auxiliary materials for Tomography of the 2011 Iwaki earthquake (M 7.0) and Fukushima nuclear power plant area 4 5 6 7 8 9 Ping Tong 1,2, Dapeng Zhao 1 and Dinghui Yang 2 [1] {Department of Geophysics,
Prentice Hall EARTH SCIENCE
 Prentice Hall EARTH SCIENCE Tarbuck Lutgens Chapter 9 Plate Tectonics 9.1 Continental Drift An Idea Before Its Time Wegener s continental drift hypothesis stated that the continents had once been joined
Prentice Hall EARTH SCIENCE
 Prentice Hall EARTH SCIENCE Tarbuck Lutgens Chapter 9 Plate Tectonics 9.1 Continental Drift An Idea Before Its Time Wegener s continental drift hypothesis stated that the continents had once been joined
Theory of Plate Tectonics
 Plate Tectonics Theory of Plate Tectonics Lithosphere is made of sections called plates that move around called continental drift Plates move because they float on the asthenosphere Most plates consist
Earth. Temp. increases with depth, the thermal gradient is 25 o C/km. Pressure and density also increase with depth.
 Plate Tectonics Earth Earth overall average density = 5.5 g/cm 3. Temp. increases with depth, the thermal gradient is 25 o C/km. Pressure and density also increase with depth. Spheroid: with a longer major
CONTENT. A. Changes in the Crust Facts Changes Construction and Destruction. B. Continental Drift What is it? Evidence
 Name Earth Science Date Period TOPIC THE DYNAMIC EARTH CONTENT A. Changes in the Crust Facts Changes Construction and Destruction B. Continental Drift What is it? Evidence C. Theory of Plate Tectonics
Convergent plate boundaries. Objective to be able to explain the formation and key features of these zones.
 Convergent plate boundaries Objective to be able to explain the formation and key features of these zones. Destructive plate margins When plates collide due to convection currents/slab pull in the asthenosphere
Topic 12: Dynamic Earth Pracatice
 Name: Topic 12: Dynamic Earth Pracatice 1. Earth s outer core is best inferred to be A) liquid, with an average density of approximately 4 g/cm 3 B) liquid, with an average density of approximately 11
Plate Tectonics Unit II: Plate Boundaries (3.5 pts)
") T. James Noyes, El Camino College Plate Tectonics Unit II: The Plate Boundaries (Topic 11A-2) page 1 Name: Section: Plate Tectonics Unit II: Plate Boundaries (3.5 pts) Plate Boundaries We will now discuss
T. James Noyes, El Camino College Plate Tectonics Unit II: The Plate Boundaries (Topic 11A-2) page 1 Name: Section: Plate Tectonics Unit II: Plate Boundaries (3.5 pts) Plate Boundaries We will now discuss
PHYSICAL GEOLOGY AND THE ENVIRONMENT (2 ND CANADIAN EDITION)
") Chapter 2: Plate Tectonics Chapter Summary: Plate tectonics is a theory that suggests Earth's surface is divided into several large plates that change position and size. Intense geologic activity occurs
Chapter 2: Plate Tectonics Chapter Summary: Plate tectonics is a theory that suggests Earth's surface is divided into several large plates that change position and size. Intense geologic activity occurs
Japan Agency for Marine-Earth Science and Technology (JAMSTEC), 2-15 Natsushima-cho, Yokosuka JAPAN
, 2-15 Natsushima-cho, Yokosuka JAPAN") Dense Ocean floor Network System for Mega Thrust Earthquakes & Tsunamis(DONET) -Towards Understanding Mega Thrust Earthquakes, the Geohazard & Disaster Mitigation- Yoshiyuki KANEDA, Katsuyoshi KAWAGUCHI,
Dense Ocean floor Network System for Mega Thrust Earthquakes & Tsunamis(DONET) -Towards Understanding Mega Thrust Earthquakes, the Geohazard & Disaster Mitigation- Yoshiyuki KANEDA, Katsuyoshi KAWAGUCHI,
Whole Earth Structure and Plate Tectonics
 Whole Earth Structure and Plate Tectonics Processes in Structural Geology & Tectonics Ben van der Pluijm WW Norton+Authors, unless noted otherwise 4/5/2017 14:45 We Discuss Whole Earth Structure and Plate
Lab 1: Plate Tectonics April 2, 2009
 Name: Lab 1: Plate Tectonics April 2, 2009 Objective: Students will be introduced to the theory of plate tectonics and different styles of plate margins and interactions. Introduction The planet can be
Review participation point: The evidence for a fluid outer core is:
 DDA1 Continental Drift to Plate Tectonics PS 100 Chapter 28 Review participation point: The evidence for a fluid outer core is: A. Average density of the earth is greater than the density of the crust.
Senior Thesis THE WEST PACIFIC MARGIN. Thomas R. Gray. Submitted as partial fulfillment of. the requirements for the degree of
 Senior Thesis BACKARC RIFTING AND THE FORMATION OF BACKARC BASINS ALONG THE WEST PACIFIC MARGIN by Thomas R. Gray 1995 Submitted as partial fulfillment of the requirements for the degree of Bachelor of
The Structure of the Earth and Plate Tectonics
 The Structure of the Earth and Plate Tectonics Agree or Disagree? 1. The Earth if made up of 4 different layers. 2. The crust (where we live) can be made of either less dense continental crust or the more
OCN 201 Physiography of the Seafloor
 OCN 201 Physiography of the Seafloor 1 Ocean Depth versus Continental Height Why do we have dry land? Solid surface of Earth is dominated by two levels: Land with a mean elevation of +840 m (29% of Earth
Directed Reading. Section: Volcanoes and Plate Tectonics
 Skills Worksheet Directed Reading Section: Volcanoes and Plate Tectonics 1. What can cause some of the most dramatic changes to Earth s surface? a. solar activity b. tides c. geysers d. volcanic eruptions
12. The diagram below shows the collision of an oceanic plate and a continental plate.
 Review 1. Base your answer to the following question on the cross section below, which shows the boundary between two lithospheric plates. Point X is a location in the continental lithosphere. The depth
The Dynamic Crust 2) 4) Which diagram represents the most probable result of these forces? 1)
 4) Which diagram represents the most probable result of these forces? 1)") 1. The diagrams below show cross sections of exposed bedrock. Which cross section shows the least evidence of crustal movement? 1) 3) 4. The diagram below represents a section of the Earth's bedrock. The
1. The diagrams below show cross sections of exposed bedrock. Which cross section shows the least evidence of crustal movement? 1) 3) 4. The diagram below represents a section of the Earth's bedrock. The
Earthquakes. Earthquakes are caused by a sudden release of energy
 Earthquakes Earthquakes are caused by a sudden release of energy The amount of energy released determines the magnitude of the earthquake Seismic waves carry the energy away from its origin Fig. 18.1 Origin
Earth and Space Science Semester 2 Exam Review. Part 1. - Convection currents circulate in the Asthenosphere located in the Upper Mantle.
 Earth and Space Science 2015 Semester 2 Exam Review Part 1 Convection -A form of heat transfer. - Convection currents circulate in the Asthenosphere located in the Upper Mantle. - Source of heat is from
Plate Tectonics: A Unifying Theory
 Plate Tectonics: A Unifying Theory What is Plate Tectonics? - 7 large tectonic plates and many smaller ones that break up the lithosphere - Plates are brittle and float on asthenosphere and glide past
Topic 5: The Dynamic Crust (workbook p ) Evidence that Earth s crust has shifted and changed in both the past and the present is shown by:
 Evidence that Earth s crust has shifted and changed in both the past and the present is shown by:") Topic 5: The Dynamic Crust (workbook p. 65-85) Evidence that Earth s crust has shifted and changed in both the past and the present is shown by: --sedimentary horizontal rock layers (strata) are found
Topic 5: The Dynamic Crust (workbook p. 65-85) Evidence that Earth s crust has shifted and changed in both the past and the present is shown by: --sedimentary horizontal rock layers (strata) are found
Deep Seismic Profiling in the Tokyo Metropolitan Area for Strong Ground Motion Prediction
 Deep Seismic Profiling in the Tokyo Metropolitan Area for Strong Ground Motion Prediction Hiroshi Sato 1, Naoshi Hirata 1, Takaya Iwasaki 1, Kazuki Koketsu 1, Tanio Ito 2, Keiji Kasahara 3, Kiyoshi Ito
Oceanography, An Invitation to Marine Science 9e Tom Garrison. Ocean Basins Cengage Learning. All Rights Reserved.
 Oceanography, An Invitation to Marine Science 9e Tom Garrison 4 Ocean Basins Key Concepts Tectonic forces shape the seabed The ocean floor is divided into continental margins and deep ocean basins The
Questions and Topics
 Plate Tectonics and Continental Drift Questions and Topics 1. What are the theories of Plate Tectonics and Continental Drift? 2. What is the evidence that Continents move? 3. What are the forces that
Crustal structure across the coseismic rupture zone of the 1944 Tonankai earthquake, the central Nankai Trough seismogenic zone
 JOURNAL OF GEOPHYSICAL RESEARCH, VOL. 17, NO. B1, 7, 129/1JB424, 2 Crustal structure across the coseismic rupture zone of the 1944 Tonankai earthquake, the central Nankai Trough seismogenic zone Ayako
Topic 12 Review Book Earth s Dynamic Crust and Interior
 Topic 12 Review Book Earth s Dynamic Crust and Interior Define the Vocabulary 1. asthenosphere 2. continental crust 3. Convection current 4. Convergent plate boundary 5. Divergent plate boundary 6. earthquake
Magnetic and Bathymetric Survey of the Suiyo Cross-Chain, Izu-Bonin Arc
 JAMSTEC Report of Research and Development, Volume 6, November 2007, 31 38 Magnetic and Bathymetric Survey of the Suiyo Cross-Chain, Izu-Bonin Arc Toshiya Fujiwara 1, Osamu Ishizuka 2, Yoshihiko Tamura
Laboratory #7: Plate Tectonics
 Materials Needed: 1. Pencil 2. Colored Pencils 3. Metric/Standard Ruler 4. Calculator 5. Tracing Paper Laboratory #7: Plate Tectonics Plate Tectonics The Earth is composed of layers. At the center is a
Plate Tectonics on a Plane. Observations related to plate tectonics " " Plate tectonic theory types of plate boundaries!
 Plate Tectonics on a Plane Scripps Inst. Of Oceanography" Observations related to plate tectonics " Ocean and continent topography, hypsometry, and crustal thickness. Global seismicity, Benioff zones,
Plate Tectonics. By Destiny, Jarrek, Kaidence, and Autumn
 Plate Tectonics By Destiny, Jarrek, Kaidence, and Autumn .The Denali Fault and San Andreas Fault - The San Andreas Fault is a continental transform fault that extends roughly 1300 km (810 miles) through
Civilization exists by geologic consent, subject to change without notice William Durant
 89.325 Geology for Engineers Plate Tectonics Civilization exists by geologic consent, subject to change without notice William Durant Properties of the Planets Size Density Distance from sun Chemistry
Beneath our Feet: The 4 Layers of the Earty by Kelly Hashway
 Beneath our Feet: The 4 Layers of the Earty by Kelly Hashway The Earth is more than a giant ball made up of dirt, rocks, and minerals. The Earth may look like a giant ball from when looking at it from
R/V Kairei Cruise Report KR Seismic study in Nansei-Shoto Region. November 17, 2013 December 14, 2013
 R/V Kairei Cruise Report KR13-18 Seismic study in Nansei-Shoto Region November 17, 2013 December 14, 2013 Japan Agency for Marine-Earth Science and Technology (JAMSTEC) Contents: 1.Cruise Information:
Earth s s Topographic Regions
 Earth s s Topographic Regions Continental Shields GEOLOGY OF THE USA Atlantic Ocean Crustal Ages Clues to Earth s s Surface Mountains only in certain areas Rock types differ regionally Shields in interior
Dynamic Earth A B1. Which type of plate boundary is located at the Jordan Fault? (1) divergent (3) convergent (2) subduction (4) transform
 divergent (3) convergent (2) subduction (4) transform") Dynamic Earth A B1 1. The edges of most lithospheric plates are characterized by (1) reversed magnetic orientation (2) unusually rapid radioactive decay (3) frequent volcanic activity (4) low P-wave and
Dynamic Earth A B1 1. The edges of most lithospheric plates are characterized by (1) reversed magnetic orientation (2) unusually rapid radioactive decay (3) frequent volcanic activity (4) low P-wave and
Captain s Tryouts 2017
 Captain s Tryouts 2017 Dynamic Planet Test Written by: Araneesh Pratap (Chattahoochee High School) Name: Date: Answer all questions on the answer sheet. Point values are given next to each question or