Open-File Report U.S. Department of the Interior U.S. Geological Survey
|
|
|
- Chad Lloyd
- 5 years ago
- Views:
Transcription

1 Sediment Transport During Three Controlled-Flood Experiments on the Colorado River Downstream from Glen Canyon Dam, with Implications for Eddy- Sandbar Deposition in Grand Canyon National Park Open-File Report U.S. Department of the Interior U.S. Geological Survey
2 Cover: Nick Voichick (left), Greg Shellenbarger (center), and Steve Jones (right) in the sampling boat at the river-mile 61 study site on March 7, 28, during high, steady discharge during the 28 controlled-flood experiment (USGS photo by David J. Topping).
3 Sediment Transport During Three Controlled-Flood Experiments on the Colorado River Downstream from Glen Canyon Dam, with Implications for Eddy- Sandbar Deposition in Grand Canyon National Park By David J. Topping, David M. Rubin, Paul E. Grams, Ronald E. Griffiths, Thomas A. Sabol, Nicholas Voichick, Robert B. Tusso, Karen M. Vanaman, and Richard R. McDonald Open-File Report U.S. Department of the Interior U.S. Geological Survey
4 U.S. Department of the Interior KEN SALAZAR, Secretary U.S. Geological Survey Marcia K. McNutt, Director U.S. Geological Survey, Reston, Virginia 21 For product and ordering information: World Wide Web: Telephone: ASK-USGS For more information on the USGS the Federal source for science about the Earth, its natural and living resources, natural hazards, and the environment: World Wide Web: Telephone: ASK-USGS Suggested citation: Topping, D.J., Rubin, D.M., Grams, P.E., Griffiths, R.E., Sabol, T.A., Voichick, N., Tusso, R.B., Vanaman, K.M., and McDonald, R.R., 21, Sediment transport during three controlled-flood experiments on the Colorado River downstream from Glen Canyon Dam, with implications for eddy-sandbar deposition in Grand Canyon National Park: U.S. Geological Survey Open-File Report , 111 p. Any use of trade, product, or firm names is for descriptive purposes only and does not imply endorsement by the U.S. Government. Although this report is in the public domain, permission must be secured from the individual copyright owners to reproduce any copyrighted material contained within this report. ii
5 Contents Notation...vii Abstract...1 Introduction...1 Purpose and Scope...5 Theoretical Background...5 Acknowledgments...11 Study Sites...11 Data...13 Removal of Bias in Data Collected by D-77-Bag-Type Samplers...26 Errors...27 Antecedent Conditions for Each Controlled-Flood Experiment (CFE)...28 Brief Description of Sand-Budgeting Approach...28 Sand Enrichment in Each Reach Before the 24 and 28 CFEs...32 Estimation of the Relative Levels of Sand Enrichment Antecedent to the 1996, 24, and 28 CFEs...34 Analysis...35 Data Collected at Each Study Site During Each CFE...35 Data Collected at Each Study Site During All CFEs...53 Data Collected During Each CFE at All Study Sites...65 Sediment Export Past the Study Sites During the 1996, 24, and 28 CFEs...7 Sand Budgeting During the 24 and 28 CFEs...7 Lagrangian Sampling-Program data...71 β Analysis...79 Values of β at Each Study Site During All CFEs...84 Estimation of Differences in Reach-Averaged Bed-Sand Area in the Reaches Upstream from Each Study Site During Each CFE and Between CFEs...86 Values of β at All Study Sites During Each CFE...89 β Analysis of Data Collected During the Lagrangian Sampling Programs, with Estimation of Relative Differences in Reach-Averaged Bed-Sand Area Between the 24 and 28 CFEs...92 Size, Known Levels of Sand Enrichment, and Mean Suspended-Sand Concentration in Each Reach During the 1996, 24, and 28 CFEs...97 Conclusions...11 References Cited...13 iii
6 Figures 1. Comparison of the flood hydrographs of the 1996, 24, and 28 CFEs at the USGS Colorado River at Lees Ferry, Arizona gaging station Pre-dam annual and partial-duration flood-frequency analysis for the Colorado River at Lees Ferry, Arizona gaging station Map showing locations of study sites and reaches between the study sites Hydrographs, suspended-sediment data, and bed-sand data collected at each study site during each CFE Hydrographs, suspended-sediment data, and bed-sand data collected at each study site during all three CFEs Bed-silt and clay data collected at each study site during all three CFEs Suspended-sand data collected during each CFE at all study sites Suspended-sediment data collected in the Lagrangian sampling programs during the 24 and 28 CFEs Comparison of suspended-sand concentration and grain-size data collected in the Lagrangian sampling programs during the 24 and 28 CFEs Influence of changes in reach-averaged bed-sand area on β Values of β at each study site during all CFEs β-based computation of reach-averaged bed-sand area in the reaches upstream from each study site during each CFE Results from β and β A analyses of reach-averaged bed-sand median grain size in the reaches upstream from each study site during all CFEs β-based computation of reach-averaged bed-sand area calculated using the suspended-sand data from the 24 and 28 Lagrangian sampling programs Results from β and β A analyses of reach-averaged bed-sand median grain size using the suspended-sand data from the 24 and 28 Lagrangian sampling programs Ratio of 28 CFE to 24 CFE sand conditions from lower Glen Canyon through eastern Grand Canyon computed using the suspended-sand data collected at sampling stations common to both the 24 and 28 Lagrangian sampling programs...96 iv
7 Tables 1. Inventory of suspended- and bed-sediment data collected during the three CFEs and analyzed in this report Sand supply and sand export during the accounting periods antecedent to the 24 and 28 CFEs Sand enrichment in each reach during the accounting periods antecedent to the 24 and 28 CFEs Comparison of discharge and sand supply during the years leading up to each CFE Observed coupled changes in suspended-sand concentration and median grain size through each reach during each CFE Sand export and silt and clay export past the study sites on the Colorado River during the 1996, 24, and 28 CFEs Sand budgets for each reach during the 24 and 28 CFE sand-budgeting periods CFE parameters at each study site normalized by their values during the 24 CFE and during the 1996 CFE Signs of relations between the 28 CFE parameters normalized by their values during the 24 CFE and normalized by their values during the 1996 CFE...1 v
8 Conversion Factors Inch/Pound to SI Multiply By To obtain Length foot (ft).348 meter (m) mile (mi) 1.69 kilometer (km) Volume ounce, fluid (fl. oz).2957 liter (L) pint (pt).4732 liter (L) quart (qt).9464 liter (L) gallon (gal) liter (L) Flow rate foot per second (ft/s).348 meter per second (m/s) cubic foot per second (ft 3 /s).2832 cubic meter per second (m 3 /s) Mass ounce, avoirdupois (oz) gram (g) SI to Inch/Pound Multiply By To obtain Length meter (m) foot (ft) kilometer (km).6214 mile (mi) Volume liter (L) ounce, fluid (fl. oz) liter (L) pint (pt) liter (L) 1.57 quart (qt) liter (L).2642 gallon (gal) Flow rate meter per second (m/s) foot per second (ft/s) cubic meter per second (m 3 /s) cubic foot per second (ft 3 /s) Mass gram (g).3527 ounce, avoirdupois (oz) Horizontal coordinate information is referenced to the North American Datum of 1983 (NAD 83). vi
9 Notation A b A b-ref C Fractional bed-sand area Reference fractional bed-sand area Suspended-sediment concentration C SAND Suspended-sand concentration C SILT &CLAY Suspended-silt-and-clay concentration C ref D 5 D b D b-ref D s D s-ref Reference concentration of the suspended sand Median grain size Median grain size of the bed sand Reference median grain size of the bed sand Median grain size of the suspended sand Reference median grain size of the suspended sand J Shear-velocity exponent in equation 1 K Bed grain-size exponent in equation 1 L Shear-velocity exponent in equation 6 M Bed grain-size exponent in equation 6 n TRANS n VERT Q u * β Number of transits taken by a depth-integrating suspended-sediment sampler at a vertical Number of verticals (that is, sampling stations) in a cross-section Discharge of water Shear velocity Non-dimensional measure of the reach-averaged bed-surface grain size that interacts with the suspended sand in the flow vii
10 β A δ φ ρ τ b τ sf Version of β corrected for differences in reach-averaged bed-sand area Factor that needs to be applied to correct C SAND for a change in the median grain size of suspended sand over time or space at constant reach-averaged boundary shear stress Unit of grain size equal to log 2 D where D is grain size in mm Density Boundary shear stress Skin-friction component of the boundary shear stress viii
11 Sediment Transport During Three Controlled-Flood Experiments on the Colorado River Downstream from Glen Canyon Dam, with Implications for Eddy- Sandbar Deposition in Grand Canyon National Park By David J. Topping, David M. Rubin, Paul E. Grams, Ronald E. Griffiths, Thomas A. Sabol, Nicholas Voichick, Robert B. Tusso, Karen M. Vanaman, and Richard R. McDonald Abstract Three large-scale field experiments were conducted on the Colorado River downstream from Glen Canyon Dam in 1996, 24, and 28 to evaluate whether artificial (that is, controlled) floods released from the dam could be used in conjunction with the sand supplied by downstream tributaries to rebuild and sustainably maintain eddy sandbars in the river in Grand Canyon National Park. Higher suspended-sand concentrations during a controlled flood will lead to greater eddysandbar deposition rates. During each controlled flood experiment, sediment-transport and bedsediment data were collected to evaluate sediment-supply effects on sandbar deposition. Data collection substantially increased in spatial and temporal density with each subsequent experiment. The suspended- and bed-sediment data collected during all three controlled-flood experiments are presented and analyzed in this report. Analysis of these data indicate that in designing the hydrograph of a controlled flood that is optimized for sandbar deposition in a given reach of the Colorado River, both the magnitude and the grain size of the sand supply must be considered. Because of the opposing physical effects of bed-sand area and bed-sand grain size in regulating suspended-sand concentration, larger amounts of coarser sand on the bed can lead to lower suspended-sand concentrations, and thus lower rates of sandbar deposition, during a controlled flood than can lesser amounts of finer sand on the bed. Although suspended-sand concentrations were higher at all study sites during the 28 controlled-flood experiment (CFE) than during either the 1996 or 24 CFEs, these higher concentrations were likely associated with more sand on the bed of the Colorado River in only lower Glen Canyon. More sand was likely present on the bed of the river in Grand Canyon during the 1996 CFE than during either the 24 or 28 CFEs. The question still remains as to whether sandbars can be sustained in the Colorado River in Grand Canyon National Park through use of controlled floods in conjunction with typical amounts and grain sizes of sand supplied by the tributaries that enter the Colorado River downstream from Glen Canyon Dam. Introduction The 1963 closure and subsequent operation of Glen Canyon Dam has resulted in substantial erosion of eddy-sandbar habitats in the Colorado River in Grand Canyon National Park (GCNP). 1
12 This has occurred as a result of (1) the dam cutting off approximately 94 percent of the natural sand supply at the upstream boundary of GCNP (Andrews, 1991; Topping and others, 2a; Rubin and others, 22; Wright and others, 25), (2) dam releases generally exceeding lower seasonal predam discharges where sand accumulation naturally occurred in the channel of the Colorado River in GCNP (Topping and others, 2a, 23; Rubin and others, 22; White and others, 25; Wright and others, 28), and (3) the loss of natural flood flows to redeposit this accumulated sand in eddy sandbars (Dolan and others, 1974; Howard and Dolan, 1981; Rubin and others, 199, 22; Schmidt and Graf, 199; Schmidt, 199, 1999; Schmidt and Rubin, 1995; Schmidt and others, 24). During the 12-year period from 1996 through 28, three large-scale field experiments have been conducted utilizing controlled floods released from Glen Canyon Dam to test whether it were possible to sustainably rebuild and maintain eddy sandbars and associated habitat in the Colorado River in GCNP using only the available tributary-supplied sand. These three controlled-flood experiments occurred in March-April 1996, November 24, and March 28. The 1996 and 24 experiments have been referred to in the scientific literature as "controlled floods" or "flood experiments" (Rubin and others, 1998; Webb and others, 1999; Hazel and others, 26; Topping and others, 2b, 26a), whereas the 28 experiment has been informally referred to as a "high flow." For consistency with the scientific literature and because the peak magnitudes of these artificial dam-released floods exceeded the natural pre-dam base flood magnitude of 18,5 ft 3 /s defined in Topping and others (23) based on flow-duration analyses, the term "controlled flood experiment" (CFE) is used herein to describe all three of these field experiments. The hydrograph of the 1996 CFE was different from the hydrographs of the 24 and 28 CFEs. The peak discharge of the 1996 CFE (45, ft 3 /s) was slightly higher than the peak discharges during the 24 and 28 CFEs (42, to 44, ft 3 /s depending on reach). This difference in peak discharge primarily arose because of maintenance on Glen Canyon Dam during the 24 and 28 CFEs and to a lesser degree because of lower reservoir levels during the 24 and 28 CFEs. Greater tributary water input, mostly from the Little Colorado River, during the 28 CFE helped to reduce the difference in peak discharge between the 1996 and 28 CFEs in downstream reaches. This allowed direct comparison between suspended-sediment data collected during the 1996 and 28 CFEs in downstream reaches (that is, below the mouth of the Little Colorado River) without needing to account for the influence of discharge differences on sediment transport. As released from Glen Canyon Dam, the duration of the high-, steady-discharge part of the flood hydrograph during the 1996 CFE was much longer (~7 days) than during the 24 and 28 CFEs (~6 hours). This difference in flood duration arose because, before the 1996 CFE, sand concentrations during the 1996 CFE were expected to be much lower than they actually were (E.D. Andrews, U.S. Geological Survey [USGS], oral commun., 1996). Before the 1996 CFE, the only available post-dam dataset of sediment-transport during floods consisted of data collected at various locations on the Colorado River in Grand Canyon during the 198s (Garrett and others, 1993), when suspended-sand concentrations were anomalously low following the large degree of bed-sand coarsening during large dam-released floods in (Topping and others, 2b, 25, 27a, 28). These anomalously low concentration data were the data used to design the duration of the 1996 CFE hydrograph (E.D. Andrews, USGS, oral commun., 1996). Finally, the rising limb of the flood hydrograph during the 1996 CFE was relatively short compared to the more gradual rising limbs of the flood hydrographs during the 24 and 28 CFEs, and the receding limb of the flood hydrograph of the 1996 CFE was longer than those of the 24 and 28 CFEs (fig. 1). 2
13 Q, IN CUBIC FEET PER SECOND 5, 4, 3, 2, 1, DAYS AFTER BEGINNING OF HIGH, STEADY DISCHARGE Figure 1. Comparison of the flood hydrographs of the 1996, 24, and 28 CFEs at the USGS gaging station on the Colorado River at Lees Ferry, Arizona (station number 938). These hydrographs were shifted in time such that zero time (indicated by vertical green line) is the beginning of high, steady discharge (Q) during each CFE. The Lees Ferry gaging station is located approximately 16 river miles downstream from Glen Canyon Dam (see fig. 3 below). Although terminology in the nonscientific arena has varied over time in describing these events, the 1996, 24, and 28 CFEs are technically floods based on the flow-duration and floodfrequency analyses for the pre-dam Colorado River in Topping and others (23). Flows of 42, to 45, ft 3 /s were only equaled or exceeded 1.1 to 11.2 percent of the time in the natural predam Colorado River at Lees Ferry, Arizona, near the upstream boundary of GCNP (computed from the data for fig. 22A in Topping and others, 23). Before construction and operation of Glen Canyon Dam, floods with peak discharges of 42, to 45, ft 3 /s had a recurrence interval of 1.1 to 1.2 years on the annual flood series and.9 years on the partial-duration flood series (fig. 2). Furthermore, the peak discharges of the 1996, 24, and 28 CFEs were substantially higher than the peak discharges of six 1 of the 42 annual snowmelt floods between 1921 and 1962, and only slightly lower in peak magnitude than two 2 more of these 42 floods. During the post-dam period of , the recurrence interval associated with floods with peak discharges of 42, to 45, ft 3 /s increased dramatically to about 3 years in the partial-duration series (fig. 37 in Topping and others, 23). This post-dam recurrence interval is somewhat misleading, however, because most of the post-dam floods in this discharge range occurred in April-June 1965 during the pulsed dam releases informally referred to as "channel-cleaning flows" by engineers (fig. 2C in Grams and others, 27). Given the different tributary sand supplies and dam releases antecedent to the 1996, 24, and 28 CFEs, these three experiments were probably conducted under very different sand-supply conditions, and these different sand-supply conditions likely controlled the resultant eddy-sandbar responses during these CFEs. Schmidt and others (1993) showed in flume experiments that the deposition rate in an eddy sandbar during a flood directly depends on suspended-sand concentration. However, as shown below, the relation between the antecedent upstream sand supply to a reach in a controlled flood and the concentration of suspended sand in a reach during a controlled flood is not straightforward, owing to the physics coupling bed-sand area and bed-sand 1 These six floods were the annual snowmelt floods with peak discharges at Lees Ferry, Arizona, of 25,5 ft 3 /s in 1934, 34,3 ft 3 /s in 1954, 34,6 ft 3 /s in 1931, 35,6 ft 3 /s in 1955, 38,9 ft 3 /s in 1959, and 4,2 ft 3 /s in These two floods were the annual snowmelt floods with peak discharges at Lees Ferry, Arizona, of 46,8 ft 3 /s in 196 and 47,3 ft 3 /s in
14 EXPLANATION PRE-DAM ANNUAL FLOOD SERIES FROM LEES FERRY GAGING STATION RECORD PRE-DAM PARTIAL-DURATION FLOOD SERIES FROM LEES FERRY GAGING STATION RECORD PEAK DISCHARGE, IN CUBIC FEET PER SECOND 5, 2, 1, 5, 2, 1884 FLOOD 1921 FLOOD 1, RECURRENCE INTERVAL, IN YEARS Figure 2. Pre-dam annual and partial-duration flood-frequency analysis for the Colorado River at Lees Ferry, Arizona gaging station. Blue band indicates the 42, to 45, ft 3 /s range in the peak discharges of the 1996, 24, and 28 CFEs. See figure 3 for the location of the Lees Ferry gaging station. After figure 36 in Topping and others (23). grain size to suspended-sand concentration. Designing future controlled floods thus requires understanding how the different responses of eddy sandbars observed during these three CFEs were related to differences in the suspended-sand concentrations measured during these CFEs, which, in turn, were the product of the different sand supplies antecedent to these three CFEs. To be a viable tool in rebuilding eddy sandbars in a sustainable manner, controlled floods must result in eddy sandbars increasing in overall size over large segments of the Colorado River in the study area. Eddy sandbars increase in overall size when the sand deposited in these sandbars is derived largely from upstream environments outside of eddies. Controlled floods conducted during relatively sand-depleted conditions, such as those that likely existed in upstream reaches during the 1996 CFE, result in the erosion of upstream eddy sandbars, with an increase in eddy-sandbar size only occurring in the most downstream reaches (Hazel and others, 1999; Schmidt, 1999). Repeated controlled floods conducted under such sand-depleted conditions would likely lead to the eventual erosion of much of the sand from the Colorado River in Grand Canyon, and this is therefore not a sustainable strategy for maintaining eddy sandbar size in GCNP (Topping and others, 26a). Subsequent CFEs during 24 and 28 were thus conducted to test whether controlled floods conducted under greater levels of sand enrichment following large tributary floods and lower dam 4
15 releases could result in greater, and potentially sustainable, eddy-sandbar deposition in the Colorado River in GCNP (Rubin and others, 22; Topping and others, 26a). High-resolution sediment-transport and grain-size data are required to evaluate the reachby-reach sand supplies before a CFE, the reach-by-reach sand supplies during a CFE, and the downstream patterns of erosion and deposition during a CFE. To meet this need, suspended- and bed-sediment data were collected at a number of fixed locations during the 1996, 24, and 28 CFEs, and suspended-sediment data were also collected using a Lagrangian reference frame during the 24 and 28 CFEs. The 1996 CFE resulted in major advances in the understanding of the role of supply limitation in regulating sand transport in the Colorado River in GCNP (Rubin and others, 1998, 22; Topping and others, 1999, 2a, 2b, 25, 27a, 28; Rubin and Topping, 21, 28; Schmidt and others, 27). Therefore, as a result of this learning, suspendedand bed-sediment data were collected at much higher resolutions during the 24 and 28 CFEs than during the 1996 CFE. Purpose and Scope This study was conducted to collect and analyze sediment-transport data to help in the evaluation and future design of controlled floods as a possible tool in rebuilding and maintaining eddy sandbars in the Colorado River in Grand Canyon National Park. The purpose and scope of this report is to present the suspended- and bed-sediment data collected in the Colorado River during controlled-flood experiments conducted in 1996, 24, and 28 and to analyze those data. Theoretical Background Previous work has shown that the deposition rate in an eddy sandbar during a flood directly depends on suspended-sand concentration (Schmidt and others, 1993). To maximize eddy-sandbar deposition, a properly designed controlled flood would therefore maintain the highest suspendedsand concentrations for the longest time possible (at least through the duration of the flood). Conducting controlled floods when the sand supply in a river reach of interest is the largest, however, will not ensure that suspended-sand concentrations will be sufficiently high to optimize eddy-sandbar deposition. Because the boundary shear stress field, bed-sand grain size, bed-sand area, and the areal distribution of sand in a reach all interact to regulate suspended-sand transport, the highest suspended-sand concentration at a given discharge of water does not necessarily correspond to the largest sand supply in a reach. Based on equilibrium suspended-sediment theory developed for steady, uniform flow (reviewed by McLean, 1992) for beds entirely composed of sand with either narrow or wide lognormal grain-size distributions, and with or without dunes on the bed, Rubin and Topping (21) found that C SAND u J K D, (1) * b where C SAND is the time- and spatially averaged suspended-sand concentration, u * is the spatially averaged shear velocity, and D b is the spatially averaged median grain size of the bed sand. Depending on the sorting of the bed-sand grain-size distribution and whether dunes were present on the bed, Rubin and Topping (21) found that, for most cases, J equaled 3.5 and K ranged from to -3.. In the analyses in this report, J is set equal to 3.5 and K is set equal to Using these values for J and K, and because u * = τ b ρ, (2) 5
16 where τ b is the spatially averaged boundary shear stress and ρ 1 g/cm 3 is the density of the water/suspended-sediment mixture at typical water temperatures, equation 1 can be rewritten as C SAND τ b D b. (3) For steady, uniform flow, and an approximately uniform areal distribution of sand on a gravel bed, the fractional area of the bed sand, A b, ranges from to 1 and exerts an approximately linear control on suspended-sand concentration (Topping, 1997; Grams, 26; Grams and Wilcock, 27), thus leading to the following form of equation 3: C SAND A b τ b D b. (4) For a flat bed composed entirely of sand (that is, a bed without form drag), the reachaveraged skin-friction component of the boundary shear stress, τ sf, is equal to τ b. As the area of sand on a gravel bed decreases, the spatially averaged form drag increases, resulting in a reduction of τ sf relative to τ b. In the absence of form-induced stresses (for example, Giménez-Curto and Lera, 1996; Nikora and others, 21; McLean and Nikora, 26) that may offset this reduction in τ sf, the spatially averaged near-bed concentration of suspended sand should decrease quasi-linearly as a function of τ sf (after Topping, 1997). To express this effect, equation 4 may be modified as τ sf C SAND A b τ 1.8 b D 2.5 b. (5) τ b In gravel-bedded rivers where the bed-gravel grain size is very small relative to the flow depth (as in most of the Colorado River in the study area except in the riffles and rapids), the reach-averaged gravel form-drag component of τ b must be much smaller than τ b (Wiberg and Smith, 1991; Topping, 1997). As a gravel bed becomes buried in sand, dunes will develop on the sand patches (Topping, 1997; Rubin and others, 21) resulting in an additional source of form drag, which may become larger than the form drag associated with the gravel (Smith and McLean, 1977; McLean, 1992, Topping, 1997, McLean and others, 1999; Maddux and others, 23; Topping and others, 27a). As a result of this effect, over these sand patches, the ratio τ sf τ b in equation 5 may range from about.5 to 1. Because sand patches typically compose a minority of the bed of the Colorado River in the study area (Anima and others, 1998; Schmidt and others, 27; R. Anima, USGS, 28, unpublished 1998 and 1999 side-scan sonar data), however, the effect of dune form drag on the ratio τ sf τ b in equation 5, when spatially averaged over large parts of the bed, is minimal. The ratio τ sf τ b in equation 5 is thus likely equal to approximately 1 at the measurement cross-sections in this study and can be excluded from further consideration. Using steady, uniform flow suspended-sediment theory, a proportionality similar to that in equation 4 can be derived relating the median grain size of the suspended sand to the median grain size of the bed sand. Unlike the proportionalities in equations 4 and 5, however, A b does not enter into this new proportionality because it affects the flux of each size class of sediment between the bed and the suspended load equally (after Topping, 1997; Topping and others, 27a). For sand beds with either narrow or wide lognormal grain-size distributions, and with or without dunes on the bed, Rubin and Topping (21) found that D s u * L D b M, (6) where D s is the spatially averaged median grain size of the suspended sand. Depending on the sorting of the bed-sand grain-size distribution and whether dunes were present on the bed, Rubin and Topping (21) found that L ranged from.15 to.4 and M ranged from.5 to 1.. Based on these values and also on the integral constraints that.1j = L, and that M -.1K = 1 (Rubin and 6
17 Topping (21, 28), L is set equal to.35 and M is set equal to.75 in the analyses in this report. Substituting equation 2 into equation 6, using these values for L and M, and rearranging yields: D s τ b.18 D b.75. (7) Subsequent discussion of the theoretical background and physical assumptions used in the analyses in this report are thus based on equations 4 and 7. Previous work has shown that suspended-sand transport in the Colorado River in the study area varies as a function of both the discharge of water and the upstream supply of sand (Topping and others, 2a, 2b) and that under typical dam releases, sand transport is regulated equally by the discharge of water (through τ b ) and by the grain-size distribution of the bed sand (Rubin and Topping, 21, 28). To a lesser degree than these two regulators of sand transport, the reachaveraged bed-sand area also regulates sand transport in the Colorado River (Topping and others, 27a). Additionally, changes in how sand is distributed areally within a reach have been observed following large changes in discharge (Anima and others, 1998; Topping and others, 2b; Schmidt and others, 27), and these changes may also influence sand transport. Flow in the Colorado River in the study area is typically nonuniform as a result of complicated reach geometry (with lateral recirculation eddies, scour holes, and other bed undulations) and sand typically composes the minority of the bed (Howard and Dolan, 1981; Schmidt and Graf, 199; Topping and others, 25, 28; Hazel and others, 26). As in any river, the physical interaction between the flow and complicated bed topography controls the loci of sand deposition and erosion (for example, Nelson and Smith, 1989; Shimizu and others, 199). Under typical sand-supply conditions and dam releases, sand is present mainly in eddy sandbars, along some of the banks, and as patches on a bed composed of fluvial gravel, colluvium, and bedrock (Anima and others, 1998; Schmidt and others, 27; R. Anima, USGS, 28, unpublished 1998 and 1999 side-scan sonar data). Sand patches will form in regions on the bed of the Colorado River where convergence occurs in τ b, and these patches will continue to aggrade and enlarge until either convergence in τ b disappears or the upstream supply of sand becomes insufficient at a given convergence in τ b to maintain a depositional environment (Topping and others, 2b). Sand patches will not form in regions on the bed where divergence in τ b occurs, except in reaches downstream from tributaries following large tributary floods that can temporarily overwhelm the bed of the Colorado River with sand 3. The regions on the bed where convergence or divergence in τ b occurs change location with stage, resulting in different bed-sand areas and different areal distributions of sand within a reach at different water discharges (Topping and others, 2b, 27a). Large increases in sand-patch thickness will result in local increases in τ b over these patches. Such large changes in sand-patch thickness have been observed between repeated bathymetric surveys, but have typically affected less than about 2 percent of the bed over the kilometer-long reach scale (USGS Grand Canyon Monitoring and Research Center, 2-25 unpublished data). Because it is unlikely that τ b over these patches changes by more than 5 percent as these patches change thickness, typical changes in sand-patch thickness will likely result in less than a 1-percent change in the spatially averaged τ b over the kilometer-long reach scale. 3 The day after a large flood on the Paria River (located in fig. 3 below) on September 12, 1998 (described in Topping and others, 2b), the downstream bed of the Colorado River was overwhelmed with sand. This resulted in a substantial decrease in flow depth across the entire channel. Associated with this change in channel geometry, Froude numbers were increased, and upstream-propagating breaking waves were observed over antidunes. In this transient situation, the reach-averaged τ b was likely substantially increased by the large increase in reach-averaged bed-sand thickness and bed-sand area. By September 14, 1998, sand had been eroded from this reach, flow depths had increased, and the antidunes were gone. 7
18 Although equation 4 was developed for equilibrium suspended-sediment transport under steady, uniform flow, it can be applied to the supply-limited suspended-sand transport and nonuniform flow conditions that typify the Colorado River in the study area after some key physical assumptions. For typical flow conditions in the Colorado River in Marble and Grand Canyons, the spatial scale over which suspended sand may equilibrate with the bed ranges from about 6 m to well over 1 km (Topping and others, 27a). Therefore, the following physical assumptions are utilized to use the physics described by equations 4 and 7 to allow analysis of the suspended-sediment data presented in this report. First, spatial averaging over the kilometer-long reach scale is used to relate a given C SAND and D s in a cross-section to the values of A b, τ b, and D b averaged over the kilometer-long reach upstream from the measurement cross-section. Second, areal heterogeneities in A b, τ b, and D b are assumed to occur over spatial scales much smaller than the kilometer-long reach scale. Third, and similar to arguments made in Rubin and Topping (21) based in Einstein and Chien (1953), temporal changes in A b and D b caused by changes in the upstream sand supply are assumed to occur over longer time scales than changes in τ b and sand transport. These three assumptions together allow use of suspended-sediment theory developed for equilibrium suspended-sediment transport under steady, uniform flow in the analysis of suspendedsediment data collected in a river. As a result of these three assumptions, measured values of C SAND and D s cannot be used to detect variations on A b, τ b, and D b occurring over less than the kilometerlong reach scale. Finally, because changes in sand-patch thickness do not likely result in substantial changes in the reach-averaged value of τ b, the reach-averaged τ b is only allowed to vary as a function of changes in water discharge. The appropriateness of and alternatives to this final assumption will be evaluated in a subsequent section of this report. For a given discharge of water, therefore, suspended-sand concentration depends strongly on the reach-averaged grain-size distribution of the sand on the bed, and to a lesser degree, the reach-averaged area of sand on the bed. By equation 4, the reach-averaged grain-size distribution of the bed sand exerts a nonlinear control on suspended-sand concentration (Rubin and Topping, 21, 28), whereas the reach-averaged area of sand on the bed exerts an approximately linear control on suspended-sand concentration (Grams, 26; Grams and Wilcock, 27). In the general case, where sand is uniformly distributed on the bed, a factor of 3 decrease in the reach-averaged median grain size of the bed will lead to an approximate factor of 1 increase in suspended-sand concentration (Topping and others, 2b); a factor of 3 decrease in the reach-averaged area of sand on the bed will lead to an approximate factor of 3 decrease in suspended-sand concentration (Topping and others, 27a). Changes in the reach-averaged bed-sand grain-size distribution will lead to changes both in suspended-sand concentration and in the grain-size distribution of the suspended sand, whereas changes in the reach-averaged area of sand on the bed will lead to changes in only suspended-sand concentration (Topping and others, 27a). Because of these physical effects, a large increase in sand supply to a sand-starved reach under constant discharge will lead to an increase in suspended-sand concentration (through a large increase in reachaveraged bed-sand area and possibly a decrease in reach-averaged bed-sand median grain size depending on the differences between the antecedent bed-sand grain-size distribution and the grainsize distribution of the newly supplied sand), whereas a much smaller increase in a much finer sand supply to this same sand-starved reach under constant discharge will result in a much greater increase in suspended-sand concentration (through less of an increase in reach-averaged bed-sand area, but a much larger decrease in reach-averaged bed-sand median grain size). Because a greater amount of sand was supplied in the first of these two hypothetical scenarios, the supply-driven increase in suspended-sand concentration under the first scenario should be longer lived than the 8
19 supply-driven larger increase in suspended-sand concentration under the second scenario. However, because the sand supply was coarser in the first of these two scenarios, the suspendedsand concentrations under this first scenario could be considerably lower than under the second scenario. Therefore, the "best sand supply" to maximize sandbar deposition for a given controlled flood is not the largest sand supply, but rather the sand supply composed of a sufficiently large volume of sand fine enough to maintain the highest suspended-sand concentrations for the duration of the controlled flood. In this report, the terms "sand supply" and "sand enrichment" are used to refer to the amount, mass or volume, of sand in a given reach of the Colorado River, which for a given discharge of water is always positively correlated with bed-sand area and, in most but not all instances, negatively correlated with bed-sand median grain size. In the Colorado River in Marble and Grand Canyons, negative correlation typically exists between the amount of sand in a reach and reach-averaged bed-sand median grain size (that is, more sand equates to a finer bed-sand grain-size distribution) because the median grain size of the sand supplied by tributaries is typically much finer than the median grain size of the sand on the bed of the river (Topping and others, 2b). However, the exact sequence of inputs of new sand from tributaries and various dam releases on the Colorado River can negate this negative correlation. For example, Topping and others (25, 28) showed that, when substantial armoring of bed sand occurs, the surface grain size of the bed sand will be positively correlated with the amount of sand in a reach (that is, "more sand" is covered by a cap of coarser sand). Furthermore, over a longer period of time, a large input of sand from a tributary will be winnowed, such that the correlation between the amount of sand in the reach downstream from this tributary and reach-averaged bed-sand median grain size may be positively correlated over this longer time period. In other words, the following sequence of events is likely in the reach downstream from a large tributary over some period of time given the relative magnitudes of a sand input from this tributary and the dam releases in the Colorado River (an example of a scenario similar to this exists in figures 13 through 15 in Topping and others, 2b): (1) Initially, the sand in patches on the gravel bed of the Colorado River had an initial median grain size of.3 mm and composed about 2 percent of the bed. (2) A large input of tributary sand occurs, causing the bed-sand area in the reach of the Colorado River downstream from this tributary to increase to almost 1 percent and the bed-sand median grain size to decrease to about.1 mm. (3) At some time later, much of the finer fraction of this new input of tributary sand has been winnowed from the bed in this reach and transported downstream. (4) At a later time, the sand in this reach has coarsened to about.4 mm and the reachaveraged bed-sand area has decreased to about 3 percent. Because of the nonlinearity between suspended-sand concentration and bed-sand median grain size and the linearity between suspended-sand concentration and bed-sand area, winnowing processes will likely increase the bed-sand median grain size faster than they will reduce the bed-sand area. 4 (5) For the same discharge of water, the suspended-sand concentration over the final bed state would be about a factor of 1.8 lower than that over the initial bed state by only the effect of the coarser bed-sand median grain size, and would be about a factor of 1.5 greater than that by only the effect of the greater bed-sand area, thus resulting in a net 2 percent decrease in suspended-sand concentration between the initial bed state and the final bed state. 4 As shown in Topping and others (27a), bed-sand median grain size dominates over bed-sand area in regulating sand transport, and in certain cases the influence of changes in the bed-sand grain-size distribution can completely offset the influence of opposing changes in bed-sand area in regulating suspended-sand transport. 9
20 Thus, over the time period associated with the above scenario, lower suspended-sand concentrations are associated with a larger sand supply. In this case, sand supply is positively correlated with reach-averaged bed-sand area and bed-sand median grain size. Future design of a controlled flood to maximize eddy-sandbar deposition requires knowing the sand-supply and grain-size conditions that gave rise to the suspended-sand concentrations observed during the 1996, 24, and 28 CFEs. Detailed "mass-balance" sand budgets constructed using high-resolution sand-flux data are available for various reaches of the Colorado River for the periods antecedent to and during the 24 and 28 CFEs, and similar sand budgets could be used to design future controlled floods. However, these sand budgets alone cannot be used to evaluate differences in the sand supplies between the different controlled floods for two key reasons. (1) Data to construct such sand budgets are unavailable for the period antecedent to and during the 1996 CFE. (2) Even when it is possible to construct such sand budgets, data collection for these budgets began in 22 and thus do not include pre-22 "background" sand storage in a reach; therefore, these sand budgets cannot compute the entire upstream sand supply in a reach. The differences in the sand supplies during the 1996, 24, and 28 CFEs can only be determined through careful physically based analyses of the suspended-sand data collected during these events. Analyses of differences in only suspended-sand concentration between two controlled floods of similar discharge will not allow determination of the differences in the upstream sand supply between these events. Ideally, analyses must be able to resolve the opposing influences of reachaveraged bed-sand grain size and area on suspended-sand concentration. To explain observed coupled changes in suspended-sand concentration and grain size, Rubin and Topping (21, 28) developed and tested such an analytical technique to back-calculate the required changes in bedsand median grain size for a bed composed of 1 percent sand. Unfortunately, as published, this technique does not allow differences in bed-sand area to be evaluated. For reasons described above, bed-sand area is one of the most difficult parameters to measure, either directly or in a backcalculated sense from analyses of suspended-sediment data (Topping and others, 27a), but it is the parameter that, at a given discharge of water, is always positively correlated with the upstream sand supply. In this report, suspended-sand data will be analyzed using a modified version of the Rubin and Topping (21, 28) technique to back-calculate the differences in reach-averaged bedsand area between different reaches during the same controlled flood and between identical reaches during different controlled floods. Even though reach-averaged bed-sand area and upstream sand supply are always positively correlated under constant discharge, they are not necessarily positively correlated during large increases in discharge nor are they necessarily positively correlated for some time after a large reduction in discharge, as a result of the transient effects of sand redistribution on the bed following large changes in the discharge of water. Because interactions between the flow field and local channel geometry may change with discharge, different regions of the bed can become aggradational or degradational as discharge varies (Topping and others, 2b), resulting in different areal distributions of sand on the bed. In the Colorado River in Marble and Grand Canyons, the general equilibrium tendency is for sand to be more evenly distributed on the gravel bed at higher discharge than at lower discharge. Large increases in discharge tend to result in scour of sand from deeper pools and redistribution of this sand over larger parts of the gravel bed. Sidescan sonar data indicate that, in sand-starved reaches of the Colorado River, bed-sand area increases during floods as a result of this redistribution process (Anima and others, 1998; Schmidt and others, 27). This process was observed in side-scan sonar data following the , ft 3 /s CFE and also following a 4-day 31, ft 3 /s powerplant-capacity dam release in September 1
21 2. At high discharge during the 1996 and 24 CFEs, this sand redistribution process was detected to occur over time scales of one to several days through analyses of suspended-sand data conducted using a Rouse-mechanics-based model (Topping and others, 27a). Even as the upstream supply of sand decreased during these CFEs, the reach-averaged area of bed sand was detected to increase by this transient redistribution process from about 25 percent on day 1 of high, steady discharge to about 37 percent on day 6 of high, steady discharge during the 1996 CFE, and from about 18 percent on day 1 of high, steady discharge to about 29 percent on day 3 of high, steady discharge during the 24 CFE at the Colorado River near Grand Canyon, Arizona, gaging station (see fig. 3 below for the location of this gaging station). At lower discharge after recession of these artificial floods, it took longer for the sand to redistribute back to the regions of the bed it occupied before these events than it did to expand over larger regions of the bed at higher discharge. Before conducting analyses of reach-averaged bed-sand area, it is important to recognize the potential pitfalls arising from sand areal redistribution within a reach following large changes in discharge. Acknowledgments Funding for this research was provided by the U.S. Department of the Interior's Glen Canyon Dam Adaptive Management Program through the USGS Grand Canyon Monitoring and Research Center. Many thought-provoking discussions on this research with Scott Wright, Jack Schmidt, Joe Hazel, Matt Kaplinksi, Jim Smith, Jon Nelson, Jim Bennett, Randy Parker, Mark Schmeeckle, Amy Draut, Steve Wiele, Tim Randle, Randy Peterson, Ned Andrews, and Peter Wilcock are gratefully acknowledged. This report would not be nearly as comprehensive without their input over the years. Too many people helped with the collection of the data during these three field experiments for them all to be individually acknowledged here. Joe Lyons (Bureau of Reclamation), however, was particularly helpful with the collection of the suspended-sediment data at the Grand Canyon gaging station in Ted Melis was instrumental in much of the work described in this report and led Lagrangian sampling programs during the 24 and 28 CFEs. Scott Wright led the data-collection effort at the River-mile 3 study site during the 24 CFE. Jeff Gartner and Neil Ganju helped with the data collection at the River-mile 3 and 61 study sites during the 24 CFE; Chris Magirl and Greg Shellenbarger helped with the data collection at the River-mile 3 and 61 study sites during the 28 CFE. Logistical support for fieldwork on the Colorado River in Grand Canyon was provided by OARS during the 1996 CFE and by Humphrey Summit Support during the 24 and 28 CFEs. Stuart Reeder, Steve Jones, Brent Burger, Scott Davis, J.P. Running, and Mark Franke provided expert technical boating support for the suspendedsediment sampling during the 24 and 28 CFEs. Thoughtful and insightful reviews of this report were provided by Peter Goodwin (University of Idaho) and Kees Sloff (Delft University of Technology). Study Sites During the three CFEs, suspended- and bed-sediment data were collected in cross-sections at as many as six study sites along the Colorado River in the study area in lower Glen, Marble, and Grand Canyons. These six study sites are: (1) the Colorado River at Lees Ferry gaging station (USGS station number 938), located at the downstream end of Glen Canyon and above the mouth of the Paria River, herein referred to as the "River-mile " site; 11
, located at the downstream end of Marble Canyon and above the mouth of the Little Colorado River, herein referred to as the River-mile 61 site; (4) the Colorado")
 the Colorado River above Diamond Creek near Peach Springs, Arizona, gaging station (9442), herein referred to as the River-mile 225 site (fig.")
22 (2) the River-mile 3 sediment station, located at the midpoint of Marble Canyon, herein referred to as the "River-mile 3" site; (3) the former Colorado River above Little Colorado River near Desert View, Arizona, gaging station (93831), located at the downstream end of Marble Canyon and above the mouth of the Little Colorado River, herein referred to as the River-mile 61 site; (4) the Colorado River near Grand Canyon, Arizona gaging station (9425), herein referred to as the River-mile 87 site; (5) the former Colorado River above National Canyon near Supai, Arizona, gaging station (94412), herein referred to as the River-mile 166 site; and (6) the Colorado River above Diamond Creek near Peach Springs, Arizona, gaging station (9442), herein referred to as the River-mile 225 site (fig. 3). By standard convention on the Colorado River in the study area, river miles increase in the downstream direction from river mile at the Lees Ferry gaging station. As used in this report, lower Glen Canyon extends from Glen Canyon Dam near river mile -16 to the Lees Ferry gaging station at river mile, Marble Canyon extends from river mile to the mouth of the Little Colorado River near river mile 62, and Grand Canyon extends from river mile 62 to the Grand Wash Cliffs near river mile 277. The Colorado River in Glen Canyon is within Glen Canyon National Recreation Area, whereas the Colorado River in Marble and Grand Canyons is within GCNP. The Navajo Indian Reservation borders the Colorado River between river miles -13 and Figure 3. Map showing locations of study sites (red circles and labels) and reaches between the study sites (green labels); RM is abbreviation for river mile. RM = Colorado River at Lees Ferry, Arizona, gaging station; RM 3 = River-mile 3 sediment station; RM 61 = former Colorado River above Little Colorado River near Desert View, Arizona, gaging station; RM 87 = Colorado River near Grand Canyon, Arizona, gaging station; RM 166 = former Colorado River above National Canyon near Supai, Arizona, gaging station; and RM 225 = Colorado River above Diamond Creek near Peach Springs, Arizona, gaging station. LGC = lower Glen Canyon; UMC = upper Marble Canyon; LMC = lower Marble Canyon; EGC = eastern Grand Canyon; ECGC = east-central Grand Canyon; WCGC = west-central Grand Canyon; and WGC = western Grand Canyon. 12
23 62, and the Hualapai Indian Reservation borders the Colorado River between river miles 165 and 273. The six study sites described above divide the Colorado River into seven study reaches: (1) lower Glen Canyon (between Glen Canyon Dam and river mile ), (2) upper Marble Canyon (between river miles and 3), (3) lower Marble Canyon (between river miles 3 and 61), (4) eastern Grand Canyon (between river miles 61 and 87), (5) east-central Grand Canyon (between river miles 87 and 166), (6) west-central Grand Canyon (between river miles 166 and 225), and (7) western Grand Canyon (between river miles 225 and 277). These study reaches were chosen for sediment-budgeting purposes; the study sites bounding these reaches were chosen on the basis of (1) locations of key sediment-supplying tributaries, (2) locations of existing or former USGS gaging stations, and (3) locations where substantial historical pre-dam and post-dam sediment-transport data have been collected by the USGS and provide context (Howard, 1947; Topping and others, 2a). The closure of Glen Canyon Dam in March 1963 cut off the upstream supply of sediment to the Colorado River (U.S. Department of the Interior, 1995; Topping and others, 2a; Wright and others, 25, 28). The only suppliers of sand to lower Glen Canyon are now the small tributaries that enter the Colorado River below Glen Canyon Dam (Webb and others, 2; USGS Glen and Marble Canyons lesser tributary stage and sediment-transport data). The present suppliers of sand to the Colorado River in Marble and Grand Canyons are now, in decreasing order of importance, the Paria River (enters the Colorado River at river mile 1), the Little Colorado River (enters the Colorado River near river mile 62), Kanab Creek (enters the Colorado near river mile 143), Havasu Creek (enters the Colorado River near river mile 157), the small tributaries that enter the Colorado River between river miles 1 and 17, and finally all of the other small tributaries that enter the Colorado River between river miles 17 and 277 (Garrett and others, 1993; Melis and others, 1996; Rote and others, 1997; Topping, 1997; Topping and others, 2a; Webb and others, 2; USGS sediment-transport data from the Kanab Creek near Fredonia, Arizona, gaging station (94378); USGS Glen and Marble Canyons lesser tributary stage and sediment-transport data). At the upstream boundary of Grand Canyon National Park (located at the mouth of the Paria River), the present sand supply to the Colorado River is almost entirely contributed by the Paria River and is only about 6 percent of the pre-dam supply (Topping and others, 2a). By river mile 62, below the mouth of the Little Colorado River, the cumulative upstream supply of sand to the Colorado River is still only about 12 to 15 percent of the pre-dam supply (Topping and others, 2a; Wright and others, 25). Because of the relatively small sand contributions from the tributaries downstream from this point, the cumulative supply of sand to the Colorado River between Glen Canyon Dam and the head of Lake Mead reservoir is likely less than about 2 percent of the pre-dam supply. The Colorado River below river mile 236 is within the full-pool region of Lake Mead and is affected by the elevation of that reservoir (Smith and others, 196). Data During the 1996 CFE, suspended-sediment data were collected at only four of the six study sites using only conventional depth- and point-integrating suspended-sediment samplers, and bedsediment data were collected at only the River-mile 87 study site. During the 24 CFE, the datacollection program vastly increased in scope and resolution, with suspended-sediment data collected at five of the six sites, using not only conventional samplers, but also at higher resolutions using ISCO pump samplers, Nortek acoustic-doppler profilers, and Sequoia Scientific LISST 13
24 laser-diffraction instruments (Melis and others, 23; Topping and others, 24, 26a, 26b, 27b). Bed-sediment data were also collected at most of the study sites; no bed-sediment data were collected at the River-mile study site because the bed at that site is almost entirely composed of cobbles and boulders. The data-collection program increased in scope again during the 28 CFE, with suspended-sediment data collected at all six study sites and bed-sediment data collected at all but the River-mile study site. During the 24 CFE, a Lagrangian sampling program was conducted to sample suspended sediment in individual parcels of water between river miles and 87 (Topping and others, 26a). During the 28 CFE, this effort was expanded and two Lagrangian sampling programs were conducted to sample suspended sediment in individual parcels of water between river miles and 87 and between river miles 87 and 225. Suspended- and bed-sediment data collected during the 1996 CFE have been previously described and/or analyzed in Konieczki and others (1997), Rubin and others (1998), Rubin and Topping (21, 28), Smith (1999), Topping and others (1999, 2a, 2b, 25, 26a, 27a, 28, in press), and Hazel and others (26). Suspended- and bed-sediment data collected during the 24 CFE have been previously described and analyzed in Topping and others (26a). An inventory of the suspendedand bed-sediment data collected during each CFE and analyzed in this report is provided in table 1. At each study site, all suspended- and bed-sediment samples in this study were collected using standard USGS methods (described in Edwards and Glysson, 1999; Nolan and others, 25). At most of the study sites, velocity-weighted suspended-sediment data were collected using either the Equal Depth Increment (EDI) or Equal Width Increment (EWI) methods. Point suspendedsediment samples were also collected at some of the study sites during the 1996 CFE. The suspended-sediment samplers used were: the P-61 and P-61-A1 point-integrating samplers (described in Edwards and Glysson, 1999; Federal Interagency Sedimentation Project, [n.d.]a), standard rigid-container D-77 depth-integrating samplers (described in Edwards and Glysson, 1999), D-77-bag-type depth-integrating samplers 5 (described in Szalona, 1982; Wilde and others, 1998), and D-96 and D-96-A1 depth-integrating samplers (described in Davis, 21; Federal Interagency Sedimentation Project, 23, [n.d.]b, [n.d.]c). Bed-sediment samplers used were: BM- 54 bed-material samplers (described in Federal Interagency Sedimentation Project, 1958a; Edwards and Glysson, 1999) and pipe dredges. Description of the ISCO 6712 automatic pump samplers used in this study is provided in Topping and others (26b). Data collected by the automatic pump samplers were calibrated using the suspended-sediment data collected in the EDI or EWI measurement cross-sections. These calibrations were performed for the following size classes of sediment: silt and clay, total sand, and each 1/4-φ size class of sand between.625 mm and.25 mm to allow for computation of the median grain size of the suspended sand. Suspended sediment becomes more uniformly distributed between the pump intake and the middle of the channel as Rouse number decreases. To correct for this effect of increased cross-sectional mixing of the coarser sediment size classes in suspension with increased discharge, the calibrations for the data in the total sand and 1/4-φ size classes coarser than about.88 to.125 mm included discharge weighting. Methods for processing the acoustic-doppler-profiler data for suspended-sand concentration, suspended-sand median grain size, and suspended-silt-and-clay concentration are described in Topping and others (27b). More complete details on the methods for instrument 5 The configuration of the D-77-bag-type depth-integrating suspended-sediment sampler varies slightly between its design in Szalona (1992) and its description in Wilde and others (1998). The configuration of this sampler used in this study during the 24 and 28 CFEs is that depicted in figure 2-1D in Wilde and others (1998) with the bottle-hole configuration depicted in figure 2-2A in Wilde and others (1998). 14
25 calibration, data processing, and error analysis for the automatic pump samplers and acoustic- Doppler profilers are to be published in a forthcoming USGS report. Lagrangian sampling programs were conducted during the 24 and 28 CFEs to track the changes in suspended sediment in individual parcels of water as they traveled downstream through Marble and Grand Canyons. Thus, the Lagrangian reference frame used in these sampling programs traveled downstream at the mean velocity of the water. Analyses of the data collected during these sampling programs allowed determination of longitudinal patterns in: (1) reach-scale sand erosion and deposition, (2) reach-averaged suspended-sand median grain size, (3) reach-scale silt and clay erosion and deposition, (4) reach-averaged median grain size of the bed sand through use of Rubin and Topping's (21, 28) parameter β, (5) reach-averaged area of the bed covered by sand through use of a modified form of Rubin and Topping's (21, 28) parameter β, (6) reach-by-reach sand enrichment (by reach-averaged bed-sand median grain size and area) before each CFE, and (7) reach-by-reach silt and clay enrichment before each CFE. Identical sample-collection methods, but different suspended-sediment samplers, were used during the 24 and 28 Lagrangian sampling programs. During each sampling program, the suspended sediment in an individual parcel of water was sampled episodically by the collection of three sequential back-to-back, single-vertical, depth-integrated samples in the middle of the channel. Because rapids could not be run safely at night, breaks in the sampling program occurred resulting in different parcels of water being sampled on different days. These camping breaks resulted in backward steps in the Lagrangian reference frame between the different parcels of water. The average spacing between the sampling stations in the 24 and 28 Lagrangian sampling programs between river miles and 87 was approximately 2.5 river miles; where possible, identical sampling stations were occupied during each of these programs. The average spacing between the sampling stations in the added second 28 Lagrangian sampling program between river miles 87 and 225 was approximately 4 river miles. During the 24 Lagrangian sampling program, data were collected using a P-61-A1 point-integrating suspended-sediment sampler operated in the upward depth-integrating mode. Because of the mechanical and electrical complexity of this sampler, it was difficult to keep the sampler operational during the 24 sampling program; the first P-61-A1 sampler broke after sampling at river mile 24, and the backup P-61-A1 sampler broke after sampling at river mile 85. Thus, the simpler D-96-A1 depth-integrating suspended-sediment sampler was used to collect data during both 28 Lagrangian sampling programs. During the 24 CFE, one Lagrangian sampling program was conducted between river miles and 87. Travel times for the parcels of water through Marble and Grand Canyons were estimated based on the dye studies of Graf (1995, 1997) and Konieczki and others (1997), and the well-calibrated step-backwater model of Magirl and others (28). On the first day of high, steady discharge during the 24 CFE, this program sampled the suspended sediment in one parcel of water between river miles and 52; and, on the second day of high, steady discharge, this program sampled the suspended sediment in a second parcel of water between river miles 52 and 85 (where the backup P-61-A1 suspended-sediment sampler ultimately broke). Owing to the differences in the velocity of discharge waves (that is, flood waves) and water based on physical laws (mostly conservation of mass), a flood wave travels much faster than the does the water in the Colorado River in Marble and Grand Canyons (Wiele, 1996; Wiele and Smith, 1996; Griffin and Wiele, 1996; Wiele and Griffin, 1998; Wiele and Torizzo, 23). For example, during the 28 CFE, the first 28 Lagrangian sampling program left the River-mile study site just before the beginning of 15
26 Table 1. Inventory of suspended- and bed-sediment data collected during the three CFEs and analyzed in this report. River-mile study site (938, Colorado River at Lees Ferry, Arizona, gaging station) Suspended-sediment data collected during the 1996 CFE During March 26 through April 6, 1996, a total of 5 five-vertical Equal Discharge Increment (EDI) measurements were made from the cableway using a standard rigid-container D-77 depth-integrating sampler; of these 5 measurements, only 2 were made during the high, steady-discharge part of the CFE hydrograph. Bed-sediment data collected during the 1996 CFE None Suspended-sediment data collected during the 24 CFE During November 19 through 28, 24, a total of 28 five-vertical EDI measurements were made from the cableway using a D-96-A1 depth-integrating sampler. The sampling protocol was to make 4 EDI measurements per day from the start of the rising limb to the end of the receding limb of the CFE hydrograph. In addition, 4 EDI measurements were made during the two days before the rise of the CFE hydrograph, and 4 EDI measurements were made during the two days after the recession of the CFE. Bed-sediment data collected during the 24 CFE None Suspended-sediment data collected during the 28 CFE During March 4 through 1, 28, a total of 24 five-vertical EDI measurements were made from the cableway using a D-96-A1 depth-integrating sampler. The sampling protocol was to make 4 EDI measurements per day from the start of the rising limb to the end of the receding limb of the CFE hydrograph. In addition, 2 EDI measurements were made during the day before the rise of the CFE hydrograph, and 2 EDI measurements were made during the day after the recession of the CFE. Bed-sediment data collected during the 28 CFE None River-mile 3 study site (River-mile 3 sediment station) Suspended-sediment data collected during the 1996 CFE None, study site not yet established Bed-sediment data collected during the 1996 CFE None, study site not yet established Suspended-sediment data collected during the 24 CFE During November 18 through 3, 24, a total of 38 five-vertical Equal Width Increment (EWI) measurements were made using a D-77-bag-type depth-integrating sampler deployed from a boat positioned under the tagline. The sampling protocol was to make 4 EWI measurements per day from the start of the rising limb to the end of the receding limb of the CFE hydrograph. In addition, 4 EWI measurements were made during the three days before the rise of the CFE hydrograph, and 14 EWI measurements were made during the five days after the recession of the CFE. 16
27 Table 1. Inventory of suspended- and bed-sediment data collected during the three CFEs and analyzed in this report. Continued During November 18 through 3, 24, a total of 128 samples were collected using ISCO 6712 automatic pump samplers. From the start of the rising limb to the end of receding limb of the CFE hydrograph, these samples were collected every hour. During November 18 through 3, 24, a total of 1,162 suspended-sediment measurements were made using a Nortek 1MHz EasyQ sideways-looking acoustic-doppler profiler. These measurements were made every 15 minutes, and processed for suspended-sand concentration and suspended-silt-and-clay concentration. Bed-sediment data collected during the 24 CFE During November 19 through 3, 24, a total of 17 bed-sediment measurements were made using a pipe dredge deployed from a boat positioned under the tagline. Each of these 17 measurements consisted of samples collected at the 3 middle of 5 equally spaced stations in the cross-section under the tagline (these 5 stations were the centroids of each EWI cell). Only 1 measurement during this period consisted of samples at 2 of these 3 stations. The leftmost and rightmost of the 5 stations were not sampled because of the presence of large boulders and colluvium on the bed on the sides of the cross-section. The sampling protocol was to make 2 of these measurements per day from the start of the rising limb through the end of the receding limb of the CFE hydrograph. In addition, 1 measurement was made per day during the two days before the rise of the CFE hydrograph, and 1 measurement was made per day during the five days after the recession of the CFE. Suspended-sediment data collected during the 28 CFE During March 3 through 11, 28, a total of 29 five-vertical EWI measurements were made using a D-96-A1 depth-integrating sampler and a total of 29 five-vertical EWI measurements were made using a D-77- bag-type depth-integrating sampler deployed from a boat positioned under the tagline. Measurements were made with these two samplers in a sequential back-to-back fashion. These back-to-back sample pairs were used with other back-to-back D-96-A1, D-77-bag-type sample pairs collected at this study site between February 22, 27, and January 26, 28, to develop bias-correction factors for suspendedsediment data collected previously at this study site with the non-isokinetic D-77-bag-type sampler (for example, the EWI measurements made at this study site during the 24 CFE). The sampling protocol was to make 4 EWI measurements with each sampler per day from the start of the rising limb to the end of the receding limb of the CFE hydrograph. In addition, 3 EWI measurements were made with each sampler during the two days before the rise of the CFE hydrograph, and 5 EWI measurements were made with each sampler during the three days after the recession of the CFE. During March 3 through 11, 28, a total of 153 samples were collected using ISCO 6712 automatic pump samplers. From the start of the rising limb to the end of receding limb of the CFE hydrograph, these samples were collected every hour. From 11 on March 5 through 6 on March 1, the pump intaketube mount was broken, and the intake tubes were loose in the current. This made the suspended-sand data collected by the pumps during 11 on March 5 through 6 on March 1 unusable; suspendedsilt-and clay data collected by the pumps during this period were unaffected by this problem, however, and could still be used. During March 3 through 11, 28, a total of 94 suspended-sediment measurements were made using a Nortek 1MHz and 2MHz EasyQ sideways-looking acoustic-doppler profiler (both of these instruments were used to make each of these 94 measurements). These measurements were made every 15 minutes, and processed for suspended-sand concentration, suspended-sand median grain size, and suspended-siltand-clay concentration. During this period, an additional 2 measurements were made using either the 1MHz or 2MHz instrument, and were processed for only suspended-sand concentration, and suspendedsilt-and-clay concentration. These additional one-instrument measurements were made while the other instrument was shut down for downloading. 17
28 Table 1. Inventory of suspended- and bed-sediment data collected during the three CFEs and analyzed in this report. Continued Bed-sediment data collected during the 28 CFE During March 3 through 11, 28, a total of 15 bed-sediment measurements were made using a pipe dredge deployed from a boat positioned under the tagline. Each of these 15 measurements consisted of samples collected at the 3 middle of 5 equally spaced stations across the cross-section under the tagline (these 5 stations were the centroids of each EWI cell). The leftmost and rightmost of the 5 stations were not sampled because of the presence of large boulders and colluvium on the bed on the sides of the crosssection. The sampling protocol was to make 2 of these measurements per day from the start of the rising limb through the end of the receding limb of the CFE hydrograph. In addition, 3 measurements were made during the two days before the rise of the CFE hydrograph, and 1 measurement was made per day during the two days after the recession of the CFE. River-mile 61 study site (93831, former Colorado River above Little Colorado River near Desert View, Arizona, gaging station) Suspended-sediment data collected during the 1996 CFE During March 27 through April 2, 1996, a total of 3 five-vertical EDI measurements were made from the cableway using a standard rigid-container D-77 depth-integrating sampler; all 3 of these measurements were made during the high, steady-discharge part of the CFE hydrograph (data published in table 2 of Topping and others, 1999). Bed-sediment data collected during the 1996 CFE None Suspended-sediment data collected during the 24 CFE During November 19 through December 4, 24, a total of 52 five-vertical EWI measurements were made using a D-77-bag-type depth-integrating sampler deployed from a boat positioned under the tagline (at the former location of the measurement cableway from which data were collected during the 1996 CFE). The sampling protocol was to make 4 EWI measurements per day from the start of the rising limb to the end of the receding limb of the CFE hydrograph. In addition, 2 EWI measurements were made per day during the two days before the rise of the CFE hydrograph and the seven days after the recession of the CFE, and 1 final EWI measurement was made on the eighth day after the recession of the CFE. During November 19 through December 4, 24, a total of 191 samples were collected using ISCO 6712 automatic pump samplers. From the start of the rising limb to the end of receding limb of the CFE hydrograph, these samples were collected at least every hour. During November 19 through December 4, 24, a total of 1,486 suspended-sediment measurements were made using a Nortek 1MHz EasyQ sideways-looking acoustic-doppler profiler. These measurements were made every 15 minutes, and processed for suspended-sand concentration and suspended-silt-andclay concentration. 18
29 Table 1. Inventory of suspended- and bed-sediment data collected during the three CFEs and analyzed in this report. Continued Bed-sediment data collected during the 24 CFE During November 19 through December 4, 24, a total of 21 bed-sediment measurements were made using a pipe dredge deployed from a boat positioned under the tagline. Each of these 21 measurements consisted of samples collected at 5 equally spaced stations in the cross-section under the tagline (these 5 stations were the centroids of each EWI cell). At least 3 samples had to be collected among the 5 stations to constitute a measurement. The sampling protocol was to make 2 of these measurements per day from two days before the start of the rising limb through the end of the receding limb of the CFE hydrograph. In addition, 1 measurement was made per day during the three days after the recession of the CFE, and during December 3 and 4. It became easier to sample the sand and finer sediment on the bed after the start of the CFE, and samples at all 5 stations were collected beginning on November 22. Because of the predominance of gravel on the bed at the tagline cross-section before the CFE, samples were only collected at 3 or 4 of the 5 stations during November Suspended-sediment data collected during the 28 CFE During March 3 through 12, 28, a total of 31 five-vertical EWI measurements were made using a D-96-A1 depth-integrating sampler and a total of 31 five-vertical EWI measurements were made using a D-77- bag-type depth-integrating sampler deployed from a boat positioned under the tagline. Measurements were made with these two samplers in a sequential back-to-back fashion. These back-to-back sample pairs were used with other back-to-back D-96-A1, D-77-bag-type sample pairs collected at this study site between January 12, 23, and January 28, 28, to develop bias-correction factors for suspendedsediment data collected previously at this study site with the non-isokinetic D-77-bag-type sampler (for example, the EWI measurements made at this study site during the 24 CFE). The sampling protocol was to make 4 EWI measurements with each sampler per day from the start of the rising limb to the end of the receding limb of the CFE hydrograph. In addition, 3 EWI measurements were made with each sampler during the two days before the rise of the CFE hydrograph, and 8 EWI measurements were made with each sampler during the three days after the recession of the CFE. During March 3 through 6, 28, and during March 1 through 12, 28, a total of 18 samples were collected using ISCO 6712 automatic pump samplers. During the rising limb and during the day after recession of the CFE hydrograph, these samples were collected every hour. From 18 on March 6 through 11 on March 1, the pump intake-tube mount was broken, and the intake tubes were pinched against a large rock. This made all data collected by the pumps during 18 on March 6 through 11 on March 1 unusable. During March 3 through 12, 28, a total of 855 suspended-sediment measurements were made using a Nortek 1MHz EasyQ and an OTT 2MHz SLD sideways-looking acoustic-doppler profiler (both of these instruments were used to make each of these 855 measurements). These measurements were made every 15 minutes, and processed for suspended-sand concentration, suspended-sand median grain size, and suspended-silt-and-clay concentration. During this period, an additional 1 measurements were made using either the 1MHz or 2MHz instrument, and were processed for only suspended-sand concentration and suspended-silt-and-clay concentration. Some of these additional one-instrument measurements were made while the other instrument was shut down for downloading. Others were made while the mount for the OTT 2MHz SLD was shut down for repairs. The mount for the OTT 2MHz SLD broke at 18 on March 6 when the pump intake-tube mount was broken, and the 2MHz OTT SLD became lodged on a large rock. Data from the OTT 2MHz SLD could still be used, however, until 145 on March 9, when the water receded below the elevation of the instrument lodged on the rock. The mount for the 2MHz OTT SLD was repaired and the instrument was placed back in service at 145 on March 1. Subsequent modifications to this instrument mount should increase its strength during any future CFE. 19
30 Table 1. Inventory of suspended- and bed-sediment data collected during the three CFEs and analyzed in this report. Continued Bed-sediment data collected during the 28 CFE During March 3 through 11, 28, a total of 13 bed-sediment measurements were made using a pipe dredge deployed from a boat positioned under the tagline. Each of these 13 measurements consisted of samples collected at 5 equally spaced stations in the cross-section under the tagline (these 5 stations were the centroids of each EWI cell). At least 3 samples had to be collected among the 5 stations to constitute a measurement. The sampling protocol was to make 2 of these measurements per day from two days before the start of the rising limb through the end of the receding limb of the CFE hydrograph. In addition, 1 measurement was made per day during the two days before the rising limb of the CFE, during the first day of the rising limb of the CFE, and during the two days after the recession of the CFE. As during the 24 CFE, it became easier to sample the sand and finer sediment on the bed after the start of the CFE, and samples at all 5 stations were collected beginning on March 6. As during the 24 CFE, because of the predominance of gravel on the bed at the tagline cross-section before the 28 CFE, samples were only collected at 3 of the 5 stations during March 3 and at 4 of the 5 stations on March 5. Samples were collected at all 5 stations, however, on March 4. River-mile 87 study site (9425, Colorado River near Grand Canyon, Arizona, gaging station) Suspended-sediment data collected during the 1996 CFE During March 3 through April 2, 1996, a total of 4 five-vertical EDI measurements were made from the cableway using a standard rigid-container D-77 depth-integrating sampler; all 4 of these measurements were made during the high, steady-discharge part of the CFE hydrograph (data published in table 2 of Topping and others, 1999). During March 27 through April 3, 1996, a total of 8 two-vertical EDI measurements were made from the cableway using a P-61 point-integrating suspended-sediment sampler deployed in the upward depthintegrating mode (verticals were located at stations at 19 and 29 feet on the cableway); the first 7 of these 8 measurements were made one per day during the high, steady-discharge part of the CFE hydrograph (inventory of data published in table 3 of Konieczki and others, 1997; data published in table 2 of Topping and others, 1999; data collected during the individual transits at each vertical in these EDI measurements published in Topping and others, in press; positions of the stations at 19 and 29 feet on the cableway indicated in figure 5 of Topping and others, 27a, and figure 2B of Topping and others, in press). On March 28, 3, and April 2, 1996, 3 point samples were collected at each of 6 elevations in the flow at two stations in the cross-section (at 19 and 29 feet on the cableway) using a P-61 point-integrating suspended-sediment sampler deployed from the cableway (inventory of data published in table 3 of Konieczki and others, 1997; data collected at each elevation in the verticals at the two stations published in Topping and others, in press). 2
31 Table 1. Inventory of suspended- and bed-sediment data collected during the three CFEs and analyzed in this report. Continued Bed-sediment data collected during the 1996 CFE During March 26 through April 3, 1996, a total of 8 bed-sediment measurements were made using a BM-54 sampler deployed from the cableway (data published in table 1 of Topping and others, 1999). Each of these 8 measurements consisted of samples collected at 5 equally spaced stations in the cross-section under the cableway (at least 3 samples had to be collected among the 5 stations to constitute a measurement). Sampling proved difficult during the 1996 CFE, and only three of the 8 measurements consisted of samples collected at all 5 stations. The sampling protocol was to make 1 of these measurements per day from the day before the rising limb through the first day of the receding limb of the CFE hydrograph. Insufficient samples to constitute a full measurement were collected on March 3 (that is, only two samples were collected among the 5 stations on this day). The BM-54 sampler broke after the collection of samples at the leftmost and rightmost of the 5 stations on March 31; a third station in the middle of the cross-section was sampled on this day using a pipe dredge. The BM-54 sampler was fixed prior to sampling on April 1. Suspended-sediment data collected during the 24 CFE During November 2 through 3, 24, a total of 31 five-vertical EDI measurements were made from the cableway using either a D-96 or a D-96-A1 depth-integrating sampler. The sampling protocol was to make 4 EDI measurements per day from the start of the rising limb to the end of the receding limb of the CFE hydrograph (only 3 EDI measurements were actually made during the first day of high, steady discharge, however). In addition, 4 EDI measurements were made during the two days before the rise of the CFE hydrograph, and 2 EDI measurements were made per day during the four days after the recession of the CFE. During November 2 through 3, 24, a total of 163 samples were collected using an ISCO 6712 automatic pump sampler. From the day before the start of the rising limb through the day after the end of receding limb of the CFE hydrograph, these samples were collected every hour. During November 2 through 3, 24, a total of 713 suspended-sediment measurements were made using Nortek 6kHz Aquadopp, 1MHz EasyQ, and 2MHz EasyQ sideways-looking acoustic-doppler profilers (all three instruments were used to make each of these 713 measurements. These measurements were made every 15 minutes, and processed for suspended-sand concentration, suspended-sand median grain size, and suspended-silt-and-clay concentration. During this period, an additional 217 measurements were made using only two of the instruments, and were also processed for suspended-sand concentration, suspended-sand median grain size, and suspended-silt-and-clay concentration. During this period, an additional 113 measurements were made with only one of the instruments, and were processed for only suspended-sand concentration and suspended-silt-and-clay concentration. The measurements made with less than all 3 instruments arose because each instrument was episodically shut down for downloading. Bed-sediment data collected during the 24 CFE During November 2 through 3, 24, a total of 2 bed-sediment measurements were made using a BM-54 sampler deployed from the cableway. Each of these 2 measurements consisted of samples collected at 5 equally spaced stations in the cross-section under the cableway (at least 3 samples had to be collected among the 5 stations to constitute a measurement). Only three of these measurements consisted of samples collected at less than all 5 stations. The sampling protocol was to make 2 of these measurements per day from the start of the rising limb through the end of the receding limb of the CFE hydrograph. In addition, 1 measurement was made per day during the two days before the rise of the CFE hydrograph, and 2 measurements were made per day during the four days after the recession of the CFE. 21
32 Table 1. Inventory of suspended- and bed-sediment data collected during the three CFEs and analyzed in this report. Continued Suspended-sediment data collected during the 28 CFE During March 4 through 12, 28, a total of 28 five-vertical and 1 four-vertical EDI measurements were made from the cableway using either a D-96 or a D-96-A1 depth-integrating sampler. The sampling protocol was to make 4 EDI measurements per day from the start of the rising limb to the end of the receding limb of the CFE hydrograph. In addition, 2 EDI measurements were made during the day before the rise of the CFE hydrograph (one of these was the four-vertical measurement), and 3 EDI measurements were made during the two days after the recession of the CFE. During March 4 through 12, 28, a total of 166 samples were collected using an ISCO 6712 automatic pump sampler. From the day before the start of the rising limb through the day after the end of receding limb of the CFE hydrograph, these samples were collected every hour. During March 4 through 12, 28, a total of 862 suspended-sediment measurements were made using Nortek 6kHz Aquadopp, 1MHz EasyQ, and 2MHz EasyQ sideways-looking acoustic-doppler profilers (all three instruments were used to make each of these 862 measurements). These measurements were made every 15 minutes, and processed for suspended-sand concentration, suspended-sand median grain size, and suspended-silt-and-clay concentration. During this period, only an additional 2 measurements were made with only one of the instruments, and were processed for only suspended-sand concentration and suspended-silt-and-clay concentration. The 2 measurements made with less than all 3 instruments arose because each instrument was episodically shut down for downloading (the instruments were downloaded much less frequently at this study site than during the 24 CFE). Bed-sediment data collected during the 28 CFE During March 4 through 12, 28, a total of 15 bed-sediment measurements were made using a BM-54 sampler deployed from the cableway. Each of these 15 measurements consisted of samples collected at 5 equally spaced stations in the cross-section under the cableway (at least 3 samples had to be collected among the 5 stations to constitute a measurement). Only one of these measurements consisted of samples collected at less than all 5 stations. The sampling protocol was to make 2 of these measurements per day from the start of the rising limb through the end of the receding limb of the CFE hydrograph (only 1 measurement was actually made during the last day of the recession). In addition, 1 measurement was made the day before the rise of the CFE hydrograph, and 1 measurement was made per day during the two days after the recession of the CFE. River-mile 166 study site (94412, former Colorado River above National Canyon near Supai, Arizona, gaging station) Suspended-sediment data collected during the 1996 CFE On March 28 and 29, 1996, point samples were collected at 7 elevations in the flow at 1 stations in the cross-section using a P-61 point-integrating suspended-sediment sampler deployed from the cableway (at stations at 175, 195, 21, 23, 245, 26, 275, 29, 31, and 325 feet on the cableway). On March 29, 1996, an additional depth-integrated sample was collected using a P-61 sampler at the station at 16 feet on the cableway. On each day during March 3 through April 2, 1996, point samples were collected at 7 elevations in the flow at 11 stations in the cross-section (at stations at 16, 175, 195, 21, 23, 245, 26, 275, 29, 31, and 325 feet on the cableway) using a P-61 point-integrating suspended-sediment sampler deployed from the cableway. On these 4 days, additional depth-integrated samples were collected using a P-61 sampler at the stations at 145 and 34 feet on the cableway. All samples were analyzed for suspended-sand concentration and suspended-silt-and-clay concentration (data published in table 5 of Konieczki and others, 1997); grain-size distributions of the suspended sand were analyzed for only those samples collected at stations 245 and 325 feet (cross-section averages of these data published in table 2 of Topping and others, 1999). 22
33 Table 1. Inventory of suspended- and bed-sediment data collected during the three CFEs and analyzed in this report. Continued Bed-sediment data collected during the 1996 CFE None Suspended-sediment data collected during the 24 CFE None Bed-sediment data collected during the 24 CFE None Suspended-sediment data collected during the 28 CFE During March 5 through 13, 28, a total of 29 five-vertical EWI measurements were made using a D-96-A1 depth-integrating sampler deployed from a boat positioned under the tagline (at the former location of the measurement cableway from which data were collected during the 1996 CFE). The sampling protocol was to make 4 EWI measurements per day from the start of the rising limb to the end of the receding limb of the CFE hydrograph. In addition, 3 EWI measurements were made during the two days before the rise of the CFE hydrograph, and 6 EWI measurements were made during the three days after the recession of the CFE. During March 6 through 11, 28, a total of 15 samples were collected using an ISCO 6712 automatic pump sampler. From the day before the start of the rising limb through the day after the end of receding limb of the CFE hydrograph, these samples were collected every hour (except from 12 on March 9 through 12 on March 1, when the pump sampler was inadvertently not launched). During March 5 through 13, 28, a total of 943 suspended-sediment measurements were made using a Nortek 1MHz EasyQ and an OTT 2MHz SLD sideways-looking acoustic-doppler profiler (both of these instruments were used to make each of these 943 measurements). These measurements were made every 15 minutes, and processed for suspended-sand concentration, suspended-sand median grain size, and suspended-silt-and-clay concentration. During this period, an additional 16 measurements were made using either the 1MHz or 2MHz instrument, and were processed for only suspended-sand concentration and suspended-silt-and-clay concentration. These additional one-instrument measurements were made while the other instrument was either shut down for downloading or for repairs to its mount. Both of the instruments rotated on their mounts during the CFE, and the data had to be adjusted to compensate for this rotation. Both mounts were repaired on March 13. Subsequent modifications to these instrument mounts should prevent this rotation in any future CFE. Bed-sediment data collected during the 28 CFE During March 5 through 13, 28, a total of 1 bed-sediment measurements were made using a pipe dredge deployed from a boat positioned under the tagline. Each of these 1 measurements consisted of samples collected at the 3 middle of 5 equally spaced stations across the cross-section under the tagline (these 5 stations were the centroids of each EWI cell). The leftmost and rightmost of the 5 stations were not sampled because of the presence of large boulders and colluvium on the bed on the sides of the crosssection. The sampling protocol was to make 2 of these measurements per day during the first two days of high, steady discharge during the CFE hydrograph. Only 1 measurement per day was made per day during March 5, 6, 9-11, and 13. Despite repeated efforts to sample all 3 stations, a sample could only be collected at the station in the middle of the river on March 5 because the bed at the tagline cross-section was composed mostly of gravel before the rising limb of the CFE. Despite the predominance of gravel on the bed, samples at all 3 stations were collected during 7 of the 1 measurements, and samples at 2 of the 3 stations were collected during 2 of the 1 measurements. 23
34 Table 1. Inventory of suspended- and bed-sediment data collected during the three CFEs and analyzed in this report. Continued River-mile 225 study site (9442, Colorado River above Diamond Creek near Peach Springs, Arizona, gaging station) Suspended-sediment data collected during the 1996 CFE None Bed-sediment data collected during the 1996 CFE None Suspended-sediment data collected during the 24 CFE During November 21 through 3, 24, a total of 28 five-vertical EDI measurements were made from the cableway using either a D-96 or a D-96-A1 depth-integrating sampler. The sampling protocol was to make 4 EDI measurements per day from the second day of the rising limb to the end of the receding limb of the CFE hydrograph. In addition, 3 EDI measurements were made during the two days before the rise of the CFE hydrograph, and 7 EDI measurements were made during the four days after the recession of the CFE. During November 21 through 3, 24, a total of 154 samples were collected using an ISCO 6712 automatic pump sampler. From the day of the start of the rising limb through the day after the end of receding limb of the CFE hydrograph, these samples were collected every hour. During November 21 through 3, 24, a total of 1,56 suspended-sediment measurements were made using a Nortek 1MHz sideways-looking acoustic-doppler profiler. These measurements were made every 15 minutes, and processed for suspended-sand concentration and suspended-silt-and-clay concentration. Bed-sediment data collected during the 24 CFE During November 21 through December 1, 24, a total of 18 bed-sediment measurements were made using a BM-54 sampler deployed from the cableway. Each of these 18 measurements consisted of samples collected at 1 equally spaced stations in the cross-section under the cableway (at least 3 samples had to be collected among the 1 stations to constitute a measurement). Typically, samples could be collected at only 5 of the 1 stations. The sampling protocol was to make 2 of these measurements per day from the start of the rising limb through the end of the receding limb of the CFE hydrograph. In addition, 1 measurement was made per day during the two days before the rise of the CFE hydrograph, and 7 measurements were made during the four days after the recession of the CFE. Suspended-sediment data collected during the 28 CFE During March 5 through 13, 28, a total of 28 five-vertical EDI measurements were made from the cableway using a D-96 depth-integrating sampler. The sampling protocol was to make 4 EDI measurements per day from the second day of the rising limb to the end of the receding limb of the CFE hydrograph. In addition, 2 EDI measurements were made during the day before the rise of the CFE hydrograph, 2 EDI measurements were made during the first day of the rising limb of the CFE hydrograph, and 2 EDI measurements were made during the two days after the recession of the CFE. 24
35 Table 1. Inventory of suspended- and bed-sediment data collected during the three CFEs and analyzed in this report. Continued During March 5 through 13, 28, a total of 163 samples were collected using an ISCO 6712 automatic pump sampler. From the day before the start of the rising limb through the day after the end of receding limb of the CFE hydrograph, these samples were collected every hour. During March 5 through 13, 28, a total of 864 suspended-sediment measurements were made using a Nortek 1MHz and 2MHz EasyQ sideways-looking acoustic-doppler profiler (both of these instruments were used to make each of these 864 measurements). These measurements were made every 15 minutes, and processed for suspended-sand concentration, suspended-sand median grain size, and suspended-siltand-clay concentration. Bed-sediment data collected during the 28 CFE During March 5 through 13, 28, a total of 15 bed-sediment measurements were made using a BM-54 sampler deployed from the cableway. Each of these 15 measurements consisted of samples collected at 5 equally spaced stations in the cross-section under the cableway (at least 3 samples had to be collected among the 5 stations to constitute a measurement). Of these 15 measurements, 11 consisted of samples collected at all 5 stations; the remaining 4 of these 15 measurements consisted of samples collected at 4 of the 5 stations. The sampling protocol was to make 2 of these measurements per day from the start of the rising limb through the end of the receding limb of the CFE hydrograph. In addition, 1 measurement was made per during the one day before the rise of the CFE hydrograph, and during the two days after the recession of the CFE. 24 Lagrangian sampling program During November 22 and 23, 24, 3 replicate single-vertical depth-integrated samples were collected at a total of 31 sampling stations in the middle of the channel between river miles and 85 by one field crew. These samples were collected using a P-61-A1 point-integrating sampler operated in the upward depthintegrating mode deployed from a boat. Two parcels of water were sampled in a Lagrangian reference frame in this sampling program. 28 Lagrangian sampling programs During March 6 through 9, 28, 3 replicate single-vertical depth-integrated samples were collected at a total of 67 sampling stations in the middle of the channel between river miles and 225 by two field crews (one sampling between river miles and 87 on March 6 and 7; one sampling between river miles 87 and 225 on March 7 through 9). These samples were collected using D-96-A1 depth-integrating samplers deployed from two boats. Five parcels of water were sampled in a Lagrangian reference frame in these sampling programs. 25
36 high, steady discharge and passed the River-mile 3 study site approximately 3 hours after the high, steady discharge reached that location. On the second day of sampling, after taking an 11- hour break in camp at river mile 52, this sampling program passed the River-mile 61 study site approximately 19.3 hours after the high, steady discharge arrived at that location and concluded at the River-mile 87 study site approximately 22.2 hours after the high, steady discharge arrived at that location. All suspended-sediment data collected in this study were processed for suspended-sediment concentration using standard USGS methods, with sand-sized material being separated from silt and clay-sized material by wet sieving using a.625-mm stainless steel sieve (Guy, 1969; Knott and others, 1992, 1993). For the 1996 data, grain-size distributions of the material retained on this sieve were either measured at 1/4-φ increments through use of a visual accumulation tube (Federal Interagency Sedimentation Project, 1957, 1958b) or measured at 1-φ increments by wet sieving 6. The visual accumulation tube was calibrated to give results identical to those obtained by dry sieving. For the 24 and 28 data, grain-size distributions of the material retained on the.625- mm sieve were measured at 1/4-φ increments through use of a Beckman Coulter LS-1Q Laser Diffraction Particle Size Analyzer calibrated using dry sieving. Wet sieving results in some silt and clay adhering to the sand retained on the.625 mm sieve. This effect has been observed using electron microscopy (Gordon and others, 21) and has been observed in our laboratory through comparison of results from wet and dry sieving. In this study, the amount of silt and clay retained with the sand during wet sieving was measured using either the visual accumulation tube or the LS- 1Q Laser Diffraction Particle Size Analyzer. Silt and clay concentrations were then computed by adding the amount of silt and clay retained on the.625-mm sieve during the wet-sieving process to the weight of the sediment passing through this sieve. Sand concentrations were computed by subtracting the amount of the silt and clay retained on the.625-mm sieve from the weight of the material retained on this sieve. This approach removes the negative bias in silt and clay concentration and the positive bias in sand concentration observed by Gordon and others (21). The grain-size distributions of the 1996 bed-sediment data were measured through use of dry sieving at 1/2-φ increments; the grain-size distributions of the 24 and 28 bed-sediment data were measured through use of dry sieving at 1/4- φ increments. All dry sieving was conducted using standard 8-inch sieves in a Tyler RO-TAP sieve shaker. Removal of Bias in Data Collected by D-77-Bag-Type Samplers Recent measurements at multiple locations along the Colorado River in Grand Canyon indicate that, on average, the D-77-bag-type sampler oversamples suspended silt and clay by about 5 percent and oversamples suspended sand by about 2 percent relative to the D-96-A1 sampler. Among the various sand size classes, the oversampling is positively correlated with grain size. This oversampling arises because, although both the D-77-bag-type sampler and D-96-type samplers have been shown to sample isokinetically in flumes (Szalona, 1982; Davis, 21), the D-77-bagtype sampler samples nonisokinetically, at a rate lower than the instantaneous flow velocity, when deployed in a river 7 (Sabol and others, 21). This behavior likely arises from backpressure created by the bag unfolding too slowly within the sampler cavity (Pickering, 1983). To make suspendedsediment data collected by D-77-bag-type and D-96-A1 samplers equivalent, bias-correction 6 Only the EDI measurements made during the 1996 CFE using a D-77-bag-type depth-integrating sampler were processed for sand grain size using wet sieving. 7 See Federal Interagency Sedimentation Project (1941) for analyses of the effect of nonisokinetic sampling on measurements of suspended-sediment concentration for various size classes of sediment. 26
37 factors were therefore empirically determined for data collected using a D-77-bag-type sampler. These bias-correction factors were determined using sequential back-to-back samples collected with D-96-A1 and D-77-bag-type samplers at the River-mile 3, 61, 87, and 225 study sites from 23 through 28. The details of these sampler comparisons with the computed D-77 biascorrection factors for each of these study sites are to be published in a forthcoming USGS report. At each study site, the bias-correction factor for each size class was used to convert the suspendedsediment concentration measured by a D-77-bag-type sampler in that size class to be equivalent to that measured by a D-96-A1 sampler. For the purposes of this study, the bias in the median grain size of the suspended sand measured by a D-77-bag-type sampler was removed by first applying the appropriate bias-correction factor to the D-77-measured concentration of sand in each 1/4-φ size class and then computing the median grain size of the suspended sand. Because the bias in the data collected with a D-77-bag-type sampler is caused by the behavior of the bag, this sampling bias is not present in the data collected during the 1996 CFE with a standard rigid-container D-77 depth-integrating sampler. Errors In this study, errors have only been assigned to suspended-sediment data collected using standard depth- or point-integrating suspended-sediment samplers when deployed using the EDI, EWI, or point-sampling methods (samplers and methods described in Edwards and Glysson, 1999). Evaluation of the errors associated with the calibrated pump measurements and acoustic measurements of suspended-sediment concentration and grain size is the subject of ongoing research and is to be published in a forthcoming USGS report. The analyses to date suggest that the errors associated with these two approaches are only slightly larger than those associated with the standard EDI, EWI, or point-sample measurements (Topping and others, 26b), but because these analyses are not yet finalized, no error from these approaches is assigned in this study. Errors associated with the standard EDI, EWI, or point-sample measurements are divided into field and laboratory components, which are combined in quadrature. The field components of these errors consist of both time-averaging and spatial-averaging errors and are computed on the basis of Topping and others (in press). From Topping and others (in press), the 95-percentconfidence-interval field error in the EDI- or EWI-measured velocity-weighted suspended-sand concentration in a cross-section, in units of percent, is: ± %, (8).7 n VERT ntransn VERT the 95-percent-confidence-interval field error in the EDI- or EWI-measured velocity-weighted suspended-sand median grain size in a cross-section, in units of percent, is: ± %, (9).7 n VERT ntransn VERT 2 27
38 and, the 95-percent-confidence-interval field error in the EDI- or EWI-measured velocity-weighted suspended-silt-and-clay concentration in a cross-section, in units of percent, is: ± %, (1).7 n VERT ntransn VERT In equations 8 through 1, n VERT is the number of verticals (that is, sampling stations in a crosssection) and n TRANS is the number of transits at each vertical. In this usage, one transit is defined as the path a depth-integrating suspended-sediment sampler takes either from the water surface to the bed or from the bed to the water surface. Therefore, standard deployment of a depth-integrating sampler at a vertical, where the nozzle is open as the sampler is lowered to the bed and subsequently raised to the surface, consists of two transits. Because collection of point suspendedsediment samples involves greater time averaging than the collection of depth-integrated suspended-sediment samples, the 95-percent-confidence-interval field errors in point-samplemeasured suspended-sand concentration, suspended-sand median grain size, and suspended-siltand-clay concentration in a cross-section consist of only the first of the two terms in equations 8 through 1. The laboratory components of these errors were computed on the basis of the performance of different USGS sediment laboratories and the performance of the USGS sediment laboratory at the USGS Grand Canyon Monitoring and Research Center in the USGS Branch of Quality Systems Sediment Laboratory Quality-Assurance Project (Gordon and Newland, 2; Gordon and others, 2). Most of the samples in this study were processed at the USGS sediment laboratory at the USGS Grand Canyon Monitoring and Research Center. Computations of the laboratory components of the errors were based on the performance of nine different USGS laboratories in their analysis of 151 samples for sand concentration and silt and clay concentration. These computed errors were found to be consistent with those computed for only the USGS Grand Canyon Monitoring and Research Center sediment laboratory over the span of its existence. For both sand concentration and silt and clay concentration, the laboratory processing errors decreased with increasing concentration. The 95-percent-confidence-interval laboratoryprocessing error in C SAND used in this report, in units of percent, is: ±69C.5 SAND %, (11) and the 95-percent-confidence-interval laboratory processing error in silt and clay concentration (C SILT&CLAY ) used in this report, in units of percent, is: ±3.9C.6 SILT &CLAY %. (12) Units of concentration used for C SAND and C SILT&CLAY in equations 11 and 12 are in mg/l. In comparisons between dry sieving and laser-diffraction measurements, the 95-percent-confidenceinterval laboratory processing error in sand median grain size was found to be approximately ±6 percent. Antecedent Conditions for Each Controlled-Flood Experiment (CFE) Brief Description of Sand-Budgeting Approach Construction of meaningful sand budgets for reaches of the Colorado River downstream from Glen Canyon Dam requires an intensive data-collection effort. Large discharge-independent changes in suspended-sand concentration occur over short time scales, of less than one hour, in the Colorado River in Marble and Grand Canyons; these changes in concentration are coupled to 28 2
39 changes in suspended-sand grain size and are driven by upstream changes in the sand supply associated with changes in bed-sand grain size (Topping and others, 2a, 2b, 27a; Rubin and Topping, 21, 28). Because of these discharge-independent changes in suspended-sand concentration, suspended-sediment data have to be collected at a relatively high resolution (that is, at increments of less than an hour) to accurately compute sand loads in Colorado River (Topping and others, 24, 26b, 27b). Such accurate loads are needed to compute meaningful sand budgets for reaches of the Colorado River downstream from Glen Canyon Dam. To collect suspended-sediment data at a sufficiently high resolution, ISCO automatic pump samplers, Sequoia Scientific LISST laser-diffraction instruments, and Nortek EasyQ acoustic-doppler sideways looking profilers were installed at the River-mile 3, 61, 87, and 225 study sites in August 22 (Melis and others, 23; Topping and others, 24, 26b, 27b). To provide information on the state of the sand budget in central Grand Canyon, this network was expanded to include the Rivermile 166 study site through the installation of the first of two acoustic-doppler sideways looking profilers in March 27; an automatic pump sampler was also temporarily installed at this study site during the 28 CFE. Sand loads and silt and clay loads were computed for the applicable study sites on the Colorado River for the periods leading up to and including each CFE using the highest resolution data available (typically 15-minute resolution for the 24 and 28 CFEs) and the standard USGS methods described in Porterfield (1972). Sand loads were increased by 5 percent at each study site to include bedload (after Rubin and others, 21) and the load in the "unsampled zone" near the bed that is not sampled by depth-integrating samplers (fig. 1 in Edwards and Glysson, 1999) as estimated based on Topping and others (27a). In addition to accurate high-resolution sediment-transport data on the Colorado River, sand budgets for reaches of the Colorado River downstream from Glen Canyon Dam must also include accurate measurements and/or model estimates of the sand supplied to each reach by tributaries. Data collection in these tributaries is difficult because of (1) their remote, ephemeral, and flashy nature and (2) the potential of extremely high suspended-sand concentrations during floods; for example, one tributary, the Paria River, has some of the highest suspended-sand concentrations in the world when it is in flood (Beverage and Culbertson, 1964; Topping, 1997). Most of the uncertainty in the reach-scale sand budgets for the Colorado River currently arises from errors in computed tributary sand loads during floods. Fortunately, the two most important sand-supplying tributaries to the Colorado in Marble and Grand Canyons have a long history of sediment-transport data collection by the USGS. These tributaries are the Paria River, where sediment-transport data were first collected in October 1947, and the Little Colorado River, where sediment-transport data were first collected in July Substantial gaps in the sediment-transport data collected in these tributaries occurred in the 197s through early 199s. In response to the need for increased information on the sand delivery to the Colorado River from these tributaries to assess management strategies for Glen Canyon Dam, the USGS focused more-intensive data-collection activities on these two tributaries beginning in the late 199s. The other sand-supplying tributary with substantial historical sediment-transport data is Kanab Creek, where sediment-transport data were first collected in December To improve the real-time estimates of sand transport in the Paria River, Topping (1997) developed and tested a physically based sediment-transport model coupled to average geomorphic and sedimentologic conditions in the channel and floodplains of the Paria River. Support for this average modeling approach was provided in Rubin and Topping (21), who showed that sand transport in the largely alluvial Paria River is essentially "flow regulated" with no systematic hysteresis in suspended-sand concentration caused by changes in the grain size of the bed sand 29
40 during floods. Tests of this model using extensive data from 1947 through 1983 and from a period of four large floods in 1997 indicated that this model predicted sand loads within 2 percent of the measurements during most floods, and well within 2 percent during the 1997 floods. However, in subsequent tests against data collected during large floods in 23 and 24, it became clear that the differences in the model predictions and measurements of sand loads during individual floods could be substantial and biased. Therefore, an approach analogous to the "shifting-control method" used to compute discharge in rivers (described in Rantz and others, 1982) was developed to apply smoothed time-varying shifts to the model predictions of sand transport to increase the agreement between the model-predicted and measured sand transport. This is the approach used in this study to compute sand loads in the Paria River. A slightly different approach is used to compute sand loads in the more complicated Little Colorado River. Most of the sand-transport data in the Little Colorado River is collected at a location within the nonalluvial bedrock gorge of this river. Unlike sand transport in the Paria River, sand transport in this nonalluvial river is controlled to a measurable degree by changes in the upstream supply of sand. Modeling efforts by the USGS to develop more accurate methods for computing real-time sand loads in the Little Colorado River are ongoing. Because these models are still incomplete, a shifting sand rating curve 8 approach was used in this study that weights the "elevation" of the sand rating curve within the "cloud" of sand-concentration data in dischargeconcentration space by the number of measurements within that part of the cloud. Because the contributions of sand to the Colorado River from both Kanab and Havasu Creeks are much smaller than the sand contributions of the Paria and Little Colorado Rivers, estimates of the sand supplied by these other two large tributaries are included with the estimates of the sand supplied by the other small tributaries described in the next paragraph. The other smaller tributaries, hereafter referred to as the "lesser tributaries," have only very limited sediment-transport data and are the most difficult parts of the sand budgeting to constrain. The first comprehensive sediment budget for the lesser tributaries to lower Glen and Marble Canyons was completed by the Bureau of Reclamation in the late 195s as part of its planning activities for the construction of Marble Canyon Dam (unpublished memoranda from the Denver Technical Center files of the Bureau of Reclamation). During the late 199s, a second sediment budget for these tributaries was completed by Webb and others (2), albeit with large uncertainties owing to the small size of the available sediment-transport dataset. To rectify the large uncertainties associated with sand loads in the lesser tributaries, downward-looking Campbell Scientific SR-5 stage gages and sediment-sampling equipment were installed in 21 on one key lesser tributary in lower Glen Canyon 9 and in 2 (Schmidt and others, 27; Griffiths and others, 21) and 21, at six locations on five lesser tributaries in Marble Canyon. Data collected in these tributaries suggest that the lesser tributaries in Marble Canyon between river miles and 17 cumulatively supply, on average, about 1 percent of the sand supplied by the Paria River in a given year 1. This small percentage arises, not because the concentrations of suspended sand are low, but because the durations of floods are much shorter and the peak discharges of floods in these tributaries are much smaller in these tributaries than for floods of comparable recurrence interval in the Paria River. These data also suggest that the amount of sand supplied by the tributaries 8 A sand rating curve relates the concentration of suspended sand to the discharge of water. 9 This monitored tributary, Water Holes Canyon, makes up about 23 percent of the total lesser-tributary drainage area in this reach. 1 The monitored lesser tributaries between river-miles and 17 cumulatively make up 77 percent of the total drainage area of the lesser tributaries in this part of Marble Canyon. 3
41 downstream from about river mile 17 is nonzero, but very small 11. From suspended-sediment samples collected between 21 and 29, the ratio of suspended sand to suspended silt and clay in floods in the lesser tributaries downstream from river mile 17 is about 1/5. Therefore, in this study: (1) the sand loads in the lesser tributaries in lower Glen Canyon are estimated relative to the flood activity in the one tributary monitored in that reach, (2) the sand loads in the lesser tributaries in upper Marble Canyon are estimated as 1 percent of the Paria sand load, (3) the cumulative sand loads of the lesser tributaries in lower Marble Canyon are estimated to be approximately 2 percent of the measured increase in the silt and clay loads between the River-mile 3 and 61 study sites over time scales of years (this assumption is consistent with the integral constraint that changes in the silt and clay budget in long reaches must equal zero over longer time scales in the Colorado River), (4) the timing of the sand inputs from the lesser tributaries in lower Marble Canyon is set equal to the timing of the largest increases in silt and clay load between the River-mile 3 and 61 study sites, and (5) the sand loads of the lesser tributaries between each of the River-miles 61 and 87, 87 and 166, and 166 and 225 study sites are estimated by the same approach outlined in the two previous steps. In the sand-budget computations in this study, uncertainties were applied that represent the largest potential persistent bias in the computed sand loads at each site on the Colorado, Paria, and Little Colorado Rivers. These uncertainties include the greatest likely persistent bias in both the discharge of water and the concentration of suspended sand. For example, at a given site, if the discharge of water were, on average, measured to be 3 percent high because of either instrumentation bias or cross-section effects, and the suspended-sand concentration were, on average, measured to be 2 percent high, this would result in the computed sand loads being, on average, 5 percent high. At some study sites, the uncertainties in the discharge of water and suspended-sand concentration are likely positively correlated, whereas, at other sites, these uncertainties are likely negatively correlated. Unfortunately, there is no way to know the real magnitudes or signs of the biases giving rise to these uncertainties because there is no independent measure of either the discharge of water or the concentration of suspended sand. Recent field measurements on the Colorado have indicated that EWI measurements at adjacent cross-section can systematically disagree by several percent or more over periods of years. Because no net aggradation or degradation on this scale can be occurring between these adjacent cross-sections, this difference cannot be real and must be included in an estimate of uncertainty. The uncertainty in the discharge of water in the Colorado River over months is likely at most several percent, as indicated by water balances conducted between the various study sites. The uncertainties associated with the sand loads in the tributaries are more poorly constrained than those associated with the sand loads in the Colorado River (Topping and others, 2a). The best way to treat the uncertainties in the sand loads is therefore to (1) realize that they cannot be zero, (2) make every effort to reduce detected biases in the field, and (3) assign values to the uncertainties that are reasonable. The uncertainties chosen for the sand budgets in this study are, therefore, 5 percent for the sand loads at the study sites on the Colorado River 12, 1 percent for the sand loads in the Paria and Little Colorado Rivers 13, and 5 percent for the sand loads in the lesser tributaries 14, Kanab Creek, and Havasu Creek. 11 The monitored lesser tributaries between river-miles 17 and 61 cumulatively make up 39 percent of the total drainage area of the lesser tributaries in this part of Marble Canyon. 12 This value is identical to the uncertainty used for the Colorado River data in Topping and others (2a). 13 This value is half of the uncertainty used for the Paria and Little Colorado River data in Topping and others (2a). 31
42 Sand Enrichment in Each Reach Before the 24 and 28 CFEs Because the 24 and 28 CFEs were very different, the sand-budget "accounting periods" antecedent to these two experiments were of different durations. In this usage, "accounting period" is defined as the period from the zero time at which sand budgeting begins until the beginning of the rising limb of a controlled flood. As described in Topping and others (26a), the 24 CFE was designed to test the hypothesis that a sufficiently large single-season input of sand from the Paria River could be retained in the channel of the Colorado River through reduced dam releases and then redistributed into sandbars during a relatively short-duration artificial flood released from Glen Canyon Dam. In essence, this experiment was a test of experimental option two suggested by Rubin and others (22). Therefore, the accounting period antecedent to the 24 CFE began at the beginning of the sediment-input season on July 1, 24, (see definition of "sediment year" in Topping and others, 2a) and extended until the start of the rising limb of the November 24 controlled-flood release. The design of the 28 CFE was different from the design of the 24 CFE. Hence the accounting period antecedent to the 28 CFE began upon recession of the 24 CFE and extended until the start of the rising limb of the March 28 controlled-flood release. Planning for the 28 CFE started in response to the extremely large quantity of sand supplied by the Paria River in October 26. During October 26, a flood with a peak discharge of 5,2 ft 3 /s on the Paria River was followed one week later by a flood with a peak discharge of 5,3 ft 3 /s. A flood with a peak discharge in this range has a recurrence interval of about 7 years on the Paria River annual-maximum or partial-duration flood series (Topping, 1997). Thus, two 7- year flood events occurred on the Paria River within about a week. These events together supplied about 1.3 million metric tons of sand to the Colorado River. Because other large sand inputs occurred from both the Paria and Little Colorado Rivers, and dam releases were relatively low between October 26 and the controlled flood in March 28, the 28 CFE became a test of the degree of sandbar building that could occur in Marble and Grand Canyons given a much higher than average level of sand enrichment in the system. Because the antecedent conditions for the 28 CFE are relatively rare, results from the 28 CFE cannot provide guidance on the degree of sandbar building that could occur if controlled floods were conducted relatively frequently with more typical sand-enrichment conditions, as suggested in the conclusions of Topping and others (26a). Because the first acoustic-doppler profiler was not deployed at the River-mile 166 study site until March 27, part way through the accounting period, the level of sand enrichment during the accounting period antecedent to the 28 CFE could only be computed for the two reaches between the River-mile 87 and 225 study sites, the east-central and west-central Grand Canyon reaches, combined into a single reach. The sand supply from the various sources and the sand export past the various study sites during the accounting periods antecedent to the 24 and 28 CFEs are provided in table 2. Sand enrichment in each reach during the accounting periods antecedent to the 24 and 28 CFEs is provided in table 3. No sand enrichment or depletion can be demonstrated in a reach when the propagated uncertainties are larger than the absolute value of the change in sand storage. Finally, it is important to note that the "sand enrichment" computed by this sand-budgeting approach does not include the "background" sand that was stored in each reach before the antecedent accounting periods. The same level of sand enrichment computed by this sand-budgeting approach may result 14 Because of the almost infinitely greater resolution of the data available upon the completion of this report than was available in 2, this value is considerably less than the factor of 3 uncertainty used for sand transport in the lesser tributaries in Topping and others (2a). 32
43 Table 2. Sand supply and sand export during the accounting periods antecedent to the 24 and 28 CFEs. Sand inputs from the following sources during the accounting periods lower Glen Canyon tributaries Antecedent 24 CFE sand input with uncertainty during the accounting period (million metric tons) Tributaries less active than before 28 CFE, thus equating to less sand enrichment than before 28 CFE Antecedent 28 CFE sand input with uncertainty during the accounting period (million metric tons) Tributaries more active than before 24 CFE, thus equating to more sand enrichment than before 24 CFE Paria River.617± ±.335 upper Marble Canyon lesser tributaries.62±.31*.335±.168* lower Marble Canyon lesser tributaries *.96±.48* Little Colorado River.18± ±.32 eastern Grand Canyon lesser tributaries.37±.19*.81±.41* combined east- and west-central Grand Canyon tributaries.12±.51*.372±.186* Sand export past the following study sites during the accounting periods Antecedent 24 CFE sand export with uncertainty during the accounting period (million metric tons) Antecedent 28 CFE sand export with uncertainty during the accounting period (million metric tons) River-mile 3.296± ±.125 River-mile ± ±.13 River-mile ± ±.216 River-mile ± ±.179 *These values agree within the large error bars of the predictions of Webb and others (2). Table 3. Sand enrichment in each reach during the accounting periods antecedent to the 24 and 28 CFEs. [Reaches without demonstrable change in sand storage (that is, propagated uncertainty is much greater than the absolute value of net change in sand storage) indicated by red type.] Reach lower Glen Canyon Antecedent 24 CFE sand enrichment in reach with propagated uncertainty during the accounting period (million metric tons) Less than before Antecedent 28 CFE sand enrichment in reach with propagated uncertainty during the accounting period (million metric tons) More than before 24 CFE 28 CFE upper Marble Canyon +.383± ±.628 lower Marble Canyon +.114± ±.276 eastern Grand Canyon -.14± ±.662 combined east-central and west-central Grand Canyon +.156± ±
44 in very different suspended-sand concentrations and grain sizes during a controlled flood depending on both the grain size of the "enriching sand" and if the amount of sand in background storage is relatively small or large compared to the level of sand enrichment. Estimation of the Relative Levels of Sand Enrichment Antecedent to the 1996, 24, and 28 CFEs Unfortunately, during the period antecedent to the 1996 CFE, no sediment-transport monitoring program on the Colorado River existed, the sediment-transport monitoring program on the two major tributaries (that is, the Paria and Little Colorado Rivers) was less robust, and extremely few data existed on sediment-transport in the lesser tributaries. Therefore, a method alternative to that presented in the previous section must be used to compare the levels of tributary sand enrichment in the Colorado River antecedent to the 1996 CFE relative to those antecedent to the 24 and 28 CFEs. This simple alternative method uses (1) the same method as above for computing the sand supply from the Paria and Little Colorado Rivers during the year leading up to each CFE and (2) the sand-transport results from Topping and others (2a) to evaluate whether it is likely that the dam releases during the year leading up to each CFE were likely to retain or export tributary-supplied sand in the Colorado River in Marble and Grand Canyons past the River-mile 87 study site. As shown in table 4, the year antecedent to the 1996 CFE had the conditions least likely to result in the accumulation of tributary-supplied sand in the Colorado River between the Rivermile and 87 study sites. This year was characterized by both the highest discharges and the lowest sand inputs from the two major tributaries. On the basis of sand-supply information alone, the year leading up to the 28 CFE was the year most likely to result in the accumulation of tributarysupplied sand in the Colorado River in Marble Canyon and eastern Grand Canyon. On the basis of discharge alone, the year leading up to the 24 CFE was only slightly more likely than the year leading up to the 28 CFE to result in the accumulation of tributary-supplied sand in the Colorado River in Marble Canyon and eastern Grand Canyon. Therefore, these results, combined with the detailed sand-budgeting results in the previous section, suggest that (1) the 1996 CFE was likely the least tributary-sand-enriched of any of the three CFEs, (2) the 28 CFE was by far the most tributary-sand-enriched of any of the three CFEs, and (3) the 24 CFE was in the middle of Table 4. Comparison of discharge and sand supply during the years leading up to each CFE. [Conditions most likely to be conducive to sand accumulation in the Colorado River upstream from the River-mile 87 study site are shown in green, conditions least likely to be conducive to sand accumulation are shown in red.] CFE Median dam release during year leading up Sand supply during year leading up to controlled flood to controlled flood Paria River Little Colorado River ,4 ft 3 /s* ~.38 million metric tons ~.4 million metric tons 24 1,5 ft 3 /s** ~.63 million metric tons ~.19 million metric tons 28 11,3 ft 3 /s ~.92 million metric tons ~1.12 million metric tons * This discharge would result in either no accumulation of the tributary-supplied sand or net scour of sand already stored in the Colorado River during the year prior to the CFE (after Topping and others, 2a). ** This discharge is low enough to be within the range in Topping and others (2a) under which net sand accumulation is most likely to occur. 34
45 the three CFEs with respect to sand enrichment from tributaries, with the most tributary-sandenriched reach being upper Marble Canyon. Note that the analysis in table 4 has no bearing on possible changes in background sand storage in the Colorado River occurring over the multi-year periods between the CFEs (for example, decreases in sand storage arising from possible long-term scour of sand from the Colorado River in Marble Canyon and eastern Grand Canyon). Analysis Data Collected at Each Study Site During Each CFE Flood hydrographs, and the suspended-sediment and bed-sand data collected at each study site during each CFE are presented in figure 4. As first observed by Rubin and others (1998) during the 1996 CFE, and subsequently observed during the 24 and 28 CFEs, the general tendencies at all study sites during the high, steady discharge part of a CFE are: (1) the suspended-silt-and-clay concentration decreases over time, indicating depletion of the upstream supply of silt and clay, (2) the suspended-sand concentration decreases over time, indicating depletion of the upstream supply of sand, (3) the grain-size distribution of the suspended sand coarsens over time as the upstream supply of sand becomes depleted, (4) the grain-size distribution of the bed sand coarsens over time as the upstream supply of sand becomes depleted, and (5) the fraction of the bed sand finer than about.125 mm 15 decreases over time as the upstream supply becomes depleted. More analyses focused on comparing the behaviors of the suspended and bed sediment at each study site during all three CFEs, and at all study sites during each CFE are provided below. Data collection increased substantially, both temporally and spatially, between the 1996 and 24 CFEs, with further improvement in data resolution and quality between the 24 and 28 CFEs (fig. 4). During each subsequent CFE, substantial effort was made to increase data resolution and reduce error. For example, during the 1996 CFE, only 3 EDI measurements and no bedsediment measurements were made at the River-mile 61 study site, whereas during the 24 CFE, 52 EWI measurements, 191 pump samples, 1,486 single-frequency acoustic suspended-sediment measurements, and 21 five-station bed-sediment measurements were made at this study site. Because of the relatively large degree of sandbar scour in Marble Canyon during the 1996 CFE (Schmidt, 1999), the River-mile 3 study site was added before the 24 CFE to improve spatial data resolution within Marble Canyon. To improve data resolution in the western part of Grand Canyon, the River-mile 225 study site was also added before the 24 CFE, although the Rivermile 166 study site was dropped, leading to a decrease in data resolution in the central part of Grand Canyon. The biggest single improvement between the 1996 and 24 CFEs was the introduction of the use of single-frequency acoustics to collect 15-minute-resolution suspendedsediment data at the River-miles 3, 61, and 225 study sites and the use of three-frequency acoustics to collect 15-minute-resolution suspended-sediment data at the River-mile 87 study site. During the 28 CFE, data were collected at all study sites where data were collected during either the 1996 or 24 CFEs, including the River-mile 166 study site. On the basis of the analysis of the errors associated with the use of depth-integrating samplers in Topping and others (in press), errors in the EDI and EWI measurements made during the 28 CFE were reduced by 15 This is roughly the fraction of sand finer than the median size of the sand supplied by most tributaries 35
46 increasing the number of transits at each vertical. The other major improvement between the 24 and 28 CFEs was the addition of two-frequency acoustics at the River-mile 3, 61, 166, and 225 study sites. This improvement allowed 15-minute-resolution measurements of suspended-sand median grain size to be made at the River-mile 3, 61, 87, 166, and 225 study sites; this increase in data resolution allowed much better evaluation of the changes in the sand supply at each study site during the 28 CFE than was previously possible. Furthermore, improvements in the deployments, both in the mounting of the instruments and through the addition of more measurement cells, and improvements in instrument maintenance resulted in a decrease in the noise in the acoustic data between the 24 and 28 CFEs. One new problem that occurred during the 28 CFE and resulted in a decrease in data resolution during the 28 CFE was the breakage of the mounts for the pump intake tubes at the River-mile 3 and 61 study sites. This was a result of an oversight in maintenance at these sites before the 28 CFE. The high-resolution acoustic suspended-sediment data are normally used in combination with the other suspended-sediment data to compute suspended-silt-and-clay concentration and load, suspended-sand concentration and load, and suspended-sand median grain size when the acoustic data are in general agreement with the EDI or EWI measurements. However, during both the 24 and 28 CFEs, there are periods when the acoustic data are systematically biased as a result of grain-size effects; the acoustic data from these periods are not used. These grain-size related biases in concentration are evident in (1) the acoustic measurements of suspended-silt-and-clay concentration during most of the 24 and 28 CFE hydrographs at all study sites and (2) the acoustic measurements of suspended-sand concentration and median grain size during the rising limb of the 24 and 28 CFEs at the River-mile 3 and 61 study sites (fig. 4). Laser-diffraction analyses in the laboratory indicate that suspended silt and clay in the Colorado River in Marble and Grand Canyons during periods of normal dam operations (that is, not during controlled floods) is dominated by clay-sized particles. These analyses indicate, however, that the suspended silt and clay during controlled floods is dominated by silt-sized particles that, as shown below, are winnowed from the bed. The data used at all study sites to calibrate measurements of acoustic attenuation to the concentrations of suspended silt and clay in the EDI or EWI-measurement cross-sections (method described in Topping and others, 27b) are the claydominated silt-and-clay-concentration data that are more typical of most conditions in the Colorado River in Marble and Grand Canyons. By virtue of this approach, the agreement between acoustic and physical measurements of suspended-silt-and-clay concentration in the Colorado River during normal dam operations tends to be excellent. However, because the relation between silt and clay concentration and acoustic attenuation is sensitive to particle size (Urick, 1948; Flammer, 1962), and the particle size of the silt and clay during controlled floods is very different from that during normal dam operations, the acoustic measurements of silt and clay concentration during controlled floods can be less accurate, especially during the rising limbs. Thus, at all study sites, the acoustic measurements of suspended silt and clay concentration were excluded from further analyses and sediment budgeting during periods of substantial disagreement between these measurements and physical measurements (EDI, EWI, or calibrated pump samples) of suspended-silt-and-clay concentration. "Substantial disagreement" is defined to be when the acoustic measurements of suspended-silt-and-clay concentration lie significantly outside the 95-percent confidence intervals associated with the EDI or EWI measurements of suspended-silt-and-clay concentration. Although typically excellent, the agreement between the acoustic measurements and physical measurements of suspended-sand concentration and median grain size can also be quite poor during periods of highly anomalous grain size. Such periods typically lasted less than 12 hours and 36
47 occurred during parts of the rising limbs of 24 and 28 CFEs only at the River-mile 3 and 61 study sites (figs. 4D-E, G-H). No such periods of substantial disagreement were observed anywhere downstream from these sites during either CFE. Owing to the effects of particle attenuation and backscatter on acoustic data of different frequencies (for example, Flammer, 1962; Thorne and Campbell, 1992; Thorne and others, 1993; Thorne and Hanes, 22), high concentrations of suspended sand with an anomalously fine grain size may result in acoustic measurements of suspended-sand concentration that are too high or too low, depending on the frequency at which the acoustic measurements are made. During the 24 CFE, acoustic measurements of suspended-sand concentration were only made at the River-mile 3 and 61 study sites with 1 MHz acoustic- Doppler profilers. Upon fining of the suspended sand during the initial part of the rising limb at these study sites, the acoustic measurements of suspended-sand concentration began to underpredict the physical measurements of suspended-sand concentration. This problem reoccurred at these two study sites, but in an opposing sense, during the 28 CFE. During the 28 CFE, acoustic measurements of suspended-sand concentration were made at these study sites using a two-frequency approach employing both 1 MHz and 2 MHz acoustic-doppler profilers. Upon much greater fining of the suspended sand during the initial part of the rising limb of the 28 CFE due to extreme fining of the bed sand 16 at these study sites, the two-frequency acoustic measurements of suspended-sand concentration began to overpredict the physical measurements of suspended-sand concentration. Associated with this overprediction of suspended-sand concentration was an underprediction of the median grain size of the suspended sand. Therefore, the acoustic measurements of suspended-sand concentration and grain size were excluded from the further analyses and sediment budgeting presented in this report during the periods of substantial Figure 4 (next pages). Hydrographs, suspended-sediment data, and bed-sand data collected at each study site during each CFE. Solid green vertical lines indicate the beginning and end of the high, steady discharge part of a controlled flood at a given site; dashed green vertical lines indicate the beginning of the rising limb and end of receding limb of a controlled flood at a given site. Error bars for the EDI, EWI, or point suspended-sediment concentration and grain-size data indicate the 95- percent confidence interval associated with these measurements (incorporating the field and laboratory errors described above). Error bars for the bed-sediment data are one standard error, indicating the 67-percent confidence interval associated with the mean value of the median grain size or <.125-mm sand fraction among the stations sampled across the cross-section in each bedsediment measurement. Q is water discharge, C SAND is the velocity-weighted concentration of suspended sand in the cross-section, C SILT&CLAY is the velocity-weighted concentration of suspended silt and clay in the cross-section, and D 5 is either the median grain-size of the bed sand or the velocity-weighted median grain size of the suspended sand in the cross-section. Hydrograph and data collected at (A) the River-mile study site during the 1996 CFE; (B) the River-mile study site during the 24 CFE; (C) the River-mile study site during the 28 CFE; (D) the River-mile 3 study site during the 24 CFE; (E) the River-mile 3 study site during the 28 CFE; (F) the Rivermile 61 study site during the 1996 CFE; (G) the River-mile 61 study site during the 24 CFE; (H) the River-mile 61 study site during the 28 CFE; (I) the River-mile 87 study site during the 1996 CFE; (J) the River-mile 87 study site during the 24 CFE; (K) the River-mile 87 study site during the 28 CFE; (L) the River-mile 166 study site during the 1996 CFE; (M) the River-mile 166 study site during the 24 CFE; (N) the River-mile 225 study site during the 24 CFE; and (O) the Rivermile 225 study site during the 28 CFE. 16 The bed sand fined by a factor of two, from a median size of about.3 mm to an extremely fine value of.15 mm, during the initial part of the rising limb of the 28 CFE. This degree of fining has never before been observed during the rising limb of any flood in the Colorado River in Marble or Grand Canyons. The only time this degree of bed fining has been observed was in uppermost Marble Canyon in September 1998 immediately following two large floods on the Paria River (Topping and others, 2b). 37
48 A 1996 CONTROLLED-FLOOD EXPERIMENT RIVER-MILE STUDY SITE Q, IN CUBIC FEET PER SECOND C SAND, IN MILLIGRAMS PER LITER SUSPENDED-SAND D, IN MILLIMETERS 5 BED-SAND D, IN MILLIMETERS 5 C SILT & CLAY, IN MILLIGRAMS PER LITER 5, 4, 3, 2, 1, /25/1996 3/26/1996 NO BED-SEDIMENT SAMPLES COLLECTED 3/27/1996 3/28/1996 3/29/1996 3/3/1996 3/31/1996 DATE 4/1/1996 4/2/1996 4/3/1996 4/4/1996 4/5/1996 EDI EDI EDI 4/6/ PERCENT BED SAND FINER THAN.125 mm 38
49 B 24 CONTROLLED-FLOOD EXPERIMENT RIVER-MILE STUDY SITE Q, IN CUBIC FEET PER SECOND C SAND, IN MILLIGRAMS PER LITER SUSPENDED-SAND D, IN MILLIMETERS 5 BED-SAND D, IN MILLIMETERS 5 C SILT & CLAY, IN MILLIGRAMS PER LITER 5, 4, 3, 2, 1, Figure 4. Continued. 11/2/24 NO BED-SEDIMENT SAMPLES COLLECTED 11/21/24 11/22/24 11/23/24 DATE 11/24/24 11/25/24 11/26/24 EDI EDI EDI PERCENT BED SAND FINER THAN.125 mm 39
50 C 28 CONTROLLED-FLOOD EXPERIMENT RIVER-MILE STUDY SITE Q, IN CUBIC FEET PER SECOND C SAND, IN MILLIGRAMS PER LITER SUSPENDED-SAND D, IN MILLIMETERS 5 BED-SAND D, IN MILLIMETERS 5 C SILT & CLAY, IN MILLIGRAMS PER LITER 5, 4, 3, 2, 1, /4/28 NO BED-SEDIMENT SAMPLES COLLECTED 3/5/28 3/6/28 3/7/28 3/8/28 3/9/28 3/1/28 EDI EDI EDI PERCENT BED SAND FINER THAN.125 mm Figure 4. Continued. DATE 4
51 D 24 CONTROLLED-FLOOD EXPERIMENT RIVER-MILE 3 STUDY SITE Q, IN CUBIC FEET PER SECOND C SAND, IN MILLIGRAMS PER LITER SUSPENDED-SAND D, IN MILLIMETERS 5 BED-SAND D, IN MILLIMETERS 5 C SILT & CLAY, IN MILLIGRAMS PER LITER 5, 4, 3, 2, 1, 5, 4, 3, 2, 1, , 5, 4, 3, 2, 1, Figure 4. Continued. 11/2/24 PUMP EWI D 5 11/21/24 11/22/24 11/23/24 DATE 41 11/24/24 % <.125 mm 11/25/24 ACOUSTIC PUMP EWI ACOUSTIC PUMP EWI 11/26/ PERCENT BED SAND FINER THAN.125 mm
52 E 28 CONTROLLED-FLOOD EXPERIMENT RIVER-MILE 3 STUDY SITE Q, IN CUBIC FEET PER SECOND C SAND, IN MILLIGRAMS PER LITER SUSPENDED-SAND D, IN MILLIMETERS 5 BED-SAND D, IN MILLIMETERS 5 C SILT & CLAY, IN MILLIGRAMS PER LITER 5, 4, 3, 2, 1, 5, 4, 3, 2, 1, , 5, 4, 3, 2, 1, Figure 4. Continued. 3/4/28 ACOUSTIC PUMP EWI D 5 3/5/28 3/6/28 3/7/28 DATE 42 3/8/28 ACOUSTIC PUMP EWI % <.125 mm 3/9/28 ACOUSTIC PUMP EWI 3/1/ PERCENT BED SAND FINER THAN.125 mm
53 F 1996 CONTROLLED-FLOOD EXPERIMENT RIVER-MILE 61 STUDY SITE Q, IN CUBIC FEET PER SECOND C SAND, IN MILLIGRAMS PER LITER SUSPENDED-SAND D, IN MILLIMETERS 5 BED-SAND D, IN MILLIMETERS 5 C SILT & CLAY, IN MILLIGRAMS PER LITER 5, 4, 3, 2, 1, 5, 4, 3, 2, 1, , 5, 4, 3, 2, 1, 3/25/1996 Figure 4. Continued. 3/26/1996 NO BED-SEDIMENT SAMPLES COLLECTED 3/27/1996 3/28/1996 3/29/1996 3/3/1996 3/31/1996 DATE 43 4/1/1996 4/2/1996 4/3/1996 4/4/1996 4/5/1996 EDI EDI EDI 4/6/ PERCENT BED SAND FINER THAN.125 mm
54 G 24 CONTROLLED-FLOOD EXPERIMENT RIVER-MILE 61 STUDY SITE Q, IN CUBIC FEET PER SECOND C SAND, IN MILLIGRAMS PER LITER SUSPENDED-SAND D, IN MILLIMETERS 5 BED-SAND D, IN MILLIMETERS 5 C SILT & CLAY, IN MILLIGRAMS PER LITER 5, 4, 3, 2, 1, 5, 4, 3, 2, 1, , 5, 4, 3, 2, 1, 11/2/24 Figure 4. Continued. PUMP EWI 11/21/24 D 5 11/22/24 11/23/24 DATE 44 11/24/24 11/25/24 ACOUSTIC PUMP EWI % <.125 mm ACOUSTIC PUMP EWI 11/26/24 11/27/ PERCENT BED SAND FINER THAN.125 mm
55 H 28 CONTROLLED-FLOOD EXPERIMENT RIVER-MILE 61 STUDY SITE Q, IN CUBIC FEET PER SECOND C SAND, IN MILLIGRAMS PER LITER SUSPENDED-SAND D, IN MILLIMETERS 5 BED-SAND D, IN MILLIMETERS 5 C SILT & CLAY, IN MILLIGRAMS PER LITER 5, 4, 3, 2, 1, 5, 4, 3, 2, 1, , 5, 4, 3, 2, 1, 3/4/28 Figure 4. Continued. 3/5/28 3/6/28 D 5 3/7/28 DATE 45 3/8/28 3/9/28 ACOUSTIC PUMP EWI ACOUSTIC PUMP EWI % <.125 mm ACOUSTIC PUMP EWI 3/1/28 3/11/ PERCENT BED SAND FINER THAN.125 mm
56 I 1996 CONTROLLED-FLOOD EXPERIMENT RIVER-MILE 87 STUDY SITE Q, IN CUBIC FEET PER SECOND C SAND, IN MILLIGRAMS PER LITER SUSPENDED-SAND D, IN MILLIMETERS 5 5, 4, 3, 2, 1, 5, 4, 3, 2, 1, EDI EDI (P-61 at 2 verticals) POINT-SAMPLE MEAN EDI EDI (P-61 at 2 verticals) POINT-SAMPLE MEAN BED-SAND D, IN MILLIMETERS D 5 % <.125 mm PERCENT BED SAND FINER THAN.125 mm C SILT & CLAY, IN MILLIGRAMS PER LITER 6, 5, 4, 3, 2, 1, 3/25/1996 3/26/1996 3/27/1996 3/28/1996 3/29/1996 3/3/1996 3/31/1996 4/1/1996 EDI EDI (P-61 at 2 verticals) POINT-SAMPLE MEAN 4/2/1996 4/3/1996 4/4/1996 4/5/1996 4/6/1996 Figure 4. Continued. DATE 46
57 J 24 CONTROLLED-FLOOD EXPERIMENT RIVER-MILE 87 STUDY SITE Q, IN CUBIC FEET PER SECOND C SAND, IN MILLIGRAMS PER LITER SUSPENDED-SAND D, IN MILLIMETERS 5 BED-SAND D, IN MILLIMETERS 5 C SILT & CLAY, IN MILLIGRAMS PER LITER 5, 4, 3, 2, 1, 5, 4, 3, 2, 1, , 5, 4, 3, 2, 1, 11/2/24 Figure 4. Continued. D 5 ACOUSTIC PUMP EDI 11/21/24 11/22/24 11/23/24 DATE 47 11/24/24 11/25/24 ACOUSTIC PUMP EDI ACOUSTIC PUMP EDI % <.125 mm 11/26/24 11/27/ PERCENT BED SAND FINER THAN.125 mm
58 K 28 CONTROLLED-FLOOD EXPERIMENT RIVER-MILE 87 STUDY SITE Q, IN CUBIC FEET PER SECOND C SAND, IN MILLIGRAMS PER LITER SUSPENDED-SAND D, IN MILLIMETERS 5 BED-SAND D, IN MILLIMETERS 5 C SILT & CLAY, IN MILLIGRAMS PER LITER 5, 4, 3, 2, 1, 5, 4, 3, 2, 1, , 5, 4, 3, 2, 1, 3/4/28 Figure 4. Continued. 3/5/28 3/6/28 D 5 3/7/28 DATE 48 3/8/28 3/9/28 ACOUSTIC PUMP EDI ACOUSTIC PUMP EDI % <.125 mm ACOUSTIC PUMP EDI 3/1/28 3/11/ PERCENT BED SAND FINER THAN.125 mm
59 L 1996 CONTROLLED-FLOOD EXPERIMENT RIVER-MILE 166 STUDY SITE Q, IN CUBIC FEET PER SECOND C SAND, IN MILLIGRAMS PER LITER SUSPENDED-SAND D, IN MILLIMETERS 5 BED-SAND D, IN MILLIMETERS 5 C SILT & CLAY, IN MILLIGRAMS PER LITER 5, 4, 3, 2, 1, 5, 4, 3, 2, 1, , 5, 4, 3, 2, 1, 3/25/1996 Figure 4. Continued. 3/26/1996 POINT-SAMPLE MEAN POINT-SAMPLE MEAN NO BED-SEDIMENT SAMPLES COLLECTED 3/27/1996 3/28/1996 3/29/1996 3/3/1996 3/31/1996 DATE 49 4/1/1996 POINT-SAMPLE MEAN 4/2/1996 4/3/1996 4/4/1996 4/5/1996 4/6/ PERCENT BED SAND FINER THAN.125 mm
60 M 28 CONTROLLED-FLOOD EXPERIMENT RIVER-MILE 166 STUDY SITE Q, IN CUBIC FEET PER SECOND C SAND, IN MILLIGRAMS PER LITER SUSPENDED-SAND D, IN MILLIMETERS 5 BED-SAND D, IN MILLIMETERS 5 C SILT & CLAY, IN MILLIGRAMS PER LITER 5, 4, 3, 2, 1, 5, 4, 3, 2, 1, , 5, 4, 3, 2, 1, Figure 4. Continued. 3/5/28 ACOUSTIC PUMP EWI D 5 3/6/28 3/7/28 3/8/28 DATE 5 3/9/28 3/1/28 ACOUSTIC PUMP EWI % <.125 mm ACOUSTIC PUMP EWI 3/11/ PERCENT BED SAND FINER THAN.125 mm
61 N 24 CONTROLLED-FLOOD EXPERIMENT RIVER-MILE 225 STUDY SITE Q, IN CUBIC FEET PER SECOND C SAND, IN MILLIGRAMS PER LITER SUSPENDED-SAND D, IN MILLIMETERS 5 BED-SAND D, IN MILLIMETERS 5 C SILT & CLAY, IN MILLIGRAMS PER LITER 5, 4, 3, 2, 1, 5, 4, 3, 2, 1, , 5, 4, 3, 2, 1, 11/21/24 Figure 4. Continued. 11/22/24 11/23/24 11/24/24 D 5 DATE 51 11/25/24 11/26/24 ACOUSTIC PUMP EDI PUMP EDI % <.125 mm ACOUSTIC PUMP EDI 11/27/24 11/28/ PERCENT BED SAND FINER THAN.125 mm
62 O 28 CONTROLLED-FLOOD EXPERIMENT RIVER-MILE 225 Q, IN CUBIC FEET PER SECOND C SAND, IN MILLIGRAMS PER LITER SUSPENDED-SAND D, IN MILLIMETERS 5 BED-SAND D, IN MILLIMETERS 5 C SILT & CLAY, IN MILLIGRAMS PER LITER 5, 4, 3, 2, 1, 5, 4, 3, 2, 1, , 5, 4, 3, 2, 1, 3/5/28 Figure 4. Continued. D 5 3/6/28 3/7/28 3/8/28 DATE 3/9/28 3/1/28 ACOUSTIC PUMP EDI ACOUSTIC PUMP EDI % <.125 mm ACOUSTIC PUMP EDI 3/11/28 3/12/ PERCENT BED SAND FINER THAN.125 mm 52
63 disagreement between these measurements and physical measurements of suspended-sand concentration and grain size at only the River-mile 3 and 61 study sites during the rising limbs of the 24 and 28 CFEs (figs. 4D-E, G-H). Again, "substantial disagreement" is defined to be when the acoustic measurements of suspended-sand concentration and median grain size lie significantly outside the 95-percent confidence intervals associated with the EDI or EWI measurements of suspended-sand concentration and median grain size. Data Collected at Each Study Site During All CFEs Comparisons of the data collected at each study site during all three CFEs are provided in figures 5 and 6. Although differences in the upstream sediment supplies at the study sites during each CFE resulted in very different concentrations and grain sizes, similar processes were observed during each CFE at the study sites where data collection was at a sufficiently high temporal resolution. The following processes were observed in the suspended sediment during the rising limb of the 24 and 28 CFEs at the sites with 15-minute data resolution. Although these processes likely also occurred at all study sites during the 1996 CFE and at the River-mile study site during all CFEs, limited data resolution prevented making such inferences. (1) At each study site during the 24 and 28 CFE, suspended-sand concentration increased with the initial increase in the discharge of water during the rising limb. Associated with this increase in suspended-sand sand concentration is a decrease in the median grain size of the suspended sand. (2) In Marble Canyon at the River-mile 3 and 61 study sites during the 24 and 28 CFEs, two peaks in suspended-sand concentration occurred during the rising limb. The first of these peaks coincided with the minimum median grain size of the suspended sand. This occurred at a water discharge of approximately 2, ft 3 /s (a dam release slightly higher than any discharge during the antecedent accounting periods for each CFE). During both the 24 and 28 CFEs, this initial peak in suspended-sand concentration was more pronounced at the River-mile 61 study site than at the River-mile 3 study site. Following this initial peak in concentration coupled to the minimum median grain size, the median grain size of the suspended sand increased as the discharge continued to increase. During this second part of the rising limb, suspended-sand concentration first decreased and then increased, all while the median grain size of the suspended sand increased. (3) No initial peak in suspended sand concentration is evident in the data collected at the River-mile 87, 166, and 225 study sites in Grand Canyon during either the 24 or 28 CFE. However, after the initial increase in suspended-sand concentration associated with the decrease in suspended-sand median grain size, suspended-sand concentration and median grain size both increased through the remainder of the rising limb as discharge increased from about 2, ft 3 /s to 42, ft 3 /s. (4) Peak suspended-sand concentration generally occurred at all study sites either at or just before the attainment of peak discharge. At the River-mile 3 and 61 study sites, this was the second peak in suspended-sand concentration. (5) At each study site during the 24 and 28 CFE, suspended-silt-and-clay concentration increased with the initial increase in the discharge of water during the rising limb. Peak silt and clay concentration generally coincided with the above-described minimum in suspended-sand median grain size (and at a discharge of about 2, ft 3 /s). Following this peak in concentration, suspended-silt-and-clay concentration decreased during the remainder of the rising limb. The following processes were typically, but not always, observed in the bed sediment during the rising limb of each CFEs at each study site. (1) The median grain size of the bed sand decreased, sometimes associated with a substantial increase in the fraction of the bed sand composed of sand finer than.125 mm. 53
64 (2) Silt and clay was winnowed from the bed. This winnowed silt and clay was likely the source of the peak in suspended-silt-and-clay concentration during the initial part of the rising limb. The following processes were observed in the suspended- and bed-sediment at all study sites during the high, steady discharge part of all CFEs. These processes have been previously described in Rubin and others (1998), Topping and others (1999, 2a, 2b, 25, 26a, 27a, 28), Rubin and Topping (21, 28), Schmidt and others (27). (1) Suspended-sand concentration decreased over time. (2) Suspended-sand median grain size increased over time. (3) Suspended-silt-and-clay concentration continued to decrease over time. (4) The median grain size of the bed sand increased. This was typically associated with a substantial decrease in the fraction of the bed sand composed of sand finer than.125 mm. (5) The amount of silt and clay in the bed either continued to decrease or remained constant at extremely low levels. Although similar suspended- and bed-sediment processes were observed at the various study sites during the three CFEs, suspended-sand concentrations and grain sizes were very different among the different study sites during the three CFEs, owing to very different upstream supplies of sand. For a given discharge of water, the dominant nonlinear controller of suspendedsand concentration is the reach-averaged grain size of the sand on the bed, and the secondary linear controller of suspended-sand concentration is the reach-averaged area of the sand on the bed (summarized in Topping and others, 27a). Owing to this boundary condition, the same concentration of sand in suspension can be supported by coarser bed sand covering a large fraction of the bed in a reach or by finer bed sand covering a small fraction of the bed in a reach. By this logic, it is evident that increasing levels of sand enrichment could be associated with decreasing concentrations of suspended sand if the "enriching sand" covers more of the bed in a reach as its grain size progressively coarsens (however unlikely this scenario might be). In addition, when one also incorporates the complexities in relating reach-averaged bed-sand area and grain size to the upstream sand supply reviewed in the "Theoretical Background" section of this report, it becomes Figure 5 (next pages). Hydrographs, suspended-sediment data, and bed-sand data collected at each study site during all three CFEs. Hydrographs and sediment data were shifted in time such that zero time (indicated by the leftmost vertical green line) is the beginning of high, steady discharge (Q) during each CFE. Right vertical green line indicates the end of the high, steady discharge part of the 24 and 28 controlled floods at a given site; note that data collected during the 1996 CFE to the right of the right green line cannot be compared to data collected during the 24 and 28 CFEs because of the much greater duration of high, steady discharge during the 1996 CFE. Data collected after day 5 of high, steady discharge during the 1996 CFE not shown. Error bars for the EDI, EWI, or mean point suspended-sediment concentration and grain-size data indicate the 95-percent confidence interval associated with these measurements (incorporating the field and laboratory errors described in the text). Error bars for the bed-sediment data are one standard error, indicating the 67-percent confidence interval associated with the mean value of the median grain size or <.125-mm sand fraction among the stations sampled across the cross-section in each bed-sediment measurement. Q is water discharge, C SAND is the velocity-weighted concentration of suspended sand in the cross-section, C SILT&CLAY is the velocity-weighted concentration of suspended silt and clay in the cross-section, and D 5 is the median grain size of the bed sand or the velocity-weighted median grain size of the suspended sand in the cross-section. Hydrograph and data collected at (A) the River-mile study site during the 1996, 24, and 28 CFEs; (B) the River-mile 3 study site during the 24 and 28 CFEs; (C) the River-mile 61 study site during the 1996, 24, and 28 CFEs; (D) the River-mile 87 study site during the 1996, 24, and 28 CFEs; (E) the River-mile 166 study site during the 1996 and 28 CFEs; and (F) the River-mile 225 study site during the 24 and 28 CFEs. 54
65 A ALL CONTROLLED-FLOOD EXPERIMENTS RIVER-MILE STUDY SITE Q, IN CUBIC FEET PER SECOND C SAND, IN MILLIGRAMS PER LITER SUSPENDED-SAND D, IN MILLIMETERS 5 BED-SAND D, IN MILLIMETERS 5 C SILT & CLAY, IN MILLIGRAMS PER LITER 5, 4, 3, 2, 1, NO BED-SEDIMENT SAMPLES COLLECTED DAYS AFTER BEGINNING OF HIGH, STEADY DISCHARGE PERCENT BED SAND FINER THAN.125 mm EDI 24 EDI 28 EDI 1996 EDI 24 EDI 28 EDI 1996 EDI 24 EDI 28 EDI 55
66 B ALL CONTROLLED-FLOOD EXPERIMENTS RIVER-MILE 3 STUDY SITE Q, IN CUBIC FEET PER SECOND C SAND, IN MILLIGRAMS PER LITER SUSPENDED-SAND D, IN MILLIMETERS 5 BED-SAND D, IN MILLIMETERS 5 C SILT & CLAY, IN MILLIGRAMS PER LITER 5, 4, 3, 2, 1, 5, 4, 3, 2, 1, , 5, 4, 3, 2, 1, Figure 5. Continued DAYS AFTER BEGINNING OF HIGH, STEADY DISCHARGE PERCENT BED SAND FINER THAN.125 mm ACOUSTIC 24 PUMP 24 EWI 28 ACOUSTIC 28 PUMP 28 EWI 24 PUMP 24 EWI 28 ACOUSTIC 28 PUMP 28 EWI D % <.125 mm ACOUSTIC 24 PUMP 24 EWI 28 ACOUSTIC 28 PUMP 28 EWI
67 C ALL CONTROLLED-FLOOD EXPERIMENTS RIVER-MILE 61 STUDY SITE Q, IN CUBIC FEET PER SECOND C SAND, IN MILLIGRAMS PER LITER SUSPENDED-SAND D, IN MILLIMETERS 5 BED-SAND D, IN MILLIMETERS 5 C SILT & CLAY, IN MILLIGRAMS PER LITER 5, 4, 3, 2, 1, 5, 4, 3, 2, 1, , 5, 4, 3, 2, 1, Figure 5. Continued DAYS AFTER BEGINNING OF HIGH, STEADY DISCHARGE PERCENT BED SAND FINER THAN.125 mm EDI 24 ACOUSTIC 24 PUMP 24 EWI 28 ACOUSTIC 28 PUMP 28 EWI 1996 EDI 24 PUMP 24 EWI 28 ACOUSTIC 28 PUMP 28 EWI D % <.125 mm EDI 24 ACOUSTIC 24 PUMP 24 EWI 28 ACOUSTIC 28 PUMP 28 EWI
68 D ALL CONTROLLED-FLOOD EXPERIMENTS RIVER-MILE 87 STUDY SITE Q, IN CUBIC FEET PER SECOND C SAND, IN MILLIGRAMS PER LITER SUSPENDED-SAND D, IN MILLIMETERS 5 BED-SAND D, IN MILLIMETERS 5 C SILT & CLAY, IN MILLIGRAMS PER LITER 5, 4, 3, 2, 1, 5, 4, 3, 2, 1, , 5, 4, 3, 2, 1, Figure 5. Continued DAYS AFTER BEGINNING OF HIGH, STEADY DISCHARGE PERCENT BED SAND FINER THAN.125 mm EDI (5 verts.) 1996 EDI (2 verts.) 1996 POINT SAMP. 24 ACOUSTIC 24 PUMP 24 EDI 28 ACOUSTIC 28 PUMP 28 EDI 1996 EDI (5 verts.) 1996 EDI (2 verts.) 1996 POINT SAMP. 24 ACOUSTIC 24 PUMP 24 EDI 28 ACOUSTIC 28 PUMP 28 EDI D % <.125 mm EDI (5 verts.) 1996 EDI (2 verts.) 1996 POINT SAMP. 24 ACOUSTIC 24 PUMP 24 EDI 28 ACOUSTIC 28 PUMP 28 EDI
69 E ALL CONTROLLED-FLOOD EXPERIMENTS RIVER-MILE 166 STUDY SITE Q, IN CUBIC FEET PER SECOND C SAND, IN MILLIGRAMS PER LITER SUSPENDED-SAND D, IN MILLIMETERS 5 BED-SAND D, IN MILLIMETERS 5 C SILT & CLAY, IN MILLIGRAMS PER LITER 5, 4, 3, 2, 1, 5, 4, 3, 2, 1, , 5, 4, 3, 2, 1, Figure 5. Continued DAYS AFTER BEGINNING OF HIGH, STEADY DISCHARGE PERCENT BED SAND FINER THAN.125 mm POINT SAMP. 28 ACOUSTIC 28 PUMP 28 EWI 1996 POINT SAMP. 28 ACOUSTIC 28 PUMP 28 EWI D 5 28 % <.125 mm POINT SAMP. 28 ACOUSTIC 28 PUMP 28 EWI
70 F ALL CONTROLLED-FLOOD EXPERIMENTS RIVER-MILE 225 STUDY SITE Q, IN CUBIC FEET PER SECOND C SAND, IN MILLIGRAMS PER LITER SUSPENDED-SAND D, IN MILLIMETERS 5 BED-SAND D, IN MILLIMETERS 5 C SILT & CLAY, IN MILLIGRAMS PER LITER 5, 4, 3, 2, 1, 5, 4, 3, 2, 1, , 5, 4, 3, 2, 1, Figure 5. Continued DAYS AFTER BEGINNING OF HIGH, STEADY DISCHARGE PERCENT BED SAND FINER THAN.125 mm ACOUSTIC 24 PUMP 24 EDI 28 ACOUSTIC 28 PUMP 28 EDI 24 PUMP 24 EDI 28 ACOUSTIC 28 PUMP 28 EDI D % <.125 mm ACOUSTIC 24 PUMP 24 EDI 28 ACOUSTIC 28 PUMP 28 EDI
71 apparent that estimating differences in the upstream sand supply from suspended- or bed-sediment data is a nontrivial exercise that requires coupled analyses of sediment load, concentration, and grain size, with consideration of whether differences in the upstream sand supply could be causing differences in the reach-averaged τ b. These more complicated analyses are pursued later in this report. Before conducting these more complicated analyses, it is informative to first evaluate the differences in upstream sediment supply between the three CFEs through ranking of the data collected at each study site in figures 5 and 6 in terms of concentration and grain size. When ranking these data, it is important to realize that, by definition, the suspended-sediment data are more representative of the bed-sediment conditions in the reach upstream from a measurement cross-section than are bed-sediment data collected only at that measurement cross-section. At a given discharge of water, that is, reach-averaged τ b, differences in the grain-size distribution of the sand in suspension can only be explained by changes in the grain-size distribution of the sand on the bed upstream, with the reach-averaged grain size of the sand on the bed and in suspension being proportional (equation 7). The spatial scale over which suspended sand equilibrates with the bed sand ranges from about 6 m to well over 1 km under typical flow conditions in the Colorado River in the study area (Topping and others, 27a). Therefore, a proper analysis of the grain-size distribution of the suspended sand will provide a more representative sample of the grain-size distribution of the bed sand in the reach upstream from a measurement cross-section than does only bed-sediment measurements made only at the measurement cross-section (Rubin and Topping, 21, 28). For example, the apparent inconsistency at the River-mile 3 study site between the coarser suspended sand during the 28 CFE than during the 24 CFE and finer bed sand during the 28 CFE than during the 24 CFE can be explained by the bed-sand data at the measurement cross-section being less representative of the bed-sand grain-size distribution in the reach upstream from this study site than are the suspended-sand data. An alternative explanation to this inconsistency could be that, because more sand was present on the bed upstream from the River-mile 3 study site (table 3), thus resulting in thicker sand patches over much of the bed, the reach-averaged τ b upstream from the River-mile 3 study site could have been higher during the 28 CFE than during the 24 CFE. This difference in reach-averaged τ b would result in coarser suspended sand during the 28 CFE than during the 24 CFE, with bed sand that was finer during the 28 CFE than during the 24 CFE. This alternative explanation can be illustrated by moving along a path from the origin up and slightly left of the "D b = constant" line in figure 3B in Rubin and Topping (21), with the origin representing conditions during the 24 CFE. Moving along such a path results in an increase in reach-averaged τ b, a decrease in reach-averaged median grain size of the bed sand, an increase in suspended-sand concentration, and an increase in the median grain size of the suspended sand Figure 6 (next page). Bed silt and clay data collected at each study site during all three CFEs. Data were shifted in time such that zero time (indicated by the leftmost vertical solid green line) is the beginning of high, steady discharge during each CFE. Right vertical green line indicates the end of the high, steady discharge part of the 24 and 28 controlled floods at a given site. As in figure 5, data collected after day 5 of high, steady discharge during the 1996 CFE not shown. Vertical dashed green line indicates beginning of rising limb of 28 CFE at each study site. Silt and clay were winnowed from the bed at most study sites during the rising limbs of the CFEs. Error bars for the bed-sediment data are one standard error, indicating the 67-percent confidence interval associated with the mean value of the silt and clay fraction among the stations sampled across the cross-section in each bed-sediment measurement. 61
72 PERCENT OF FINE BED SEDIMENT COMPOSED OF SILT AND CLAY PERCENT OF FINE BED SEDIMENT COMPOSED OF SILT AND CLAY PERCENT OF FINE BED SEDIMENT COMPOSED OF SILT AND CLAY PERCENT OF FINE BED SEDIMENT COMPOSED OF SILT AND CLAY PERCENT OF FINE BED SEDIMENT COMPOSED OF SILT AND CLAY RIVER-MILE RIVER-MILE RIVER-MILE RIVER-MILE RIVER-MILE DAYS AFTER BEGINNING OF HIGH, STEADY DISCHARGE 62
73 between the 24 and 28 CFEs. Whether such a path is physically realistic for this River-mile 3 study-site example can be evaluated by: (1) setting constant coefficients of proportionality for equations 4 and 7 at the River-mile 3 measurement cross-section between the 24 and 28 CFEs, (2) converting the proportionalities in equations 4 and 7 to equations relating the ratios of C, A b, τ b, D b, and D s at this cross-section between the 24 and 28 CFEs, (3) substituting the values of C, D b, and D s measured at the measurement cross-section during the first day of steady, high discharge during the 24 and 28 CFEs, (4) solving for values of reach-averaged τ b and A b, and (5) determining whether these values of reach-averaged τ b and A b are realistic. When using conditions during the 24 CFE as the reference conditions, equation 4 can be rewritten in terms of ratios as: ( ) ( ) ( ) ( ) ( τ ) ( τ ) ( ) ( ) C SAND A 28 b 28 b D 28 b 28 =, (13) CSAND 24 Ab 24 b 24 D b 24 where the subscripts "28" refer to conditions during the 28 CFE and the subscripts "24" refer to conditions during the 24 CFE. Similarly, equation 7 can be rewritten in terms of ratios as: ( D ) ( D ) ( τ ) ( τ ) ( D ) ( D ) s 28 b 28 b 28 =. (14) s 24 b 24 b 24 Using EWI and bed-sediment measurements made on the first day of steady, high discharge at the River-mile 3 study site during both CFEs, the following values of the ratios are obtained: ( C SAND ) 28 C SAND ( ) 24 = 1.4, ( D s ) 28 D s ( ) 24 = 1.2, and ( ) ( D b ) 28 D b ( ) 24 =.86. Inserting these values into equations 13 and τ b A 14 and rearranging yields: 28 b = 5.2, and ( τ ) 28 =.49. b 24 ( ) Ab 24 These ratios of reach-averaged τ b and A b are physically unrealistic, given that the maximum likely 28 to 24 ratio in reach-averaged τ b associated with changes in sand thickness on the bed should be about 1.1 based on the "Theoretical Background" section of this report, and a more likely 28 to 24 ratio in reach-averaged A b should be greater than 1 based on the much greater sand enrichment in upper Marble Canyon antecedent to the 28 CFE than antecedent to the 24 CFE (table 3). Support for an approximate 1-percent increase in reach-averaged τ b and constant water discharge between the 24 and 28 CFEs is provided by acoustic-doppler-current-profiler velocity measurements made at 5 stations across the measurement cross-section at the River-mile 3 study site during both CFEs. These measurements indicate that the mean velocity through the measurement cross-section was on average 6 percent greater at steady, high discharge during the 28 CFE than it was during the 24 CFE. This increase in mean velocity was, in fact, associated with a decrease in cross-sectional area at the measurement cross-section arising from greater sand thickness on the bed. Because mean velocity is proportional to τ 2 b, this suggests that the 28 to 24 ratio in reach-averaged τ b associated with the increase in sand thickness on the bed should, in ( ) fact, be about 1.1. Inserting this value and the measured ( D s ) 28 D s ( ) 24 = 1.2 into equation 14 and 63
74 rearranging to solve for a more plausible reach-averaged value of ( D b ) 28 D b ( ) 24 yields ( D b ) 28 D b ( ) 24 = 1.2, not the above value of ( D b ) 28 D b ( ) 24 =.86 that is based on bed-sediment measurements made at only the one cross-section where suspended-sediment measurements were made. Furthermore, inserting values of ( C SAND ) 28 C SAND ( D b ) 28 D b ( τ b ) 28 τ b = 1.4, = 1.2, and = 1.1into equation 13 and rearranging to ( ) 24 ( ) 24 ( ) 24 ( A ) b solve for a more likely 28 to 24 ratio in reach-averaged A b yields 28 = 1.9. For ( ) Ab 24 ( C SAND ) comparison, inserting values of 28 ( D b ) = 1.4, 28 ( τ b ) = 1.2, and 28 = 1into equation 13 ( ) 24 ( ) 24 ( ) 24 C SAND and rearranging to solve for a 28 to 24 ratio in reach-averaged A b that is computed by excluding the effects of changes in bed-sand thickness on reach-averaged τ b (as done in the ( A ) b analyses later in this report) yields 28 = 2.2. Therefore (1) as suggested above, the apparent ( ) Ab 24 suspended- and bed-sand grain-size inconsistency at the River-mile 3 study site between the 24 and 28 CFEs can best be explained by the bed-sand data at the measurement cross-section being less representative of the bed-sand grain-size distribution in the reach upstream from this study site than are the suspended-sand data, and (2) changes in reach-averaged τ b arising from reach-averaged changes in bed-sand thickness may play an important role in regulating suspended-sand concentration and median grain size: however, exclusion of this role will likely result in only an approximate 16-percent error in reach-averaged bed-sand area estimated from suspended-sediment data. With the notable exception of the suspended- and bed-sand grain-size inconsistency at only the River-mile 3 study site, the general results from the simple comparative analyses in figures 5 and 6 are: (1) Average suspended-sand concentrations at each study site during the 28 CFE were as high as or higher than during all other CFEs. (2) Except at the River-mile 87 study site, average suspended-sand concentrations at each study site during the 1996 CFE were as low as or lower than during all other CFEs. (3) Average suspended-sand median grain size at and and downstream from the River-mile 61 study site during the 28 CFE was as fine as or finer than during all other CFEs. At the River-mile study site, average suspended-sand median grain size was finest during the 1996 CFE, and at the River-mile 3 study site, average suspended-sand median grain size was finest during the 24 CFE. (4) Though not necessarily representative of the grain size of the bed sand in the reaches upstream from these cross-sections, the bed sand at the measurement cross-sections during the 28 CFE was as fine as or finer than that during the 24 CFE. Most of the difference in the bed-sand grain-size distribution between these two CFEs was during the rising limb, when the bed during the 28 CFE was considerably finer than during the 24 CFE. (5) At the one measurement cross-section where bed-sediment data were collected during all three CFEs, at the River-mile 87 study site, the bed sand during the 28 CFE was D b τ b 64
75 slightly finer than that during both the 1996 and 24 CFEs. Bed-sand median grain size was similar at this study site during the 1996 and 24 CFEs. (6) Except at the River-mile 3 study site, where suspended-silt-and-clay concentrations were higher during the 24 CFE than during the 28 CFE, average suspended-silt-and-clay concentrations during the 28 CFE were as high as or higher than during all other CFEs. (7) There was typically more silt and clay present in the bed sediment before the 28 CFE than there was before the 24 CFE or 1996 CFE. Data Collected During Each CFE at All Study Sites Comparison of the suspended-sand data collected during each CFE at all study sites is provided in figure 7. Averaged over the 1996 CFE, suspended-sand concentration increased between the Rivermile and 87 study sites and then remained constant between the River-mile 87 and 166 study sites. As the concentration of suspended sand increased between the River-mile and 87 study sites, suspended-sand median grain size coarsened. Suspended-sand median grain size then fined between the River-mile 87 and 166 study sites while suspended-sand concentration remained constant. Averaged over the 24 CFE, suspended-sand concentration increased the most between the River-mile and 3 study sites. Between the River-mile 3 and 61 study sites, suspended-sand concentration again increased, but to a lesser degree, and then remained approximately constant between the River-mile 61 and 225 study sites. However, suspended-sand concentration during the rising limb at the River-mile 87 study site was greater than at either the River-mile 61 or 225 study sites. Suspended-sand median grain size was coarsest at the River-mile study site and finest at the River-mile 3 study site. Between the River-mile 3 and 87 study sites, suspended-sand median grain size coarsened; between the River-mile 87 and 225 study sites, suspended-sand median grain size fined to be approximately equal to that at the River-mile 61 study site. Suspended-sand median grain size was anomalously coarse during the rising limb at the River-mile 61 study site, nearly as coarse as at the River-mile study site. Averaged over the 28 CFE, suspended-sand concentration increased the most between the River-mile and 3 study sites, as it did during the 24 CFE. Similarly, during the 28 CFE, suspended-sand concentration increased between the River-mile 3 and 61 study sites, as it did during the 24 CFE. In contrast to the 24 CFE, however, suspended-sand concentrations continued to increase between the River-mile 61 and 87 study sites over the entire flood hydrograph, not just during the rising limb. Downstream from the River-mile 87 study site, suspended-sand concentration decreased between the River-mile 87 and 166 study sites, mostly during the rising limb; suspended-sand concentration then remained approximately constant between the River-mile 166 and 225 study sites, although at a level greater than at the River-mile 61 study site. Suspended-sand median grain size was coarsest at the River-mile 3 study site and finest at the River-mile 166 study site; in contrast, during the 24 CFE, suspended-sand median grain size was finest at the River-mile 3 study site. Suspended-sand median grain size coarsened between the River-mile and 3 study sites and then fined between the River-mile 3 and 166 study sites. Suspended-sand median grain size then coarsened, but only slightly between the Rivermile 166 and 225 study sites. These observations encompass almost every possible coupled change in suspended-sand concentration and grain size through a reach (table 5). The following coupled changes in suspended-sand concentration and grain size have been observed during a CFE through the long 65
76 A 5, 1996 C SAND, IN MILLIGRAMS PER LITER 4, 3, 2, 1, RM EDI RM 61 EDI RM 87 EDI (5 verts.) RM 87 EDI (2 verts.) RM 87 POINT RM 166 POINT SUSPENDED-SAND D 5, IN MILLIMETERS DAYS AFTER BEGINNING OF HIGH, STEADY DISCHARGE RM EDI RM 61 EDI RM 87 EDI (5 verts.) RM 87 EDI (2 verts.) RM 87 POINT RM 166 POINT Figure 7. Suspended-sand data collected during each CFE at all study sites. Upper graphs, suspended-sand concentration; lower graphs, suspended-sand median grain size. Data were shifted in time such that zero time (indicated by the leftmost vertical solid green line) is the beginning of high, steady discharge during each CFE. Right vertical green line indicates the end of the high, steady discharge part of the 1996, 24, and 28 controlled floods at a given site. Error bars for the EDI, EWI, or mean point suspended-sediment concentration and grain-size data indicate the 95-percent confidence interval associated with these measurements (incorporating the field and laboratory errors described above). A, 1996 CFE. B, 24 CFE. C, 28 CFE. 66


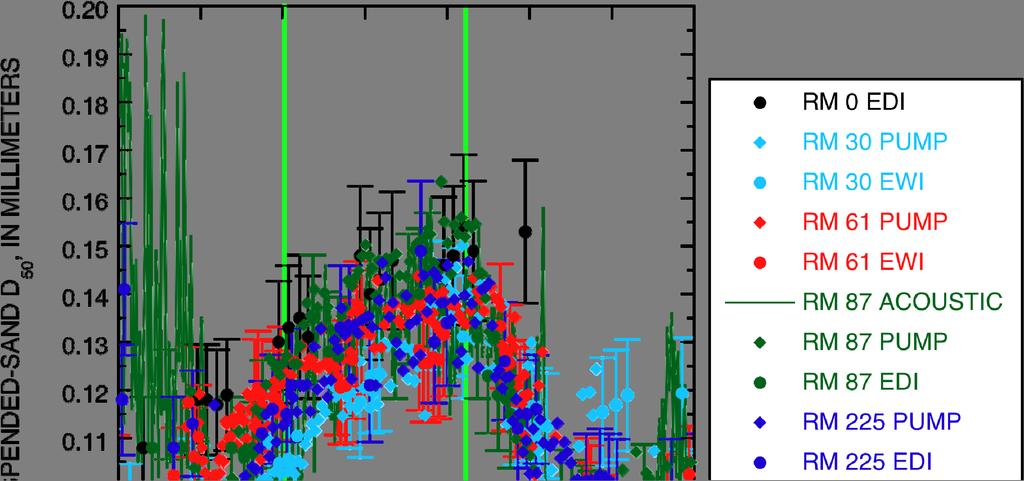
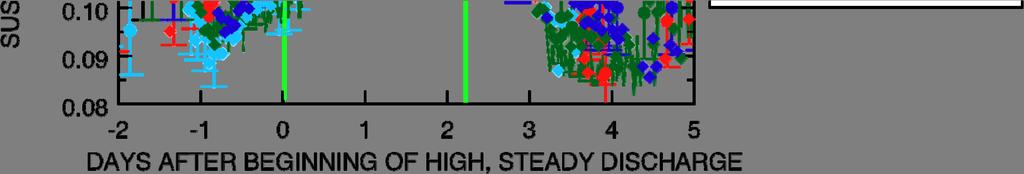
77 B Figure 7. Continued. 67


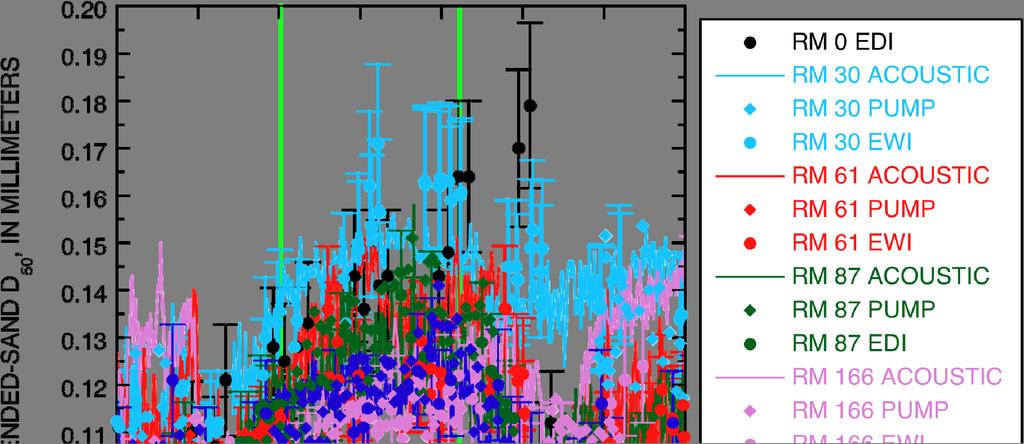
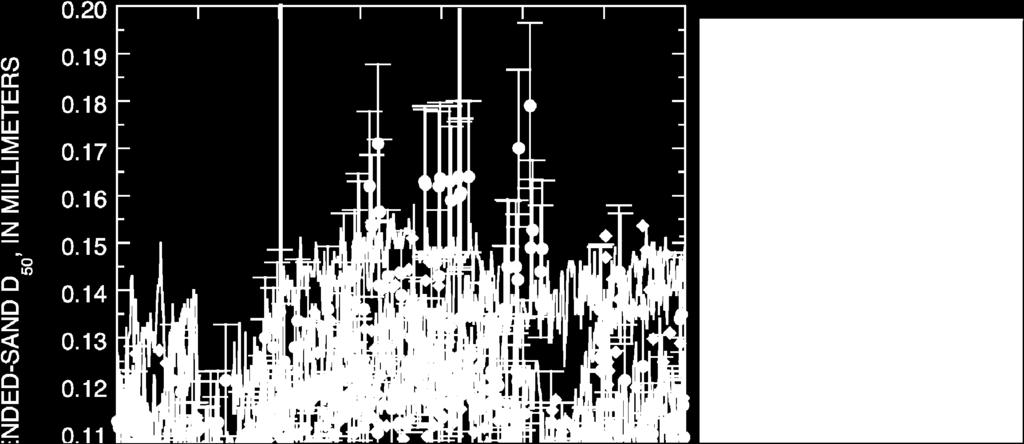
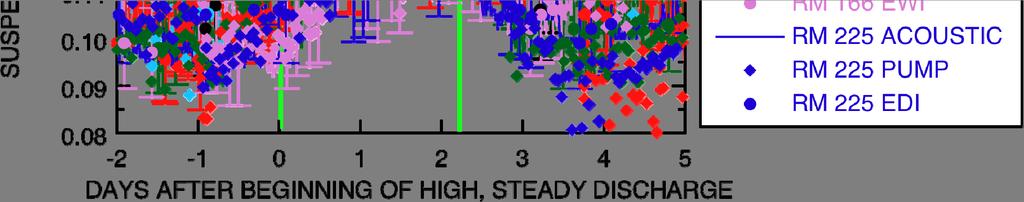
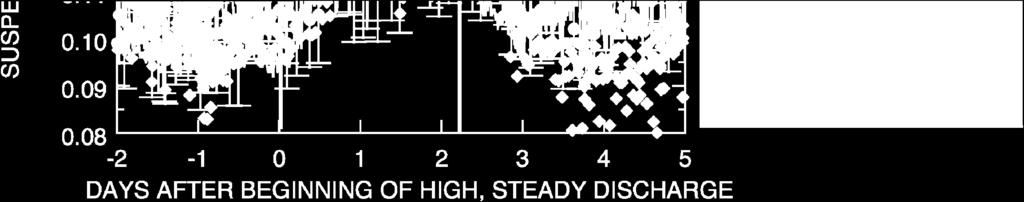
78 C Figure 7. Continued. 68
Colorado River sediment transport 1. Natural sediment supply limitation and the influence of Glen Canyon Dam
 WATER RESOURCES RESEARCH, VOL. 36, NO. 2, PAGES 515 542, FEBRUARY 2000 Colorado River sediment transport 1. Natural sediment supply limitation and the influence of Glen Canyon Dam David J. Topping U.S.
COMPARISON OF SEDIMENT-TRANSPORT AND BAR-RESPONSE RESULTS FROM THE 1996 AND 2004 CONTROLLED-FLOOD EXPERIMENTS ON THE COLORADO RIVER IN GRAND CANYON
 Article published in the CD-ROM proceedings of the 8th Federal Inter-Agency Sedimentation Conference, Reno, Nevada, April 2-6, 26, ISBN -97797-1-1 COMPARISON OF SEDIMENT-TRANSPORT AND BAR-RESPONSE RESULTS
WATER RESOURCES RESEARCH, VOL. 37, NO. 1, PAGES , JANUARY 2001
 WATER RESOURCES RESEARCH, VOL. 37, NO. 1, PAGES 133 146, JANUARY 2001 Quantifying the relative importance of flow regulation and grain size regulation of suspended sediment transport and tracking changes
U.S. DEPARTMENT OF THE INTERIOR U.S. GEOLOGICAL SURVEY MEASUREMENTS OF SAND THICKNESSES IN GRAND CANYON,
 U.S. DEPARTMENT OF THE INTERIOR U.S. GEOLOGICAL SURVEY MEASUREMENTS OF SAND THICKNESSES IN GRAND CANYON, ARIZONA, AND A CONCEPTUAL MODEL FOR CHARACTERIZING CHANGES IN SAND-BAR VOLUME THROUGH TIME AND SPACE
Controlled flooding on the Colorado River : using GIS methods to assess sandbar development
 University of Iowa Iowa Research Online Theses and Dissertations Spring 2014 Controlled flooding on the Colorado River : using GIS methods to assess sandbar development Clara Thieme University of Iowa
Geomorphic Changes to the River Channels and Flood Plains of the Colorado River System: The Planned and Unplanned Effects of Water Development
 Geomorphic Changes to the River Channels and Flood Plains of the Colorado River System: The Planned and Unplanned Effects of Water Development Paul Grams U.S. Geological Survey Grand Canyon Monitoring
Lake-Level Variability and Water Availability in the Great Lakes
 National Water Availability and Use Program Lake-Level Variability and Water Availability in the Great Lakes Circular 1311 U.S. Department of the Interior U.S. Geological Survey Front-cover photo: Drowned-river-mouth
High Flow Experiments and Sediment Transport in the Grand Canyon Abstract Introduction Pre-Dam Conditions
 High Flow Experiments and Sediment Transport in the Grand Canyon By Steve Micko Abstract Flood experiments (FEs) originated in Glen Canyon Dam in 1996 (Olden et al., 2014). FEs are now conducted around
Aeolian Reworking of Sandbars from the March 2008 Glen Canyon Dam High-Flow Experiment in Grand Canyon
 Aeolian Reworking of Sandbars from the March 2008 Glen Canyon Dam High-Flow Experiment in Grand Canyon By Amy E. Draut, 1 Joseph E. Hazel Jr., 2 Helen C. Fairley, 3 and Christopher R. Brown 2 Abstract
The evolution of sandbars along the Colorado River downstream of the Glen Canyon Dam
 The evolution of sandbars along the Colorado River downstream of the Glen Canyon Dam Liz Kemp April 2010 i Cover photo: Andrew Pernick, Bureau of Reclamation Aerial view of Glen Canyon Dam during high-flow
Chapter 1 Influence of Glen Canyon Dam Operations on Downstream Sand Resources of the Colorado River in Grand Canyon
 Introduction Chapter 1 Influence of Glen Canyon Dam Operations on Downstream Sand Resources of the Colorado River in Grand Canyon Scott A. Wright Theodore S. Melis David J. Topping David M. Rubin The closure
B-1. Attachment B-1. Evaluation of AdH Model Simplifications in Conowingo Reservoir Sediment Transport Modeling
 Attachment B-1 Evaluation of AdH Model Simplifications in Conowingo Reservoir Sediment Transport Modeling 1 October 2012 Lower Susquehanna River Watershed Assessment Evaluation of AdH Model Simplifications
Dams, sediment, and channel changes and why you should care
 Dams, sediment, and channel changes and why you should care Gordon E. Grant USDA Forest Service PNW Research Station Corvallis, Oregon Dam effects on river regimes FLOW (Q) SEDIMENT (Qs) TEMP CHEMISTRY
Testing laser-based sensors for continuous in situ monitoring of suspended sediment in the Colorado River, Arizona
 Erosion and Sediment Transport Measurement in Rivers: Technological and Methodological Advances (Proceedings of (he Oslo Workshop. June 2002). IAHS Publ. 283, 2003. 21 Testing laser-based sensors for continuous
Reach-Averaged Sediment Routing Model of a Canyon River
 Utah State University DigitalCommons@USU Watershed Sciences Faculty Publications Watershed Sciences 1-1-2007 Reach-Averaged Sediment Routing Model of a Canyon River S. M. Wiele Peter Richard Wilcock Utah
Appendix O. Sediment Transport Modelling Technical Memorandum
 Appendix O Sediment Transport Modelling Technical Memorandum w w w. b a i r d. c o m Baird o c e a n s engineering l a k e s design r i v e r s science w a t e r s h e d s construction Final Report Don
Geomorphology Geology 450/750 Spring Fluvial Processes Project Analysis of Redwood Creek Field Data Due Wednesday, May 26
 Geomorphology Geology 450/750 Spring 2004 Fluvial Processes Project Analysis of Redwood Creek Field Data Due Wednesday, May 26 This exercise is intended to give you experience using field data you collected
(3) Sediment Movement Classes of sediment transported
 Sediment Movement Classes of sediment transported") 9/17/15 (3) Sediment Movement Classes of sediment transported Dissolved load Suspended load Important for scouring algae Bedload (5-10% total load) Moves along bed during floods Source of crushing for
9/17/15 (3) Sediment Movement Classes of sediment transported Dissolved load Suspended load Important for scouring algae Bedload (5-10% total load) Moves along bed during floods Source of crushing for
EXAMPLES (SEDIMENT TRANSPORT) AUTUMN 2018
 AUTUMN 2018") EXAMPLES (SEDIMENT TRANSPORT) AUTUMN 2018 Q1. Using Cheng s formula estimate the settling velocity of a sand particle of diameter 1 mm in: (a) air; (b) water. Q2. Find the critical Shields parameter diameter
EXAMPLES (SEDIMENT TRANSPORT) AUTUMN 2018 Q1. Using Cheng s formula estimate the settling velocity of a sand particle of diameter 1 mm in: (a) air; (b) water. Q2. Find the critical Shields parameter diameter
MATHEMATICAL MODELING OF FLUVIAL SEDIMENT DELIVERY, NEKA RIVER, IRAN. S.E. Kermani H. Golmaee M.Z. Ahmadi
 JOURNAL OF ENVIRONMENTAL HYDROLOGY The Electronic Journal of the International Association for Environmental Hydrology On the World Wide Web at http://www.hydroweb.com VOLUME 16 2008 MATHEMATICAL MODELING
(3) Sediment Movement Classes of sediment transported
 Sediment Movement Classes of sediment transported") (3) Sediment Movement Classes of sediment transported Dissolved load Suspended (and wash load ) Important for scouring algae Bedload (5-10% total load Moves along bed during floods Source of crushing for
(3) Sediment Movement Classes of sediment transported Dissolved load Suspended (and wash load ) Important for scouring algae Bedload (5-10% total load Moves along bed during floods Source of crushing for
Tarbela Dam in Pakistan. Case study of reservoir sedimentation
 Tarbela Dam in Pakistan. HR Wallingford, Wallingford, UK Published in the proceedings of River Flow 2012, 5-7 September 2012 Abstract Reservoir sedimentation is a main concern in the Tarbela reservoir
JOURNAL OF GEOPHYSICAL RESEARCH: EARTH SURFACE, VOL. 118, , doi: /jgrf.20050, 2013
 JOURNAL OF GEOPHYSICAL RESEARCH: EARTH SURFACE, VOL. 118, 361 381, doi:1.12/jgrf.25, 213 Linking morphodynamic response with sediment mass balance on the Colorado River in Marble Canyon: Issues of scale,
Spring Run Spawning Habitat Assessment Sediment Mobility
 Study 47 Spring Run Spawning Habitat Assessment Sediment Mobility Final 2015 Monitoring and Analysis Plan January 2015 1.0 Spring Run Spawning Habitat Assessment Sediment Mobility Theme(s): Flow management
Stop 1: Marmot Dam Stop 1: Marmot Dam
 Stop 1: Marmot Dam Stop 1: Marmot Dam Following the removal of Marmot Dam in 2007, the fate of the reservoir sediments has been monitored through a series of surveys and sediment transport measurements.
Squaw Creek. General Information
 General Information is a tributary to the Salmon River. It enters the north side of the river about 0 miles downstream of North Fork, Idaho. The study reach is about a 30 ft length of stream about 2 miles
Each basin is surrounded & defined by a drainage divide (high point from which water flows away) Channel initiation
 Channel initiation") DRAINAGE BASINS A drainage basin or watershed is defined from a downstream point, working upstream, to include all of the hillslope & channel areas which drain to that point Each basin is surrounded &
DRAINAGE BASINS A drainage basin or watershed is defined from a downstream point, working upstream, to include all of the hillslope & channel areas which drain to that point Each basin is surrounded &
Summary of Sediment Data from the Yampa River and Upper Green River Basins, Colorado and Utah,
 Summary of Sediment Data from the Yampa River and Upper Green River Basins, Colorado and Utah, 1993 2002 By John G. Elliott and Steven P. Anders Prepared in cooperation with the Colorado Division of Wildlife
SCOPE OF PRESENTATION STREAM DYNAMICS, CHANNEL RESTORATION PLANS, & SEDIMENT TRANSPORT ANALYSES IN RELATION TO RESTORATION PLANS
 DESIGN METHODS B: SEDIMENT TRANSPORT PROCESSES FOR STREAM RESTORATION DESIGN PETER KLINGEMAN OREGON STATE UNIVERSITY CIVIL ENGINEERING DEPT., CORVALLIS 2 ND ANNUAL NORTHWEST STREAM RESTORATION DESIGN SYMPOSIUM
Lake Sedimentation Survey of Siloam Springs State Park Lake, Adams County, Illinois
 Contract Report 567 Lake Sedimentation Survey of Siloam Springs State Park Lake, Adams County, Illinois by Richard L. Allgire Office of Sediment & Wetland Studies Prepared for the Illinois Department of
PRELIMINARY DRAFT FOR DISCUSSION PURPOSES
 Memorandum To: David Thompson From: John Haapala CC: Dan McDonald Bob Montgomery Date: February 24, 2003 File #: 1003551 Re: Lake Wenatchee Historic Water Levels, Operation Model, and Flood Operation This
Technical Memorandum No Sediment Model
 Pajaro River Watershed Study in association with Technical Memorandum No. 1.2.9 Sediment Model Task: Development of Sediment Model To: PRWFPA Staff Working Group Prepared by: Gregory Morris and Elsie Parrilla
Simulating Sediment Transport in the Patapsco River following Dam Removal with Dam Removal Express Assessment Model-1 (DREAM-1)
") Simulating Sediment Transport in the Patapsco River following Dam Removal with Dam Removal Express Assessment Model-1 (DREAM-1) Prepared for Inter-Fluve 362 Atwood Ave., Suite 3 Madison, WI 53714 www.interfluve.com
Simulating Sediment Transport in the Patapsco River following Dam Removal with Dam Removal Express Assessment Model-1 (DREAM-1) Prepared for Inter-Fluve 362 Atwood Ave., Suite 3 Madison, WI 53714 www.interfluve.com
MEMORANDUM 1. INTRODUCTION
 MEMORANDUM TO: Jim Well, Ducks Unlimited FROM: Mike Harvey, PhD, PG, Bob Mussetter, PhD, PE, Dai Thomas, PE SUBJECT: Two-dimensional Sediment-transport Modeling of the M&T/Llano Project No. US-CA-62-2
Final Report. Prepared for. American Rivers, California Trout, Friends of the River and Trout Unlimited
 A of the Potential Downstream Sediment Deposition Following the Removal of Iron Gate, Copco, and J.C. Boyle Dams, Klamath River, CA Final Report Prepared for American Rivers, California Trout, Friends
Earth Science Chapter 6 Section 2 Review
 Name: Class: Date: Earth Science Chapter 6 Section Review Multiple Choice Identify the choice that best completes the statement or answers the question. 1. Most streams carry the largest part of their
Dynamics and Evolution of Tributary Alluvial Fans in the Grand Canyon below Glen Canyon Dam Alex Morelan
 Dynamics and Evolution of Tributary Alluvial Fans in the Grand Canyon below Glen Canyon Dam Alex Morelan Abstract/ Introduction: Tributary alluvial fans along the Grand Canyon are key to both natural and
Do you think sediment transport is a concern?
 STREAM RESTORATION FRAMEWORK AND SEDIMENT TRANSPORT BASICS Pete Klingeman 1 What is Your Restoration Project Like? k? Do you think sediment transport is a concern? East Fork Lewis River, WA Tidal creek,
Numerical modeling of sediment flushing from Lewis and Clark Lake
 University of Nebraska - Lincoln DigitalCommons@University of Nebraska - Lincoln US Army Research U.S. Department of Defense 2013 Numerical modeling of sediment flushing from Lewis and Clark Lake Jungkyu
Illinois State Water Survey Division
 Illinois State Water Survey Division SURFACE WATER SECTION SWS Contract Report 413 AT THE UNIVERSITY OF ILLINOIS SEDIMENTATION SURVEY OF DAWSON LAKE, MORAINE VIEW STATE PARK, MC LEAN COUNTY, ILLINOIS by
An Adaptive Assessment of the Flushing Flow Needs of the Lower Poudre River, Colorado: First Evaluation
 Hydrology Days 29 An Adaptive Assessment of the Flushing Flow Needs of the Lower Poudre River, Colorado: First Evaluation 1 Robert T Milhous Hydrologist. Fort Collins, Colorado 8526 Abstract. Adaptive
What discharge (cfs) is required to entrain the D 84 (84 th percentile of sediment size distribution) in Red Canyon Wash?
 is required to entrain the D 84 (84 th percentile of sediment size distribution) in Red Canyon Wash?") Gregory Indivero 31 October 2011 What discharge (cfs) is required to entrain the D 84 (84 th percentile of sediment size distribution) in Red Canyon Wash? What discharge was required to deposit observed
Gregory Indivero 31 October 2011 What discharge (cfs) is required to entrain the D 84 (84 th percentile of sediment size distribution) in Red Canyon Wash? What discharge was required to deposit observed
Grand Canyon Sediment Augmentation Study. Tim Randle, P.E. Manager, Sedimentation and River Hydraulics Group, Denver, Colorado
 Grand Canyon Sediment Augmentation Study Tim Randle, P.E. Manager, Sedimentation and River Hydraulics Group, Denver, Colorado Sediment Augmentation Objectives Seasonally increase turbidity to provide cover
Summary of Hydraulic and Sediment-transport. Analysis of Residual Sediment: Alternatives for the San Clemente Dam Removal/Retrofit Project,
 Appendix N SUMMARY OF HYDRAULIC AND SEDIMENT-TRANSPORT ANALYSIS OF RESIDUAL SEDIMENT: ALTERNATIVES FOR THE SAN CLEMENTE DAM REMOVAL/RETROFIT PROJECT, CALIFORNIA the San Clemente Dam Removal/Retrofit Project,
MEANDER MIGRATION MODEL ASSESSMENT FOR THE JANUARY 2005 STORM, WHITMAN PROPERTY, SAN ANTONIO CREEK, VENTURA COUNTY, CALIFORNIA
 MEANDER MIGRATION MODEL ASSESSMENT FOR THE JANUARY 2005 STORM, WHITMAN PROPERTY, SAN ANTONIO CREEK, VENTURA COUNTY, CALIFORNIA Prepared by Eric Larsen, Ph.D. Mark Rains, Ph.D. October 2006 INTRODUCTION
Sediment Transport Analysis for Stream Restoration Design: The Good, the Bad, and the Ugly.
 Sediment Transport Analysis for Stream Restoration Design: The Good, the Bad, and the Ugly. Brett Jordan Phd, PE HydroGeo Designs LLC. Land and Water Services Inc. THE GOOD THE BAD THE UGLY THE GOOD THE
DRAFT LOW FLOW CONVEYANCE CHANNEL BORAMEP TOTAL LOAD ANALYSIS 2001 MIDDLE RIO GRANDE, NEW MEXICO MAY 2005
 LOW FLOW CONVEYANCE CHANNEL BORAMEP TOTAL LOAD ANALYSIS 2001 MIDDLE RIO GRANDE, NEW MEXICO MAY 2005 PREPARED FOR: US BUREAU OF RECLAMATION ALBUQUERQUE, NEW MEXICO PREPARED BY: FORREST JAY JASON ALBERT
Assessment of the Hood River Delta Hood River, Oregon
 Assessment of the Hood River Delta Hood River, Oregon Pacific Northwest Waterways Association Annual Meeting October 13, 2010 Michael McElwee, Executive Director Port of Hood River Overview U.S. Army Corps
Sediment Supply Versus Local Hydraulic Controls on Sediment Transport and Storage in a River with Large Sediment Loads
 Utah State University DigitalCommons@USU Watershed Sciences Faculty Publications Watershed Sciences 1-19-2016 Sediment Supply Versus Local Hydraulic Controls on Sediment Transport and Storage in a River
SECTION G SEDIMENT BUDGET
 SECTION G SEDIMENT BUDGET INTRODUCTION A sediment budget has been constructed for the for the time period 1952-2000. The purpose of the sediment budget is to determine the relative importance of different
Can fluvial-hydraulic models accurately predict bed load transport in gravel bed streams?
 Can fluvial-hydraulic models accurately predict bed load transport in gravel bed streams? Scott B. Katz 1,2, Catalina Segura 1,2 1 Water Resources Graduate Program, 2 Department of Forest Engineering,
Strategies for managing sediment in dams. Iwona Conlan Consultant to IKMP, MRCS
 Strategies for managing sediment in dams Iwona Conlan Consultant to IKMP, MRCS 1 Sediment trapping by dams Active storage capacity Dead storage coarse material (bed load) Fine materials (suspension) Francis
Highland Lake Bathymetric Survey
 Highland Lake Bathymetric Survey Final Report, Prepared For: The Town of Highland Lake 612 Lakeshore Drive Oneonta, AL 35121 Prepared By: Tetra Tech 2110 Powers Ferry Road SE Suite 202 Atlanta, GA 30339
UPPER TUOLUMNE RIVER ECOSYSTEM PROJECT Preliminary Sediment Source and Sediment Transport Capacity Evaluation: O Shaughnessy Dam to Poopenaut Valley
 UPPER TUOLUMNE RIVER ECOSYSTEM PROJECT Preliminary Sediment Source and Sediment Transport Capacity Evaluation: O Shaughnessy Dam to Poopenaut Valley Technical Memorandum McBain & Trush, Inc. and RMC Environmental
Diagnostic Geomorphic Methods for Understanding Future Behavior of Lake Superior Streams What Have We Learned in Two Decades?
 Diagnostic Geomorphic Methods for Understanding Future Behavior of Lake Superior Streams What Have We Learned in Two Decades? Faith Fitzpatrick USGS WI Water Science Center, Middleton, WI fafitzpa@usgs.gov
DETERMINING THE TRIBUTARY SEDIMENT CONTRIBUTION TO EXPERIMENTAL FLOOD DEPOSITS ON THE COLORADO RIVER IN MARBLE CANYON, GRAND CANYON, ARIZONA
 DETERMINING THE TRIBUTARY SEDIMENT CONTRIBUTION TO EXPERIMENTAL FLOOD DEPOSITS ON THE COLORADO RIVER IN MARBLE CANYON, GRAND CANYON, ARIZONA By Katherine A. Chapman A Thesis Submitted in Partial Fulfillment
Geomorphic Importance of Winter Peak Flows and Annual Snowmelt Hydrographs in a Sierra Nevada Boulder-Bedrock River
 Geomorphic Importance of Winter Peak Flows and Annual Snowmelt Hydrographs in a Sierra Nevada Boulder-Bedrock River Scott McBain and Bill Trush McBain & Trush, Inc. Clavey River and Cherry Creek vicinity
Subcommittee on Sedimentation Draft Sediment Analysis Guidelines for Dam Removal
 Subcommittee on Sedimentation Draft Sediment Analysis Guidelines for Dam Removal August 4, 2011 Jennifer Bountry, M.S., P.E. Tim Randle, M.S., P.E., D.WRE. Blair Greimann, Ph.D., P.E. Sedimentation and
Lower Susquehanna River Reservoir System Proposed Modeling Enhancements
 Lower Susquehanna River Reservoir System Proposed Modeling Enhancements Presented at the Chesapeake Bay Program Scientific and Technical Advisory Committee (STAC) Workshop January 13, 2016 Overview Due
Erosion Rate is a Function of Erodibility and Excess Shear Stress = k ( o - c ) From Relation between Shear Stress and Erosion We Calculate c and
 From Relation between Shear Stress and Erosion We Calculate c and") Equilibrium, Shear Stress, Stream Power and Trends of Vertical Adjustment Andrew Simon USDA-ARS, Oxford, MS asimon@msa-oxford.ars.usda.gov Non-Cohesive versus Cohesive Materials Non-cohesive: sands and
Equilibrium, Shear Stress, Stream Power and Trends of Vertical Adjustment Andrew Simon USDA-ARS, Oxford, MS asimon@msa-oxford.ars.usda.gov Non-Cohesive versus Cohesive Materials Non-cohesive: sands and
7.3 Sediment Delivery Analysis
 7.3 Sediment Delivery Analysis In order to evaluate potential changes in sedimentation patterns that could occur due to impacts from the FCP and LPP alignments, sediment assessment models were constructed
Lower Susquehanna River Integrated Sediment & Nutrient Monitoring Program
 Lower Susquehanna River Integrated Sediment & Nutrient Monitoring Program Presented at the Chesapeake Bay Program Scientific and Technical Advisory Committee (STAC) Workshop January 13, 2016 Background
~ W 89 CONTENTS J-1 J-1 J-6 J-7 J-9 J-10 J-10 J-10
 15 W 89 J-1. J-2. J-3. J-4. J-5. J-6 J-7. J-8. CONTENTS Introduction... Stable Slope Method... Example 1... Armor Bed Method... Example 2...*.... Dominant Discharge... Bed Material Gradation... Numerical
Calculation of Stream Discharge Required to Move Bed Material
 Calculation of Stream Discharge Required to Move Bed Material Objective: Students will map two sections of a stream and calculate the depth, velocity, and discharge of flows required to move the stream
II. Resource benefits. Å. Native Fish
 Discussion Points for a Sediment-Triggered BHBF Test in WY07, New Information and Need for Reconsideration and Recommendation to the Secretary of the Interior 11/30/07 FINAL Proposed AMWG motion for Dec.
Chapter 3 Erosion in the Las Vegas Wash
 Chapter 3 Erosion in the Las Vegas Wash Introduction As described in Chapter 1, the Las Vegas Wash (Wash) has experienced considerable change as a result of development of the Las Vegas Valley (Valley).
Channel responses to the removal of Gold Ray and Savage Rapids Dam. Prepared by Desirée Tullos and Cara Water
 Channel responses to the removal of Gold Ray and Savage Rapids Dam Prepared by Desirée Tullos and Cara Water Introduction. As the results of extensive efforts over several decades, the Rogue River is now
State Water Survey Division SURFACE WATER SECTION
 State Water Survey Division SURFACE WATER SECTION AT THE UNIVERSITY OF ILLINOIS Illinois Department of Energy and Natural Resources SWS Miscellaneous Publication 88 SEDIMENTATION OF POOL 19 ON THE MISSISSIPPI
A STUDY OF LOCAL SCOUR AT BRIDGE PIERS OF EL-MINIA
 A STUDY OF LOCAL SCOUR AT BRIDGE PIERS OF EL-MINIA Dr. Gamal A. Sallam 1 and Dr. Medhat Aziz 2 ABSTRACT Bridges are critical structures that require a substantial investment to construct and serve an important
Perspectives on river restoration science, geomorphic processes, and channel stability
 Perspectives on river restoration science, geomorphic processes, and channel stability Stream Restoration Forum: Science and Regulatory Connections Andrew C. Wilcox Department of Geosciences University
Coarse Sediment Augmentation on Regulated Rivers. Scott McBain McBain & Trush, Inc.
 Coarse Sediment Augmentation on Regulated Rivers Scott McBain McBain & Trush, Inc. scott@mcbaintrush.com Components Some geomorphic and ecological considerations Conceptual approach at understanding augmentation
Sediment Delivery by Ungaged Tributaries of the Colorado River in Grand Canyon
 U.S. DEPARTMENT OF THE INTERIOR U.S. GEOLOGICAL SURVEY Sediment Delivery by Ungaged Tributaries of the Colorado River in Grand Canyon Water-Resources Investigations Report 00 4055 Prepared in cooperation
HEC-RAS Reservoir Transport Simulation of Three Reservoirs in the Lower Susquehanna River Basin. Mike Langland and Ed Koerkle
 HEC-RAS Reservoir Transport Simulation of Three Reservoirs in the Lower Susquehanna River Basin Mike Langland and Ed Koerkle Topics Background / Project Objectives Data Selection - Sediment and Geometric
Technical Memorandum No
 Pajaro River Watershed Study in association with Technical Memorandum No. 1.2.10 Task: Evaluation of Four Watershed Conditions - Sediment To: PRWFPA Staff Working Group Prepared by: Gregory Morris and
ES 105 Surface Processes I. Hydrologic cycle A. Distribution % in oceans 2. >3% surface water a. +99% surface water in glaciers b.
 ES 105 Surface Processes I. Hydrologic cycle A. Distribution 1. +97% in oceans 2. >3% surface water a. +99% surface water in glaciers b. >1/3% liquid, fresh water in streams and lakes~1/10,000 of water
Field Observations and One-Dimensional Flow Modeling of Summit Creek in Mack Park, Smithfield, Utah
 Intermountain Center for River Rehabilitation and Restoration, Utah State University 31 July 2018 Field Observations and One-Dimensional Flow Modeling of Summit Creek in Mack Park, Smithfield, Utah I.
3 Theoretical Basis for SAM.sed Calculations
 3 Theoretical Basis for SAM.sed Calculations Purpose Sediment transport functions can be used to calculate the bed material portion of the sediment discharge rating curve. This rating curve can then be
5/4/2017 Fountain Creek. Gage Analysis. Homework 6. Clifton, Cundiff, Pour, Queen, and Zey CIVE 717
 5/4/2017 Fountain Creek Gage Analysis Homework 6 Clifton, Cundiff, Pour, Queen, and Zey CIVE 717 Introduction: The CIVE 717 class members, Nate Clifton, Susan Cundiff, Ali Reza Nowrooz Pour, Robbie Queen
U.S. Army Corps of Engineers Detroit District. Sediment Trap Assessment Saginaw River, Michigan
 U.S. Army Corps of Engineers Detroit District December 2001 December 2001 This report has been prepared for USACE, Detroit District by: W.F. BAIRD & ASSOCIATES LTD. 2981 YARMOUTH GREENWAY MADISON, WISCONSIN
Stream Entrainment, Erosion, Transportation & Deposition
 Lecture 12 Zone 2 of the Fluvial System, Continued Stream Entrainment, Erosion, Transportation & Deposition Erosion in a Fluvial Landscape Corrosion Chemical Erosion Corrasion Mechanical Weathering Cavitation
Stream Geomorphology. Leslie A. Morrissey UVM July 25, 2012
 Stream Geomorphology Leslie A. Morrissey UVM July 25, 2012 What Functions do Healthy Streams Provide? Flood mitigation Water supply Water quality Sediment storage and transport Habitat Recreation Transportation
THE 1996 CONTROLLED FLOOD IN GRAND CANYON: FLOW, SEDIMENT TRANSPORT, AND GEOMORPHIC CHANGE
 657 Ecological Applications, 11(3), 2001, pp. 657 671 2001 by the Ecological Society of America THE 1996 CONTROLLED FLOOD IN GRAND CANYON: FLOW, SEDIMENT TRANSPORT, AND GEOMORPHIC CHANGE JOHN C. SCHMIDT,
Susitna-Watana Hydroelectric Project (FERC No )
") (FERC No. 14241) Development of Sediment-Transport Relationships and an Initial Sediment Balance for the Middle and Lower Susitna River Segments Prepared for Prepared by Tetra Tech February 2013 REPORT
(FERC No. 14241) Development of Sediment-Transport Relationships and an Initial Sediment Balance for the Middle and Lower Susitna River Segments Prepared for Prepared by Tetra Tech February 2013 REPORT
CHANNEL GEOMORPHIC RESPONSES TO DISTURBANCES ASSESSED USING STREAMGAGE INFORMATION
 CHANNEL GEOMORPHIC RESPONSES TO DISTURBANCES ASSESSED USING STREAMGAGE INFORMATION Kyle E. Juracek, Research Hydrologist, U.S. Geological Survey, Lawrence, KS, kjuracek@usgs.gov; Mark W. Bowen, Ph.D. candidate,
PR206 NARRATIVE Updated 16 June 2015
 PR206 NARRATIVE Updated 16 June 2015 Cross section PR206 was established in 1977 in a fairly straight reach of Powder River about a kilometer downriver of the Highway 212 bridge at Broadus. The section
Final Report for TWDB Contract No
 Final Report for TWDB Contract No. 1004831127 Sediment Transport Modeling of Channel Scale Geomorphic Processes J.K. Haschenburger University of Texas at San Antonio July 31, 2012 1 Introduction This study
Platte River Flow and Sediment Transport Between North Platte and Grand Island, Nebraska ( )
") Platte River Flow and Sediment Transport Between North Platte and Grand Island, Nebraska (1895-1999) U.S. Department of the Interior Bureau of Reclamation TECHNICAL SERVICE CENTER Denver, Colorado October
Platte River Flow and Sediment Transport Between North Platte and Grand Island, Nebraska (1895-1999) U.S. Department of the Interior Bureau of Reclamation TECHNICAL SERVICE CENTER Denver, Colorado October
WASHLOAD AND FINE SEDIMENT LOAD. By Hyoseop S. Woo, 1 Pierre Y. Julien, 2 M. ASCE, and Everett V. Richardson/ F. ASCE
 WASHLOAD AND FINE SEDIMENT LOAD By Hyoseop S. Woo, 1 Pierre Y. Julien, 2 M. ASCE, and Everett V. Richardson/ F. ASCE INTRODUCTION Einstein (3) does not take credit for designing the washload concept, but
PART 2:! FLUVIAL HYDRAULICS" HYDROEUROPE
 PART 2:! FLUVIAL HYDRAULICS" HYDROEUROPE 2009 1 HYDROEUROPE 2009 2 About shear stress!! Extremely complex concept, can not be measured directly!! Computation is based on very primitive hypotheses that
Two-Dimensional Simulation of Truckee River Hydrodynamics
 Two-Dimensional Simulation of Truckee River Hydrodynamics by Stephen H. Scott PURPOSE: The purpose of this Coastal and Hydraulics Engineering Technical Note (CHETN) is to demonstrate the use of multidimensional
Final Report. Department of Geology Northern Arizona University Flagstaff, AZ October 14, 2002
 Monitoring Campsite Area in the Colorado River Ecosystem Downstream from Glen Canyon Dam: 1998 to 2000 Final Report Matt Kaplinski, Joseph E. Hazel, Mark Manone, Roderic Parnell Department of Geology Northern
Dam Removal Express Assessment Models (DREAM). Part 2: Sample runs/sensitivity tests
. Part 2: Sample runs/sensitivity tests") Submitted to Journal of Hydraulic Research on February 4, 2003 Dam Removal Express Assessment Models (DREAM). Part 2: Sample runs/sensitivity tests YANTAO CUI, Hydraulic Engineer, Stillwater Sciences,
Submitted to Journal of Hydraulic Research on February 4, 2003 Dam Removal Express Assessment Models (DREAM). Part 2: Sample runs/sensitivity tests YANTAO CUI, Hydraulic Engineer, Stillwater Sciences,
BED LOAD SEDIMENT TRANSPORT
 BED LOAD SEDIMENT TRANSPORT Kamal EL KADI ABDERREZZAK EDF-R&D, Laboratoire National d Hydraulique et Environnement (LNHE) 1 17-19 September 2009 UNL, Santa Fe, Argentina OUTLINE I. Bed load II. Settling
Geomorphology 5. Stream Sediment Stream Sediment
 Geomorphology 5. Stream Sediment 1 Name 47 Points LEARNING OUTCOMES 5. Stream Sediment By the end of this assignment you should be able to: Describe the relationship between particle size and critical
Elwha River response to dam removals through four years and a big flood:
 Elwha River response to dam removals through four years and a big flood: Lessons learned, channel response, and sediment effects from the world s largest engineered dam removal Andy Ritchie NPS Elwha Restoration
low turbidity high turbidity
 What is Turbidity? Turbidity refers to how clear the water is. The greater the amount of total suspended solids (TSS) in the water, the murkier it appears and the higher the measured turbidity. Excessive
Quantification of Bed-Load Transport on the Upper Mississippi River Using Multibeam Survey Data and Traditional Methods
 Quantification of Bed-Load Transport on the Upper Mississippi River Using Multibeam Survey Data and Traditional Methods by David D. Abraham and Thad Pratt PURPOSE: This Coastal and Hydraulics Engineering
Growing and decaying processes and resistance of sand waves in the vicinity of the Tone River mouth
 Advances in River Sediment Research Fukuoka et al. (eds) 2013 Taylor & Francis Group, London, ISBN 978-1-138-00062-9 Growing and decaying processes and resistance of sand waves in the vicinity of the Tone
Klamath River Dam Removal Study:
 : Prepared for California Coastal Conservancy 1330 Broadway, 13th Floor Oakland, CA 94612 (Contract No. 06-141) Prepared by 2855 Telegraph Ave. Suite 400 Berkeley, CA 94705 Acknowledgement A pre-project
Sediment Transport V: Estimating Bed-Material Transport in Gravel-Bed Rivers. UC Berkeley January 2004 Peter Wilcock
 Sediment Transport V: Estimating Bed-Material Transport in Gravel-Bed Rivers UC Berkeley January 2004 Peter Wilcock Target: sediment rating curve Q s = ƒ(q) Approaches Predict from a flow & transport model