The role of sub-antarctic mode water in global biological production. Jorge Sarmiento
|
|
|
- Moses Barrie Fields
- 5 years ago
- Views:
Transcription
1 The role of sub-antarctic mode water in global biological production Jorge Sarmiento
2 Original motivation Sediment traps suggest that ~one-third of the particulate organic matter flux at 200 m continues past the base of the main thermocline (defined as σ θ = 26.8) If nitrate lost by the above particle sinking were not replaced, the thermocline nitrate would be depleted within ~50 years! QUERY: How do nutrients return from the deep ocean to the thermocline?
 (Sarmiento et al.")
3 Hypothesis: The main return pathway for nutrients from the deep ocean is Subantarctic Mode Water (SAMW) (Sarmiento et al., Nature, 2004)
4 Primary evidence: Export production Nutrient depletion south of 30 S (Pg C yr -1 deg -1 ) normal RESULT: ~Three-quarters of biological production N of 30 S is controlled by nutrients fed in from the south. Most of the effect occurs in the density interval corresponding to SAMW and upper AAIW (σ θ < 27.3; LL model; Marinov et al., Nature, 2006)
 to the main thermocline (blue) Tracer is set to 1 in black area, set to 0 in white area, conserved in blue")
5 SAMW AAIW Northern Tropical Dye tracer simulations give more detail Dye tracers were used to determine the relative contribution of four water types (black) to the main thermocline (blue) Tracer is set to 1 in black area, set to 0 in white area, conserved in blue area.
 SAMW AAIW Tropical North (LL model)")
6 Fractional contribution of different water types to the main thermocline (σ θ < 27.4) SAMW AAIW Tropical North (LL model)

7 Fractional contribution of different water types to the main thermocline. Average above σ θ = 26.5 (LL model)
8 Three models were used: Typical model Low vertical mixing model High wind model K v = 0.6 cm 2 s -1 A I = 2000 m 2 s -1 HH K v = 0.15 cm 2 s -1 A I = 1000 m 2 s -1 LL-low K v LL with ECMWF winds (higher over Southern Ocean), narrowed Drake Passage, higher surface S in Weddell & Ross Seas, 50 cm 2 s -1 between top two layers, and 1.3 cm 2 s -1 in Southern Ocean. P2A-high wind 2 1 0
9 Fractional contributions of water types to the upper thermocline (σ θ < 26.5) by different models MODEL SAMW TROPICAL NPAC AAIW NATL HH LL-low K v P2A-high wind Annual, global average at Year 400 Simulating a strong SAMW influence requires low vertical mixing and high Southern Ocean winds

10 Phosphate partitioning in nutrient model Total Remin SAMW AAIW Tropical NAtl NPAC South (LL model)


11 Total Phosphate partitioning in LL model - average above 26.5 SAMW NPAC Tropical Remin
12 Phosphate end-members (fractional contribution) Preformed Remineralized HH LL-low K v P2A-high wind Contribution to preformed: SAMW AAIW Tropical NPAC HH LL-low K v P2A-high wind
13 Model new production: Contribution from each end-member
14 Conclusions (1) The processes controlling SAMW formation Low interior vertical mixing shifts NADW return flow from low latitudes to Southern Ocean (and North Pacific) High Southern Ocean winds increase upwelling in Southern Ocean shifting it away from North Pacific and tropics. (2) The mechanisms & pathways by which SAMW enters the upper thermocline Primarily by advection along isopycnals from southeast corner of subtropical gyres followed by upwelling along boundaries Small amount of surface (Ekman) transport to north (3) The the link of these to biological production SAMW accounts directly for about 20% of biological production in the world ocean. Indirectly (including remineralized production) SAMW and AAIW together account for more than two-thirds of biological production north of 30 S - most of this is due to SAMW.
15 Global warming response

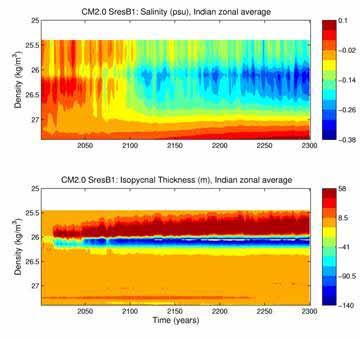
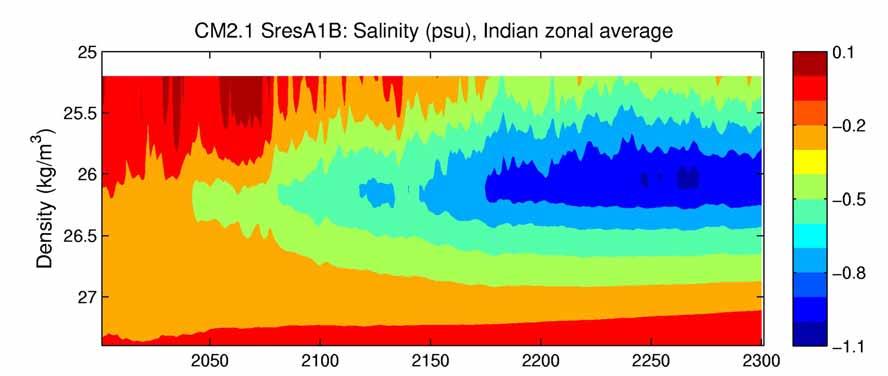
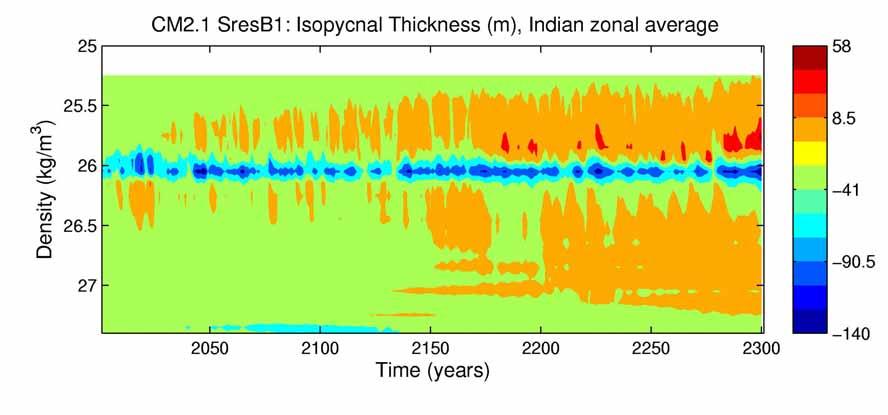
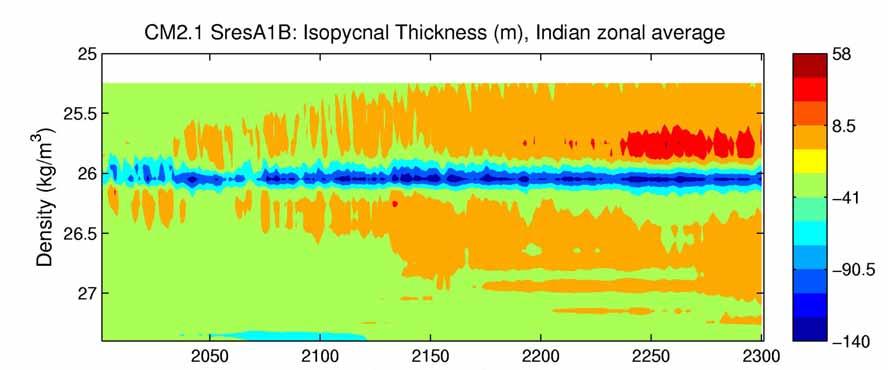
16 Salinity decreases Thickness decreases Salinity & isopycnal thickness anomaly with respect to control - Indian Ocean zonal average across 32 S - Scenario A1B, CM2.1
 northward transport decreases Upper figure shows total transport in A1B scenario Control (blue) 2100 (red) 2200 (orange) 2300 (light blue)")
17 Upper ocean (σ θ < 27.4) northward transport decreases Upper figure shows total transport in A1B scenario Control (blue) 2100 (red) 2200 (orange) 2300 (light blue) Lower figure shows anomaly with respect to control. Decreased northward transport reflects reduced meridional overturning.
18 Volume of young water (<50 yrs) doesn t decrease much - and increases in tropics 2 x CO 2 =147.8 x 10 6 km3 Control=156 x 10 6 km 3
 suggest that this reduced age is due to reduced deep upwelling associated with reduced meridional overturning.")
19 Changes in ideal age show water becoming younger at 300 m! Gnanadesikan et al. (2006) suggest that this reduced age is due to reduced deep upwelling associated with reduced meridional overturning. - They speculate that oxygen will increase and phosphate drop in O 2 minimum zones!

20 Projected GHG-Induced Warming and Precipitation Signal Looks like IOD More warming Less warming Vecchi et al (2006)

21 Projected Monsoon Rainfall Changes in 21st Century Look Like IOD Rainfall Change During Southwest Monsoon Vecchi et al (2006)
22
23
24 Role of Subantarctic Mode Water in global biological production J.L. Sarmiento, J. Simeon, & A. Gnanadesikan
25 Goals of Study To determine (1) the processes controlling SAMW formation (2) the mechanisms & pathways by which SAMW enters the upper thermocline and (3) the link of these to biological production
26 South Simple Model of Pycnocline Depth Equator North D light water after Stommel and Arons (1960) equatorial upwelling dense water NADW formation Pycnocline depth D sets the NADW formation rate. Our models are configured to all have the same pycnocline depth. Return flow is via equatorial upwelling, and thus a condition is set upon the magnitude of vertical diffusivity Kv.
27 South Include Southern Ocean Processes Equator North D light water Southern Ocean upwelling after Gnanadesikan (1999) equatorial upwelling dense water NADW formation Pycnocline depth D sets the NADW formation rate. Our models are configured to all have the same pycnocline depth. Return flow is a balance of upwelling both at the equator and in the Southern Ocean. This balance is set by along-isopycnal diffusivity Ai and vertical diffusivity Kv.

 LL-low")

28 HH NADW Meridional overturning (Sv) LL-low K v NADW P2A-high wind NADW
29 Transport in waters of σ θ < 27.4 P2A-high winds LL-low K v HH Northward flow Southward flow
30 Goals of Study To determine (1) the processes controlling SAMW formation (2) the mechanisms & pathways by which SAMW enters the upper thermocline (3) the link of these to biological production
 (LL")
31 Mass transport vectors at top of SAMW (McCartney, 1977) (LL model)


32 Separation of surface from subsurface SAMW tracer flux HH LL-low K v P2A-high wind
 The upward flux of SAMW nutrients (red) occurs primarily at the")
33 Net Phosphate flux through σ θ = 26.5 (mmol m -2 y -1 ) The upward flux of SAMW nutrients (red) occurs primarily at the boundaries on the eastern and western sides of the basins (LL model)
34 Goals of Study To determine (1) the processes controlling SAMW formation (2) the mechanisms & pathways by which SAMW enters the upper thermocline (3) the link of these to biological production
35 Phosphate end-members in upper thermocline above σ θ = 26.5 (fractional contribution) Preformed Remineralized Contribution to preformed: SAMW AAIW Tropical NPAC

36 Phosphate partitioning in LL model - average above 26.5 Total Remin SAMW AAIW Tropical NAtl NPAC South
37 HH LL-low K v Export production from each end member P2A-high wind
38 Northward transport σ θ < 27.4
39
40 SAMW Climate response
41 Response of SST, SSS, and Surface Density to Global Warming in 2050
.")
42 How will SAMW respond to global warming? Slide shows response in Hadley model (32 S mean in Indian Ocean). SAMW becomes fresher, less dense, and thicker Banks et al., (2000)

43 Intermediate depth waters in both hemispheres have become fresher in recent decades. Wong et al., 1999

44 IPCC 2000 Fossil fuel emission scenarios A1B B1 (Emissions Scenarios, IPCC 2000)
")
45 Predicted warming (IPCC) A1B B1

46 Predicted warming (IPCC)
 IPCC; Wyman (pers.")
47 Temperature increase between 1990 and 2090 (Scenario A1B) IPCC; Wyman (pers. comm.)
 IPCC; Wyman (pers.")
48 % Rainfall increase between 1990 and 2090 (Scenario A1B) IPCC; Wyman (pers. comm.)
49

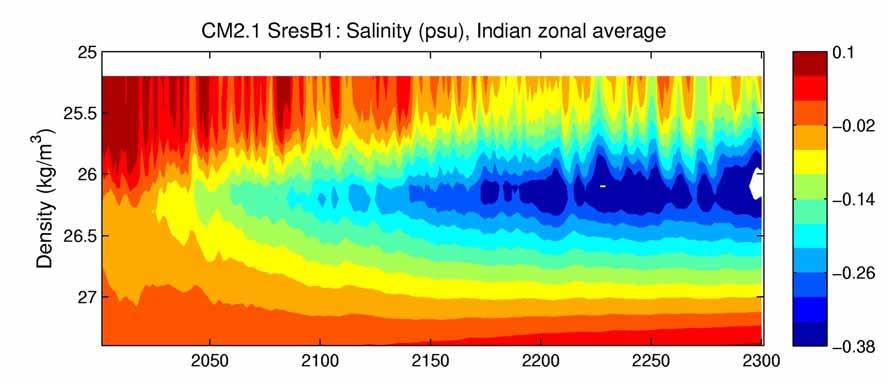
50 Scenario B1 - Anomaly with respect to control - Global zonal average across 32 S
51
52

53 Scenario A1B, CM2.0 - Anomaly with respect to control - Indian Ocean zonal average across 32 S

54 Scenario B1 - Anomaly with respect to control - Global zonal average across 32 S

55 SAMW thickness (m; σ θ )
56 Potential vorticity in 1990

57 Potential vorticity in 2300 (Scenario B1)
58
59
60 Introduction & Background
61 Nutrient depletion south of 30 S normal Evidence: Model simulations of export production (LL model) (Pg C/degree/yr) S 30 S -90% Fractional change in export production north of 30 S following nutrient depletion south of the indicated density outcrop. S 27.1 S 27.3 S 27.4 S % NOTE: Most of the effect occurs in the density interval (σ θ < 27.3) corresponding to SAMW formation Marinov et al., submitted
62 Introduction & Background
63 Model transport
64 Three models were used: Typical model Low vertical mixing model High wind model K v = 0.6 cm 2 s -1 A I = 2000 m 2 s -1 HH K v = 0.15 cm 2 s -1 A I = 1000 m 2 s -1 LL-low K v LL with ECMWF winds (higher over Southern Ocean), narrowed Drake Passage, higher surface S in Weddell & Ross Seas, 50 cm 2 s -1 between top two layers, and 1.3 cm 2 s -1 in Southern Ocean. P2A-high wind gδpd ρε 2 K v A Lxτ S Lx AI D = + S D ρ f L s y Gnanadesikan (1999)
")
65 LL Meridional overturning (Sv) HH P2A


66 pcfcs on 26.5 surface (patm) TOP: LL model BOTTOM: observations
67 MOM3 Configurations Watermass Transformation Rates by Circulation Model Circulation Model Southern Ocean Upwelling (Sv) Equatorial Upwelling (Sv) NADW Formation (Sv) Pathway of Return Flow Ai low, Kv low LL Ai high, Kv high HH Ai low, Kv high South LHS ECMWF, ndp, 4pt salinity rest, Ai low, Kv med-his (2000m) PSS Ai low, Kv med-his (2000m), 4pt salinity rest RDS Upwelling rates diagnosed from models by analyzing the meridional transport of light (σ 0 < 27.4) waters.


68 Modeled Southern Ocean Anthropogenic CO 2, CFCs, and Radiocarbon No single MOM3 configuration is able to reproduce Southern Ocean CFC, radiocarbon, and anthropogenic CO 2 inventories. Courtesy of Katsumi Matsumoto Southern Ocean 14 C
 and as surface waters (dark red).")
69 Float trajectories over 100 years Particles released in the SE Pacific SAMW formation region enter the gyres from the SE corner both as SAMW (light red & blue) and as surface waters (dark red). (LL model)

70 LL HH Float trajectories over 100 years P2A

71 Particle trajectories over 59 years Source of particles 30 m = red 60 m = orange 93 m = yellow 125m = green 157m = cyan 189m = violet Colors darken when particle upwells across σ θ = 26.5 surface
 Upwelling")
72 Vertical flux of SAMW across σ θ = 26.5 surface (m y 1 ) Upwelling Downwelling
73 QuickTime and a TIFF (LZW) decompressor are needed to see this picture.
74 Dye Tracer Simulations
75 But how does SAMW get out of the Southern Ocean and into the upper thermocline (σ θ < 26.5)? A model analysis The deep water types examined are: Subantarctic Mode Water (SAMW) Antarctic Intermediate Water (AAIW) North Atlantic waters (NATL) North Pacific waters (NPAC) Tropical deep waters (TROP)
76 Procedure followed MODELS USED: The MOM3 Princeton/GFDL family of models, with Lo Lo as the "standard" baseline SIMULATIONS: We carry out a series of "One" tracer simulations as follows: Tracer is set to 1 in the region where the particular water type forms Tracer is transported freely in the main thermocline above σ θ = Tracer is set to 0 in the deep water below σ θ = ANALYSIS: We are able to determine: The fractional contribution of each water type to the upper thermocline (σ θ < 26.5) The primary mechanisms of the input. The volumetric input per unit time of each water type


77 Schematic of "One" tracer simulations to determine the influence of different water types on the thermocline SAMW Thermocline SAMW AAIW Thermocline Thermocline SAMW SAMW AAIW AAIW Blue: "One" tracer set to 1 White: "One" tracer set to 0 Tropical Thermocline Green: "One" tracer is conserved AAIW Thermocline SAMW AAIW Thermocline SAMW SAMW AAIW AAIW Isopycnal boundaries are at σ θ = 26.5, 27.1, & 27.4 Northern Note: North Pacific and North Atlantic are separated in Northern.
 Tropical Tropical + (Tropical")
78 Dye Tracer Simulations SAMW SAMW + (SAMW AAIW) AAIW AAIW + (AAIW SAMW) Northern Northern + (Northern SAMW,AAIW) Tropical Tropical + (Tropical SAMW,AAIW)
")
79 Fractional contribution of different water types to the main thermocline (σ θ < 27.4)

80 Fractional contribution of different water types to the main thermocline. Average above σ θ = 26.5

81 RESULT 1d: Simulations show SAMW dominates the deep water input to the upper thermocline. What water types contribute to SAMW formation? Total fraction of SAMW From AAIW From "northern" & tropical waters Loss of SAMW to AAIW outcrop
82 Separation of surface from subsurface SAMW tracer flux
83 Fractional contributions of water types to the upper thermocline (σ θ < 26.5). (Annual, global average at Year 400) MODEL SAMW TROPICAL OTHER HH LL (Low vertical mixing) P2A (High Southern Ocean winds) NOTE: Simulating a strong SAMW influence requires low vertical mixing and high Southern Ocean winds
84 Fractional contributions of water types to the upper thermocline (σ θ < 26.5). (Annual, global average at Year 400) MODEL SAMW TROPICAL OTHER HH LL (Low vertical mixing) P2A (High Southern Ocean winds) HH = K v = 0.6 cm 2 s -1, A I = 2000 m 2 s -1. LL = K v = 0.15 cm 2 s -1, A I = 1000 m 2 s -1. P2A = LL with ECMWF winds (higher over Southern Ocean), narrowed Drake Passage, higher surface S in Weddell & Ross Seas, 50 cm 2 s -1 between top two layers, and 1.3 cm 2 s -1 in Southern Ocean. NOTE: Simulating a strong SAMW influence requires low vertical mixing and high Southern Ocean winds
85 Do all models show such a strong influence of SAMW? Fractional contributions of water types to the upper thermocline (σ θ < 26.5). (Annual, global average at Year 400) MODEL SAMW NPAC TROPICAL AAIW NATL LL HH P2A LL = K v = 0.15 cm 2 s -1, A I = 1000 m 2 s -1. HH = K v = 0.6 cm 2 s -1, A I = 2000 m 2 s -1. P2A = LL with ECMWF winds (higher over Southern Ocean), narrowed Drake Passage, higher surface S in Weddell & Ross Seas, 50 cm 2 s -1 between top two layers, and 1.3 cm 2 s -1 in Southern Ocean.
86 Phosphate Simulations
87 Model new production: Contribution from each end-member
88 Export production from each end member
89 Phosphate end-members (fractional contribution) Preformed Remineralized LL HH P2A Contribution to preformed: SAMW AAIW Tropical NPAC LL HH P2A

90 LL HH Net Phosphate flux through 26.5 (mmol m -2 y -1 ) P2A
91 Conclusions
92 Conclusions of model studies SAMW is the primary source of water to the upper thermocline (59%). North Pacific Intermediate Water is second (28%). Main pathway for entry of SAMW is the southeastern corner of the basins as part of the gyre transport Upward transport of SAMW occurs primarily in eastern boundary upwelling regions and in western boundary currents. Most of the oceanic production north of 30 S is driven by remineralized nutrients which originally came from the SAMW
93 Conclusions of model studies SAMW is the primary source of water to the upper thermocline (59%). North Pacific Intermediate Water is second (28%). Main pathway for entry of SAMW is the southeastern corner of the basins as part of the gyre transport Upward transport of SAMW occurs primarily in eastern boundary upwelling regions and in western boundary currents. Most of the oceanic production north of 30 S is driven by remineralized nutrients which originally came from the SAMW
94 Part 2: Conclusions Fractional contribution of each water type to the upper thermocline (σ θ < 26.5) In standard LoLo model, SAMW accounts for 59% and NPAC for 29% of deep water supply to upper thermocline. Tropical supply in LoLo model is 7% but jumps to 25% in the high vertical mixing model. SAMW and NPAC drop by similar amounts: 9% and 11%, respectively. Prince 2A (Swathi) model is 70% SAMW and 19% NPAC, with only 5% Tropical. SAMW is formed predominantly from AAIW (i.e., from south)
95
96 Si* Study

97 Consider export across the base of the main thermocline (σ θ = 26.8 surface)

98 We define the base of the upper thermocline as the σ θ = 26.5 surface Figure shows the depth of the σ θ = 26.5 surface Upper: Levitus observations Lower: Lo Lo model

99 We define the base of the upper thermocline as the σ θ = 26.5 surface (figure based on Levitus data)

100 Particle Export (mmol C m -2 d -1 ) Global Export = 12 ± 1 Pg C/yr Dunne and Sarmiento (in prep.) using satellite based primary production
: uses satellite based primary production & the average of Lutz et al.")
101 Zonal Mean Particulate Organic Carbon Flux in Top 1000 m (g C m- 2 y -1 ) >one-third of the 200 m export flux sinks past the σ θ = 26.8 (SAMW) isopycnal! Thermocline nitrate would be depleted in 53 years. Dunne et al. (in prep.): uses satellite based primary production & the average of Lutz et al. s (2002) sediment trap based remineralization functions.
102 Old paradigm How do nutrients return from abyss? Vertical mixing & upwelling
103 Problems with old vertical mixing and upwelling paradigm: Vertical mixing is at least an order of magnitude smaller than required to explain the vertical distribution of the radiocarbon balance (e.g., Ledwell et al., 1993). Generalized upwelling is inconsistent with surface radiocarbon in Pacific (Toggweiler & Samuels, 1993). So how are nutrients resupplied? The primary supply mechanism must be lateral, presumably along isopycnals (surfaces of constant density), but where does this occur?

104 SAMW forms in deep wintertime mixed layers in the Southern Ocean spanning the Subantarctic Front Density increases from 26.5 to 27.1 in an eastward circuit from W. Atlantic Ocean (McCartney, 1977) Fronts = STF (N&S), SAF, & PF Zones = SAZ and PFZ

105 Southern Ocean Nitrate and Silicic Acid Distributions An unusual characteristic of the waters spanning the Subantarctic Front is their high nitrate and low silicic acid concentrations.
106 We find that Si* = Si(OH) 4 -NO - 3 is an excellent tracer of these low silicic acid high nitrate surface waters Original motivation for Si*: Silicic acid is used by diatoms to construct frustules (shells) Diatoms grown with adequate nutrients and light take up silicic acid in a ratio of Si:N = 1 Negative Si* thus indicates a deficiency relative to diatom Si:N ratio. Positive Si* indicates a surplus relative to diatom ratio.
 matches deep wintertime mixed layer where SAMW forms (red on")
107 Si* and wintertime mixed layer depth Note that low Si* region (blue on left) matches deep wintertime mixed layer where SAMW forms (red on right).

108 There is nowhere else at the surface of the ocean where Si* is negative But why is Si* so negative in this band?`

109 Schematic of nutrient cycle in Southern Ocean -When diatoms have adequate light and nutrients, they tend to take up Si and nitrate in a ratio close to 1:1 -When stressed (e.g., by iron or light limitation), diatoms tend to build more silicified shells, leading to a Si to NO 3 uptake ratio of 2:1 and higher [Hutchins and Bruland, 1998; Takeda, 1998.] -Hypothesis: iron or light stress in Southern Ocean leads to high Si to NO 3 uptake ratio, which generates negative Si*
 isopycnal shows global extent of the SAMW influence (NOTE: we are able to demonstrate that Si* is ~conserved")
110 Si* on σ θ = 26.8 (~SAMW) isopycnal shows global extent of the SAMW influence (NOTE: we are able to demonstrate that Si* is ~conserved at this depth, except in the North Pacific where vertical exchange brings up high Si* water from below.)
 isopycnal shows that this forms")
111 Si* on σ θ = 27.4 (~AAIW) isopycnal shows that this forms south of the Si depletion zone

112 North Pacific This isopycnal surface is at the depth of the NPIW (North Pacific Intermediate Water), which forms in the Sea of Okhotsk and "mixed water region" between the Kuroshio and Oyashio Currents. Tidal mixing may play a central role. Silicic acid is not removed, perhaps because NPIW formation is due mostly to interior vertical mixing. 70% of Eq. Pac Si(OH) 4 comes from north (Dugdale et al., 2002).
")
113 Tidally driven vertical mixing at 1000 m Kurile Islands St. Laurent et al. (2003)
114 Problem: How do the nutrients return from the deep ocean into the thermocline? Old paradigm: Vertical mixing & upwelling New Paradigm: Laterally from Southern Ocean (+ North Pacific) (Sarmiento et al., 2004)
115 Implications Southern Ocean (and North Pacific) nutrient dynamics control low latitude biological productivity The SAMW return path for nutrients will likely be very sensitive to climate change. Paleo-implications examined by Brzezinski et al. (2002) & Matsumoto et al. (2002). Global warming simulations show significant impact on SAMW properties (e.g., Banks et al, 2000). The low silicic acid to relative to nitrate of SAMW represents a key factor determining Si limitation of diatoms in low latitudes.
116 Consequences Southern Ocean (and North Pacific) nutrient dynamics control low latitude biological productivity The low silicic acid to relative to nitrate of SAMW represents a key factor determining Si limitation of diatoms in low latitudes. The SAMW return path for nutrients will likely be very sensitive to climate change. Paleo-implications examined by Brzezinski et al. (2002) & Matsumoto et al. (2002).
117 Part 1 Conclusions The primary return path for nutrients into the nutricline is by upwelling in the Southern Ocean and subsequent entrainment into SAMW. The only exception is the North Pacific, where enhanced mixing appears to occur. Without the Southern Ocean return pathway, thermocline nutrients and low latitude biological productivity would plummet. The low silicic acid to relative to nitrate of SAMW represents a key factor determining Si limitation of diatoms in low latitudes. The SAMW return path for nutrients will likely be very sensitive to climate change. Paleo-implications examined by Brzezinski et al. (2002) & Matsumoto et al. (2002).
118 We find in model studies that most low latitude production is controlled by a band between σ θ = 27.3 to 27.4 and 30 S. This is where SAMW (Subantarctic Mode Water) forms.
119

120 Thermocline phosphate plummets when Southern Ocean nutrients are depleted:
121
 4 100 200 m Si(OH) ) 4 0 100 m ( - NO NO - ) 3 3 100 200 m 0 100")
122 Silicic acid to nitrate supply ratio across 100 m J opal J organic nitrogen = ( Si(OH) m Si(OH) ) m ( - NO NO - ) m m
123 Two major problems of biogeochemical oceanography 1. How does nitrate return from the deep ocean into the thermocline? 2. Why is silicic acid preferentially trapped in the deep ocean relative to nitrate?

124 WOCE Hydrographic Program Sections
")

125 Nitrate (μmol/kg) Silicic Acid (μmol/kg)

126 Si* = Si(OH) 4 -NO 3- (μmol/kg) Note that high Si* water gets to surface in the Southern Ocean, but is trapped there!

127 By contrast, nitrate is high in the thermocline because it is NOT trapped in the Southern Ocean Nitrate Preformed nitrate Remineralized nitrate calculated from Apparent Oxygen Utilization
Thermohaline and wind-driven circulation
 Thermohaline and wind-driven circulation Annalisa Bracco Georgia Institute of Technology School of Earth and Atmospheric Sciences NCAR ASP Colloquium: Carbon climate connections in the Earth System Tracer
isopycnal outcrop w < 0 (downwelling), v < 0 L.I. V. P.
, v < 0 L.I. V. P.") Ocean 423 Vertical circulation 1 When we are thinking about how the density, temperature and salinity structure is set in the ocean, there are different processes at work depending on where in the water
Ocean 423 Vertical circulation 1 When we are thinking about how the density, temperature and salinity structure is set in the ocean, there are different processes at work depending on where in the water
Tracer transport and meridional overturn in the equatorial ocean
 OFES workshops, February 2006 Tracer transport and meridional overturn in the equatorial ocean Akio Ishida with Yoshikazu Sasai, Yasuhiro Yamanaka, Hideharu Sasaki, and the OFES members Chlorofluorocarbon
Deep ocean biogeochemistry of silicic acid and nitrate
 GLOBAL BIOGEOCHEMICAL CYCLES, VOL. 21,, doi:10.1029/2006gb002720, 2007 Deep ocean biogeochemistry of silicic acid and nitrate J. L. Sarmiento, 1 J. Simeon, 1 A. Gnanadesikan, 2 N. Gruber, 3 R. M. Key,
Upper Ocean Circulation
 Upper Ocean Circulation C. Chen General Physical Oceanography MAR 555 School for Marine Sciences and Technology Umass-Dartmouth 1 MAR555 Lecture 4: The Upper Oceanic Circulation The Oceanic Circulation
A modeling study of the North Pacific shallow overturning circulation. Takao Kawasaki, H. Hasumi, 2 M. Kurogi
 PICES 2011 Annual Meeting, Khabarovsk, Russia A modeling study of the North Pacific shallow overturning circulation 1 Takao Kawasaki, H. Hasumi, 2 M. Kurogi 1 Atmosphere and Ocean Research Institute, University
SIO 210 Final Exam Dec Name:
 SIO 210 Final Exam Dec 8 2006 Name: Turn off all phones, pagers, etc... You may use a calculator. This exam is 9 pages with 19 questions. Please mark initials or name on each page. Check which you prefer
Closure of the global overturning circulation through the Indian, Pacific and Southern Oceans: schematics and transports
 Closure of the global overturning circulation through the Indian, Pacific and Southern Oceans: schematics and transports Lynne D. Talley Scripps Institution of Oceanography, UCSD La Jolla, CA 92093-0230
MERIDIONAL OVERTURNING CIRCULATION: SOME BASICS AND ITS MULTI-DECADAL VARIABILITY
 MERIDIONAL OVERTURNING CIRCULATION: SOME BASICS AND ITS MULTI-DECADAL VARIABILITY Gokhan Danabasoglu National Center for Atmospheric Research OUTLINE: - Describe thermohaline and meridional overturning
Changes in the Ventilation of the Southern Oceans, and links to Stratospheric Ozone Depletion
 Changes in the Ventilation of the Southern Oceans, and links to Stratospheric Ozone Depletion Darryn W. Waugh Dept of Earth and Planetary Sciences, Johns Hopkins University Collaborators: Francois Primeau,
IPCC AR5 WG1 - Climate Change 2013: The Physical Science Basis. Nandini Ramesh
 IPCC AR5 WG1 - Climate Change 2013: The Physical Science Basis Nandini Ramesh Seminar in Atmospheric Science 21 st February, 2014 1. Introduc,on The ocean exchanges heat, freshwater, and C with the atmosphere.
S11. Indian Ocean: Supplementary Materials
 C H A P T E R S11 Indian Ocean: Supplementary Materials FIGURE S11.1 Indian Ocean surface circulation (Tables S11.1, S11.2 and Figure 11.1). Surface height (cm). Data from Niiler, Maximenko, and McWilliams
Size matters: another reason why the Atlantic is saltier than the Pacific C.S. Jones and Paola Cessi
 Size matters: another reason why the Atlantic is saltier than the Pacific C.S. Jones and Paola Cessi Scripps Institution of Oceanography University of California, San Diego Proposed reasons for Atlantic
1 Carbon - Motivation
 1 Carbon - Motivation Figure 1: Atmospheric pco 2 over the past 400 thousand years as recorded in the ice core from Vostok, Antarctica (Petit et al., 1999). Figure 2: Air-sea flux of CO 2 (mol m 2 yr 1
SIO 210 Final examination Wednesday, December 12, :30-2:30 Eckart 227 Name:
 SIO 210 Final examination Wednesday, December 12, 2018 11:30-2:30 Eckart 227 Name: Please put your initials or name on each page, especially if you pull pages apart. Turn off all phones, ipods, etc. and
Lecture 1. Amplitude of the seasonal cycle in temperature
 Lecture 6 Lecture 1 Ocean circulation Forcing and large-scale features Amplitude of the seasonal cycle in temperature 1 Atmosphere and ocean heat transport Trenberth and Caron (2001) False-colour satellite
Three-Dimensional Pathways of the Northern Deep Waters to the Southern Ocean Surface
 Three-Dimensional Pathways of the Northern Deep Waters to the Southern Ocean Surface Lynne Talley Scripps Institution of Oceanography Workshop: Southern Ocean Dynamics and Biogeochemistry Caltech Linde
Broecker Brief. What fraction of the ocean s deep water is formed in the Northern Atlantic?
 Broecker Brief What fraction of the ocean s deep water is formed in the Northern Atlantic? Synte Peacock, Martin Visbeck and I published papers claiming that the deep Pacific and Indian Oceans received
Regional Oceanography: an Introduction
 138 Regional Oceanography: an Introduction A characteristic feature of the South Pacific Ocean is the existence of a second region of wind convergence in the tropics known as the South Pacific Convergence
Ocean Mixing and Climate Change
 Ocean Mixing and Climate Change Factors inducing seawater mixing Different densities Wind stirring Internal waves breaking Tidal Bottom topography Biogenic Mixing (??) In general, any motion favoring turbulent
Nutrient streams and their induction into the mixed layer
 GLOBAL BIOGEOCHEMICAL CYCLES, VOL. 20,, doi:10.1029/2005gb002586, 2006 Nutrient streams and their induction into the mixed layer Richard G. Williams, 1 Vassil Roussenov, 1 and Michael J. Follows 2 Received
SIO 210 Final Exam December 10, :30 2:30 NTV 330 No books, no notes. Calculators can be used.
 SIO 210 Final Exam December 10, 2003 11:30 2:30 NTV 330 No books, no notes. Calculators can be used. There are three sections to the exam: multiple choice, short answer, and long problems. Points are given
Oceanic ventilation and biogeochemical cycling: Understanding the physical mechanisms that produce realistic distributions of tracers and productivity
 GLOBAL BIOGEOCHEMICAL CYCLES, VOL. 18,, doi:10.1029/2003gb002097, 2004 Oceanic ventilation and biogeochemical cycling: Understanding the physical mechanisms that produce realistic distributions of tracers
Deep Ocean Circulation & implications for Earth s climate
 Deep Ocean Circulation & implications for Earth s climate I. Ocean Layers and circulation types 1) Ocean Layers Ocean is strongly Stratified Consists of distinct LAYERS controlled by density takes huge
SIO 210 Final examination Answer Key for all questions except Daisyworld. Wednesday, December 10, PM Name:
 SIO 210 Final examination Answer Key for all questions except Daisyworld. Wednesday, December 10, 2008 3-6 PM Name: This is a closed book exam. You may use a calculator. There are two parts: Talley (weighted
Diapycnal Mixing Deductions from the Large-Scale, Time-Mean, World Ocean Temperature-Salinity Distribution
 Diapycnal Mixing Deductions from the Large-Scale, Time-Mean, World Ocean Temperature-Salinity Distribution O. Arzel and A. Colin de Verdière Laboratoire de Physique des Océans (LPO/UBO) March 6, 2015 Idealized
Thermohaline Circulation
 OCEAN CIRCULATION / Thermohaline Circulation 1549 distinctly nonsteady character of the ocean circulation. Ocean currents are remarkably variable. Variability on much shorter time scales of weeks and months,
1. Introduction 2. Ocean circulation a) Temperature, salinity, density b) Thermohaline circulation c) Wind-driven surface currents d) Circulation and
 Temperature, salinity, density b) Thermohaline circulation c) Wind-driven surface currents d) Circulation and") 1. Introduction 2. Ocean circulation a) Temperature, salinity, density b) Thermohaline circulation c) Wind-driven surface currents d) Circulation and climate change e) Oceanic water residence times 3.
1. Introduction 2. Ocean circulation a) Temperature, salinity, density b) Thermohaline circulation c) Wind-driven surface currents d) Circulation and climate change e) Oceanic water residence times 3.
Where is all the water?
 Where is all the water? The distribution of water at the Earth's surface % of total Oceans 97.25 Ice caps and glaciers 2.05 Groundwater 0.68 Lakes 0.01 Soils 0.005 Atmosphere (as vapour) 0.001 Rivers 0.0001
Ekman Transport Dominates Local Air Sea Fluxes in Driving Variability of Subantarctic Mode Water
 1308 JOURNAL OF PHYSICAL OCEANOGRAPHY VOLUME 32 Ekman Transport Dominates Local Air Sea Fluxes in Driving Variability of Subantarctic Mode Water STEPHEN R. RINTOUL Antarctic CRC, and CSIRO Division of
Upper ocean control on the solubility pump of CO 2
 Journal of Marine Research, 61, 465 489, 2003 Upper ocean control on the solubility pump of CO 2 by Takamitsu Ito 1 and Michael J. Follows 1 ABSTRACT We develop and test a theory for the relationship of
Pathways in the ocean
 Pathways Pathways in the in the ocean by Sybren Drijfhout Introduction The properties of water masses in the ocean are set by air-sea interactions at the surface and convective overturning. As direct transfer
Climate sensitivity of coupled models with differing ocean components
 Climate sensitivity of coupled models with differing ocean components Alex Megann, Adam Blaker and Adrian New National Oceanography Centre, Southampton, UK LOM Workshop, Miami, February 2011 Overview Introduction
Abyssal Ocean Circulation. Raffaele Ferrari Earth, Atmospheric and Planetary Sciences, MIT Les Houches, August 2017
 Abyssal Ocean Circulation Raffaele Ferrari Earth, Atmospheric and Planetary Sciences, MIT Les Houches, August 2017 Outline The deep ocean The deep circulation The sinking branch: deep convection The upwelling
CHAPTER 7 Ocean Circulation Pearson Education, Inc.
 CHAPTER 7 Ocean Circulation 2011 Pearson Education, Inc. Types of Ocean Currents Surface currents Deep currents 2011 Pearson Education, Inc. Measuring Surface Currents Direct methods Floating device tracked
Atmosphere, Ocean, Climate Dynamics: the Ocean Circulation EESS 146B/246B
 Atmosphere, Ocean, Climate Dynamics: the Ocean Circulation EESS 146B/246B Instructor: Leif Thomas TA: Gonçalo Zo Zo Gil http://pangea.stanford.edu/courses/eess146bweb/ Course Objectives Identify and characterize
Jacob Schewe Potsdam Institute for Climate Impact Research. Ocean circulation under climate change: Examples of qualitative changes
 Jacob Schewe Potsdam Institute for Climate Impact Research Ocean circulation under climate change: Examples of qualitative changes Acknowledgments Anders Levermann Potsdam Institute for Climate Impact
ATOC 5051 INTRODUCTION TO PHYSICAL OCEANOGRAPHY. Lecture 19. Learning objectives: develop a physical understanding of ocean thermodynamic processes
 ATOC 5051 INTRODUCTION TO PHYSICAL OCEANOGRAPHY Lecture 19 Learning objectives: develop a physical understanding of ocean thermodynamic processes 1. Ocean surface heat fluxes; 2. Mixed layer temperature
Internal boundary layers in the ocean circulation
 Internal boundary layers in the ocean circulation Lecture 9 by Andrew Wells We have so far considered boundary layers adjacent to physical boundaries. However, it is also possible to find boundary layers
SIO 210 Introduction to Physical Oceanography Mid-term examination November 3, 2014; 1 hour 20 minutes
 NAME: SIO 210 Introduction to Physical Oceanography Mid-term examination November 3, 2014; 1 hour 20 minutes Closed book; one sheet of your own notes is allowed. A calculator is allowed. (100 total points.)
Climate Variability Studies in the Ocean
 Climate Variability Studies in the Ocean Topic 1. Long-term variations of vertical profiles of nutrients in the western North Pacific Topic 2. Biogeochemical processes related to ocean carbon cycling:
Project Retrograde imagine Earth rotated in the opposite direction
 Project Retrograde imagine Earth rotated in the opposite direction The rotation of Earth shapes our climate system in various ways: It controls the major wind directions, lets the weather systems swirl,
GLOBAL BIOGEOCHEMICAL CYCLES, VOL. 26, GB2014, doi: /2010gb003980, 2012
 GLOBAL BIOGEOCHEMICAL CYCLES, VOL. 26,, doi:10.1029/2010gb003980, 2012 13 C constraints on ocean carbon cycle models Rolf E. Sonnerup 1 and Paul D. Quay 2 Received 28 October 2010; revised 1 March 2012;
Chapter 6. Antarctic oceanography
 Chapter 6 Antarctic oceanography The region of the world ocean bordering on Antarctica is unique in many respects. First of all, it is the only region where the flow of water can continue all around the
Regional Oceanography: an Introduction
 64 Regional Oceanography: an Introduction 2500 m depth, or 10-30% of the speeds observed at the 500 m level. It is therefore easy to see why the Circumpolar Current has the largest mass transport of all
Ocean Constraints on the Atmospheric Inverse Problem: The contribution of Forward and Inverse Models
 Ocean Constraints on the Atmospheric Inverse Problem: The contribution of Forward and Inverse Models Nicolas Gruber Institute of Geophysics and Planetary Physics & Department of Atmospheric Sciences, University
Chapter 17 Tritium, Carbon 14 and other "dyes" James Murray 5/15/01 Univ. Washington (note: Figures not included yet)
") Chapter 17 Tritium, Carbon 14 and other "dyes" James Murray 5/15/01 Univ. Washington (note: Figures not included yet) I. Cosmic Ray Production Cosmic ray interactions produce a wide range of nuclides in
Chapter 17 Tritium, Carbon 14 and other "dyes" James Murray 5/15/01 Univ. Washington (note: Figures not included yet) I. Cosmic Ray Production Cosmic ray interactions produce a wide range of nuclides in
Atmosphere-ocean interactions and dynamic response of the Southern Ocean to climate variability and trends. Mike Meredith BAS, Cambridge, UK
 Atmosphere-ocean interactions and dynamic response of the Southern Ocean to climate variability and trends. Mike Meredith BAS, Cambridge, UK Structure Preliminary random thoughts Brief examples demonstrating
psio 210 Introduction to Physical Oceanography Mid-term examination November 3, 2014; 1 hour 20 minutes Answer key
 NAME: psio 210 Introduction to Physical Oceanography Mid-term examination November 3, 2014; 1 hour 20 minutes Answer key Closed book; one sheet of your own notes is allowed. A calculator is allowed. (100
Impact of atmospheric CO 2 doubling on the North Pacific Subtropical Mode Water
 GEOPHYSICAL RESEARCH LETTERS, VOL. 36, L06602, doi:10.1029/2008gl037075, 2009 Impact of atmospheric CO 2 doubling on the North Pacific Subtropical Mode Water Hyun-Chul Lee 1,2 Received 19 December 2008;
OCN 201 Fall nd mid term Section 1
 Name: Class: _ Date: _ OCN 201 Fall 2013 2nd mid term Section 1 True/False Indicate whether the statement is true or false. 1. The hydrothermal vent sites at Loihi have lots of animals around them. 2.
Ocean dynamics: the wind-driven circulation
 Ocean dynamics: the wind-driven circulation Weston Anderson March 13, 2017 Contents 1 Introduction 1 2 The wind driven circulation (Ekman Transport) 3 3 Sverdrup flow 5 4 Western boundary currents (western
Typical Arctic profiles. How to form halocline water? 2012 Changing Arctic Ocean 506E/497E - Lecture 7 - Woodgate
 Schematic Surface and Atlantic Circulation Typical Arctic profiles MIXED LAYER Usually thin (no wind stirring) PACIFIC WATER High nutrients Shallow (
On the world-wide circulation of the deep water from the North Atlantic Ocean
 Journal of Marine Research, 63, 187 201, 2005 On the world-wide circulation of the deep water from the North Atlantic Ocean by Joseph L. Reid 1 ABSTRACT Above the deeper waters of the North Atlantic that
ATOC 5051 INTRODUCTION TO PHYSICAL OCEANOGRAPHY. Lecture 2
 ATOC 5051 INTRODUCTION TO PHYSICAL OCEANOGRAPHY Lecture 2 Ocean basins and relation to climate Learning objectives: (1)What are the similarities and differences among different ocean basins? (2) How does
Possible mechanism of bi-decadal North Pacific ocean/climate variability in relation to 18.6-year nodal tidal cycle
 Possible mechanism of bi-decadal North Pacific ocean/climate variability in relation to 18.6-year nodal tidal cycle Ichiro Yasuda and Satoshi Osafune (Ocean Research Institute, Univ. Tokyo) Hiroaki Tatebe
Honours Thesis: Impacts of Latitude Shifts in the Southern. Ocean Westerly Winds on Past and Present. Climates
 Honours Thesis: Impacts of Latitude Shifts in the Southern Ocean Westerly Winds on Past and Present Climates StéphanieDupré Department of Physical Oceanography/Meteorology School of Mathematics University
ROLES OF THE OCEAN MESOSCALE IN THE LATERAL SUPPLY OF MASS, HEAT, CARBON AND NUTRIENTS TO THE NORTHERN HEMISPHERE SUBTROPICAL GYRE
 ROLES OF THE OCEAN MESOSCALE IN THE LATERAL SUPPLY OF MASS, HEAT, CARBON AND NUTRIENTS TO THE NORTHERN HEMISPHERE SUBTROPICAL GYRE AYAKO YAMAMOTO 1*, JAIME B. PALTER 1,2, CAROLINA O. DUFOUR 1,3, STEPHEN
What governs the location of the Southern Ocean deep winter mixing in CESM
 NSF NCAR WYOMING SUPERCOMPUTER CENTER DOE SCIDAC FUNDED PROJECT What governs the location of the Southern Ocean deep winter mixing in CESM Justin Small Dan Whitt Alice DuVivier Matt Long Acknowledging:
Interannual variations of water mass volumes in the Southern Ocean
 Journal of Atmospheric and Ocean Science Vol. 10, No. 1, March 2005, 31 42 Interannual variations of water mass volumes in the Southern Ocean MATTHIAS TOMCZAK* and SHARON LIEFRINK School of Chemistry,
Capabilities of Ocean Mixed Layer Models
 Capabilities of Ocean Mixed Layer Models W.G. Large National Center for Atmospheric Research Boulder Co, USA 1. Introduction The capabilities expected in today s state of the art models of the ocean s
Weather & Ocean Currents
 Weather & Ocean Currents Earth is heated unevenly Causes: Earth is round Earth is tilted on an axis Earth s orbit is eliptical Effects: Convection = vertical circular currents caused by temperature differences
Part 1. Ocean Composition & Circulation
 OCN 401 Biogeochemical Systems (10.19.17) (Schlesinger: Chapter 9) Part 1. Ocean Composition & Circulation 1. Introduction Lecture Outline 2. Ocean Circulation a) Global Patterns in T, S, ρ b) Thermohaline
Carbon sources and sinks from an Ensemble Kalman Filter ocean data assimilation
 Click Here for Full Article GLOBAL BIOGEOCHEMICAL CYCLES, VOL. 24,, doi:10.1029/2009gb003531, 2010 Carbon sources and sinks from an Ensemble Kalman Filter ocean data assimilation M. Gerber 1 and F. Joos
Water mass transport associated with the oceanic fronts in the northwestern Pacific Ocean HIDEYUKI NAKANO (METEOROLOGICAL RESEARCH INSTITUTE)
") Water mass transport associated with the oceanic fronts in the northwestern Pacific Ocean HIDEYUKI NAKANO (METEOROLOGICAL RESEARCH INSTITUTE) How is the Kuroshio-origin water distributed in the subtropical
Water mass transport associated with the oceanic fronts in the northwestern Pacific Ocean HIDEYUKI NAKANO (METEOROLOGICAL RESEARCH INSTITUTE) How is the Kuroshio-origin water distributed in the subtropical
Chapter 6. Antarctic oceanography
 Chapter 6 Antarctic oceanography The region of the world ocean bordering on Antarctica is unique in many respects. First of all, it is the only region where the flow of water can continue all around the
Surface Circulation. Key Ideas
 Surface Circulation The westerlies and the trade winds are two of the winds that drive the ocean s surface currents. 1 Key Ideas Ocean water circulates in currents. Surface currents are caused mainly by
Chapter 4. Understanding the Weather. Weather is short-term and caused by various air and ocean circulations
 Video: Meteorologist Paul Douglas April 2013 Understanding the Weather Weather is short-term and caused by various air and ocean circulations There are natural climate cycle that cause large climate changes
MAR 110 LECTURE #10 The Oceanic Conveyor Belt Oceanic Thermohaline Circulation
 1 MAR 110 LECTURE #10 The Oceanic Conveyor Belt Oceanic Thermohaline Circulation Ocean Climate Temperature Zones The pattern of approximately parallel oceanic surface isotherms (lines of constant temperature)
2/15/2012. Earth System Science II EES 717 Spring 2012
 Earth System Science II EES 717 Spring 2012 1. The Earth Interior Mantle Convection & Plate Tectonics 2. The Atmosphere - Climate Models, Climate Change and Feedback Processes 3. The Oceans Circulation;
OCN/ATM/ESS 587. Ocean circulation, dynamics and thermodynamics.
 OCN/ATM/ESS 587 Ocean circulation, dynamics and thermodynamics. Equation of state for seawater General T/S properties of the upper ocean Heat balance of the upper ocean Upper ocean circulation Deep circulation
Basic Ocean Current Systems. Basic Ocean Structures. The State of Oceans. Lecture 6: The Ocean General Circulation and Climate. Temperature.
 Lecture 6: The Ocean General Circulation and Climate Basic Ocean Current Systems Upper Ocean surface circulation Basic Structures Mixed Layer Wind-Driven Circulation Theories Thermohaline Circulation Ocean
Atmospheric Sciences 321. Science of Climate. Lecture 20: More Ocean: Chapter 7
 Atmospheric Sciences 321 Science of Climate Lecture 20: More Ocean: Chapter 7 Community Business Quiz discussion Next Topic will be Chapter 8, Natural Climate variability in the instrumental record. Homework
A Broecker Brief Origin of the Atlantic s glacial age lower deep water
 A Broecker Brief Origin of the Atlantic s glacial age lower deep water Today s deep Atlantic shows no hint of nutrient stratification (see Figure 1). By contrast, during the last glacial maximum (LGM),
Chapter 7: Thermodynamics
 Chapter 7: Thermodynamics 7.1 Sea surface heat budget In Chapter 5, we have introduced the oceanic planetary boundary layer-the Ekman layer. The observed T and S in this layer are almost uniform vertically,
Seawater Chemistry and Chemical Oceanography. The Universal Solvent. Sphere of Hydration
 Seawater Chemistry and Chemical Oceanography The Universal Solvent Polarity of molecule makes water very effective at hydrating even weakly charged ions Sphere of Hydration Polarity of water molecules
Actual bathymetry (with vertical exaggeration) Geometry of the ocean 1/17/2018. Patterns and observations? Patterns and observations?
 Geometry of the ocean 1/17/2018. Patterns and observations? Patterns and observations?") Patterns and observations? Patterns and observations? Observations? Patterns? Observations? Patterns? Geometry of the ocean Actual bathymetry (with vertical exaggeration) Continental Continental Basin
Patterns and observations? Patterns and observations? Observations? Patterns? Observations? Patterns? Geometry of the ocean Actual bathymetry (with vertical exaggeration) Continental Continental Basin
1. The figure shows sea surface height (SSH) anomaly at 24 S (southern hemisphere), from a satellite altimeter.
 anomaly at 24 S (southern hemisphere), from a satellite altimeter.") SIO 210 Problem Set 3 November 16, 2015 1. The figure shows sea surface height (SSH) anomaly at 24 S (southern hemisphere), from a satellite altimeter. (a) What is the name of this type of data display?_hovmöller
SIO 210 Problem Set 3 November 16, 2015 1. The figure shows sea surface height (SSH) anomaly at 24 S (southern hemisphere), from a satellite altimeter. (a) What is the name of this type of data display?_hovmöller
Arnold L. Gordon Retroflections and Bifurcations Johann Lutjeharms Memorial Lecture
 The Agulhas System and its Role in Changing Ocean Circulation, Climate & Marine Ecosystems Spier Hotel, Stellenbosch, Western Cape, South Africa 8 12 October 2012 Brazil/Malvinas Agulhas Retroflection
θ-s structure of the North Atlantic circulation and the associated heat/freshwater transports
 θ-s structure of the North Atlantic circulation and the associated heat/freshwater transports Xiaobiao Xu 1, Peter Rhines 2, and Eric Chassignet 1 1 Florida State University; 2 University of Washington
CLIMATE VARIABILITY AND PREDICTABILITY
 CLIMATE VARIABILITY AND PREDICTABILITY Workshop on Tropical Atlantic Variability 3-6 September 2001, Paris, France Working Groups Reports January 2002 Working Group 1: Coupled Ocean-Atmospheric Systems
1.Decadal prediction ( ) 2. Longer term (to 2100 and beyond)
 2. Longer term (to 2100 and beyond)") Coordinated climate change experiments (formulated by WGCM and AIMES) to be run for assessment in IPCC AR5 Two classes of models to address two time frames and two sets of science questions: 1.Decadal
Coordinated climate change experiments (formulated by WGCM and AIMES) to be run for assessment in IPCC AR5 Two classes of models to address two time frames and two sets of science questions: 1.Decadal
Decadal variability in the Kuroshio and Oyashio Extension frontal regions in an eddy-resolving OGCM
 Decadal variability in the Kuroshio and Oyashio Extension frontal regions in an eddy-resolving OGCM Masami Nonaka 1, Hisashi Nakamura 1,2, Youichi Tanimoto 1,3, Takashi Kagimoto 1, and Hideharu Sasaki
Jeffrey Polovina 1, John Dunne 2, Phoebe Woodworth 1, and Evan Howell 1
 Projected expansion of the subtropical biome and contraction of the temperate and equatorial upwelling biomes in the North Pacific under global warming Jeffrey Polovina 1, John Dunne 2, Phoebe Woodworth
AMOC Impacts on Climate
 AMOC Impacts on Climate Rong Zhang GFDL/NOAA, Princeton, NJ, USA Paleo-AMOC Workshop, Boulder, CO, USA May 24, 2016 Atlantic Meridional Overturning Circulation (AMOC) Kuklbrodt et al. 2007 McManus et al.,
Invited paper on the South Atlantic J. Lutjeharms
 AGU Chapman Conference on the Agulhas System Stellenbosch South Africa October 8 12, 2012 With regard to the thermohaline circulation, we identify some key locations where very important processes occur,
On the Role of Wind-Driven Sea Ice Motion on Ocean Ventilation
 3376 JOURNAL OF PHYSICAL OCEANOGRAPHY VOLUME 32 On the Role of Wind-Driven Sea Ice Motion on Ocean Ventilation OLEG A. SAENKO, ANDREAS SCHMITTNER, AND ANDREW J. WEAVER School of Earth and Ocean Sciences,
Ocean & climate: an introduction and paleoceanographic perspective
 Ocean & climate: an introduction and paleoceanographic perspective Edouard BARD Chaire de l évolution du climat et de l'océan du Collège de France CEREGE, UMR CNRS, AMU, IRD, CdF Aix-en-Provence The ocean
C
 C 0.8 0.4 0.2 0.0-0.2-0.6 Fig. 1. SST-wind relation in the North Pacific and Atlantic Oceans. Left panel: COADS SST (color shade), surface wind vectors, and SLP regressed upon the Pacific Decadal Oscillation
RECENT STUDIES OF THE SEA OF OKHOTSK
 RECENT STUDIES OF THE SEA OF OKHOTSK Masaaki Wakatsuchi Institute of Low Temperature Science, Hokkaido University, Sapporo, Japan ABSTRACT We recently have had a Japan-Russia-United States International
Lecture 8. Monsoons and the seasonal variation of tropical circulation and rainfall
 Lecture 8 Monsoons and the seasonal variation of tropical circulation and rainfall According to the second hypothesis, the monsoon is a manifestation of the seasonal variation of the tropical circulation
The Structure of the Wind-Driven Circulation in the Subtropical South Pacific Ocean*
 JUNE 1998 HUANG AND QIU 1173 The Structure of the Wind-Driven Circulation in the Subtropical South Pacific Ocean* RUI XIN HUANG Department of Physical Oceanography, Woods Hole Oceanographic Institution,
Part I. Modern Oceanography
 Part I Modern Oceanography 27 Chapter 3 Pacific Intermediate Waters 3.1 Abstract Modern geochemical tracers suggest that there are three intermediate water masses in the Pacific Ocean: North Pacific Intermediate
Oceans and Climate. Caroline Katsman. KNMI Global Climate Division
 Oceans and Climate Caroline Katsman KNMI Global Climate Division Aimée Slangen, Roderik van de Wal (IMAU, Utrecht University) Sybren Drijfhout, Wilco Hazeleger (KNMI, Global Climate) Bert Vermeersen (NIOZ/Delft
CHAPTER 9 ATMOSPHERE S PLANETARY CIRCULATION MULTIPLE CHOICE QUESTIONS
 CHAPTER 9 ATMOSPHERE S PLANETARY CIRCULATION MULTIPLE CHOICE QUESTIONS 1. Viewed from above in the Northern Hemisphere, surface winds about a subtropical high blow a. clockwise and inward. b. counterclockwise.
Ocean Circulation. In partnership with Dr. Zafer Top
 Ocean Circulation In partnership with Dr. Zafer Top Samantha Hampton Honors Science December 15, 2014 Ocean Circulation is the large scale movement of waters in the ocean basins. Dr. Zafer Top studies
Recent warming and changes of circulation in the North Atlantic - simulated with eddy-permitting & eddy-resolving models
 Recent warming and changes of circulation in the North Atlantic - simulated with eddy-permitting & eddy-resolving models Robert Marsh, Beverly de Cuevas, Andrew Coward & Simon Josey (+ contributions by
LETTERS. Anthropogenic carbon dioxide transport in the Southern Ocean driven by Ekman flow. T. Ito 1, M. Woloszyn 1 & M. Mazloff 2
 Vol 463 7 January 21 doi:1.138/nature8687 Anthropogenic carbon dioxide transport in the Southern Ocean driven by Ekman flow T. Ito 1, M. Woloszyn 1 & M. Mazloff 2 The Southern Ocean, with its large surface
Wind Stress Effects on Subsurface Pathways from the Subtropical to Tropical Atlantic
 AUGUST 2002 INUI ET AL. 2257 Wind Stress Effects on Subsurface Pathways from the Subtropical to Tropical Atlantic TOMOKO INUI Department of Earth, Atmospheric, and Planetary Sciences, Massachusetts Institute
Oceanography of the tropical Pacific Ocean Part 2 Historical changes and future projections
 Oceanography of the tropical Pacific Ocean Part 2 Historical changes and future projections A. Ganachaud 1, A. Sen Gupta 2, J. Brown 3, L. Muir 3, with contributions from J. Orr, S. Wijffels, K. Ridgway,