The study for assessment of ecosystem, coastal erosion and protection / rehabilitation of damaged area in Tuvalu
|
|
|
- Elfrieda Lawrence
- 5 years ago
- Views:
Transcription
1 2.4 Bathymetric Survey The bathymetric survey on this study was conducted on October to November 2009 during the baseline study in Phase 2, using a set of single-beam echo sounder, in the lagoon area of Fongafale islet as shown in Figure Moreover, detailed bathymetric survey was performed on the end of June 2010 during the feasibility study in the target zone for coastal protection measures. (1) Bathymetric Survey in Fongafale a) Overview of Bathymetric Survey The survey achieved coverage within the lagoon to an average distance of 1.0 km from the shoreline, reaching water depths of some 50 meters, mainly along the coastline of Fongafale islet as shown in Figure The survey lines were spaced at about 100 meters interval and the total survey lines were more than 200 lines. The positioning during the survey was performed by RTK GPS, using a Trimble R8 system. The GPS base station was set up at two different locations during the survey to get a real time kinematic GPS positions during the survey. Observed soundings from the bathymetric survey were reduced to the Chart Datum using hourly sea level data from the tide gauge in Funafuti through the South Pacific Sea Level and Climate Monitoring Project. The processed data were individually plotted as per the surveyed lines and these transect lines are shown in cross sectional profiles with event marks at 50 meters interval. PII-S1-69

2 Figure 2.17 Sounding Coverage in Funafuti Lagoon PII-S1-70
3 b) Result of Bathymetric Survey The details for the bathymetric survey results are provided in Data Book attached to this report. The contents of the bathymetric survey in the Data Book are as follows; 1 Coverage of echo-sounding in Funafuti lagoon 2 Cross-section of survey lines in Funafuti lagoon 3 Bathymetric map in Funafuti lagoon The results of the bathymetric survey in the lagoon area on this study were compiled as a set of cross sections more than 200 lines and a bathymetric chart. These results are shown in Data Book together with coverage of echo-sounding (track chart) as mentioned above. Figure 2.18 shows representative samples of cross sections in front of the Fisheries Department (the north part of Fongafale), the south of Catalina Ramp (the central part of Fongafale) and the Water Boy: seawater desalination station (the south part of Fongafale) as a reference. The resultant data compilation was used to produce a bathymetry chart of Funafuti at a scale of 1:250,000 in the A0 sized chart. These new bathymetric maps give a descriptive picture of the ocean bottom terrain, vividly revealing the size, shape and distribution of underwater features. Figure 2.19 is the reduced drawing of these bathymetric maps. PII-S1-71
4 North Part (Line N-14: Fisheries Dep.) Central Part (Line S-100: Catalina Ramp) South Part (Line S-85: Water Boy) Figure 2.18 Sample of Cross Sections in Funafuti Lagoon PII-S1-72

5 Figure 2.19 Bathymetric Maps in Funafuti Lagoon PII-S1-73
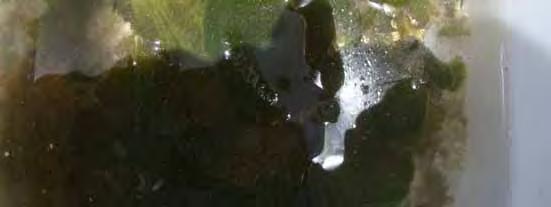
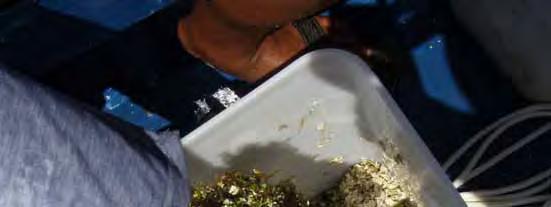
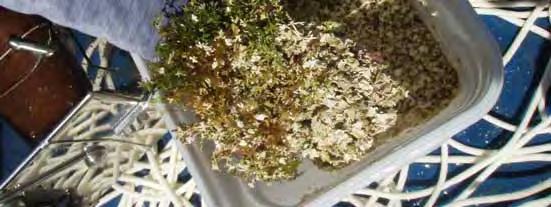
6 2.5 Bottom Sediment Survey Methodology The bottom material sampling was made at 2 points on the oceanic side and at 13 points in the lagoon (sea bottom sand sampling) and at 20 points in the vicinity of the shore line (shore line sand sampling), or 35 points in total. The sampling was be made in the surface layer. The sampling positions were measured using a simple handheld Garmin GPS. The sea bottom sand sampling was obtained using the Ekman-Birge type bottom sampler prepared by Client. The shore line sand sampling was obtained by a surveyor with a hand scoop to collect samples directly. Samples were collected 3 times or more per sampling point as mixed samples. In the field survey, the weather, atmospheric temperature, wave grade, water depth, smell of samples, appearance of samples (sand material color, admixtures) was recorded. The collected samples were dried out in sunlight in Tuvalu and again in an oven at SOPAC premises at 70 Celsius. The dried samples were split into two, one for grain size analysis and the other for analysis of sand composition ratio. PII-S1-74
7 Figure2.20 Sample location map PII-S1-75


8 Figure 2.21 Sediment sample analysis procedure. Figure Hand-held GPS used for getting sample site locations. PII-S1-76


9 Figure 2.23 Sea bottom sand sampling using the Ekman-Birge type bottom sediment sampler PII-S1-77


10 Figure 2.24 Sand samples set out to dry in Tuvalu PII-S1-78
11 2.5.2 RESULTS (1) Sediment Sample Log Sheet Date: Monday 26/10/09 Collector: Ashishika and Salesh Collectors Location Time Latitude Longitude Colour Size Components Hand Specimen No. SLS 14 Vasafua Pale cream with pinkish forams Medium to coarse with rubble cobble size Foraminifera, shell fragments, coral rubble Medium grain size, to coarse sand with rubble and cobble sized grains SLS 10 Funafara White/grey Medium Forams, shell fragments, beach rock fragments Coral and shell fragments, small to medium size grains. Pale grey in color SLS 11 Telele Pinkish and white sediment particles Fine to medium. Some coarse. Shell fragments, lots of forams Fine to medium, some coarse. Pink sediment (forams) dominant) SLS 12 Tefala Light pink to orange Fine to medium. Some pebbles. Forams, coral fragments, rock pebbles. Light orange colored sediments, Beachrock surrounding the area and lots of beachrock fragments in the sediment. SB 9 Southern part of lagoon, in between Tefala and Mateiko Cream Very fine Very fine sand. Very fine cream colored sand. Crabs and worms visible. Depth = 14.5m PII-S1-79
12 SLS 13 Fuagea Pink (forams), white (forams, coral fragments and shells) Medium to coarse Forams, shell and corral fragments Pink and white sediments, consisting of forams, shell and coral fragments. Date: Tuesday 27/10/09 Collector: Ashishika and Salesh Collector s No. SLS 20 Location Time Latitude Longitude Color Size Components Description Sand key between Mulitefala and Amatuku 0848 am White to grey Medium to coarse. Pebbles are dominant SLS 17 Tepuka Pink and white Medium to coarse Coral fragments, beach rock pebbles, forams Coral fragments, forams Coarse, pebbly sediment, greyish in color. Forams dominant if dig in deeper. Mostly pinkish sediment consisting mainly of forams, with whitish coral fragments. SLS 16 Fualopa White surface sediment with pinkish foram dominant sediment underneath Medium to coarse Shell fragments, coral fragments, forams, beach rock fragments Coral rubble, beach rock fragments, forams below surface PII-S1-80
13 SLS 15 Fuafatu Greyish Medium to coarse, littered with rubble and rock cobbles Coral and beach rock fragments. Forams. Coral and rock fragments/ cobbles/ rubble and forams. Grey creamy color. SB 8 Between Vasafua and Fuagea Pink and white Medium to coarse Lots of forams, M. vertebralis and Amphistegina Grab sample attempted at 3 different places with no luck before sample was collected at location close to reef. Sample depth at 9m SB 7 Off Fualopa Pale pink to creamy sediments Very fine to medium with some coarse. Halimeda, red coral and shell fragments Grab sample with fine to coarse particles, Halimeda and red coral fragments shown along with forams and shell fragments SB 6 Off Tepuka Cream colored Very fine with forams Very fine sand. Some forams can be seen Grab sample at 10 m. Very fine sand with forams and worms. SB 4 Middle of Amatuku and Tengako Cream pink Very fine with forams Forams, fine sand Grab sample at 12 m. Sediment very fine and littered with forams PII-S1-81
14 Date: Wednesday 28/10/09 Collector: Ashishika, Salesh and Toutou Collector s No. SLS 1 SLS 2 Location Time Latitude Longitude Color Size Components Description Northern tip of Tengako Middle of Tengako Islands Light orange, grey at LWM Grey pinkish orange Medium to coarse Medium to coarse SLS 3 Causeway Light orange Medium to coarse, with scattered pebbles Forams, coral fragments, beachrock fragments Forams, shell fragments, coral fragments, beach rock fragments Forams, shells and coral fragments Medium to coarse sediments consisting of beach rock fragments and coral fragments. Forams dominant. Area surrounded by beachrock. Beach layered in sediment sizes. Generally medium to coarse sediments consisting of forams, shell, coral and beach rock fragments Very little sand around the causeway. Area surrounded by beachrock. SB 3 SB 15 Site in line with the causeway but in deeper waters. Middle of lagoon Pale pinkish color Cream to pale green Coarse 95 % Halimeda Grab sample taken at depth of 33m. Sediments consist mostly of Halimeda. Coarse Mostly Halimeda Grab sample taken at 49m. Sediments consist of mostly Halimeda. PII-S1-82
15 SB 14 Middle of lagoon Pale green Coarse Mostly Halimeda Grab sample taken at 40m. Sediments mostly Halimeda of a new kind of species. Halimeda seems to be growing at base of an alga. SLS 9 Falefatu Cream Very fine sand with reef rubble surrounding the area Sand is too fine to see with eye. Reef rubble. A patch of very fine sand surrounded by reef rubble SB 10 Off Funamanu (Te Ula Bunga) Pale green and pink Coarse Halimeda Grab sample at depth 40m. 95% Halimeda in the sediments SLS 8 Funangong o Cream Fine to coarse sand with big boulders scattered around SLS 7 Fatato White to cream colored Coarse sand, pebbles, rubble Coral fragments, beach rock fragments, Forams Forams, beach rock fragments, coral fragments Coral and beach rock fragments. Boulders of max 50 cm diameter. Sand quite coarse with pebbles, rubble dominant all around the site. SB 11 Paasage between Fatato and Fongafale Pinkish reddish color Coarse Halimeda, gastropods. Grab sample at 41m. Mostly Halimeda, some gastropods. SB 12 Off Fongafale Cream Very fine, white mud Too fine to tell with naked eye Very fine white sediment, mud and clay sized PII-S1-83
16 SLS 6 Fongafale (Vaiaku) Light pink to orange Medium to coarse sand Forams, coral fragments Medium to coarse sand, with reef pebbles, cobbles, rubble and boulders scattered around SLS 5 Fongafale Light orange Fine to medium sand Forams Sandy shore. Fine to medium sand grains. SB 1 Off Fongafale (Vaiaku) Pinkish/ brownish Medium to coarse Forams, seagrapes Grab sample at 6 meters, consisting of forams and seagrapes. SB 13 Off Fongafale Creamy Coarse Halimeda, Seagrapes, sponge, some forams Grab sample at 28 m. Pinkish sponge in the sediment SLS 18 Te Afualiku Orange, pink and white Medium to coarse Forams, coral fragments Medium to coarse with coral pebbles and rubble. SLS 19 Fualifeke Pinkish Medium to coarse Forams, coral rubble, shell fragments Medium to coarse sediments with pebbles scattered. Some green algae growing. SB 5 Off Fualifeke Cream Very Fine to coarse Fine sand with coarse Halimeda Grab sample at 41 m consisted of fine sand with Halimeda. PII-S1-84
17 SB 2 Off Fongafale (wharf area) Pale pink and cream Fine to coarse Fine sand with coarse Halimeda Grab sample at 36m. Fine sand with coarse Halimeda. Date: Monday 02/11/09 Collector: Ashishika, Salesh and Jens Collector s No. Causeway (C510) Location Time Latitude Longitude Color Size Components Description Off Causeway Pale pink and cream Fine to Medium Forams, coral fragments Grab sample at 10m. Fine to medium sand with Forams. Vaiaku (Wavehunter ) Off Vaiaku in 10m of water Pale pink and cream Fine to Medium Forams, coral fragments Grab sample at 10m. Fine to medium sand with Forams. Date: Thursday 05/11/09 Collector: Ashishika, Salesh Collector s No. SLS 4 Location Time Latitude Longitude Color Size Components Description North of Wharf area, Fongafale Light brown to yellow Fine to Coarse, pebbles strewn in area. Forams, coral fragments, pebbles, washed up Halimeda Fine to coarse sand with Forams. Boulders/cobbles at HWM PII-S1-85


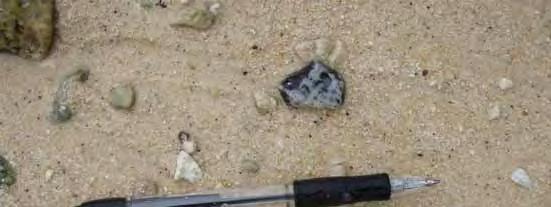
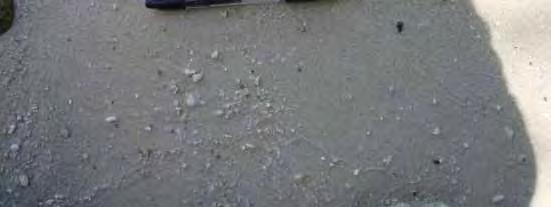
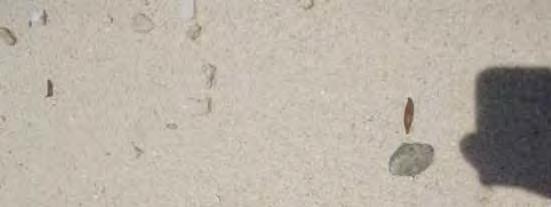
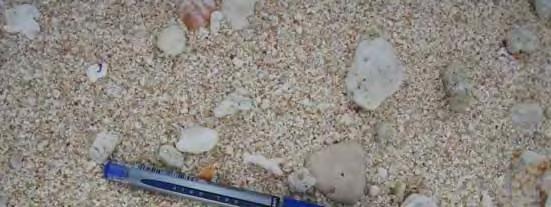
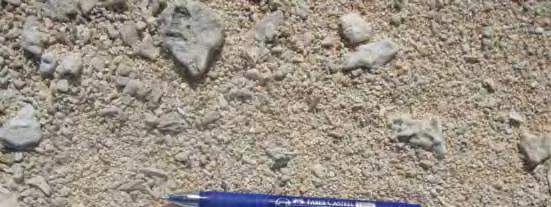
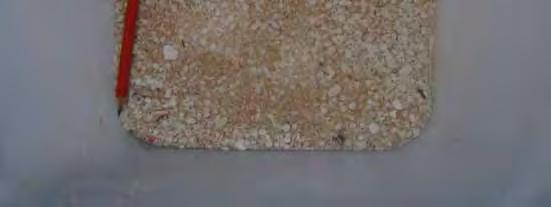
18 (2) Site Pictures Shoreline Samples SLS 1 SLS 2 PII-S1-86


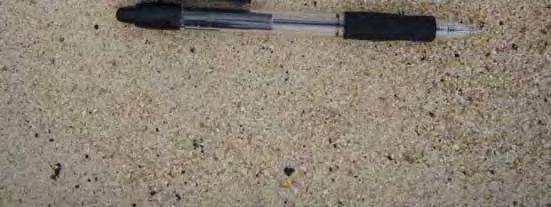
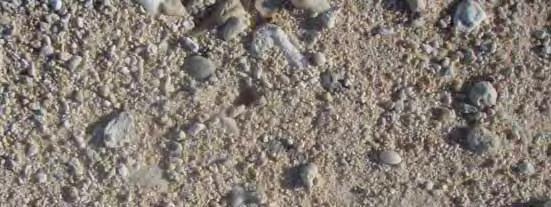
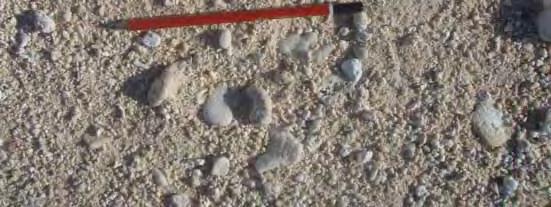
19 SLS 3 SLS 4 PII-S1-87


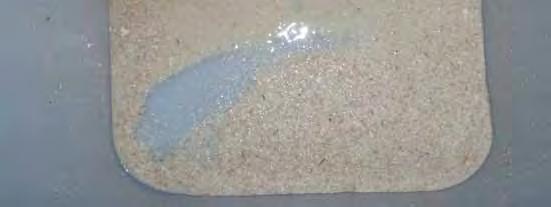
20 SLS 5 SLS 6 PII-S1-88


21 SLS 7 SLS 8 PII-S1-89


22 SLS 9 SLS 10 PII-S1-90


23 SLS 11 SLS 12 PII-S1-91


24 SLS 13 SLS 14 PII-S1-92


25 SLS 15 SLS 16 PII-S1-93


26 SLS 17 SLS 18 PII-S1-94


27 SLS 19 SLS 20 PII-S1-95


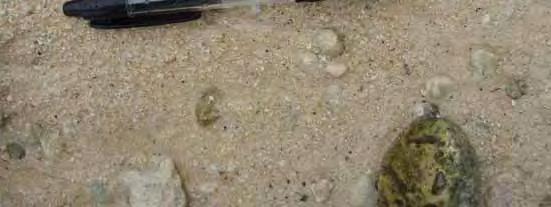
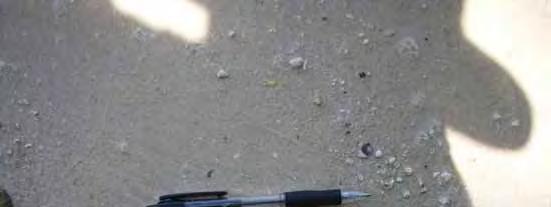
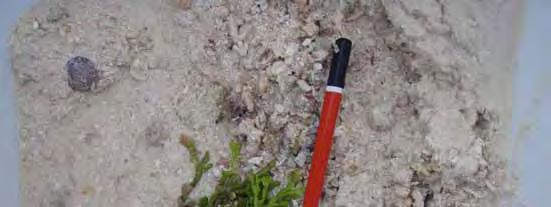
28 Sea Bottom Samples SB 1 SB 2 PII-S1-96


29 SB 3 SB 4 PII-S1-97


30 SB 6 SB 7 PII-S1-98

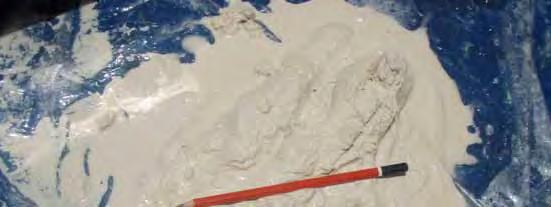
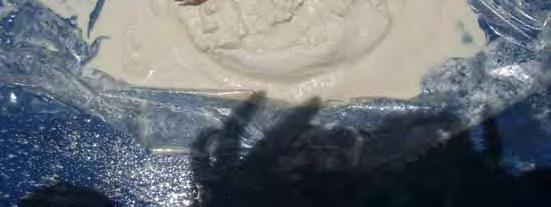
31 SB 8 SB 9 PII-S1-99


32 SB 10 SB 11 PII-S1-100


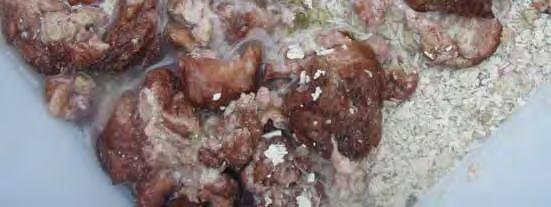
33 SB 12 SB 13 PII-S1-101

34 SB 14 SB 15 PII-S1-102
35 (3) Grain Size Analysis Table2.11 Sieve analysis of sediments Sample Description Sand Survey/Cruise TU 2009 Sample No: SLS 1 Amount in Grams Aperture Ph Value Weight Wt retained cum wt ret cum % indiv % pan Sample Description Sand Survey/Cruise TU 2009 Sample No: SLS 2 Amount in Grams Aperture Ph Value Weight Wt retained cum wt ret cum % indiv % pan PII-S1-103
36 Sample Description Sand Survey/Cruise TU 2009 Sample No: SLS 3 Amount in Grams Aperture Ph Value Weight Wt retained cum wt ret cum % indiv % pan Sample Description Sand Survey/Cruise TU 2009 Sample No: SLS 4 Amount in Grams Aperture Ph Value Weight Wt retained cum wt ret cum % indiv % pan Sample Description Sand Survey/Cruise TU 2009 PII-S1-104
37 Sample No: SLS 5 Amount in Grams Aperture Ph Value Weight Wt retained cum wt ret cum % indiv % pan Sample Description Sand Survey/Cruise TU 2009 Sample No: SLS 6 Amount in Grams Aperture Ph Value Weight Wt retained cum wt ret cum % indiv % pan Sample Description Sand Survey/Cruise Sand Test Date TU 2009 Sample No: SLS 7 Amount in Grams PII-S1-105
38 Aperture Ph Value Weight Wt retained cum wt ret cum % indiv % pan Sample Description Sand Survey/Cruise TU 2009 Sample No: SLS 8 Amount in Grams Aperture Ph Value Weight Wt retained cum wt ret cum % indiv % pan Sample Description Sand Survey/Cruise TU 2009 Sample No: SLS 9 Amount in Grams Aperture Ph Value Weight Wt retained cum wt ret cum % indiv % PII-S1-106
39 pan Sample Description Sand Survey/Cruise TU 2009 Sample No: SLS 10 Amount in Grams Aperture Ph Value Weight Wt retained cum wt ret cum % indiv % pan Sample Description Sand Survey/Cruise TU 2009 Sample No: SLS 11 Amount in Grams Aperture Ph Value Weight Wt retained cum wt ret cum % indiv % PII-S1-107
40 pan Sample Description Sand Survey/Cruise TU 2009 Sample No: SLS 12 Amount in Grams Aperture Ph Value Weight Wt retained cum wt ret cum % indiv % pan Sample Description Sand Survey/Cruise TU 2009 Sample No: SLS 13 Amount in Grams Aperture Ph Value Weight Wt retained cum wt ret cum % indiv % pan PII-S1-108
41 Sample Description Sand Survey/Cruise TU 2009 Sample No: SLS 14 Amount in Grams Aperture Ph Value Weight Wt retained cum wt ret cum % indiv % pan Sample Description Sand Survey/Cruise TU 2009 Sample No: SLS 15 Amount in Grams Aperture Ph Value Weight Wt retained cum wt ret cum % indiv % pan Sample Description Sand Survey/Cruise TU 2009 Sample No: SLS 16 Amount in Grams PII-S1-109
42 Aperture Ph Value Weight Wt retained cum wt ret cum % indiv % pan Sample Description Sand Survey/Cruise TU 2009 Sample No: SLS 17 Amount in Grams Aperture Ph Value Weight Wt retained cum wt ret cum % indiv % pan Sample Description Sand Survey/Cruise TU 2009 Sample No: SLS 18 Amount in Grams Aperture Ph Value Weight Wt retained cum wt ret cum % indiv % PII-S1-110
43 pan Sample Description Sand Survey/Cruise TU 2009 Sample No: SLS 19 Amount in Grams Aperture Ph Value Weight Wt retained cum wt ret cum % indiv % pan Sample Description Sand Survey/Cruise TU 2009 Sample No: SLS 20 Amount in Grams Aperture Ph Value Weight Wt retained cum wt ret cum % indiv % PII-S1-111
44 pan Sample Description Sand Survey/Cruise TU 2009 Sample No: SB 1 Amount in Grams Aperture Ph Value Weight Wt retained cum wt ret cum % indiv % pan Sample Description Sand Survey/Cruise TU 2009 Sample No: SB 2 Amount in Grams Aperture Ph Value Weight Wt retained cum wt ret cum % indiv % pan PII-S1-112
45 Sample Description Sand Survey/Cruise TU 2009 Sample No: SB 3 Amount in Grams Aperture Ph Value Weight Wt retained cum wt ret cum % indiv % pan Sample Description Sand Survey/Cruise TU 2009 Sample No: SB 4 Amount in Grams Aperture Ph Value Weight Wt retained cum wt ret cum % indiv % pan Sample Description Sand Survey/Cruise TU 2009 Sample No: SB 5 PII-S1-113
46 Amount in Grams Aperture Ph Value Weight Wt retained cum wt ret cum % indiv % pan Sample Description Sand Survey/Cruise TU 2009 Sample No: SB 6 Amount in Grams Aperture Ph Value Weight Wt retained cum wt ret cum % indiv % pan Sample Description Sand Survey/Cruise TU 2009 Sample No: SB 7 Amount in Grams Aperture Ph Value Weight Wt retained cum wt ret cum % indiv % PII-S1-114
47 pan Sample Description Sand Survey/Cruise TU 2009 Sample No: SB 8 Amount in Grams Aperture Ph Value Weight Wt retained cum wt ret cum % indiv % pan Survey/Cruise TU 2009 Sample No: SB 9 Amount in Grams Aperture Ph Value Weight Wt retained cum wt ret cum % indiv % PII-S1-115
48 pan Sample Description Sand Survey/Cruise TU 2009 Sample No: SB 10 Amount in Grams Aperture Ph Value Weight Wt retained cum wt ret cum % indiv % pan Sample Description Sand Survey/Cruise TU 2009 Sample No: SB 11 Amount in Grams Aperture Ph Value Weight Wt retained cum wt ret cum % indiv % pan PII-S1-116
49 Sample Description Sand Survey/Cruise TU 2009 Sample No: SB 12 Amount in Grams Aperture Ph Value Weight Wt retained cum wt ret cum % indiv % pan Survey/Cruise TU 2009 Sample No: SB 13 Amount in Grams Aperture Ph Value Weight Wt retained cum wt ret cum % indiv % pan Sample Description Sand Survey/Cruise TU 2009 Sample No: SB 14 Amount in Grams PII-S1-117
50 Aperture Ph Value Weight Wt retained cum wt ret cum % indiv % pan Sample Description Sand Survey/Cruise TU 2009 Sample No: SB 15 Amount in Grams Aperture Ph Value Weight Wt retained cum wt ret cum % indiv % pan (4) Sand Composition Ratio Analysis Data Table2.12 Sea Bottom sediments- sand composition ratio Coral Fragments Foraminifera Shell fragments Halimeda SB % 42.5 % 13 % 0 % SB 2 2 % 4.5 % 2.5 % 91 % SB 3 2 % 10.5 % 5.5 % 82 % SB % 31.5 % 18.5 % 7.5 % PII-S1-118
51 SB 5 1 % 15 % 5.5 % 78.5 % SB 6 33 % 43 % 24 % 0 % SB 7 40 % 41 % 19 % 0 % SB 8 38 % 48 % 13.5 % 0.5 % SB 9 0 % 22 % 10.5 % 67.5 % SB % 6 % 6 % 84.5 % SB 11 0 % 4.5 % 7 % 89.5 % SB % 34 % 31 % 0 % SB 13 0 % 41 % 7.5 % 51.5 % SB % 26.5 % 7 % 64 % SB % 12 % 8 % 80 % Table2.13 Shore Line sediments- sand composition ratio Coral fragments Foraminifera Shell fragments SLS 1 33 % 54 % 13 % SLS % 49 % 12.5 % SLS % 42.5 % 23 % SLS 4 49 % 28 % 23 % SLS % 44.5 % 10 % SLS % 38.5 % 12 % SLS 7 54 % 30 % 16 % SLS % 40 % 16.5 % SLS 9 56 % 18.5 % 25.5 % SLS % 45 % 18.5 % SLS % 43 % 36.5 % SLS % 40 % 17.5 % SLS % 67.5 % 4 % SLS % 35.5 % 10 % SLS % 13.5 % 13.5 % SLS % 59 % 10 % SLS % 74 % 4 % SLS % 25.5 % 8.5 % SLS % 67 % 6 % SLS % 56 % 9 % References: Anderson, J.R. (2010) Sand Sieve Analysis, Laboratory 6, Georgia Perimeter College, GA Sharma, A. (unpublished) A study of the benthic foraminifera of Laucala Bay, with special focus on Marginopora vertebralis. Msc Thesis. PII-S1-119
52 2.6 Water Quality Survey Methodology Water quality sampling was carried out at 3 points on the oceanic side, 10 points in the lagoon, 3 points of groundwater and at 2 points on the ponds, a total of 18 points altogether. The sampling was carried out at low tide and sampling positions were measured using a simple handheld Garmin GPS. At each site location, the water depth was measured using a lead line and mid-water depth was determined. A Van Dorn water sampler was used to collect water samples at middle water depth into 2 x 1-liter bottles which had been pre-washed with 10% HCL for 24 hours and rinsed with de-ionised water. For each location, at the same water depth, Water temperature, Salinity, Turbidity, and Chlorophyll A were measured with a portable water quality meter. A Hydrolab was also deployed at the same water depth at each of the locations to measure Temperature, PH, ORP, Specific Conductivity, Resistivity, Salinity, Total dissolved solids, Depth, Turbidity, LDO, BP and Chlorophyll. The samples were stored in an ice-box and frozen upon reaching land and presented for analysis. The samples were analysed for: COD, T-N, NO 3 -N, NO 2 -N, NH 4 -N, T-P, PO 4 -P, SS and Salinity. A further 4 litres of samples were collected at each location and filtered for suspended sediments and chlorophyll analysis. The filter papers had been dried and pre-weighed before use. The filter papers for chlorophyll analysis were placed in glass vials containing acetone. The filter papers were treated for cool and dark storage, and provided for analysis. Table 2.14 Water quality samples locations and times. Sample No. Longitude Latitude Date Time PW 1 S E /01/ PW 2 S E /01/ OW 1 S E /01/ OW 2 S E /01/ OW 3 S E /01/ LW 1 S E /01/ LW 2 S E /01/ LW 3 S E /01/ LW 4 S E /01/ PII-S1-120

53 LW 5 S E /01/ LW 6 S E /01/ LW 7 S E /01/ LW 8 S E /01/ LW 9 S E /01/ LW 10 S E /01/ GW 1 S E /01/ GW 2 S E /01/ GW 3 S E /01/ Figure 2.25 Pond water sample locations PII-S1-121

54 Figure 2.26 Ground water sample locations PII-S1-122

55 Figure 2.27 Lagoon water sample locations PII-S1-123

56 Figure 2.28 Ocean water sample locations PII-S1-124


57 Figure 2.29 Hand-held GPS used for sample site locations. Figure 2.30 Groundwater sampling in Funafuti. PII-S1-125


58 Figure 2.31 Hydrolab survey data download. PII-S1-126


59 Figure 2.32 Water sample filtration procedure. PII-S1-127
60 2.6.2 RESULTS (1) Hydrolab results Location Date Time Temp Temp Temp ph ORP SpCond SpCond Sal TDS No. MM/DD/YYYY HH:MM:SS C F K Units mv ms/cm µs/cm ppt g/l PW1 1/6/ :59: * 47 * * * 30.1 * PW2 1/6/ :09: * 51.4 * * * 32.9 * OW1 1/7/2010 9:08: * 53.2 * * * 34.1 * OW2 1/7/2010 9:30: * 53.2 * * 35.2 * 34.1 * OW3 1/7/2010 9:58: * 53.2 * * 35.2 * 34.1 * LW1 1/10/2010 7:39: * 53.2 * * * 34.1 * LW2 1/7/ :38: * 53.3 * * * 34.1 * LW3 1/7/ :25: * 53.2 * * * 34 * LW4 1/7/ :08: * 53.2 * * * 34 * LW5 1/7/ :50: * 53.2 * * * 34.1 * LW6 1/8/ :02: * 53.2 * * * 34 * LW7 1/8/ :37: * 53.1 * * * 34 * LW8 1/10/2010 8:40: * 53.2 * * * 34 * LW9 1/10/2010 8:18: * 53.2 * * * 34.1 * LW10 1/10/2010 8:03: * 53.3 * * * 34.1 * GW3 1/9/ :39: * 10.1 * * 5.7 * 6.4 * GW2 1/9/ :53: * 9.6 * 9580 * 5.41 * 6.1 * GW1 1/10/ :08: * 32.8 * * * 21 * PII-S1-128
61 Location Dep100 Dep100 Dep100 DepthX DepthY TurbSC TurbSC LDO% LDO BP No. meters feet psia volts mvolts Volts NTU Sat mg/l mmhg PW PW OW OW OW LW LW LW LW LW LW LW LW LW LW GW GW GW PII-S1-129
62 (2) Turbidity Meter and Salinity Meter Results Sample Water Depth Sampling Depth Salinity S/m Temperature ( C) Turbidity Color PW m PW m 0.5 m OW 1 5 m 2.5 m OW 2 15 m 7.5 m OW 3 12 m 6 m LW 1 3 m 1.5 m LW 2 7 m 3.5 m LW 3 18 m 9 m LW 4 7 m 3.5 m LW 5 13 m 6.5 m LW 6 15 m 7.5 m LW 7 2 m 1 m LW 8 29 m 14.5 m LW 9 2 m 1 m LW 10 1 m 0.5 m GW m GW m GW 3 1 m 0.5 m PII-S1-130

63 (3) Analytical Results PII-S1-131
64 PII-S1-132
65 PII-S1-133
66 (4) Analytical Results- Cholorophyll-a Sample Longitude Latitude Chlorophyll-a (µg/l) PW 1 S E PW 2 S E OW 1 S E ND (<0.05) OW 2 S E OW 3 S E LW 1 S E LW 2 S E ND (<0.05) LW 3 S E ND (<0.05) LW 4 S E ND (<0.05) LW 5 S E ND (<0.05) LW 6 S E LW 7 S E ND (<0.05) LW 8 S E LW 9 S E LW 10 S E GW 1 S E GW 2 S E GW 3 S E PII-S1-134
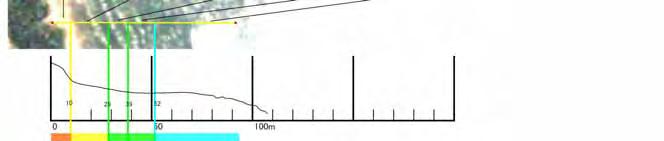
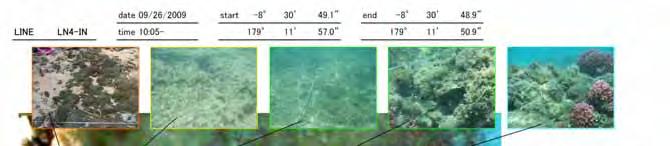
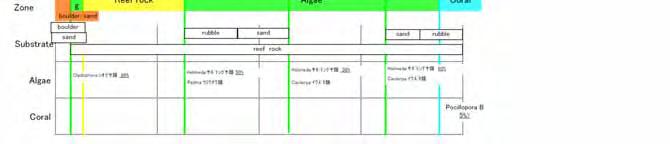
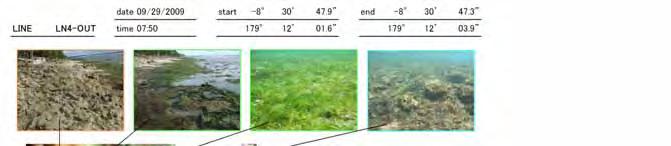
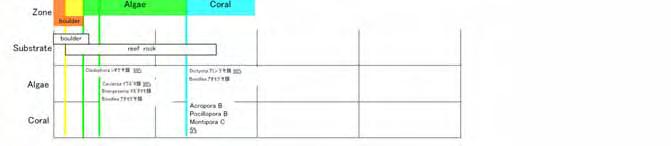
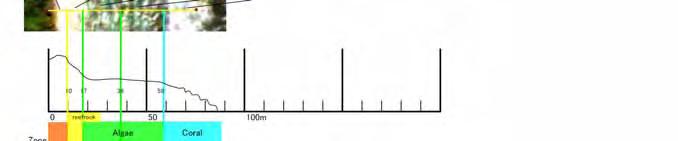
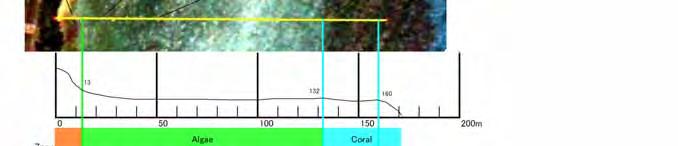
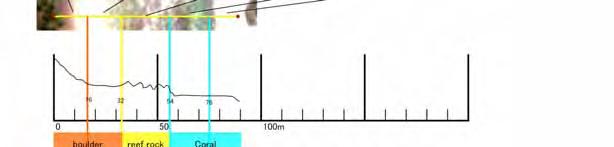
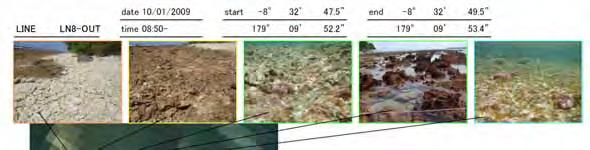
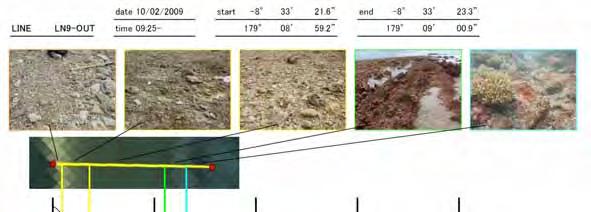
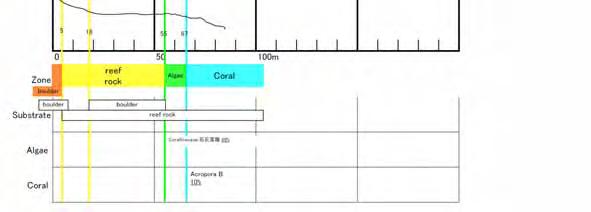
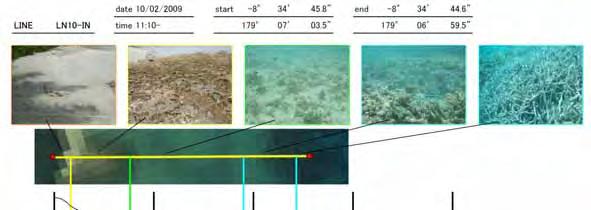
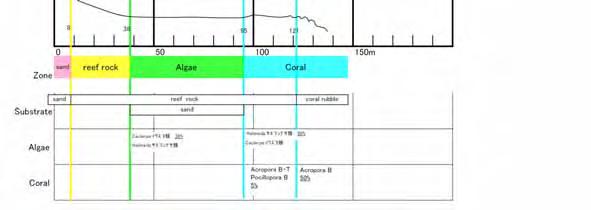
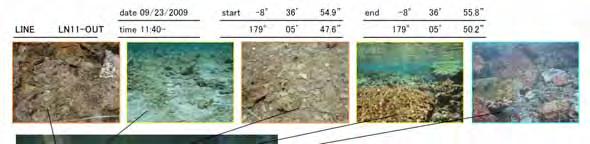
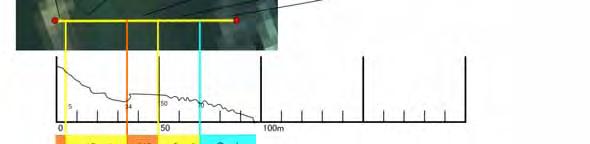
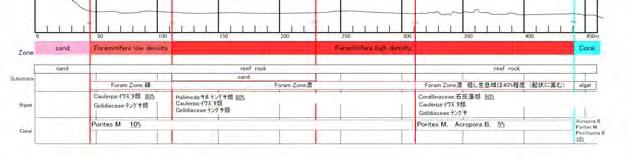
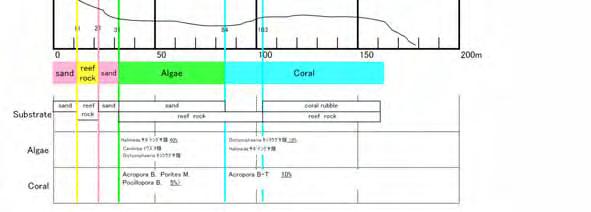
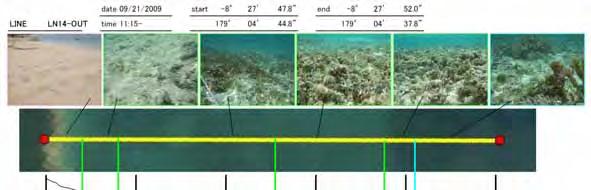
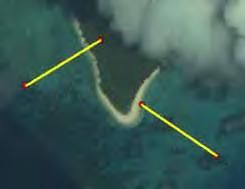
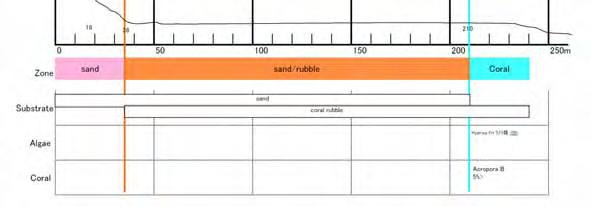
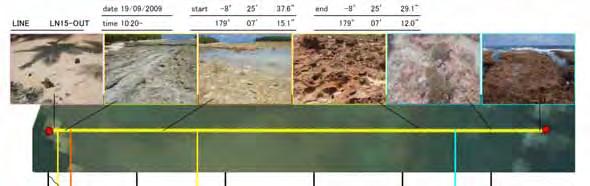
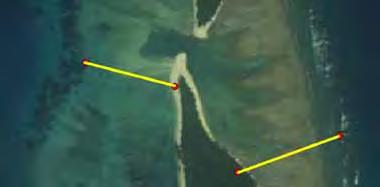
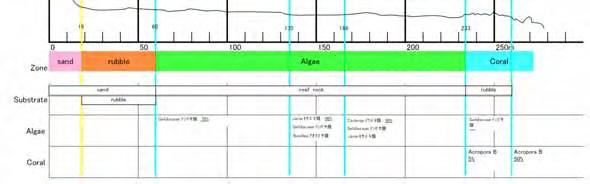
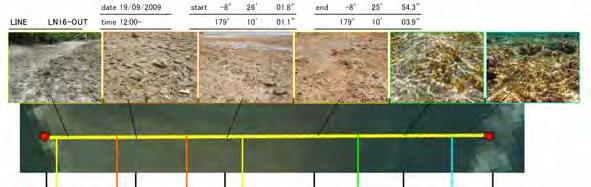
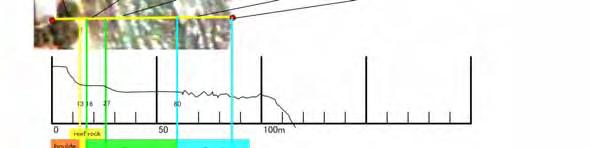
67 2.7 Coastal Ecology Survey Methodology (1) Description of Survey A line survey was conducted to identify the overview of the coastal ecosystem of Funafuti Atoll, the life and bottom sediment distribution information required to create a habitat map, and the population density information required to estimate the biomass of foraminifera. Table 2.15 Survey Item and Description Item Quantity Remarks [Line survey] Survey line A set of 31 lines 16 lines on the ocean side and 15 lines on the lagoon side Life form and bottom sediment distribution (Cross-section: Coverage distribution of foraminifera, coral, and marine algae and the distribution of species) Quadrat survey results (Identification and counting results) Table 2.16 shows the line survey duration. Table 2.16 Survey item Line Survey Duration Observation duration Line survey to The ecological survey was carried out using the line census method on 16 traverse lines on the oceanic side and 15 traverse lines in the lagoon (at a water depth of 5m or less). Before the survey, collection of existing information and interpretation of satellite image were made to determine the traverse lines. The positions of laying the survey lines were measured using a simple GPS (geographical coordinate system: WGS84). In the ecological survey, visual observation by divers (ecological research staff) was carried out as Figure 2.33 below indicates in order to record the distribution (sectional distribution) of corals, algae, bottom materials (rocks, coral pieces, foraminifers and shell pieces). At the same time, the zonal distribution structures on each traverse line were taken down according to the distance from the strand line with coverage of the key species. We set the starting point of traverse line at the place where terrestrial plant is growing above the shore line. We determined the end point of the line at the place where coral zone is verified or water depth become deep rapidly. On each traverse line, we established 2 ~ 8 crop-cutting experiment PII-S1-135
 on the")
, the distribution")
. Explanatory note for profiles of the ecological survey on each traverse line are shown in Figure 2.34.")
68 point. We obtained a total of 90 specimens to grasp the growing condition of foraminifera and sea grass quantitatively (standing crop, identification and number count) on the points. We immobilized the samples and take to our laboratory. We identified species of the samples and counted number. We organized the current survey results, the existing document (the survey result by JST, the satellite images by IKONOS and the aerial photographs), the distribution density (coverage) of coral, foraminifera and seaweed bed, bathymetry and distribution of sediments to make the habitat map (such as marine environment information base chart). Explanatory note for profiles of the ecological survey on each traverse line are shown in Figure Geomorphic unit Reef edge Reef crest Reef pavement Reef moat Survey line Survey line (ocean side) m 0-3 Reef crest Reef pavement (lagoon side) Reef moat Reef edge Reef flat Facies Marker div crop-cutting Traverse Figure 2.33 Conceptual Diagram of the Ecological Survey (Line Survey) PII-S1-136
69 Date, Start and End point Appearance (WGS84) date 09/25/2009 start end LINE LN2-IN time 09: Satellite image Cross-section of geography Zonal classification for habitat map Zonal classification about sediment Distribution of vegetation Distribution of coral 3m m reef Zone rock Algae Coral boulder/sand reef rock coral rubble Substrate reef rock Gelidiaceae: テンク サ類 80% Halimeda: サホ テンク サ類 60% Algae Cladophora: シオク サ類 Caulerpa: イワス タ類 Dictyosphaeria: キッコウク サ類 Gelidiaceae: テンク サ類 Coral Acropora B, Porites M Pocillopora B, 5% This figure shows the position Place where photograph was taken. Yellow line and red dots are traverse line and start/end point, respectively The numbers in graph represent distance from start point Number with under line shows cover degree of vegetation and coral. Principal species were shown in order of increasing dominancy. Figure 2.34 Explanatory notes for profiles of the ecological survey (Line survey)) PII-S1-137


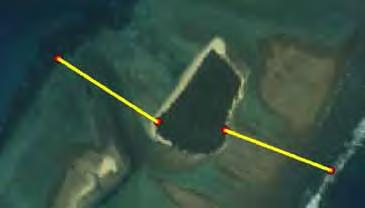
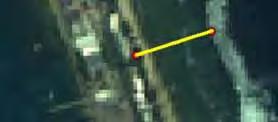
70 2.7.2 Results Traverse line survey location map PII-S1-138
71 Traverse line survey position (coordinates) Stn. Latitude Longitude length direction (S -> E) Place (Island) Stn. Latitude Longitude length direction (S -> E) Place (Island) L02IN-S m Fongafale L09OUT-S m Funangongo L02IN-E Fongafale L09OUT-E Funagongo L02OUT-S m Fongafale L10IN-S m Falefatu L02OUT-E Fongafale L10IN-E Falefatu L03IN-S m Fongafale L10OUT-S m Falefatu L03IN-E Fongafale L10OUT-E Falefatu L03OUT-S m Fongafale L11IN-S m '15.84" Funafala L03OUT-E Fongafale L11IN-E Funafala L04IN-S m Fongafale L11OUT-S m '33.89" Funafala L04IN-E Fongafale L11OUT-E Funafala L04OUT-S m Fongafale L12IN-S m Fuagea L04OUT-E Fongafale L12IN-E Fuagea L05IN-S m Fongafale L12OUT-S m Fuagea L05IN-E Fongafale L12OUT-E Fuagea L05OUT-S m Fongafale L13IN-S m '21.44" Fualopa L05OUT-E Fongafale L13IN-E Fualopa L06IN-S m '1.22" Fongafale L13OUT-S m '20.79" Fualopa L06IN-E Fongafale L13OUT-E Fualopa L06OUT-S m '20.73" Fongafale L14IN-S m '51.92" Tepuka L06OUT-E Fongafale L14IN-E Tepuka L07IN-S m '8.16" Fongafale L14OUT-S m '51.05" Tepuka L07IN-E Fongafale L14OUT-E Tepuka L07OUT-S m '8.9" Fongafale L15IN-S m '25.77'' Fualifeke L07OUT-E Fongafale L15IN-E Fualifeke L08IN-S m Fatao L15OUT-S m '43.72" Fualifeke L08IN-E Fatao L15OUT-E Fualifeke L08OUT-S m Fatao L16IN-S m Amatuku L08OUT-E Fatao L16IN-E Amatuku L09IN-S m Funangongo L16OUT-S m 20 16'23.25" Amatuku L09IN-E Funangongo L16OUT-E Amatuku L17OUT-S m 73.5 Fongafale L17OUT-E Fongafale PII-S1-139


72 Traverse line survey result(traverse line cross section) PII-S1-140


73 PII-S1-141


74 PII-S1-142


75 PII-S1-143


76 PII-S1-144


77 PII-S1-145


78 PII-S1-146


79 PII-S1-147

80 PII-S1-148


81 PII-S1-149


82 PII-S1-150


83 PII-S1-151


84 PII-S1-152


85 PII-S1-153


86 PII-S1-154

87 PII-S1-155
88 Organism Identification Results by Crop-Cutting Experiment Line 2in 2in 2out 2out 2out 2out 3in 3in 3out 3out 3out 3out 4in 4in 4out 4out 4out 4out 5in 5in 5out 5out 5out Sample No Class Order Family distance from shoreline(m) Rhizoodia Foraminiferida Calcarinidae Baculogypsina Calcarina Amphisteginidae Amphistegina lobifera Amphistegina lessonii Soritidae Soritinae Marginopora total(numbers) CyanophOscillatorial PhormidiaceaePhormidiaceae sp OscillatoriaceaLyngbya sp ChlorophCladophoral Anadyomenac Microdictyon okamurae 4 CladophoraceaCladophora sp Rhizoclonium sp Siphonoclad Boodleaceae Boodlea coacta SiphonocladacBoergesenia forbesii Cladophoropsis sp. + 9 Valoniaceae Dictyosphaeria cavernosa Valonia aegagropila Valonia sp. 12 Caulerpales Caulerpaceae Caulerpa cupressoides var.lycopodium f.amicorum 13 Caulerpa nummularia 14 Caulerpa racemosa var.clavifera f.macrophysa Caulerpa serrulata var.serrulata f.lata 16 Caulerpa faxifolia Caulerpa urvilleana 18 Caulerpa sp Caulerpella ambigua Udoteceae Avrainvillea amadelpha 21 Halimeda discoidea 22 Halimeda incrassata 23 Halimeda micronesica Halimeda opuntia Halimeda simulans 26 Halimeda sp. 27 BryopsidalesBryopsidaceaeBryopsis sp. 28 DasycladalesPolyphysaceaeAcetabularia parvula 29 PhaeophEctocarpalesEctocarpaceaeEctocarpus sp. 30 Sphacelarial SphacelariaceaSphacelaria sp Dictyotales Dictyotaceae Dictyota friabilis Dictyota sp Lobophora variegata Lobophora sp. 35 Padina australis Padina sp Fucales Sargassaceae Sargassum sp Turbinaria conoides 39 RhodophCorallinales Corallinaceae Jania capillacea Corallinaceae sp. 41 Gelidiales Gelidiaceae Gelidiaceae sp Wurdemannia Wurdemannia sp BonnemaisonBonnemaisoni Asparagopsis taxiformis 44 Gigartinales Hypneaceae Hypnea pannosa Hypnea sp. 46 Rhodymenia Champiaceae Champia parvula 47 Lomentaria sp Lomentaria sp. 49 RhodymeniaceGelidiopsis intricata Gelidiopsis sp. 51 Ceramiales Ceramiaceae Anotrichium tenue 52 Centroceras clavulatum 53 Ceramium sp Spyridia filamentosa 55 Ceramiaceae sp RhodomelaceaChondria sp Herposiphonia parca Herposiphonia sp Laurencia sp Polysiphonia sp Tolypiocladia glomerulata species total(g) Attention 1)The foraminifera is a number of individuals. The plant shows the wet weight. Attention 2) + of the plant shows less than 0.001g. PII-S1-156
Current and future climate of Tuvalu
 Nanumea Fualefeke Amatuku Nanumaga Niutao Tepuka Tepuka Savilivili Fualopa Fuafatu Funafuti Fogafale VAIAKU Fuakea Tefala Vasafua Falaigo Teafuafou Fatato Papa Elise Funamanu Falefatu Mateika Funafala
TUVALU TECHNICAL REPORT COASTAL CHANGE ANALYSIS USING MULTI-TEMPORAL IMAGE COMPARISONS FUNAFUTI ATOLL April 2006
 EU EDF 8/9 SOPAC Project Report 54 Reducing Vulnerability of Pacific ACP States TUVALU TECHNICAL REPORT COASTAL CHANGE ANALYSIS USING MULTI-TEMPORAL IMAGE COMPARISONS FUNAFUTI ATOLL April 2006 EU EDF-SOPAC
RECENT SEDIMENTS OF CALIFORNIA PART A. INTRODUCTION AND GRAIN SIZE ANALYSIS HYDRAULIC ENGINEERING LABORATORY COLLEGE OF ENGINEERING C.
 HEL-2-19! 9* I 1 f RECENT SEDIMENTS OF BOLINAS BAY CALIFORNIA PART A. INTRODUCTION AND GRAIN SIZE ANALYSIS by C. ISSELHARDT L. OSUCH RWILDE. HYDRAULIC ENGINEERING LABORATORY COLLEGE OF ENGINEERING UNIVERSITY
GLG Chapter 7 Sedimentary Environments & Rocks
 GLG 101 - Chapter 7 Sedimentary Environments & Rocks Name Note, Oct 11: I ll be writing this study sheet over the next few days. Each day I will add questions until the entire chapter is done, hopefully
ARE YOU READY TO THINK? Look at the first slide THINK PAIR SHARE!
 ARE YOU READY TO THINK? Look at the first slide THINK PAIR SHARE! WHAT PROMINENT FEATURE CAN YOU IDENTIFY IN THIS PICTURE? What do you think the different colors represent? Who might find such a picture
Marine Sediments. Introductory Oceanography. Ray Rector: Instructor
 Marine Sediments Introductory Oceanography Ray Rector: Instructor Ocean Basins are Vast Sinks for Huge Amounts of Sediment from Numerous Different Sources Four Major Types of Seafloor Sediments 1. Lithogenous
The Ocean Floor Chapter 14. Essentials of Geology, 8e. Stan Hatfield and Ken Pinzke Southwestern Illinois College
 The Ocean Floor Chapter 14 Essentials of Geology, 8e Stan Hatfield and Ken Pinzke Southwestern Illinois College The vast world ocean Earth is often referred to as the water planet 71% of Earth s surface
Oceanography is the scientific study of oceans Oceans make up over 70% of the Earth s surface
 Oceanography Oceanography is the scientific study of oceans Oceans make up over 70% of the Earth s surface An ocean must be large and have features which set it apart from other oceans (currents, water
MAINTENANCE DREDGE BENTHIC ASSESSMENT SUNSET POINT FARM LLC LONG POINT KEY MONROE COUNTY, FLORIDA. Prepared by:
 MAINTENANCE DREDGE BENTHIC ASSESSMENT SUNSET POINT FARM LLC LONG POINT KEY MONROE COUNTY, FLORIDA Prepared by: December 11, 2016 INTRODUCTION The owners of the Sunset Point Farms LLC, located on the northern
 Photo 1 - Southerly view across 2700 parking lot toward existing building. Multi-residential building borders western side of property in upper right of view. Photo 2 - Southerly view across 2750 parking
Oceanography. Oceanography is the study of the deep sea and shallow coastal oceans.
 Oceanography Oceanography is the study of the deep sea and shallow coastal oceans. Studying the Ocean Floor To determine the shape and composition of the ocean floor, scientists use techniques such as
Sediment and Sedimentary rock
 Sediment and Sedimentary rock Sediment: An accumulation of loose mineral grains, such as boulders, pebbles, sand, silt or mud, which are not cemented together. Mechanical and chemical weathering produces
Your teacher will show you a sample or diagram of each, and show you a settling column. Draw these, and label your diagrams (8 pts) Ungraded:
 Ungraded:") From Sand to Stone: How do we recognize and interpret sedimentary rocks in the rock record? (Based closely on the University of Washington ESS 101 Lab 5: Sedimentary Rocks) Introduction: This lab consists
From Sand to Stone: How do we recognize and interpret sedimentary rocks in the rock record? (Based closely on the University of Washington ESS 101 Lab 5: Sedimentary Rocks) Introduction: This lab consists
Holocene evolution of Dahab coastline Gulf of Aqaba, Sinai Peninsula, Egypt 1
 Holocene evolution of Dahab coastline Gulf of Aqaba, Sinai Peninsula, Egypt 1 Magdy Torab* 2 * Prof. of Geomorphology, Department of Geography, Damanhour University, Egypt 3 E-mail: magdytorab@hotmail.com.
Joint Federal Agency Submerged Aquatic Vegetation Survey Guidance for the New England Region Updated August 11, 2016
 Joint Federal Agency Submerged Aquatic Vegetation Survey Guidance for the New England Region Updated August 11, 2016 FOREWORD This guidance is the result of on-going interagency collaboration between the
The Marine Environment
 The Marine Environment SECTION 16.1 Shoreline Features In your textbook, read about erosional landforms, beaches, estuaries, longshore currents, and rip currents. For each statement below, write true or
The Marine Environment
 The Marine Environment SECTION 16.1 Shoreline Features In your textbook, read about erosional landforms, beaches, estuaries, longshore currents, and rip currents. For each statement below, write or. 1.
Although not essential, a good quality hand lens is a valuable addition to your field kit.
 Field Sediment Card Sediment characteristics are an important element in understanding marine and estuarine environments.there are thus a wide range of people (perhaps you!) who regularly use measurements
Weekly summary of Tropic101x as posted by student Lucia_Agudelo
 Weekly summary of Tropic101x as posted by student Lucia_Agudelo With minor grammatical and content edits by Tropic101x team Summary of Week 6 FIELD METHODS LECTURE 6.1.1 Being able to measure the distribution,
Foundations of Earth Science, 6e Lutgens, Tarbuck, & Tasa
 Foundations of Earth Science, 6e Lutgens, Tarbuck, & Tasa Oceans: The Last Frontier Foundations, 6e - Chapter 9 Stan Hatfield Southwestern Illinois College The vast world ocean Earth is often referred
Seagrass Percentage Cover
 Seagrass Percentage Cover 5 25 30 40 55 65 80 95 80% SEAGRASS SPECIES CODES Cs Cymodocea serrulata Serrated leaf tip Wide leaf blade (5-9mm wide) Leaves 6-15cm long 13-17 longitudinal veins Cr Cymodocea
Paleo Lab #4 - Sedimentary Environments
 Paleo Lab #4 - Sedimentary Environments page - 1. CHARACTERISTICS OF SEDIMENT Grain size and grain shape: The sizes and shapes of sedimentary particles (grains) are modified considerably during their transportation
Science 8 - Water Systems Test - Chapters 1-2
 Science 8 - Water Systems Test - Chapters 1-2 Multiple Choice (30 marks) Identify the choice that best completes the statement or answers the question. 1. What percentage represents the amount of fresh
LAB - Rock Classification
 NAME: LAB - Rock Classification Date: Introduction: A rock is any naturally occurring aggregate of minerals, mineral-like solids, glass, or organic particles. The properties that can be observed in a rock
6th Grade Science Sample Assessment Items S6E3c.
 Composition 6th Grade Science Sample Assessment Items Ocean water differs from freshwater in that it has. A. a lower temperature B. a higher temperature C. a higher concentration of silicon dioxide D.
Percent cover standards
 Percent cover standards 2% 12% 20% 30% 35% 55% 75% 90% SEAGRASS SPECIES CODES ZC Zostera capricorni Hu Halodule uninervis 5 longitudinal veins Cross veins Leaf grows straight from rhizome ie no shoot trident
CHAPTER 6 & 7 VOCABULARY
 CHAPTER 6 & 7 VOCABULARY 1. Biome 2. Climate 3. Latitude 4. Altitude 5. Emergent layer 6. Epiphyte 7. Understory 8. Permafrost 9. Wetland 10.Plankton 11.Nekton 12.Benthos 13.Littoral zone 14.Benthic zone
UNIT 5: ECOLOGY Chapter 15: The Biosphere
 CORNELL NOTES Directions: You must create a minimum of 5 questions in this column per page (average). Use these to study your notes and prepare for tests and quizzes. Notes will be stamped after each assigned
Sand Grain Size Analysis
 Materials Needed Equipment: (per table) Sand Grain Size Analysis 1. 6 sets of sieves = 10, 18, 35, 60, 120, 230, pan (6 sieves and the pan) 2. Electronic Balances to measure mass of samples 3. Handlenses
Laboratory#6 Sediment Particle Size Distribution and Turbidity Flows
 Laboratory#6 Sediment Particle Size Distribution and Turbidity Flows Although this laboratory will pertain to oceanic sediments similar processes can also be observed on land and other aquatic systems
Weathering of Rocks. Weathering - Breakdown of rocks into pieces (sediment) 2 main types of weathering to rocks
 2 main types of weathering to rocks") Weathering of Rocks Weathering - Breakdown of rocks into pieces (sediment) 2 main types of weathering to rocks Mechanical weathering requires physical forces to break rocks into smaller pieces. Chemical
Weathering of Rocks Weathering - Breakdown of rocks into pieces (sediment) 2 main types of weathering to rocks Mechanical weathering requires physical forces to break rocks into smaller pieces. Chemical
MARINE GEOLOGY & GEOGRAPHY
 MARINE GEOLOGY & GEOGRAPHY Bathymetry BATHYMETRY BATHYMETRY THE UNDERWATER EQUIVALENT TO TOPOGRAPHY THE STUDY OF WATER DEPTH A BATHYMETRIC MAP SHOWS FLOOR RELIEF OR TERRAIN AS CONTOUR LINES Bathymetry
Earth Science Lesson Plan Quarter 2, Week 10, Day 1
 Earth Science Lesson Plan Quarter 2, Week 10, Day 1 Outcomes for Today Standard Focus: PREPARE 1. Background knowledge necessary for today s reading. Beaches are created by the actions of waves, tides,
Sediment and sedimentary rocks Sediment
 Sediment and sedimentary rocks Sediment From sediments to sedimentary rocks (transportation, deposition, preservation and lithification) Types of sedimentary rocks (clastic, chemical and organic) Sedimentary
Final Survey/Data Report
 US ARMY CORPS OF ENGINEERS New England District Contract No. DACW33-03-D-004 Delivery Order No. 05 November 2004 Final Survey/Data Report Boston Harbor Deep Draft Navigation Improvement Project Biological
Lecture Outline Wednesday - Friday February 14-16, 2018
 Lecture Outline Wednesday - Friday February 14-16, 2018 Quiz 2 scheduled for Friday Feb 23 (Interlude B, Chapters 6,7) Questions? Chapter 6 Pages of the Past: Sedimentary Rocks Key Points for today Be
Kamburu Faru Boatu Urunu Faru Velaa Faru Dhakandhoo Mendhoo Funadhoo
 IG Working Group REEForm Reef and reef landform responses to environmental and climatic change Report from Research Expedition, Maldives, 29 th June to 13 th July 2011 Participants: hris Perry (Manchester
Environmental Science
 Environmental Science A Study of Interrelationships Cui Jiansheng Hebei University of Science and Technology CH06 Kinds of Ecosystems and Communities Chapter Objectives After reading this chapter, you
FINMARINET: Inventories and Planning for the Marine Natura 2000 Network in Finland. A.2 Geological inventories of the seafloor Final Report
 LIFE07 NAT/FIN/000151 FINMARINET: Inventories and Planning for the Marine Natura 2000 Network in Finland A.2 Geological inventories of the seafloor Final Report Geological Survey of Finland, GTK 1. Introduction
Biosphere. All living things, plants, animals, (even you!) are part of the zone of the earth called the biosphere.
 are part of the zone of the earth called the biosphere.") Unit 1 Study Guide Earth s Spheres Biosphere All living things, plants, animals, (even you!) are part of the zone of the earth called the biosphere. Hydrosphere Water covers ¾ of the earth, made up mostly
Unit 1 Study Guide Earth s Spheres Biosphere All living things, plants, animals, (even you!) are part of the zone of the earth called the biosphere. Hydrosphere Water covers ¾ of the earth, made up mostly
Lab 7: Sedimentary Structures
 Name: Lab 7: Sedimentary Structures Sedimentary rocks account for a negligibly small fraction of Earth s mass, yet they are commonly encountered because the processes that form them are ubiquitous in the
Documenting Plants & Animals in Each Habitat
 Documenting Plants & Animals in Each Habitat STEP 25: UNDERSTAND THE QUADRAT SURVEY METHOD It is not possible to count all the plants and animals in a habitat unit, since the habitat unit could be quite
Marine Ecology Pacing Guide
 Marine Ecology Pacing Guide Course Description: The focus of the course is the interrelationships among marine organisms and the physical, chemical, geological and biological factors. North Carolina coastal
DIVERSITY ASSESSMENT ON MALAYSIAN BENTHIC MACROALGAE IN TIOMAN ISLAND AND TULAI CANDANG ISLAND, PAHANG
 DIVERSITY ASSESSMENT ON MALAYSIAN BENTHIC MACROALGAE IN TIOMAN ISLAND AND TULAI CANDANG ISLAND, PAHANG 1 NUR FARAH AIN ZAINEE, 2 MOHAMED EFFENDI TAIP School of Environmental and Natural Resource Sciences,
Depositional Environment
 Depositional Environment Sedimentary depositional environment describes the combination of physical, chemical and biological processes associated with the deposition of a particular type of sediment. Types
How does erosion happen?
 How does erosion happen? By National Geographic, adapted by Newsela staff on 10.03.17 Word Count 682 Level 830L These rock formations, in Bryce Canyon National Park, Utah, are called hoodoos. Although
EROSIONAL RATES IN THE POINT AUX CHENES BAY AREA, MISSISSIPPI: Kathleen P. Wacker G. Alan Criss INTRODUCTION
 Summary of a Paper Presented at the: Sixtieth Annual Meeting of the Mississippi Academy of Sciences in Jackson, Mississippi February 22, 1996 ===============================================================
1 Shoreline Erosion and Deposition
 CHAPTER 12 1 Shoreline Erosion and Deposition SECTION Agents of Erosion and Deposition BEFORE YOU READ After you read this section, you should be able to answer these questions: What is a shoreline? How
EPS 50 Lab 4: Sedimentary Rocks
 Name: EPS 50 Lab 4: Sedimentary Rocks Grotzinger and Jordan, Chapter 5 Introduction In this lab we will classify sedimentary rocks and investigate the relationship between environmental conditions and
Sediment. Weathering: mechanical and chemical decomposition and disintegration of rock and minerals at the surface
 Sediment Some basic terminology Weathering: mechanical and chemical decomposition and disintegration of rock and minerals at the surface Erosion: removal of weathered rock and minerals from one place to
13. Sedimentary Rocks I (p )
") 13. Sedimentary Rocks I (p. 194-208) Sediment Deposition Weathering results in rock being broken down into smaller fragments, called regolith. This regolith is then broken down to form soil. The regolith
13. Sedimentary Rocks I (p. 194-208) Sediment Deposition Weathering results in rock being broken down into smaller fragments, called regolith. This regolith is then broken down to form soil. The regolith
What is weathering and how does it change Earth s surface? Answer the question using
 7 th Grade Lesson What is weathering and how does it change Earth s surface? Answer the question using the sentence frame. You have 4 minutes. Weathering is. This changes the Earth s surface because. 1
The Water Planet Ch. 22
 The Water Planet Ch. 22 What is Oceanography? the study of the Earth s oceans using chemistry, biology, geology, and physics. Oceans cover 70% of the Earth s surface Ocean Research 22.1 The use of submarines
OCEAN ZONES. 1. Intertidal Zone 2. Near-Shore Zone 3. Open-Ocean Zone
 OCEAN ZONES 1. Intertidal Zone 2. Near-Shore Zone 3. Open-Ocean Zone Where the Ocean Meets the Land (Place) Intertidal Zone The intertidal zone is the area between the high- and low-tide lines. At high
OCEAN ZONES. 1. Intertidal Zone 2. Near-Shore Zone 3. Open-Ocean Zone
 OCEAN ZONES 1. Intertidal Zone 2. Near-Shore Zone 3. Open-Ocean Zone Where the Ocean Meets the Land (Place) Intertidal Zone The intertidal zone is the area between the high- and low-tide lines. At high
Exploring The Polar Connection to Sea Level Rise NGSS Disciplinary Core Ideas Science & Engineering Crosscutting Concepts
 Exploring The Polar Connection to Sea Level Rise NGSS Disciplinary Core Ideas Science & Engineering Crosscutting Concepts Practices MS - ESS: Earth & Space Science 1. Ask questions 2. Developing and using
Form 4 of Schedule 5 of the Exclusive Economic Zone and Continental Shelf (Environmental Effects Permitted Activities) Regulations 2013
 Regulations 2013") FORM 4 Permitted activities: Post-activity report Form 4 of Schedule 5 of the Exclusive Economic Zone and Continental Shelf (Environmental Effects Permitted Activities) Regulations 2013 How to use this
FORM 4 Permitted activities: Post-activity report Form 4 of Schedule 5 of the Exclusive Economic Zone and Continental Shelf (Environmental Effects Permitted Activities) Regulations 2013 How to use this
Map shows 3 main features of ocean floor
 Map shows 3 main features of ocean floor 2017 Pearson Education, Inc. Chapter 3 Marine Provinces 2017 Pearson Education, Inc. 1 Chapter 3 Overview The study of bathymetry determines ocean depths and ocean
1. Oceans. Example 2. oxygen.
 1. Oceans a) Basic facts: There are five oceans on earth, making up about 72% of the planet s surface and holding 97% of the hydrosphere. Oceans supply the planet with most of its oxygen, play a vital
The 2010 Fiji coral reef system map is given in an ArcMap shapefile format and consists of seven associated files:
 METADATA The 2010 Fiji coral reef system map is given in an ArcMap shapefile format and consists of seven associated files: 1. fj20100815qbikon_kadavu_habitat_map.shp 2. fj20100815qbikon_kadavu_habitat_map.dbf
Marine biologists have identified over 250,000 marine species. This number is constantly increasing as new organisms are discovered.
 A wide variety of organisms inhabit the marine environment. These organisms range in size from microscopic bacteria and algae to the largest organisms alive today blue whales, which are as long as three
The Ocean Floor THE VAST WORLD OCEAN
 OCEANOGRAPHY Name Color all water LIGHT BLUE. Color all land LIGHT GREEN. Label the 5 Oceans: Pacific, Atlantic, Indian, Arctic, Antarctic. Label the 7 Continents: N.America, S.America, Europe, Asia, Africa,
Sedimentary Rocks - are one of the three main rock types
 Today s Objective: What Makes Sedimentary Rocks Special? Sedimentary Rocks - are one of the three main rock types A sedimentary rock can form one of three ways: 1. by the deposition of the weathered remains
Current and Future Technology Applications for Coastal Zone Management. Bruce K. Carlisle, Acting Director Office of Coastal Zone Management
 Current and Future Technology Applications for Coastal Zone Management Bruce K. Carlisle, Acting Director Office of Coastal Zone Management The Massachusetts Coastal Zone Management Program Approved in
A Sedimentological and Granulometric Atlas of the Beach Sediments of Florida s Southwest Coast and Keys
 A Sedimentological and Granulometric Atlas of the Beach Sediments of Florida s Southwest Coast and Keys Daniel C. Phelps, Michelle M. L. Ladle, and Adel A. Dabous The Florida Geological Survey Coastal
Chapter Overview. Bathymetry. Measuring Bathymetry. Measuring Bathymetry
 CHAPTER 3 Marine Provinces Chapter Overview The study of bathymetry determines ocean depths and ocean floor topography. Echo sounding and satellites are efficient bathymetric tools. Most ocean floor features
Lesson: Primary Production
 Lesson: Primary Production By Keith Meldahl Corresponding to Chapter 14: Primary Producers Microscopic phytoplankton -- tiny single-celled plants that float at the ocean s surface, are the ultimate food
are unconsolidated particulate materials that either precipitate from or are deposited by a fluid (e.g., water, wind);
;") Sediments... are unconsolidated particulate materials that either precipitate from or are deposited by a fluid (e.g., water, wind); provide information about the past depositional environments and climatic
Sediments... are unconsolidated particulate materials that either precipitate from or are deposited by a fluid (e.g., water, wind); provide information about the past depositional environments and climatic
Developed in Consultation with Florida Educators
 Developed in Consultation with Florida Educators Table of Contents Next Generation Sunshine State Standards Correlation Chart... 7 Benchmarks Chapter 1 The Practice of Science...................... 11
Ecoregions Glossary. 7.8B: Changes To Texas Land Earth and Space
 Ecoregions Glossary Ecoregions The term ecoregions was developed by combining the terms ecology and region. Ecology is the study of the interrelationship of organisms and their environments. The term,
Tikrit University College of Engineering Civil engineering Department
 Tikrit University SOIL CLASSIFICATION College of Engineering Civil engineering Department Soil Mechanics 3 rd Class Lecture notes Up Copyrights 2016 Classification of soil is the separation of soil into
Bowen s Chemical Stability Series
 Lab 5 - Identification of Sedimentary Rocks Page - Introduction Sedimentary rocks are the second great rock group. Although they make up only a small percentage of the rocks in the earth s crust (~5%)
CORAL BIODIVERSITY AND ZONATION ON A PLEISTOCENE REEF, SOUTHEASTERN JAMAICA
 CORAL BIODIVERSITY AND ZONATION ON A PLEISTOCENE REEF, SOUTHEASTERN JAMAICA Sherene A. James PhD Student - University of the West Indies, Mona Education Outreach Officer - Natural History Division, Institute
Ocean Basins, Bathymetry and Sea Levels
 Ocean Basins, Bathymetry and Sea Levels Chapter 4 Please read chapter 5: sediments for next class and start chapter 6 on seawater for Thursday Basic concepts in Chapter 4 Bathymetry the measurement of
Bathymetry Measures the vertical distance from the ocean surface to mountains, valleys, plains, and other sea floor features
 1 2 3 4 5 6 7 8 9 10 11 CHAPTER 3 Marine Provinces Chapter Overview The study of bathymetry determines ocean depths and ocean floor topography. Echo sounding and satellites are efficient bathymetric tools.
Lecture Outlines PowerPoint. Chapter 13 Earth Science 11e Tarbuck/Lutgens
 Lecture Outlines PowerPoint Chapter 13 Earth Science 11e Tarbuck/Lutgens 2006 Pearson Prentice Hall This work is protected by United States copyright laws and is provided solely for the use of instructors
Question: What is the primary reason for the great abundance of fish along the Peruvian coast?
 Buzzer Question # 1 Question Type: toss-up Question Format: Multiple Choice Category: Biology What is the primary reason for the great abundance of fish along the Peruvian coast? Answer W: upwelling Answer
Benthic habitat mapping: a synopsis of methodologies and approaches. Dr. Craig Brown University of Ulster
 Benthic habitat mapping: a synopsis of methodologies and approaches Dr. Craig Brown University of Ulster Technological advances in remote sensing Insitu sampling Improving technology Single beam acoustics/video
Essentials of Oceanography Eleventh Edition
 Chapter Chapter 1 15 Clickers Lecture Essentials of Oceanography Eleventh Edition Animals of the Benthic Environment Alan P. Trujillo Harold V. Thurman Chapter Overview Benthic communities include a variety
A) usually less B) dark colored and rough D) light colored with a smooth surface A) transparency of the atmosphere D) rough, black surface
 usually less B) dark colored and rough D) light colored with a smooth surface A) transparency of the atmosphere D) rough, black surface") 1. Base your answer to the following question on the diagram below which shows two identical houses, A and B, in a city in North Carolina. One house was built on the east side of a factory, and the other
1. Base your answer to the following question on the diagram below which shows two identical houses, A and B, in a city in North Carolina. One house was built on the east side of a factory, and the other
Oceans I Notes. Oceanography
 Oceans I Notes Outlines on the front table Oceanography the science of our oceans that mixes biology, geology, chemistry, and physics (among other sciences) to unravel the mysteries of our seas. Divisions
Sedimentology & Stratigraphy. Thanks to Rob Viens for slides
 Sedimentology & Stratigraphy Thanks to Rob Viens for slides Sedimentology The study of the processes that erode, transport and deposit sediments Sedimentary Petrology The study of the characteristics and
The Coast: Beaches and Shoreline Processes
 1 2 3 4 5 6 7 8 9 The Coast: es and Shoreline Processes Trujillo & Thurman, Chapter 10 Oceanography 101 Chapter Objectives Recognize the various landforms characteristic of beaches and coastal regions.
E1212 Vol. 3 I~~~~~~~~~~~~~~~~~~~~~~~~~~~~~~~~~~~~~~~~~~~~~~~~~~~~~~~~~~~~~~~~~~~~~~~~~~~~~~~~~~~~~~~~~~~~~~~~~~~~~~~~~~~~~~
 Public Disclosure Authorized Public Disclosure Authorized Public Disclosure Authorized Public Disclosure Authorized EU Tacis: Joint Environment Programme 11 FOREST PROTECTION AND REFORESTATION PROJECT,
Unit 4 - Water. Earth s Interior. Earth s Interior. Continental Drift. Continental Drift. Continental Drift. Crust. Mantle. Core.
 Unit 4 - Water How did the oceans form? What special adaptations do saltwater organisms have? Where does our water come from? How do humans affect the Earth s water? Crust Rigid outer shell of Earth Oceanic
Rocks and Weathering
 Rocks and Weathering The Effects of Weathering The process of mountain building thrusts rock up to Earth s surface. Weathering is the process that breaks down rock and other substances at Earth s surface.
Seaweed Reproductive Phenology Protocol
 Seaweed Reproductive Phenology Protocol Purpose To classify and count the reproductive phenological phases of receptacles on selected seaweed species Overview Students will classify and count the reproductive
The Coast: Beaches and Shoreline Processes Trujillo & Thurman, Chapter 10
 The Coast: es and Shoreline Processes Trujillo & Thurman, Chapter 10 Oceanography 101 Chapter Objectives Recognize the various landforms characteristic of beaches and coastal regions. Identify seasonal
4. In areas where tectonic plates collide, the seafloor has deep. 5. In areas where tectonic plates separate, the seafloor has mid- ocean
 Name Date Hour Table Chapter 14 Lesson One- General Directions: Use the word bank below to complete each statement. NOT all terms are used. abyssal plains brackish water condensation energy freshwater
PRINCIPLE OF OCEANOGRAPHY PBBT101 UNIT-1 INTRODUCTION OF OCEANIC ENVIRONMENT. PART-A (2 Marks)
") PRINCIPLE OF OCEANOGRAPHY PBBT101 UNIT-1 INTRODUCTION OF OCEANIC ENVIRONMENT 1. Define marine ecosystem. 2. What is geography? 3. Give two Oceanic zones 4. What is sea? 5. Define oceanography? 6. Enlist
PRINCIPLE OF OCEANOGRAPHY PBBT101 UNIT-1 INTRODUCTION OF OCEANIC ENVIRONMENT 1. Define marine ecosystem. 2. What is geography? 3. Give two Oceanic zones 4. What is sea? 5. Define oceanography? 6. Enlist
Red Sea - Dead Sea Water Conveyance Study Program Additional Studies
 Red Sea - Dead Sea Water Conveyance Study Program Additional Studies Red Sea Study Final Report Annex 1 Field and laboratory activities carried out during the study and their results July 213 TABLE OF
The Effects of the 2004 Tsunami on the Seaweed and Seagrass Community at. Talibong Island and Nearby Trang province, Thailand
 The Effects of the 2004 Tsunami on the Seaweed and Seagrass Community at Talibong Island and Nearby Trang province, Thailand Anchana Prathep 1 *, Piyalarp Tantiprapas 2, Bongkot Wichachucherd 1 Ajchara
Brief report on Belize carbonate environments field trip Feb. 2012
 Brief report on Belize carbonate environments field trip Feb. 2012 In february 2012 I travelled to San Pedro (Ambergris Caye) Belize (Figure 1) to examine and study depositional environments of carbonate
Small area of the ocean that is partially surrounded by land. The Ocean Basins. Three Major Oceans. Three Major Oceans. What is a SEA?
 The Ocean Basins How Deep is the Ocean? 1 2 Three Major Oceans Three Major Oceans Pacific Atlantic the shallowest ocean (3.3km average depth) Indian second shallowest ocean (3.8km average depth) Pacific
Sedimentary Rocks. Weathering. Mechanical & Chemical Weathering. Sediments. Lithification. Deposition. Transport. Erosion.
 Lithification Sedimentary Rocks Sediments Deposition Transport Erosion Weathering Weathering The sediments that make up sedimentary rocks are produced by: Mechanical & Chemical Weathering Mechanical Weathering
Relatively little hard substrate occurs naturally in the
 CHAPTER FIVE Rock Habitats Relatively little hard substrate occurs naturally in the estuary, owing mainly to the vast quantities of fine sediment that have been deposited by the rivers. Rock habitat is
Marine Life. and Ecology. 2. From phytoplanktons to invertebates
 Marine Life and Ecology 2. From phytoplanktons to invertebates Virtually all primary productivity on land comes from large seaweeds such as these do exist, but they need shallow water where Sunlight is
Feet CLAY; silty, greenish gray and clayey fine sand; Color: 5Y 3/1
 -. CLAY; silty, greenish gray and clayey fine sand; Color: Y /. -. SAND; fine-medium, clayey, with sandy clay layers; very abundant broken thin, tiny shells; shell hash at several horizons, heavily burrowed;
National Marine Sanctuary Program
 National Marine Sanctuary Program NMSP/USGS Joint Seabed Mapping Initiative: September 2004 AA National Ocean Service National Marine Sanctuaries Interim Report September 2004 Background: Since 2002,
Igneous Rocks (Right Side Question)
") Igneous Rocks (Right Side Question) Record the question in your notebook! Using your understanding of rock texture (grain size, grain shape, grain pattern), explain the process that you would use to determine
Igneous Rocks (Right Side Question) Record the question in your notebook! Using your understanding of rock texture (grain size, grain shape, grain pattern), explain the process that you would use to determine