The Appennino Tool: a GIS-Tool for the analysis of wildlife habitat selection
|
|
|
- Shawn Allen Farmer
- 6 years ago
- Views:
Transcription
1 The Appennino Tool: a GIS-Tool for the analysis of wildlife habitat selection INTRODUCTION Wildlife management studies identify the resources (e.g. food items or habitats) used by animals and document their availability. Resources availability is defined as the quantity accessible to the animal or populations of animals and is distinguished from abundance, which is defined as the resources in the environment (Alldredge et al., 1998). Resource usage is the quantity taken by an animal or population of animals. Used resources may be consumed, in the case of food items, or simply visited, in the case of habitats (Manly et al., 1993). A wide variety of methods can be adopted to studies the animal resource selection (Manly et al., 2002). One of this methods is the Compositional analysis. Compositional analysis is an application of multivariate analysis of variance (Aebischer et al., 1993; Pendleton et al., 1998; Manly et al., 2002). The technique can be applied to the analysis of data considered for selection among categories of a simple categorical variable. Resource use is defined in terms of the proportion of different types of resources within estimated home range boundary or other use area. A compositional analysis proceeds as follows. It assumes there are D types of available resource units, and that the single animal s proportional resource usage is described by the composition o u1, o u2,, o ud. where o ui is the estimated proportion of the i type resource used by the individual. The proportions sum to one. Similarly, the analysis sets the available proportions for the same animals to be π a1, π a2,, π ad. Compositional analysis cannot be applied when resources units are described by continuous variables, unless those continuous variables are expressed as discrete classes. It can be shown that for any component o j of a composition, the log-ratio transformation y i =log e (o ui /o uj ) produces new variables that are linearly independent, with a specific choice for j. Based on this result, the differences d i = log e (o ui /o uj ) - log e (π ai / π aj ) are calculated for ith animal to represent the difference between the relative use and availability of resources i and j. With no selection, the mean value of d i is expected to be zero over all
2 animals, for all i. If necessary, zero values have to be replaced by small positive number when calculating d i values. Using the animal as the unit of observation may avoid problems related to the sampling level (Kenward, 1992): the unit-sum constraint whereby the avoidance of one resource type leads to some selection for alternatives (Aebischer et al., 1993); the differential use of resources by different groups of animal (Aebischer et al., 1993), and pseudoreplications (Hurlbert, 1984) provided animals behave independently. Despite these advantages, there are important assumptions underlying compositional-based analyses. These include the data independence from different animals and multivariate normality. The need to substitute, under some circumstances (Pendleton et al., 1998), zero values with an arbitrary constant has also caused the method to be criticized. The method is often used for the analysis of habitat preference (Fearer & Stauffer, 2004; M. Ferretti et al., 2010). It allows to study the animal s preference at both home range or single point (fix) levels. At the moment, it can be performed using several free software like the R Project for Statistical Computing as well as some commercial solutions (Compos Analysis v6.3 Smith ecology). Microcal Origin, GraphPad Prism, SPSS and SigmaPlot are examples of specialized computer programs commonly adopted to carry out statistical analysis. These programs tend to be expensive and do not include just statistical analysis features but also curve fitting, modeling and graphing ones. Cheaper Microsoft Excel add-ins, such as JMP-IN and Analyze- It, are available for much lower fees. If the goal of the user is to simply carry out the statistical analysis described in this paper, a lot of resources are wasted on a vast excess of unnecessary features. Worldwide, Geographical Information Systems (GIS) are being used to solve problems associated with wildlife management. From calculating existing wildlife densities, assessing sustainability of habitat for wildlife populations, to evaluating human impact on the wildlife and
3 land, GIS can prove to be an invaluable tool. A geographic information system integrates hardware, software, and data for capturing, managing, analyzing, and displaying all forms of geographically referenced information. GIS allows to view, understand, query, interpret, and visualize data in many ways that reveal relationships, patterns, and trends in the form of maps, globes, reports, and charts. A GIS helps answering questions and solve problems by looking at data in a way that is quickly understood and easily shared. GIS technology can be integrated into any enterprise information system framework ( The ArcGIS software is a suite consisting of a group of geographic information system (GIS) tools produced by the US-based ESRI company. At the desktop level, ArcGIS includes ArcView which allows viewing spatial data, creating layered maps, and performing basic spatial analysis. Over the years, the use of the GIS software in the study of wildlife has become essential. In particular, utilities have been developed by experts in the fauna field for the most popular frameworks. Such extensions are commonly used for applied research. Among these we can surely remind Animal Movement (Hooge & Eichenlaub, 1997) for ESRI ArcView 3.x, and Hawts Tools ( for ESRI ArcGIS 9.x. Both of them allow to perform home ranges and animal movements analysis. Other software for the study of habitat preferences, are available on the web (for example The development of radio-collars and their use to track animal movements, led to the need of storing and transpose on digital maps thousands of positions (GPS fixes) for each studied individual. The management of such dataset has become complex and is liable of great simplification. This tool would allow to keep on working inside the GIS software and would save from the need of exporting the data to an external statistic software.
4 PROGRAM DESCRIPTION The presented tool was first coded in VBA (Visual Basic for Application) directly using the facilities provided by the ESRI ArcGIS (Burke 2003, Chang 2007) environment. Once it was completed and thoughtfully tested, a complete review of the modules was undertaken. Compositional Analysis is a very widespread study technique for the research of environmental preferences. A range of them is obtained from geographically processing environmental availability, home ranges and single animal locations (fix), elaborated to underline their relative weight only in presence of different types of environments. To apply this technique by traditional means, first of all, a spreadsheet should be used for data pre-processing. After that, it could be possible to use a statistical program to apply the ANOVA algorithm between environmental frequencies in the home ranges or for the single locations. Current workflows require to get out from the GIS environment to apply this type of analysis (as the Animal Movement Extension tool and the Hawts Tool documentations show). On the opposite, it would be advisable to have a utility that could let apply the Compositional Analysis within the GIS environment. This seems more desirable, since today the development of Gps radio-collars has arisen the need to store and transpose on digital maps thousands of positions for each animal. The management and the export of such dataset can become quickly complex and can be certainly simplified. The ArcGIS tool described in this paper has been designed for ease of use and has been rigorously tested in conjunction with commercially available packages for accuracy. Basic data needed to perform Compositional Analysis are: use of the land home ranges of animals environmental availability of study area for the study of home range preferences animal location; Such information is analyzed by the tool through a two-step process. The first one starts from primary data to come up with the definition of the analysis matrix. This data array can be
5 exported in txt or dbf file format to be used in other statistical software. In the second step is possible to run the ANOVA test directly on the newly created matrix, without leaving the ArcGIS environment. The flow chart of the program's work is highlighted in figure 1 and 2.

6 Figure 1. The flow chart of the first part of the tool
7 A dialog window containing 3 dropdown boxes (4 if the Fixes analysis is chosen) is displayed upon tool start-up. The purpose of each is explained to follow: 1 st BOX: select the layer that represents the land use and the field that identify itself 2 nd BOX: select the layer that represents the environment where the study takes place, that can be formed either by study area or by sampling on it 3 rd BOX: select the layer that represents home ranges and the field that identify the animal (In the Fixes analysis) 4 th BOX: select the layer that contains the fixes and the field that identify the animal The tool creates a temporary directories where the original layers are copied, to preserve them from modifications, and the software works with the copies, named layer for the analysis purpose. Then it begins geoprocessing operations (Chang 2007; Gorr & Kurland, 2007): INTERSECT between the study area and the use of the land + DISSOLVE for the land use typology, with the creation of Land use layer only for the single study area (the related table shows a row for each typology of land use) INTERSECT between the home ranges and the land use + DISSOLVE for the identification of the animal + SPLIT for the identification of the animal, with the creation of a layer for each animal (the related table shows a row for each typology of land use present in the home range of that animal) Hence on the tools works with the table layers and performs a JOIN between the single table of each animal and the table of land use UPDATING the tables of each animal so to have all the environmental typologies present in the study area, including the ones not present in the home range of the animal, that have no value. Then the tool creates an empty matrix layer and APPENDs single tables to the MATRIX. After that, it executes a CALCULATION of the various matrix fields useful to obtain the field with logarithmic transformations of the connection between the land use present in the home range of each animal and the land use present in the study area, divided by animal. All this calculation outputs the Analysis matrix and the first stage ends.
8 Then a new dialog window asks the user whether to continue the analysis in ArcGIS environment and to make a One-Way ANOVA or to export the matrix in txt or dbf format file and quit. If the user chooses to continue, the tool transforms the matrix in another table with land use code values in each field. Then creates a two dimensional array e populates it. Finally the tool performs the One-Way ANOVA test, and creates the following information: Analysis of variance table Table with mean and standard deviation values Box-Plot Graph

9 Figure 2. The flow chart of the second part of the tool
10 SAMPLES OF TYPICAL PROGRAM RUNS The current paragraph provides the mean to reach a better comprehension of the tool s workflow by describing its adoption in real data analysis. Sample information was taken from a study carried out between 2008 and 2009 on a group of pheasants (Phasianus Colchicus) released in a protected area (PA) near Florence (Tuscany Italy). The interested area is used for agricultural activities and is characterized by a good habitat variety and fields of medium and small size. The crops mostly present are vineyards (Vitis vinifera L.), olive-yards (Olea europaea L.) and, secondarily, autumn cereals (mainly wheat: Triticum aestivum L. and oats: Avena sativa L.), alfalfa (Medicago sativa L.) and spring crops (sunflower: Helianthus annuus L., jowar: Sorghum vulgare L., and corn: Zea mays L.). In the PA some habitat enhancements, established essentially by the so-called crops-for-game (no-harvested crops) method, are also realized. These consist mainly in strips sown with mixtures of jowar, rape (Brassica napus L. var. oleifera) and sunflower in the spring and broad bean (Vicia faba L. var. minor) and wheat in the autumn. Both are left on the field without any weed control. The area is characterized by rich spontaneous vegetation. Land use maps are a product of aerial photo interpretation and on-field survey. Obtained data are made available as a polygon shape file and loaded in ArcGIS as a layer.

11 Figure 3. Land use layer The Land use polygon layer is loaded in the ArcGIS Table of Content (TOC). Styling is performed for clarity as is not required for successful analysis (Figure 3). A second layer holding the localizations of the pheasants is needed by the tool. Such data is retrieved by the study of the animal s movements which was possible since at the releasing moment they e were equipped with a necklace radio-tag (Biotrak, TW3+ ½AA, g) and an immovable leg tag. The pheasants were then localized and sighted during the day, at least 2-3 times a week in a period from October to April by two receivers equipped with four-element Yagi antennae, binoculars and a walkie-talkie (Kenward, 1993). The fixes (546) were obtained by two means. Either taking synchronous compass bearings from at least two different positions localized on the top of the hills at a range of m or by direct sighting of the pheasants during the control of their presence in the triangulated patch. For each sight fix, the time and the land use
12 were registered, either on paper or on a GPS portable device (Garmin etrex Legend navigator; 1-5 m location error). Subsequently, these data were transferred to ArcGIS with the software GPS-Utility Ltd or, for the points on paper, with the creation of a point shape file on the map. Both fixes from GPS and paper were merged in a unique points shape file. (Modern GPS collars directly output the stored position fixes as point layers, ready to be used in the GIS software. Every fix has a name and a reference to a single animal). The home range polygon shape file of every single animal is generated with the Hawth Tool ( This layer is hence added to the Table of Content (TOC) (Figure 4). Figure 4. Land use and home ranges layers
13 To estimate the availability environment a number of 50 random circular plots must be chosen across the study area. Since the average home range size for the birds analysed in the study is approximately of 110 m, the same value is taken as the radius of the circular shapes. The random plots are generated using the Hawth Tool. This layer is the added to the Table of Content (TOC) (Figure 5). Figure 5. Land use, home ranges and availability plots layers Once the 3 described layers are available in the ArcGIS environment, the Appennino Tool can be started from the toolbar. At first, the analysis mode must be chosen between home ranges and fixes level. For the second to be carried out, the point layer of the fixes must be added in the TOC before starting the tool.
14 Once the choice is done, a window containing 3 combo boxes (4 if the fix analysis is chosen) is displayed (Figure 6). Its form must be completed selecting from the drop-down boxes the appropriate layer present in the TOC. The field containing the land use attribute of the land use layer and the field storing the animal code of the home ranges layers must be specified. Once all information is correctly provided, the calculation can be started by pressing the Start button.


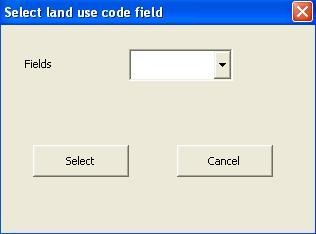


15 Figure 6. The FORMS of the tool
 for comparison purposes with the tool s results.")
16 A complex matrix is given as a result, after some time of calculation activity depending on the workstation computational power. Such matrix can be exported in.dbf of.txt file and can be used for the Compositional Analysis inside a statistic software (Pendleton et al. 1998, Smith 2004) for comparison purposes with the tool s results. The Compositional Analysis is performed during the second step of the tool workflow, which outputs an ANOVA table as result (Figure 7). This table contains averages and standard deviation values which can be automatically plotted on a chart for the user s purposes. In the described sample data, the land use codes which give maximum values of occurrence are 6 (Spring crops-for-game) and 7 (Fall crops-for-game). The less utilized are the land with code 10 (Rivers and ponds) and 9 (Urban areas) (Figure 8). In a future version of the tool, a post-hoc test will be made available along with the calculation algorithm (Brown 2005). Figure 7. Analysis of variance table

17 Figure 8. Box-plot graph Acknowledgements - Daniel S. Soper, Ph.D. Assistant Professor Department of Information Systems and Decision Sciences Mihaylo College of Business and Economics California State University, Fullerton - Provence of Pistoia - Ambito Territoriale di Caccia Firenze 5
18 REFERENCES Aebischer, N.J., Robertson, P.A., Kenword, R.E. 1993: Compositional analysis of habitat use from animal radio-tracking data. - Ecology 74: Alldredge, J.R., Thomas, D.L., McDonald, L.L.1998: Survey and Comparison of Methods for Study of Resource Selection.- Journal of Agricultural, Biological, and Environmental Statistics 3: Bradley, J.C., Millspaugh, A.C., 2003: Programming in Visual Basic.net. McGraw-Hill Irwin, New York, USA, 627 p. Brown, A.M. 2005: A new software for carrying out one-way ANOVA post hoc tests. - Computer Methods and Programs in Biomedicine 79(1): Burke, R. 2003: Getting to know ArcObjects: programming ArcGIS with VBA. ESRI. 422 p. Chang, K.T. 2007: Programming ArcObjects with VBA: a task-oriented approach. CRC. 342 p. Fearer, T. M., Stauffer. D.F. 2004: Relationship of ruffed grouse Bonasa umbellus to landscape characteristics in southwest Virginia, USA. - Wildlife Biology, 10: Ferretti, M., Paci, G., Porrini, S., Galardi, L., Bagliacca M. 2010: Habitat use and home range traits of resident and relocated hares (Lepus europaeus, Pallas). Italian Journal of Animal Science 9 (3): Gorr, W.L., Kurland, K.S.: GIS tutorial: workbook for ArcView 9. ESRI. 374 p. Hooge, P. N., Eichenlaub, B. 1997: Animal movement extension to arcview. ver Alaska Science Center Biological Science Office, U.S. Geological Survey, Anchorage, AK, USA. Hurlbert, S.H. 1984: Pseudoreplication and the design of ecological field experiments. - Ecological Monographs 54: Kenward, R. E. 1992: Quality versus quantity: programmed collection and analysis of radiotracking data. - In:. Priede, I. G., Swift, S. M.; Wildlife telemetry: remote monitoring and tracking of animals. Ellis Horwood. Chichester, United Kingdom
19 Kenward, R. 1993: Wildlife radiotagging. Equipment, field techniques and data analysis. - Academic Press, London. Manly, B. F. J. 1993: Comments on design and analysis of multiple-choice feeding-preference experiments. - Oecologia 93: Manly, B. F J., McDonald, L. L., Thomas, D. L., McDonald, T. L., Erickson, W. P. 2002: Resource selection by animals: statistical design and analysis for field studies. Second edition. Kluwer Academic Publishers, Boston, Massachusetts, USA, 221 p. Pendleton, G.W., Titus, K., Degayner, E., Flatten, C. J., Lowell, R.E. 1998: Compositional Analysis and GIS for Study of Habitat Selection by Goshawks in Southeast Alaska.- Journal of Agricultural, Biological & Environmental Statistics 3: Smith, P. G. 2004: Automated log-ratio analysis of compositional data: software suited to analysis of habitat preference from radio tracking data. - Bat Research News 45(1): 16.
Research Article Appennino: A GIS Tool for Analyzing Wildlife Habitat Use
 Zoology Volume 2012, Article ID 475071, 5 pages doi:10.1155/2012/475071 Research Article Appennino: A GIS Tool for Analyzing Wildlife Habitat Use Marco Ferretti, 1 Marco Foi, 2 Gisella Paci, 1 Walter Tosi,
94-802Z: Geographic Information Systems Summer 2018
 94-802Z: Geographic Information Systems Summer 2018 Instructor: Professor Kristen Kurland Teaching Assistant(s): (Office hours to be posted on Canvas) TBA Class Web Site: http:/www.cmu.edu/canvas
ArcGIS. for Server. Understanding our World
 ArcGIS for Server Understanding our World ArcGIS for Server Create, Distribute, and Manage GIS Services You can use ArcGIS for Server to create services from your mapping and geographic information system
GIS Workshop Data Collection Techniques
 GIS Workshop Data Collection Techniques NOFNEC Conference 2016 Presented by: Matawa First Nations Management Jennifer Duncan and Charlene Wagenaar, Geomatics Technicians, Four Rivers Department QA #: FRG
INTRODUCTION TO GEOGRAPHIC INFORMATION SYSTEM By Reshma H. Patil
 INTRODUCTION TO GEOGRAPHIC INFORMATION SYSTEM By Reshma H. Patil ABSTRACT:- The geographical information system (GIS) is Computer system for capturing, storing, querying analyzing, and displaying geospatial
ENV208/ENV508 Applied GIS. Week 1: What is GIS?
 ENV208/ENV508 Applied GIS Week 1: What is GIS? 1 WHAT IS GIS? A GIS integrates hardware, software, and data for capturing, managing, analyzing, and displaying all forms of geographically referenced information.
GEOGRAPHIC INFORMATION SYSTEMS AND IT SOLUTIONS FOR THE ENVIRONMENT
 GEOGRAPHIC INFORMATION SYSTEMS AND IT SOLUTIONS FOR THE ENVIRONMENT Mission We focus on Solutions is a worldwide operating business offering Geographic Information Systems and IT solutions to assist environmental
UNIT 4: USING ArcGIS. Instructor: Emmanuel K. Appiah-Adjei (PhD) Department of Geological Engineering KNUST, Kumasi
 Department of Geological Engineering KNUST, Kumasi") UNIT 4: USING ArcGIS Instructor: Emmanuel K. Appiah-Adjei (PhD) Department of Geological Engineering KNUST, Kumasi Getting to Know ArcGIS ArcGIS is an integrated collection of GIS software products ArcGIS
UNIT 4: USING ArcGIS Instructor: Emmanuel K. Appiah-Adjei (PhD) Department of Geological Engineering KNUST, Kumasi Getting to Know ArcGIS ArcGIS is an integrated collection of GIS software products ArcGIS
Oakland County Parks and Recreation GIS Implementation Plan
 Oakland County Parks and Recreation GIS Implementation Plan TABLE OF CONTENTS 1.0 Introduction... 3 1.1 What is GIS? 1.2 Purpose 1.3 Background 2.0 Software... 4 2.1 ArcGIS Desktop 2.2 ArcGIS Explorer
10/13/2011. Introduction. Introduction to GPS and GIS Workshop. Schedule. What We Will Cover
 Introduction Introduction to GPS and GIS Workshop Institute for Social and Environmental Research Nepal October 13 October 15, 2011 Alex Zvoleff azvoleff@mail.sdsu.edu http://rohan.sdsu.edu/~zvoleff Instructor:
GIS CONCEPTS ARCGIS METHODS AND. 2 nd Edition, July David M. Theobald, Ph.D. Natural Resource Ecology Laboratory Colorado State University
 GIS CONCEPTS AND ARCGIS METHODS 2 nd Edition, July 2005 David M. Theobald, Ph.D. Natural Resource Ecology Laboratory Colorado State University Copyright Copyright 2005 by David M. Theobald. All rights
ArcGIS for Desktop. ArcGIS for Desktop is the primary authoring tool for the ArcGIS platform.
 ArcGIS for Desktop ArcGIS for Desktop ArcGIS for Desktop is the primary authoring tool for the ArcGIS platform. Beyond showing your data as points on a map, ArcGIS for Desktop gives you the power to manage
Geographical Information Systems
 Geographical Information Systems Geographical Information Systems (GIS) is a relatively new technology that is now prominent in the ecological sciences. This tool allows users to map geographic features
DATA SOURCES AND INPUT IN GIS. By Prof. A. Balasubramanian Centre for Advanced Studies in Earth Science, University of Mysore, Mysore
 DATA SOURCES AND INPUT IN GIS By Prof. A. Balasubramanian Centre for Advanced Studies in Earth Science, University of Mysore, Mysore 1 1. GIS stands for 'Geographic Information System'. It is a computer-based
Understanding Geographic Information System GIS
 Understanding Geographic Information System GIS What do we know about GIS? G eographic I nformation Maps Data S ystem Computerized What do we know about maps? Types of Maps (Familiar Examples) Street Maps
Geometric Algorithms in GIS
 Geometric Algorithms in GIS GIS Visualization Software Dr. M. Gavrilova GIS Software for Visualization ArcView GEO/SQL Digital Atmosphere AutoDesk Visual_Data GeoMedia GeoExpress CAVE? Visualization in
NR402 GIS Applications in Natural Resources
 NR402 GIS Applications in Natural Resources Lesson 1 Introduction to GIS Eva Strand, University of Idaho Map of the Pacific Northwest from http://www.or.blm.gov/gis/ Welcome to NR402 GIS Applications in
GENERALIZATION IN THE NEW GENERATION OF GIS. Dan Lee ESRI, Inc. 380 New York Street Redlands, CA USA Fax:
 GENERALIZATION IN THE NEW GENERATION OF GIS Dan Lee ESRI, Inc. 380 New York Street Redlands, CA 92373 USA dlee@esri.com Fax: 909-793-5953 Abstract In the research and development of automated map generalization,
Eva Strand CNR Remote Sensing and GIS Lab
 Eva Strand CNR Remote Sensing and GIS Lab Habitat map Available habitat Habitat Hectares Percent Habitat 1 38079.9 55.1 Habitat 2 2740.5 4.0 Habitat 3 2692.8 3.9 Habitat 4 24533.1 35.5 Habitat 5 1072.8
Write a report (6-7 pages, double space) on some examples of Internet Applications. You can choose only ONE of the following application areas:
 on some examples of Internet Applications. You can choose only ONE of the following application areas:") UPR 6905 Internet GIS Homework 1 Yong Hong Guo September 9, 2008 Write a report (6-7 pages, double space) on some examples of Internet Applications. You can choose only ONE of the following application
UPR 6905 Internet GIS Homework 1 Yong Hong Guo September 9, 2008 Write a report (6-7 pages, double space) on some examples of Internet Applications. You can choose only ONE of the following application
REPORT ON INVESTMENTS
 REPORT ON INVESTMENTS D.T2.3.3 Investments for technical equipment for the implementation of Web-GIS platform in Mantova 1 Local support group designing Mantova Web-GIS platform. Picture by Maria Giulia
GIS = Geographic Information Systems;
 What is GIS GIS = Geographic Information Systems; What Information are we talking about? Information about anything that has a place (e.g. locations of features, address of people) on Earth s surface,
Working with ArcGIS: Classification
 Working with ArcGIS: Classification 2 Abbreviations D-click R-click TOC Double Click Right Click Table of Content Introduction The benefit from the use of geographic information system (GIS) software is
Using the Stock Hydrology Tools in ArcGIS
 Using the Stock Hydrology Tools in ArcGIS This lab exercise contains a homework assignment, detailed at the bottom, which is due Wednesday, October 6th. Several hydrology tools are part of the basic ArcGIS
Introduction to GIS. Geol 4048 Geological Applications of Remote Sensing
 Introduction to GIS Geol 4048 Geological Applications of Remote Sensing GIS History: Before Computers GIS History Using maps for a long time Dr. Roger F. Tomlinson Father of GIS He was an English geographer
This paper outlines the steps we took to process the repository file into a Geodatabase Utility Data Model for Bloomfield Township s analysis.
 Title of Paper Importing CAD Drawings into a Utility Data Model Authors Names Kevin G. Broecker & James R. Miller Abstract This presentation covers the process needed to integrate data from a CAD drawing
Display data in a map-like format so that geographic patterns and interrelationships are visible
 Vilmaliz Rodríguez Guzmán M.S. Student, Department of Geology University of Puerto Rico at Mayagüez Remote Sensing and Geographic Information Systems (GIS) Reference: James B. Campbell. Introduction to
Environmental Systems Research Institute
 Introduction to ArcGIS ESRI Environmental Systems Research Institute Redlands, California 2 ESRI GIS Development Arc/Info (coverage model) Versions 1-7 from 1980 1999 Arc Macro Language (AML) ArcView (shapefile
Esri UC2013. Technical Workshop.
 Esri International User Conference San Diego, California Technical Workshops July 9, 2013 CAD: Introduction to using CAD Data in ArcGIS Jeff Reinhart & Phil Sanchez Agenda Overview of ArcGIS CAD Support
CHANGES IN ETHNIC GEOGRAPHY IN WATERBURY AS A RESULT OF NATURAL DISASTERS AND URBAN RENEWAL
 G-1302: GIS and Environmental Modeling Final Project Report December 4, 2012 Student: David Perrier Instructor: Tatiana Serebriakova, Ph.D. CHANGES IN ETHNIC GEOGRAPHY IN WATERBURY AS A RESULT OF NATURAL
Techniques for Science Teachers: Using GIS in Science Classrooms.
 Techniques for Science Teachers: Using GIS in Science Classrooms. After ESRI, 2008 GIS A Geographic Information System A collection of computer hardware, software, and geographic data used together for
Digital Tax Maps Westport Island Project Summary
 Digital Tax Maps Westport Island Project Summary Presented to the: Mid-Coast Regional Planning Commission Creating GIS-Based Digital Tax Maps And Linked Assessment Records For Small Towns on a Budget Dennis
PC ARC/INFO and Data Automation Kit GIS Tools for Your PC
 ESRI PC ARC/INFO and Data Automation Kit GIS Tools for Your PC PC ARC/INFO High-quality digitizing and data entry Powerful topology building Cartographic design and query Spatial database query and analysis
Steve Pietersen Office Telephone No
 Steve Pietersen Steve.Pieterson@durban.gov.za Office Telephone No. 031 311 8655 Overview Why geography matters The power of GIS EWS GIS water stats EWS GIS sanitation stats How to build a GIS system EWS
GIS CONCEPTS ARCGIS METHODS AND. 3 rd Edition, July David M. Theobald, Ph.D. Warner College of Natural Resources Colorado State University
 GIS CONCEPTS AND ARCGIS METHODS 3 rd Edition, July 2007 David M. Theobald, Ph.D. Warner College of Natural Resources Colorado State University Copyright Copyright 2007 by David M. Theobald. All rights
ArcGIS Pro: Essential Workflows STUDENT EDITION
 ArcGIS Pro: Essential Workflows STUDENT EDITION Copyright 2018 Esri All rights reserved. Course version 6.0. Version release date August 2018. Printed in the United States of America. The information contained
Enabling ENVI. ArcGIS for Server
 Enabling ENVI throughh ArcGIS for Server 1 Imagery: A Unique and Valuable Source of Data Imagery is not just a base map, but a layer of rich information that can address problems faced by GIS users. >
Software for Landuse Management: Modelling with GIS
 O. R. SODEINDE, Nigeria Key words: ABSTRACT Land use management has been a very important issue in the planning and maintenance of environmental and economic development of a geographic area. Therefore,
STEREO ANALYST FOR ERDAS IMAGINE Stereo Feature Collection for the GIS Professional
 STEREO ANALYST FOR ERDAS IMAGINE Stereo Feature Collection for the GIS Professional STEREO ANALYST FOR ERDAS IMAGINE Has Your GIS Gone Flat? Hexagon Geospatial takes three-dimensional geographic imaging
Introduction to ArcGIS Server Development
 Introduction to ArcGIS Server Development Kevin Deege,, Rob Burke, Kelly Hutchins, and Sathya Prasad ESRI Developer Summit 2008 1 Schedule Introduction to ArcGIS Server Rob and Kevin Questions Break 2:15
Introduction to ArcGIS Server - Creating and Using GIS Services. Mark Ho Instructor Washington, DC
 Introduction to ArcGIS Server - Creating and Using GIS Services Mark Ho Instructor Washington, DC Technical Workshop Road Map Product overview Building server applications GIS services Developer Help resources
Lecture 2. Introduction to ESRI s ArcGIS Desktop and ArcMap
 Lecture 2 Introduction to ESRI s ArcGIS Desktop and ArcMap Outline ESRI What is ArcGIS? ArcGIS Desktop ArcMap Overview Views Layers Attribute Tables Help! Scale Tips and Tricks ESRI Environmental Systems
Popular Mechanics, 1954
 Introduction to GIS Popular Mechanics, 1954 1986 $2,599 1 MB of RAM 2017, $750, 128 GB memory, 2 GB of RAM Computing power has increased exponentially over the past 30 years, Allowing the existence of
Mitsuhiko Kawakami and Zhenjiang Shen Department of Civil Engineering Faculty of Engineering Kanazawa University Japan ABSTRACT
 ABSTRACT Formulation of an Urban and Regional Planning System Based on a Geographical Information System and its Application - A Case Study of the Ishikawa Prefecture Area of Japan - Mitsuhiko Kawakami
Advanced Image Analysis in Disaster Response
 Advanced Image Analysis in Disaster Response Creating Geographic Knowledge Thomas Harris ITT The information contained in this document pertains to software products and services that are subject to the
GEOGRAPHIC INFORMATION SYSTEMS
 GEOGRAPHIC INFORMATION SYSTEMS 4-H Round-Up Community Transitions Workshop Daniel Hanselka June 14, 2011 Goals of the Workshop Answer the question: What is GIS? Uses of GIS. Some of the Common Terminology
Data Structures & Database Queries in GIS
 Data Structures & Database Queries in GIS Objective In this lab we will show you how to use ArcGIS for analysis of digital elevation models (DEM s), in relationship to Rocky Mountain bighorn sheep (Ovis
GIS and Forest Engineering Applications FE 357 Lecture: 2 hours Lab: 2 hours 3 credits
 GIS and Forest Engineering Applications FE 357 Lecture: 2 hours Lab: 2 hours 3 credits Instructor: Michael Wing Assistant Professor Forest Engineering Department Oregon State University Peavy Hall 275
4. GIS Implementation of the TxDOT Hydrology Extensions
 4. GIS Implementation of the TxDOT Hydrology Extensions A Geographic Information System (GIS) is a computer-assisted system for the capture, storage, retrieval, analysis and display of spatial data. It
Geospatial Intelligence
 Geospatial Intelligence Geospatial analysis has existed as long as humans have made and studied maps but its importance to the intelligence community has skyrocketed in the past several years, with Unmanned
v WMS Tutorials GIS Module Importing, displaying, and converting shapefiles Required Components Time minutes
 v. 11.0 WMS 11.0 Tutorial Importing, displaying, and converting shapefiles Objectives This tutorial demonstrates how to import GIS data, visualize it, and convert it into WMS coverage data that could be
THE CONSERVATION LANDSCAPE CONTEXT TOOLBOX: A Custom ESRI ArcToolbox for the Stewardship of Conservation Lands in Rhode Island
 THE CONSERVATION LANDSCAPE CONTEXT TOOLBOX: A Custom ESRI ArcToolbox for the Stewardship of Conservation Lands in Rhode Island Ann Borowik M.E.S.M. Research Project University of Rhode Island May 2008
Esri EADA10. ArcGIS Desktop Associate. Download Full Version :
 Esri EADA10 ArcGIS Desktop Associate Download Full Version : http://killexams.com/pass4sure/exam-detail/eada10 Question: 85 Which format is appropriate for exporting map documents that require vector layers
International Journal of Scientific & Engineering Research, Volume 6, Issue 11, November ISSN
 International Journal of Scientific & Engineering Research, Volume 6, Issue 11, November-2015 42 Geospatial Mapping of Fish Farms in Anambra State Using GIS Approach Ojiako, J.C., Okafor, C. M., Igbokwe,
A GIS helps you answer questions and solve problems by looking at your data in a way that is quickly understood and easily shared.
 WHAT IS GIS? A geographic information system (GIS) integrates hardware, software, and data for capturing, managing, analyzing, and displaying all forms of geographically referenced information. GIS allows
Imagery and the Location-enabled Platform in State and Local Government
 Imagery and the Location-enabled Platform in State and Local Government Fred Limp, Director, CAST Jim Farley, Vice President, Leica Geosystems Oracle Spatial Users Group Denver, March 10, 2005 TM TM Discussion
Desktop GIS for Geotechnical Engineering
 Desktop GIS for Geotechnical Engineering Satya Priya Deputy General Manager (Software) RMSI, A-7, Sector 16 NOIDA 201 301, UP, INDIA Tel: +91-120-2511102 Fax: +91-120-2510963 Email: Satya.Priya@rmsi.com
Exercise 2: Working with Vector Data in ArcGIS 9.3
 Exercise 2: Working with Vector Data in ArcGIS 9.3 There are several tools in ArcGIS 9.3 used for GIS operations on vector data. In this exercise we will use: Analysis Tools in ArcToolbox Overlay Analysis
Lecture 2. A Review: Geographic Information Systems & ArcGIS Basics
 Lecture 2 A Review: Geographic Information Systems & ArcGIS Basics GIS Overview Types of Maps Symbolization & Classification Map Elements GIS Data Models Coordinate Systems and Projections Scale Geodatabases
URBAN SMS Soil Management Strategy
 URBAN SMS Soil Management Strategy SWOT of existing soil evaluation tools currently used by URBAN SMS partners T. Vernik & B. Vršèaj May 29 th, 2009 WP4 Tools common SWOT Analysis Report This analysis
Better Topographic Map Production Using ArcGIS. A Comprehensive Solution for Mapping Organizations
 Better Topographic Map Production Using ArcGIS A Comprehensive Solution for Mapping Organizations The World Is Always Changing As a member of a national mapping organization, you know this is true. You
Learning ArcGIS: Introduction to ArcCatalog 10.1
 Learning ArcGIS: Introduction to ArcCatalog 10.1 Estimated Time: 1 Hour Information systems help us to manage what we know by making it easier to organize, access, manipulate, and apply knowledge to the
A Review: Geographic Information Systems & ArcGIS Basics
 A Review: Geographic Information Systems & ArcGIS Basics Geographic Information Systems Geographic Information Science Why is GIS important and what drives it? Applications of GIS ESRI s ArcGIS: A Review
GEOGRAPHIC INFORMATION SYSTEMS Session 8
 GEOGRAPHIC INFORMATION SYSTEMS Session 8 Introduction Geography underpins all activities associated with a census Census geography is essential to plan and manage fieldwork as well as to report results
ASSESSMENT. Industry Solutions Harness the Power of GIS for Property Assessment
 ASSESSMENT Industry Solutions Harness the Power of GIS for Property Assessment Esri Canada has thousands of customers worldwide who are using the transforming power of GIS technology to collect, maintain,
GIS PORTFOLIO MOHAMED MAGDY MOHAMED HUSSAIN GIS ENGINEER. UWF GIS ONLINE CERTIFICATE GIS Internship (GIS4944)
") 2012 GIS PORTFOLIO MOHAMED MAGDY MOHAMED HUSSAIN GIS ENGINEER UWF GIS ONLINE CERTIFICATE GIS Internship (GIS4944) Portfolio Table of Contents Subject... Page Personal statement/mission/philosophy... 1
2012 GIS PORTFOLIO MOHAMED MAGDY MOHAMED HUSSAIN GIS ENGINEER UWF GIS ONLINE CERTIFICATE GIS Internship (GIS4944) Portfolio Table of Contents Subject... Page Personal statement/mission/philosophy... 1
Abstract. Keywords: Geographic information systems and digital data model. 1. Introduction
 Abstract GISMO - A Geographical Information System for a Municipality Office Ramzi A. Haraty and Youssef O. Kaddoura Lebanese American University P.O. Box 13-5053 Chouran Beirut, Lebanon 1102 2801 Email:
GIS Tutorial: Workbook For ArcView 9.0 By Wilpen Gorr, Kristen Kurland READ ONLINE
 GIS Tutorial: Workbook For ArcView 9.0 By Wilpen Gorr, Kristen Kurland READ ONLINE 8/20/2016 Watch video Get Now http://edigibooks.xyz/?book=1589481275download GIS Tutorial: Workbook for ArcView 9.0 Popular
CAS GE 365 Introduction to Geographical Information Systems. The Applications of GIS are endless
 Spring 2007 CAS GE 365 Introduction to Geographical Information Systems Boston University Department of Geography and Environment The Applications of GIS are endless images from www.esri.com CAS GE 365
GIS Boot Camp for Education June th, 2011 Day 1. Instructor: Sabah Jabbouri Phone: (253) x 4854 Office: TC 136
 x 4854 Office: TC 136") GIS Boot Camp for Education June 27-30 th, 2011 Day 1 Instructor: Sabah Jabbouri Phone: (253) 833-9111 x 4854 Office: TC 136 Email: sjabbouri@greenriver.edu http://www.instruction.greenriver.edu/gis/ Summer
GIS Boot Camp for Education June 27-30 th, 2011 Day 1 Instructor: Sabah Jabbouri Phone: (253) 833-9111 x 4854 Office: TC 136 Email: sjabbouri@greenriver.edu http://www.instruction.greenriver.edu/gis/ Summer
a system for input, storage, manipulation, and output of geographic information. GIS combines software with hardware,
 Introduction to GIS Dr. Pranjit Kr. Sarma Assistant Professor Department of Geography Mangaldi College Mobile: +91 94357 04398 What is a GIS a system for input, storage, manipulation, and output of geographic
Spatial Data Analysis with ArcGIS Desktop: From Basic to Advance
 Spatial Data Analysis with ArcGIS Desktop: From Basic to Advance 1. Course overview Modern environmental, energy as well as resource modeling and planning require huge amount of geographically located
GIS APPLICATIONS IN SOIL SURVEY UPDATES
 GIS APPLICATIONS IN SOIL SURVEY UPDATES ABSTRACT Recent computer hardware and GIS software developments provide new methods that can be used to update existing digital soil surveys. Multi-perspective visualization
GIS: Definition, Software. IAI Summer Institute 19 July 2000
 GIS: Definition, Software IAI Summer Institute 19 July 2000 What is a GIS? Geographic Information System Definitions DeMers (1997): Tools that allow for the processing of spatial data into information,
Task 1: Start ArcMap and add the county boundary data from your downloaded dataset to the data frame.
 Exercise 6 Coordinate Systems and Map Projections The following steps describe the general process that you will follow to complete the exercise. Specific steps will be provided later in the step-by-step
Deutsche Gesellschaft FÜR SÄUGETIERKUNDE 82nd Annual Meeting of the German Society of Mammalogy Vienna, 14 to 18 September 2008
 Deutsche Gesellschaft FÜR SÄUGETIERKUNDE 82nd Annual Meeting of the German Society of Mammalogy Vienna, 14 to 18 September 2008 Abstracts of Oral Communications and Poster Presentations 2 Contents Page
Features and Benefits
 Autodesk LandXplorer Features and Benefits Use the Autodesk LandXplorer software family to help improve decision making, lower costs, view and share changes, and avoid the expense of creating physical
Hydraulic Processes Analysis System (HyPAS)
") Hydraulic Processes Analysis System (HyPAS) by Thad C. Pratt and Daryl S. Cook PURPOSE: This Coastal Engineering Technical Note (CETN) describes a PC-Windows-based system for analyzing, visualizing, and
Hydraulic Processes Analysis System (HyPAS) by Thad C. Pratt and Daryl S. Cook PURPOSE: This Coastal Engineering Technical Note (CETN) describes a PC-Windows-based system for analyzing, visualizing, and
Chapter 1. GIS Fundamentals
 1. GIS Overview Chapter 1. GIS Fundamentals GIS refers to three integrated parts. Geographic: Of the real world; the spatial realities, the geography. Information: Data and information; their meaning and
ISSUES AND APPROACHES TO COUPLING GIS TO AN IRRIGATION DISTRIBUTION NETWORK AND SEEPAGE LOSS MODELS ABSTRACT
 ISSUES AND APPROACHES TO COUPLING GIS TO AN IRRIGATION DISTRIBUTION NETWORK AND SEEPAGE LOSS MODELS Yanbo Huang 1, Milton Henry 2, David Flahive 3, Guy Fipps 4 ABSTRACT Geographic Information Systems (GIS)
Development of a Web-Based GIS Management System for Agricultural Authorities in Iraq
 Development of a Web-Based GIS Management System for Agricultural Authorities in Iraq USCID Water Management Conference Phoenix, Arizona April 18, 2013 Gabriele Bonaiti Extension Program Specialist David
Introduction to Coastal GIS
 Introduction to Coastal GIS Event was held on Tues, 1/8/13 - Thurs, 1/10/13 Time: 9:00 am to 5:00 pm Location: Roger Williams University, Bristol, RI Audience: The intended audiences for this course are
GIS Generalization Dr. Zakaria Yehia Ahmed GIS Consultant Ain Shams University Tel: Mobile:
 GIS Generalization Dr. Zakaria Yehia Ahmed GIS Consultant Ain Shams University Tel: 24534976 Mobile: 01223384254 zyehia2005@yahoo.com Abstract GIS Generalization makes data less-detailed and less-complex
Geographic Systems and Analysis
 Geographic Systems and Analysis New York University Robert F. Wagner Graduate School of Public Service Instructor Stephanie Rosoff Contact: stephanie.rosoff@nyu.edu Office hours: Mondays by appointment
Introduction to GIS I
 Introduction to GIS Introduction How to answer geographical questions such as follows: What is the population of a particular city? What are the characteristics of the soils in a particular land parcel?
1) make sure folks know what s available in terms of geospatial data and resources that could contribute to their decision support toolkits;
 make sure folks know what s available in terms of geospatial data and resources that could contribute to their decision support toolkits;") Introduction 1 2001 It was born out of the recognition that several of the regions prominent resource management agencies have similar, if not shared, requirements for GIS data. Some of the underlying
Introduction 1 2001 It was born out of the recognition that several of the regions prominent resource management agencies have similar, if not shared, requirements for GIS data. Some of the underlying
Lecture 1 Introduction to GIS. Dr. Zhang Spring, 2017
 Lecture 1 Introduction to GIS Dr. Zhang Spring, 2017 Topics of the course Using and making maps Navigating GIS Map design Working with spatial data Geoprocessing Spatial data infrastructure Digitizing
A Comprehensive Inventory of the Number of Modified Stream Channels in the State of Minnesota. Data, Information and Knowledge Management.
 A Comprehensive Inventory of the Number of Modified Stream Channels in the State of Minnesota Data, Information and Knowledge Management Glenn Skuta Environmental Analysis and Outcomes Division Minnesota
Grizzly Bears and GIS. The conservation of grizzly bears and their habitat was recognized as an important land use objective
 Grizzly Bears and GIS Introduction: The conservation of grizzly bears and their habitat was recognized as an important land use objective in the Robson Valley LRMP. The LRMP recommended retention of unharvested
Improvement of the National Hydrography Dataset for US Forest Service Region 3 in Cooperation with the National Forest Service
 Improvement of the National Hydrography Dataset for US Forest Service Region 3 in Cooperation with the National Forest Service Christian L. DeCasas California State University, Northridge November 7 th,
Personal Field Data Collection by UM-FieldGIS (Integration of Google Map API to Mobile GIS)
") Personal Field Data Collection by UM-FieldGIS (Integration of Google Map API to Mobile GIS) Ko Ko Lwin*. Yuji MURAYAMA* *Division of Spatial Information Science Graduate School of Life and Environmental
Personal Field Data Collection by UM-FieldGIS (Integration of Google Map API to Mobile GIS) Ko Ko Lwin*. Yuji MURAYAMA* *Division of Spatial Information Science Graduate School of Life and Environmental
A BASE SYSTEM FOR MICRO TRAFFIC SIMULATION USING THE GEOGRAPHICAL INFORMATION DATABASE
 A BASE SYSTEM FOR MICRO TRAFFIC SIMULATION USING THE GEOGRAPHICAL INFORMATION DATABASE Yan LI Ritsumeikan Asia Pacific University E-mail: yanli@apu.ac.jp 1 INTRODUCTION In the recent years, with the rapid
When Map Quality Matters
 When Map Quality Matters 50% 25% Powerful geospatial mapping tools for Adobe Creative Cloud and offline map solutions for mobile devices 20% When Map Quality Matters 10% We re focused on creating powerful
USING GIS IN WATER SUPPLY AND SEWER MODELLING AND MANAGEMENT
 USING GIS IN WATER SUPPLY AND SEWER MODELLING AND MANAGEMENT HENRIETTE TAMAŠAUSKAS*, L.C. LARSEN, O. MARK DHI Water and Environment, Agern Allé 5 2970 Hørsholm, Denmark *Corresponding author, e-mail: htt@dhigroup.com
M.Y. Pior Faculty of Real Estate Science, University of Meikai, JAPAN
 GEOGRAPHIC INFORMATION SYSTEM M.Y. Pior Faculty of Real Estate Science, University of Meikai, JAPAN Keywords: GIS, rasterbased model, vectorbased model, layer, attribute, topology, spatial analysis. Contents
Spatial Effects on Current and Future Climate of Ipomopsis aggregata Populations in Colorado Patterns of Precipitation and Maximum Temperature
 A. Kenney GIS Project Spring 2010 Amanda Kenney GEO 386 Spring 2010 Spatial Effects on Current and Future Climate of Ipomopsis aggregata Populations in Colorado Patterns of Precipitation and Maximum Temperature
Syllabus Reminders. Geographic Information Systems. Components of GIS. Lecture 1 Outline. Lecture 1 Introduction to Geographic Information Systems
 Syllabus Reminders Geographic Information s Lecture Introduction to Geographic Information s. Class Info: www.saigis.com/class/ 2. Office T / TH (8:00-9:30 a.m.) and (2:30 3:30pm) or Appt 3. Email: burgerpr@unk.edu
GIS Software. Evolution of GIS Software
 GIS Software The geoprocessing engines of GIS Major functions Collect, store, mange, query, analyze and present Key terms Program collections of instructions to manipulate data Package integrated collection
Managing Grizzly Bear Data. ESRI 2009 International User Conference, San Diego, California Presented by: Julie Duval, July 15, 2009
 Managing Grizzly Bear Data ESRI 2009 International User Conference, San Diego, California Presented by: Julie Duval, July 15, 2009 Agenda 1) Overview of the Foothills Research Institute 2) Grizzly Bear
ArcGIS & Extensions - Synergy of GIS tools. Synergy. Analyze & Visualize
 Using ArcGIS Extensions to Analyze and Visualize data Colin Childs 1 Topics Objectives Synergy Analysis & Visualization ArcGIS Analysis environments Geoprocessing tools Extensions ArcMap The analysis Process