Deutsche Gesellschaft FÜR SÄUGETIERKUNDE 82nd Annual Meeting of the German Society of Mammalogy Vienna, 14 to 18 September 2008
|
|
|
- Isaac Malone
- 6 years ago
- Views:
Transcription
1


2 Deutsche Gesellschaft FÜR SÄUGETIERKUNDE 82nd Annual Meeting of the German Society of Mammalogy Vienna, 14 to 18 September 2008 Abstracts of Oral Communications and Poster Presentations
3 2 Contents Page Preface 3 Abstracts of Oral Communications and Poster Presentations 4 Author index 46 Editor: H. Ansorge, A. Wo hrmann-repenning, and K. Hackla nder Editorial office: H. Ansorge, Wo hrmann-repenning, M. Zohmann, and F. Suchentrunk Photo: Juvenile European hares/lepus europaeus kursiv (Ingo Arndt) The guest editors, the editor and the managing editor of the journal Mammalian Biology are not responsible for the content published in this special issue of Mammalian Biology. Elsevier GmbH, Office Jena, P.O. Box , Jena, Germany
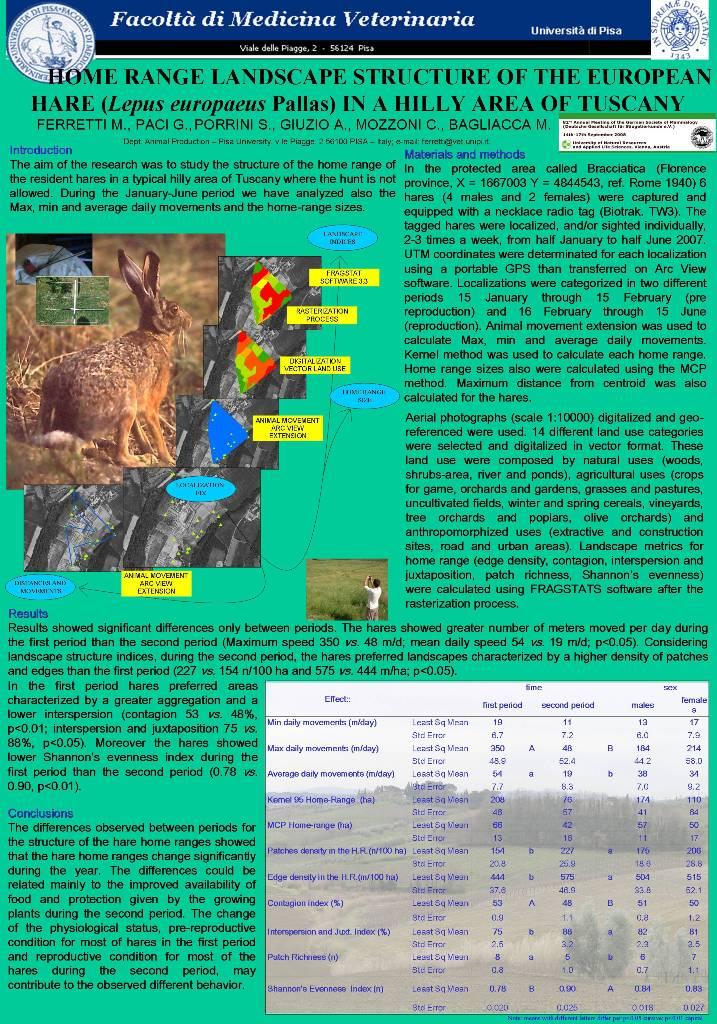
4 ARTICLE IN PRESS Abstracts / Mamm. biol. 73 (2008) The trial was carried out in the typical hilly landscape of central Italy (Florence province, X ¼ Y ¼ , ref. Rome, 1940). During the capture operations for the translocation, 20 hares were captured and equipped with a necklace radio tag (Biotrak, TW3): 6 hares (4 males and 2 females) were immediately released in the same non-hunting area where they had been captured and 14 hares (7 males and 7 females) were translocated in a neighbouring hunting territory. The tagged hares were localized, and/or sighted individually, 2-3 times a week, from mid January to mid June, UTM coordinates were determinated for each localization using a portable GPS and then transferred on Arc View software. Animal movement extension was used to calculate Max, min and average daily movements. Kernel method was used to calculate each home range. Home range sizes also were calculated using the MCP method. Maximum distance from the releasing sites and maximum distance from centroid were also calculated for translocated hares and resident hares, respectively. Aerial photographs (scale 1:10000) geo-referenced and digitalized were used. 14 different land use categories were selected and digitalized in a vector format. These land use were composed by natural uses (woods, shrubsarea, river and ponds), agricultural uses (crops for game, orchards and gardens, grasses and pastures, uncultivated fields, winter and spring cereals, vineyards, tree orchards and poplars, olive orchards) and anthropomorphized uses (extractive and construction sites, road and urban areas). Landscape metrics for home range (patch density, edge density, fractal dimension, contagion) were calculated using FRAGSTATS software after rasterization process. Results showed that the Max distance from the releasing sites in the translocated hares was significantly greater than the maximum distance from centroid in the resident hares (simple ¼ radius, or doubled ¼ diameter), (1.281 vs. 368 or 736 m, po0.05). Home range sizes also differed between translocated and resident hares (Kernel 173 vs. 23 ha and MCP 63 vs. 9 ha po0.05). Considering landscape structure indices, the translocated hares preferred landscape characterized by a lower density of patches and edges than the resident s (70 vs. 152 n/100 ha and 258 vs. 448 m/ha, po0.01). Moreover translocated hares preferred areas characterized by greater aggregation and a lower path shape complexity than resident s (contagion index: 61 vs. 54%; fractal dimension index: 1.11 vs 1.12, po0.01). Either the home range sizes or the maximum distance from the releasing sites suggest that the translocated hares must be however released in suited habitats or the animal will move from their releasing point searching better habitats. The increased travels increase the risk to be killed by vehicles when crossing roads. Home range landscape structure of European hares (Lepus europaeus Pallas) in a hilly area of Tuscany M. FERRETTI, G. PACI, S. PORRINI, A. GIUZIO, C. MOZZONI, M. BAGLIACCA, Dept. Animal Production, Pisa University, v.le Piagge, Pisa, Italy; ferretti@vet.unipi.it The aim of the research was to study the structure of the home range of the hares in a typical hilly area of Tuscany where the hunt is not allowed. In the protected area called Bracciatica (Florence province, X ¼ Y ¼ , ref. Rome, 1940) 6 hares (4 males and 2 females) were captured, and equipped with a necklace radio tag (Biotrak, TW3). The tagged hares were localized, and/or sighted individually, 2-3 times a week, from mid January to mid June, UTM coordinates were determinated for each localization using a portable GPS and then transferred on Arc View software. Localizations were categorized into two different periods 15 January through 15 February (pre reproduction) and 16 February through 15 June (reproduction). Animal movement extension was used to calculate Max, min and average daily movements. Kernel method was used to calculate each home range. Home range sizes also were calculated using the MCP method. Maximum distance from centroid was also calculated for the hares. Aerial photographs (scale 1:10000) geo-referenced and digitalized were used. 14 different land use categories were selected and digitalized in vector format. These land use were composed by natural uses (woods, shrubs-area, river and ponds), agricultural uses (crops for game, orchards and gardens, grasses and pastures, uncultivated fields, winter and spring cereals, vineyards, tree orchards and poplars, olive orchards) and anthropomorphized uses (extractive and construction sites, road and urban areas). Landscape metrics for home range (edge density, contagion, interspersion and juxtaposition, patch richness, Shannon s evenness) were calculated using FRAGSTATS software after rasterization process. Results showed significant differences only between periods. The hares showed greater number of meters moved per day during the first period than the second period (Maximum speed 350 vs. 48 m/d; mean daily speed 54 vs. 19 m/d; po0.05). Considering landscape structure indices, during the second period, the hares preferred landscapes characterized by a higher density of patches and edges than the first period (227 vs. 154 n/ 100 ha and 575 vs. 444 m/ha, po0.05). In the first period hares preferred areas characterized by a greater aggregation and a lower interspersion (contagion 53 vs. 48%; interspersion and juxtaposition 75 vs. 88%; po0.01). Moreover the hares showed lower Shannon s evenness index during the first period than the second period (0.78 vs. 0.90, po0.01; po0.05).
5 14 ARTICLE IN PRESS Abstracts / Mamm. biol. 73 (2008) 4 45 The differences observed between periods for the structure of the hare home range showed that the hare home ranges change significantly during the year. The differences could be related mainly to the improved availability of food and protection given by the growing plants during the second period, even if the change of the physiological status, pre reproductive condition for most of hares in the first period and reproductive condition for most of hares during the second period, could affect the home range selection. Using spatial Bayesian methods to define management units in a continuous population of Wild boar (Sus scrofa): clusters or isolation-by-distance? A. C. FRANTZ, Department of Animal & Plant Sciences, University of Sheffield, Western Bank, Sheffield S10 2TN, United Kingdom, alainfrantz@yahoo.co.uk Recently developed spatially explicit Bayesian methods offer a powerful tool for ecology and wildlife management, as genetic divisions can be correlated with landscape features. However, there is uncertainty about possible biases associated with the various methodologies. An issue of particular concern is the overestimation of genetic clustering due to deviations from random mating that are not caused by genetic discontinuities, such as isolation-by-distance. I aimed to analyse the genetic structure of European wild boar (Sus scrofa) ina spatial Bayesian framework using programs BAPS and GENELAND. My objective was to identify geographical barriers to gene flow that might be useful for delimiting management units in case of outbreaks of classical swine fever. The programs did not converge on the same clustering solution and some clusters were difficult to explain biologically. Therefore we simulated genetic data with an isolation-by-distance pattern and found that the Bayesian programs could wrongly superimpose clusters on these datasets. Simulated barriers were identified correctly, but the programs superimposed further clusters at higher levels of isolation-by-distance. As the empirical data were characterised by isolationby-distance, it was not possible to come to a definite conclusion as to whether the empirical clusters inferred using the various methods were an accurate reflection of population genetic structure in the study area, or whether they were artefacts. Play behaviour in immature gelada (Theropithecus gelada): the significance of age and sex M. FRUHMANN, C. FRANZ, Karl-Franzens-University Graz, Department of Zoology, Universita tsplatz 2, A-8010 Graz, Austria, marionfruhmann@gmx.at Play is considered as a pivotal behaviour in juvenile development of primates for the acquisition of social skills in a relaxed and relatively safe environment. To benefit the individual as a kind of training for adult life it will differ according to the requirements needed. This assumption was investigated among Gelada baboons (Theropithecus gelada) a species living in one-male units with extreme sexual dimorphism. Males are twice the size of females indicating that fighting ability is essential for their reproductive success. They disperse as adolescents and try to take over a female group in adulthood. Accordingly, immature male baboons should spend much more time with rough play-fights than immature females. By contrast, female geladas remain in their natal groups and maintain strong bonds with their matrilineal relatives. Therefore immature females are expected to spend more time with care and bonding behaviour than immature males. Additionally, for both sexes stimulation thresholds should vary as the need for security decreases while the need for exploration increases with age. These predictions were tested and confirmed within a gelada group at the zoo Tierwelt Herberstein, Austria, containing two adult males, three adult females and six immatures with a balanced sex and age ratio. Generally, juvenile males spent more time with social play than females did. Females preferred non-contact play such as play-chases whereas males preferred playfights and choose their play partners accordingly. Each immature female invested more time in care and bonding behaviour measured as active social grooming than its male peer of similar age class. In both sexes, active social grooming increased with increasing age, at the same time social play behaviour decreased. These data support the notion that play serves to develop sex specific social skills. The impact of road traffic (Brno-Vienna) on a bat community J. GAISLER, Z. Rˇ EHA` K, D. T. BARTONICˇKA, Institute of Botany and Zoology, Masaryk University, CZ Brno, Czech Republic Roads and highways have a negative effect on the life of bats both when constructed and afterwards due to the traffic. During the construction there is a direct loss of habitats, when in operation, commuting and foraging bats continue to be killed by night traffic. The present study is dealing with the impact of the existing main road E461 Brno-Vienna on bat mortality, with the prognosis of this impact after road reconstruction and extension into a speed-way R52, and with recommendations to decrease the risk of bats being killed. Two sections of the road, Ivan-Perna (4.5 km) and Pohorelice-Ivan (3.5 km) were selected where (1) all published as well as unpublished records of bats in a 2 km wide belt were collected; (2) bat cadavers were picked from
6
Research Article Appennino: A GIS Tool for Analyzing Wildlife Habitat Use
 Zoology Volume 2012, Article ID 475071, 5 pages doi:10.1155/2012/475071 Research Article Appennino: A GIS Tool for Analyzing Wildlife Habitat Use Marco Ferretti, 1 Marco Foi, 2 Gisella Paci, 1 Walter Tosi,
Chapter 44. Table of Contents. Section 1 Development of Behavior. Section 2 Types of Animal Behavior. Animal Behavior
 Animal Behavior Table of Contents Section 1 Development of Behavior Section 2 Types of Animal Behavior Section 1 Development of Behavior Objectives Identify four questions asked by biologists who study
Do animals play and is there a benefit from play? Do animals play, and if so, how? Is there a benefit to play behavior? How
 Kieffer 1 Do animals play and is there a benefit from play? Do animals play, and if so, how? Is there a benefit to play behavior? How could play behavior have evolved? Several investigators have looked
PROGRESS REPORT for COOPERATIVE BOBCAT RESEARCH PROJECT. Period Covered: 1 January 31 May Prepared by
 PROGRESS REPORT for COOPERATIVE BOBCAT RESEARCH PROJECT Period Covered: 1 January 31 May 2011 Prepared by John A. Litvaitis, Derek Broman, and Marian K. Litvaitis Department of Natural Resources University
IUCN Red List Process. Cormack Gates Keith Aune
 IUCN Red List Process Cormack Gates Keith Aune The IUCN Red List Categories and Criteria have several specific aims to provide a system that can be applied consistently by different people; to improve
WEBINAR AGENDA. Review of connectivity mapping progress to date. Describe draft methodology for delineating and validating core areas
 WEBINAR AGENDA Review of connectivity mapping progress to date Describe draft methodology for delineating and validating core areas Review examples of the methodology implemented in the Highlands Explain
Grant Opportunity Monitoring Bi-State Sage-grouse Populations in Nevada
 Grant Opportunity Monitoring Bi-State Sage-grouse Populations in Nevada Proposals are due no later than November 13, 2015. Grant proposal and any questions should be directed to: Shawn Espinosa @ sepsinosa@ndow.org.
Comparing male densities and fertilization rates as potential Allee effects in Alaskan and Canadian Ursus maritimus populations
 Comparing male densities and fertilization rates as potential Allee effects in Alaskan and Canadian Ursus maritimus populations Introduction Research suggests that our world today is in the midst of a
Resolving habitat classification and structure using aerial photography. Michael Wilson Center for Conservation Biology College of William and Mary
 Resolving habitat classification and structure using aerial photography Michael Wilson Center for Conservation Biology College of William and Mary Aerial Photo-interpretation Digitizing features of aerial
Lecture 2: Individual-based Modelling
 Lecture 2: Individual-based Modelling Part I Steve Railsback Humboldt State University Department of Mathematics & Lang, Railsback & Associates Arcata, California USA www.langrailsback.com 1 Outline 1.
Population Ecology. Study of populations in relation to the environment. Increase population size= endangered species
 Population Basics Population Ecology Study of populations in relation to the environment Purpose: Increase population size= endangered species Decrease population size = pests, invasive species Maintain
Moose Day Summary Report 8th Annual February 27th, 2016
 Moose Day Summary Report 8th Annual February 27th, 2016 Photo taken by Kathy McCurdy. Moose Day 2016 Prepared by: Paul Hood and Alyson Courtemanch Jackson Hole Wildlife Foundation Nature Mapping Jackson
Non-commercial use only
 Italian Journal of Animal Science 2010; volume 9:e54 PAPER Habitat use and home range traits of resident and relocated hares (Lepus europaeus, Pallas) Marco Ferretti, 1 Gisella Paci, 1 Stefania Porrini,
III Introduction to Populations III Introduction to Populations A. Definitions A population is (Krebs 2001:116) a group of organisms same species
 a group of organisms same species") III Introduction to s III Introduction to s A. Definitions B. characteristics, processes, and environment C. Uses of dynamics D. Limits of a A. Definitions What is a? A is (Krebs 2001:116) a group of organisms
III Introduction to s III Introduction to s A. Definitions B. characteristics, processes, and environment C. Uses of dynamics D. Limits of a A. Definitions What is a? A is (Krebs 2001:116) a group of organisms
Florida Friendly Landscapes?
 Florida Friendly Landscapes? Backyards as Habitats Ecology Concepts Ecosystem interacting network of living and non-living components Community association of different species living and interacting in
Comparing CORINE Land Cover with a more detailed database in Arezzo (Italy).
.") Comparing CORINE Land Cover with a more detailed database in Arezzo (Italy). Javier Gallego JRC, I-21020 Ispra (Varese) ITALY e-mail: javier.gallego@jrc.it Keywords: land cover, accuracy assessment, area
Comparing CORINE Land Cover with a more detailed database in Arezzo (Italy). Javier Gallego JRC, I-21020 Ispra (Varese) ITALY e-mail: javier.gallego@jrc.it Keywords: land cover, accuracy assessment, area
2009 WMU 525 Moose. Section Authors: Nathan Carruthers and Dave Moyles
 2009 WMU 525 Moose Section Authors: Nathan Carruthers and Dave Moyles Suggested Citation: Carruthers, N. and D. Moyles. WMU 525 Moose. Pages 78 83. In: N. Webb and R. Anderson. Delegated aerial ungulate
The Impact of Human Disturbance on Reticulated Giraffe Populations on Group Ranches and Conservancies
 The Impact of Human Disturbance on Reticulated Giraffe Populations on Group Ranches and Conservancies Dawn Wells, Michael Spiotta, Vincent Ontita, Jennifer Schieltz, Paula Kahumbu, Daniel I. Rubenstein
GIS Workshop Data Collection Techniques
 GIS Workshop Data Collection Techniques NOFNEC Conference 2016 Presented by: Matawa First Nations Management Jennifer Duncan and Charlene Wagenaar, Geomatics Technicians, Four Rivers Department QA #: FRG
Describing Greater sage-grouse (Centrocercus urophasianus) Nesting Habitat at Multiple Spatial Scales in Southeastern Oregon
 Nesting Habitat at Multiple Spatial Scales in Southeastern Oregon") Describing Greater sage-grouse (Centrocercus urophasianus) Nesting Habitat at Multiple Spatial Scales in Southeastern Oregon Steven Petersen, Richard Miller, Andrew Yost, and Michael Gregg SUMMARY Plant
Describing Greater sage-grouse (Centrocercus urophasianus) Nesting Habitat at Multiple Spatial Scales in Southeastern Oregon Steven Petersen, Richard Miller, Andrew Yost, and Michael Gregg SUMMARY Plant
Wisconsin River Floodplain Project: Overview and Plot Metadata
 Wisconsin River Floodplain Project: Overview and Plot Metadata CLASS I. DATA SET DESCRIPTORS Data set identity: Plot-level variable information for Wisconsin River Floodplain Project. Relevant for following
Key elements An open-ended questionnaire can be used (see Quinn 2001).
.") Tool Name: Risk Indexing What is it? Risk indexing is a systematic approach to identify, classify, and order sources of risk and to examine differences in risk perception. What can it be used assessing
Tool Name: Risk Indexing What is it? Risk indexing is a systematic approach to identify, classify, and order sources of risk and to examine differences in risk perception. What can it be used assessing
The Appennino Tool: a GIS-Tool for the analysis of wildlife habitat selection
 The Appennino Tool: a GIS-Tool for the analysis of wildlife habitat selection INTRODUCTION Wildlife management studies identify the resources (e.g. food items or habitats) used by animals and document
Lecture 8 Insect ecology and balance of life
 Lecture 8 Insect ecology and balance of life Ecology: The term ecology is derived from the Greek term oikos meaning house combined with logy meaning the science of or the study of. Thus literally ecology
Assessment Schedule 2016 Biology: Demonstrate understanding of the responses of plants and animals to their external environment (91603)
") NCEA Level 3 Biology (91603) 2016 page 1 of 6 Assessment Schedule 2016 Biology: Demonstrate understanding of the responses of plants and animals to their external environment (91603) Evidence Statement
NCEA Level 3 Biology (91603) 2016 page 1 of 6 Assessment Schedule 2016 Biology: Demonstrate understanding of the responses of plants and animals to their external environment (91603) Evidence Statement
Relationship between weather factors and survival of mule deer fawns in the Peace Region of British Columbia
 P E A C E R E G I O N T E C H N I C A L R E P O R T Relationship between weather factors and survival of mule deer fawns in the Peace Region of British Columbia by: Nick Baccante and Robert B. Woods Fish
Levels of Ecological Organization. Biotic and Abiotic Factors. Studying Ecology. Chapter 4 Population Ecology
 Chapter 4 Population Ecology Lesson 4.1 Studying Ecology Levels of Ecological Organization Biotic and Abiotic Factors The study of how organisms interact with each other and with their environments Scientists
Chapter 4 Population Ecology
 Chapter 4 Population Ecology Lesson 4.1 Studying Ecology Levels of Ecological Organization The study of how organisms interact with each other and with their environments Scientists study ecology at various
A Comprehensive Inventory of the Number of Modified Stream Channels in the State of Minnesota. Data, Information and Knowledge Management.
 A Comprehensive Inventory of the Number of Modified Stream Channels in the State of Minnesota Data, Information and Knowledge Management Glenn Skuta Environmental Analysis and Outcomes Division Minnesota
Home Range Size and Body Size
 Feb 11, 13 Home Range Size and Body Size Introduction Home range is the area normally traversed by an individual animal or group of animals during activities associated with feeding, resting, reproduction,
Wetland Mapping. Wetland Mapping in the United States. State Wetland Losses 53% in Lower US. Matthew J. Gray University of Tennessee
 Wetland Mapping Caribbean Matthew J. Gray University of Tennessee Wetland Mapping in the United States Shaw and Fredine (1956) National Wetlands Inventory U.S. Fish and Wildlife Service is the principle
Most people used to live like this
 Urbanization Most people used to live like this Increasingly people live like this. For the first time in history, there are now more urban residents than rural residents. Land Cover & Land Use Land cover
Wildlife and Traffic in the Carpathians
 Wildlife and Traffic in the Carpathians How to solve the problem between green and gray infrastructure Václav Hlaváč TRANSGREEN Kick-off Meeting Vienna, 28 February 2 March 2017 Nature Conservation Agency
FOREST FIRE HAZARD MODEL DEFINITION FOR LOCAL LAND USE (TUSCANY REGION)
") FOREST FIRE HAZARD MODEL DEFINITION FOR LOCAL LAND USE (TUSCANY REGION) C. Conese 3, L. Bonora 1, M. Romani 1, E. Checcacci 1 and E. Tesi 2 1 National Research Council - Institute of Biometeorology (CNR-
FOREST FIRE HAZARD MODEL DEFINITION FOR LOCAL LAND USE (TUSCANY REGION) C. Conese 3, L. Bonora 1, M. Romani 1, E. Checcacci 1 and E. Tesi 2 1 National Research Council - Institute of Biometeorology (CNR-
Supplementary material: Methodological annex
 1 Supplementary material: Methodological annex Correcting the spatial representation bias: the grid sample approach Our land-use time series used non-ideal data sources, which differed in spatial and thematic
Ski touring and fauna: which interactions?
 Ski touring and fauna: which interactions? Antoine DUPARC Workshop "Wildlife and winter sport activities" Lescheraines March 4th 2016 Increase of interaction human/fauna Increase of human activities all
Agent-Based Modeling in ArcGIS. Kevin M. Johnston
 Agent-Based Modeling in ArcGIS Kevin M. Johnston The problem Have a phenomenon that changes with time and space Want to model time and space explicitly not as a snap shot Want to model the interactions
Aerial Survey of Coffee Estates
 Aerial Survey of Coffee Estates Why get an Aerial Survey of your Coffee Estate done? Aerial surveying produces high resolution and highly accurate image data about your coffee estate. This data can be
Sampling. Where we re heading: Last time. What is the sample? Next week: Lecture Monday. **Lab Tuesday leaving at 11:00 instead of 1:00** Tomorrow:
 Sampling Questions Define: Sampling, statistical inference, statistical vs. biological population, accuracy, precision, bias, random sampling Why do people use sampling techniques in monitoring? How do
College of Agriculture, Forestry and Life Sciences. PES 4910 Senior Honors Research (3) 4920 Senior Honors Research (3)
 4920 Senior Honors Research (3)") College of Agriculture, Forestry and Life Sciences Agriculture Other For majors in Agricultural Education; Agricultural Mechanization and Business; Animal and Veterinary Sciences; Applied Economics and
College of Agriculture, Forestry and Life Sciences Agriculture Other For majors in Agricultural Education; Agricultural Mechanization and Business; Animal and Veterinary Sciences; Applied Economics and
Curriculum Links AS and A level Field Studies
 Equipment Includes Human Geography Coastal Management Students examine the conflicts that arise from coastal erosion and the options for coastal management. They investigate different types of coastal
Geographic Information Systems, Remote Sensing, and Biodiversity. Mandi Caudill
 Geographic Information Systems, Remote Sensing, and Biodiversity Mandi Caudill Habitat loss and fragmentation are the lead causes attributed to biodiversity loss. Geographic information systems (GIS) and
Ontario Science Curriculum Grade 9 Academic
 Grade 9 Academic Use this title as a reference tool. SCIENCE Reproduction describe cell division, including mitosis, as part of the cell cycle, including the roles of the nucleus, cell membrane, and organelles
REVISION: POPULATION ECOLOGY 18 SEPTEMBER 2013
 REVISION: POPULATION ECOLOGY 18 SEPTEMBER 2013 Lesson Description In this lesson we: Revise population ecology by working through some exam questions. Key Concepts Definition of Population A population
Spatial Graph Theory for Cross-scale Connectivity Analysis
 Spatial Graph Theory for Cross-scale Connectivity Analysis Andrew Fall School of Resource and Environmental Management, SFU and Gowlland Technologies Ltd., Victoria, BC Acknowledgements Marie-Josée Fortin,
Priority areas for grizzly bear conservation in western North America: an analysis of habitat and population viability INTRODUCTION METHODS
 Priority areas for grizzly bear conservation in western North America: an analysis of habitat and population viability. Carroll, C. 2005. Klamath Center for Conservation Research, Orleans, CA. Revised
Unsuspicious immigrant or ecological threat:
 Unsuspicious immigrant or ecological threat: a long-term fieldwork study on the introduced raccoon in Germany R.Vitt Outline raccoon settlement and current situation in Germany applied research on raccoons:
BIOS 230 Landscape Ecology. Lecture #32
 BIOS 230 Landscape Ecology Lecture #32 What is a Landscape? One definition: A large area, based on intuitive human scales and traditional geographical studies 10s of hectares to 100s of kilometers 2 (1
Evaluating Wildlife Habitats
 Lesson C5 4 Evaluating Wildlife Habitats Unit C. Animal Wildlife Management Problem Area 5. Game Animals Management Lesson 4. Evaluating Wildlife Habitats New Mexico Content Standard: Pathway Strand: Natural
RESEARCH METHODOLOGY
 III. RESEARCH METHODOLOGY 3.1. Time and Research Area The field work was taken place in primary forest around Toro village in Lore Lindu National Park, Indonesia. The study area located in 120 o 2 53 120
Unit 1, Lesson 2. What is geographic inquiry?
 What is geographic inquiry? Unit 1, Lesson 2 Understanding the way in which social scientists investigate problems will help you conduct your own investigations about problems or issues facing your community
Social Studies Grade 2 - Building a Society
 Social Studies Grade 2 - Building a Society Description The second grade curriculum provides students with a broad view of the political units around them, specifically their town, state, and country.
ASSESSING SEXUAL SEGREGATION IN DEER
 ASSESSING SEXUAL SEGREGATION IN DEER R. TERRY BOWYER, 1 Institute of Arctic Biology, and Department of Biology and Wildlife, University of Alaska, Fairbanks, KELLEY M. STEWART, Institute of Arctic Biology,
The Combination of Geospatial Data with Statistical Data for SDG Indicators
 Session x: Sustainable Development Goals, SDG indicators The Combination of Geospatial Data with Statistical Data for SDG Indicators Pier-Giorgio Zaccheddu Fabio Volpe 5-8 December2018, Nairobi IAEG SDG
The reproductive success of an organism depends in part on the ability of the organism to survive.
 The reproductive success of an organism depends in part on the ability of the organism to survive. How does the physical appearance of these organisms help them survive? A. Their physical appearance helps
Newsletter Spring 2016
 Newsletter Spring 2016 April and May There was great changes about hide area ownership, previously the hide area was on rent for the company, but in January 2016 Wild Brown Bear bought the hide area and
OCR (A) Biology A-level
 Biology A-level") OCR (A) Biology A-level Topic 4.2: Biodiversity Notes Biodiversity is the variety of living organisms, over time the variety of life on Earth has become more extensive but now it is being threatened by
OCR (A) Biology A-level Topic 4.2: Biodiversity Notes Biodiversity is the variety of living organisms, over time the variety of life on Earth has become more extensive but now it is being threatened by
Science Unit Learning Summary
 Learning Summary Inheritance, variation and evolution Content Sexual and asexual reproduction. Meiosis leads to non-identical cells being formed while mitosis leads to identical cells being formed. In
Spatial ecology of coyotes in the Denver metropolitan area: influence of the urban matrix
 Journal of Mammalogy, 97(5):1414 1427, 2016 DOI:10.1093/jmammal/gyw090 Published online May 28, 2016 Spatial ecology of coyotes in the Denver metropolitan area: influence of the urban matrix Sharon A.
What is behavior? What questions can we ask? Why study behavior? Evolutionary perspective. Innate behaviors 4/8/2016.
 What is behavior? Animal Behavior Behavior everything an animal does & how it does it response to stimuli in its environment Innate (instinct) inherited automatic & consistent learned ability to learn
LAB EXERCISE #2 Quantifying Patch Mosaics
 LAB EXERCISE #2 Quantifying Patch Mosaics Instructors: K. McGarigal Overview: In this exercise, you will learn to appreciate the challenges of quantifying patch mosaics and gain practical hands-on experience
Michigan Curriculum Framework
 Elementary Reference Content Standards Wetlands (with teacher Rainforest (with teacher 1. All students will apply an understanding of cells to the functioning of multicellular organisms; and explain how
BUILDING AN ASSET MANAGEMENT GEODATABASE FOR RANCHING. Matt Crawford, GISP
 BUILDING AN ASSET MANAGEMENT GEODATABASE FOR RANCHING Matt Crawford, GISP Introduction East Foundation Formed in 2007 Mission Research Education Outreach Properties Six ranches ~ 215,000 acres San Antonio
Agent-Based Modeling in ArcGIS
 Agent-Based Modeling in ArcGIS Kevin M. Johnston Esri UC 2014 Demo Theater The problem Have a phenomenon that changes with time and space Want to model time and space explicitly not as a snap shot Want
The Problem of Where to Live
 April 5: Habitat Selection: Intro The Problem of Where to Live Physical and biotic environment critically affects fitness An animal's needs may be met only in certain habitats, which should select for
Lesson Nine Population Problems. Key question How does growth of Florida s human population affect bear populations?
 Lesson Nine Population Problems Key question How does growth of Florida s human population affect bear populations? Conceptual frameworks topics IV.C. Florida black bear seasonal activities and movements
A Small Migrating Herd. Mapping Wildlife Distribution 1. Mapping Wildlife Distribution 2. Conservation & Reserve Management
 A Basic Introduction to Wildlife Mapping & Modeling ~~~~~~~~~~ Rev. Ronald J. Wasowski, C.S.C. Associate Professor of Environmental Science University of Portland Portland, Oregon 8 December 2015 Introduction
Institute. Dr. Jon Aars, Norwegian Polar. Institute. Jon Aars, NPI
 Research on polar Tracking bears the at Polar Norwegian Bear Polar Institute Dr. Jon Aars, Norwegian Polar Institute Jon Aars, NPI What are Norwegian Polar Institutes (NPI) mandates? We are asked by our
Syllabus Reminders. Geographic Information Systems. Components of GIS. Lecture 1 Outline. Lecture 1 Introduction to Geographic Information Systems
 Syllabus Reminders Geographic Information s Lecture Introduction to Geographic Information s. Class Info: www.saigis.com/class/ 2. Office T / TH (8:00-9:30 a.m.) and (2:30 3:30pm) or Appt 3. Email: burgerpr@unk.edu
Cripps Ranch 76+/- Acres Orchard Development Opportunity Dixon, CA. Presented By:
 Cripps Ranch 76+/- Acres Orchard Development Opportunity Dixon, CA Presented By: Cripps Ranch 76+/- Acres Orchard Development Opportunity Dixon, CA Location: This property is located at 5663 Dally Road
Lecture 2 Biology 5865 Conservation Biology
 Lecture 2 Biology 5865 Conservation Biology What is Biological Diversity? Chapter 2 spend additional time on this chapter if you have not had ecology Generally know the meaning and use of terms in bold
Environmental signals
 Environmental signals Why are environmental signals rare? Pp 632-635 Resource recruitment signals Costs and benefits Vertebrates and social insects Predator detection signals Types Patterns of usage Intertrophic
APPENDIX. Normalized Difference Vegetation Index (NDVI) from MODIS data
 from MODIS data") APPENDIX Land-use/land-cover composition of Apulia region Overall, more than 82% of Apulia contains agro-ecosystems (Figure ). The northern and somewhat the central part of the region include arable lands
APPENDIX Land-use/land-cover composition of Apulia region Overall, more than 82% of Apulia contains agro-ecosystems (Figure ). The northern and somewhat the central part of the region include arable lands
GIS and the Built Environment
 GIS and the Built Environment GIS Workshop Active Living Research Conference February 9, 2010 Anne Vernez Moudon, Dr. es Sc. University of Washington Chanam Lee, Ph.D., Texas A&M University OBJECTIVES
2010 Wildlife Management Unit 347 moose
 2010 Wildlife Management Unit 347 moose Photo: Curtis Stambaugh Section Authors: Curtis Stambaugh and Corey Rasmussen Stambaugh, C., and C. Rasmussen. 2012. Wildlife Management Unit 347 moose. Pages 54-57.
Road-based Landscape Metrics for Quantifying Habitat Fragmentation
 University of South Florida Scholar Commons Graduate Theses and Dissertations Graduate School 2011 Road-based Landscape Metrics for Quantifying Habitat Fragmentation Rebecca Whitehead Loraamm University
Geostatistical Modeling of Primary and Secondary Automobile Traffic Volume as Ecological Disturbance Proxy Across the Contiguous United States
 Geostatistical Modeling of Primary and Secondary Automobile Traffic Volume as Ecological Disturbance Proxy Across the Contiguous United States Sean L. McFall 1, Matthias Leu 2, Benoit Parmentier 3, Marco
GEOGRAPHIC INFORMATION SYSTEMS
 GEOGRAPHIC INFORMATION SYSTEMS 4-H Round-Up Community Transitions Workshop Daniel Hanselka June 14, 2011 Goals of the Workshop Answer the question: What is GIS? Uses of GIS. Some of the Common Terminology
Ecology is studied at several levels
 Ecology is studied at several levels Ecology and evolution are tightly intertwined Biosphere = the total living things on Earth and the areas they inhabit Ecosystem = communities and the nonliving material
Area-wide geotechnical information summary for CERA zoning review panel
 Area-wide geotechnical information summary for CERA zoning review panel This document contains all the area-wide geotechnical information which was considered by CERA as part of the process for making
Waterborne Environmental, Inc., Leesburg, VA, USA 2. Syngenta Crop Protection, LLC, North America 3. Syngenta Crop Protection, Int.
 Application of High Resolution Elevation Data (LiDAR) to Assess Natural and Anthropogenic Agricultural Features Affecting the Transport of Pesticides at Multiple Spatial Scales Josh Amos 1, Chris Holmes
GIS to Support West Nile Virus Program
 GIS to Support West Nile Virus Program 2008 Community Excellence Awards Leadership and Innovation Regional District Regional District Okanagan Similkameen July 2008 2008 UBCM Community Excellence Awards
AGRICULTURAL SCIENCE
 Applied Natural Science SCIENTIFIC PROCESS 7 Curriculum Standard: The student will show the steps of the scientific method and be able to follow it to solve a question or problem. The student will become
Evolution. 1. The figure below shows the classification of several types of prairie dogs.
 Name: Date: 1. The figure below shows the classification of several types of prairie dogs. 3. Which statement describes the best evidence that two species share a recent common ancestor? A. The species
Developing Spatial Awareness :-
 Developing Spatial Awareness :- We begin to exercise our geographic skill by examining he types of objects and features we encounter. Four different spatial objects in the real world: Point, Line, Areas
The Five Themes of Geography
 The Five Themes of Geography The Five Themes of Geography Main Idea: Geographers use the Five Themes of Geography to help them study the Earth. The Five Themes of Geography Geography and You: Suppose a
8.L Which example shows a relationship between a living thing and a nonliving thing?
 Name: Date: 1. Which example shows a relationship between a living thing and a nonliving thing?. n insect is food for a salmon. B. Water carries a rock downstream.. tree removes a gas from the air. D.
Understanding Populations Section 1. Chapter 8 Understanding Populations Section1, How Populations Change in Size DAY ONE
 Chapter 8 Understanding Populations Section1, How Populations Change in Size DAY ONE What Is a Population? A population is a group of organisms of the same species that live in a specific geographical
Multifunctional theory in agricultural land use planning case study
 Multifunctional theory in agricultural land use planning case study Introduction István Ferencsik (PhD) VÁTI Research Department, iferencsik@vati.hu By the end of 20 th century demands and expectations
A Preliminary Home-Range Analysis of Loggerhead Sea Turtles Released in Virginia & North Carolina
 A Preliminary Home-Range Analysis of Loggerhead Sea Turtles Released in Virginia & North Carolina Gwen G. Lockhart GIS Research Specialist Virginia Aquarium & Marine Science Center & Susan G. Barco Research
Plant Distribution in a Sonoran Desert City CAP LTER Data Explorations
 in a Sonoran Desert City CAP LTER Data Explorations Author: Ecology Explorers Team, adapted from data analysis by J. Walker and the CAP LTER 200 point survey Time: 15-30 minutes Grade Level: 9-12 Background:
USING HYPERSPECTRAL IMAGERY
 USING HYPERSPECTRAL IMAGERY AND LIDAR DATA TO DETECT PLANT INVASIONS 2016 ESRI CANADA SCHOLARSHIP APPLICATION CURTIS CHANCE M.SC. CANDIDATE FACULTY OF FORESTRY UNIVERSITY OF BRITISH COLUMBIA CURTIS.CHANCE@ALUMNI.UBC.CA
WHAT IS BIOLOGICAL DIVERSITY?
 WHAT IS BIOLOGICAL DIVERSITY? Biological diversity or biodiversity is the variety of life - the wealth of life forms found on earth. 9 WHAT IS BIOLOGICAL DIVERSITY? Wilcox s (1984) definition: Biological
A critique of the National Standard for Spatial Data Accuracy. Paul Zandbergen Department of Geography University of New Mexico
 A critique of the National Standard for Spatial Data Accuracy Paul Zandbergen Department of Geography University of New Mexico Warning: Statistics Ahead! Spatial Data Quality Matters! Plane took off on
7/29/2011. Lesson Overview. Vegetation Sampling. Considerations. Theory. Considerations. Making the Connections
 Lesson Overview Vegetation Sampling Considerations Theory 1 Considerations Common sense: wildlife management must identify habitat selection (i.e., vegetation types and food used) by animals in comparison
Snowtrack surveys for Canada lynx presence in Minnesota west of Highway 53
 Snowtrack surveys for Canada lynx presence in Minnesota west of Highway 53 2005 Annual Report to Minnesota Department of Natural Resources Ronald Moen, Ph.D. Gerald Niemi, Ph.D. Julie Palakovich Christopher
Application of Remote Sensing Techniques for Change Detection in Land Use/ Land Cover of Ratnagiri District, Maharashtra
 IOSR Journal of Applied Geology and Geophysics (IOSR-JAGG) e-issn: 2321 0990, p-issn: 2321 0982.Volume 3, Issue 6 Ver. II (Nov. - Dec. 2015), PP 55-60 www.iosrjournals.org Application of Remote Sensing
Modern Technologies for the Conservation of Cultural Heritage
 ETH-Zurich Space technologies to support the conservation of natural and cultural heritage Modern Technologies for the Conservation of Cultural Heritage FRANCO NICCOLUCCI ANDREA D ANDREA niccolucci@unifi.it
Population Ecology NRM
 Population Ecology NRM What do we need? MAKING DECISIONS Consensus working through views until agreement among all CONSENSUS Informed analyze options through respectful discussion INFORMED DECISION Majority
Area-wide geotechnical information summary for CERA zoning review panel
 Area-wide geotechnical information summary for CERA zoning review panel This document contains all the area-wide geotechnical information which was considered by CERA as part of the process for making