URBAN SPRAWL ASSESSMENT USING TIME-SERIES LULC AND NDVI VARIATION: A CASE STUDY OF SEPANG, MALAYSIA
|
|
|
- Lucinda Horn
- 5 years ago
- Views:
Transcription
1 URBAN SPRAWL ASSESSMENT USING TIME-SERIES LULC AND NDVI VARIATION: A CASE STUDY OF SEPANG, MALAYSIA YASIN, M. Y. * YUSOF, M. M. NOOR, N. M. Department of Geography, Faculty of Arts and Social Sciences, University of Malaya Kuala Lumpur, Malaysia *Corresponding author yazrinyasin@gmail.com (Received 26 th Dec 2018; accepted 6 th Mar 2019) Abstract. Rapid urbanization that caused urban sprawl is a major worldwide concern. In this study an assessment of urban sprawl was carried out based on Land Use Land Cover (LULC), Normalized Difference Vegetation Index (NDVI) and Normalized Difference Built-up Index (NDBI) variation in Sepang, Malaysia. The land cover classification consisted of Built-up Area (BUA), Vegetation Area (VA), Open Space Area (OSA), and Water Bodies (WB) from 1990 to Supervised classification based on maximum likelihood techniques were used to identify the land use classes. Based on the analysis of LULC, the majority of VA (i.e. forest field) was transformed into OSA and gradually the land was converted into BUA. Observation within 25 years, supported by NDVI and NDBI has discovered a consistent increase of BUA while contrastingly a decline of VA, while WB and OSA are suspected to have inconsistently varying highs and lows. This study has demonstrated that urban sprawl caused by rapid urbanization has not favour the population. Without proper planning and growth control, urban sprawl in Sepang would have undesirable consequences to the quality of life and the environment. Therefore, comprehensive land use and progressive environmental change can serve as prognostic measures to mitigate urban sprawl, and to achieve sustainable urbanization and to carry out effective planning and decision making. Keywords: urban sprawl, land use land cover, normalized difference vegetation index, normalized difference built-up index Introduction Urban sprawl occurs on a micro basis in almost every major cities in the world in response to increased wealth and growing dependence on private transportation (Burchell et al., 2002). Population, resources and productive activity are highly and increasingly concentrated in cities, thus require comprehensive understanding especially in the context of demographic, geographic and economic. In regard to urban sprawl, it is a global phenomenon but it is always viewed in different ways on how and why it was resulted (Barnes et al., 2002). In Eastern Europe, urban sprawl was considered as an outcome of post-socialist of autocratic transformation into liberalization of economic and social well-being (Bussauw, 2012; Nuissl and Rink, 2005). In the USA, early spatial form of sprawl occurred after World War II because of the perception that the new suburbs are safer, more desirable and cheaper than urban alternatives (Peiser, 2001). In Asia, most recently China and India are experiencing the largest and most rapid urban sprawl because of their enormous economic transformation which affecting agricultural productivities (Yue, 2011). Generally, majority scholars admit that urban sprawl had indirectly provide negative impacts especially towards the social segregation and environmental degradation (Squires, 2002; Burchell et al., 2002). Strong supported by Hua and Ping (2018), Hua (2018, 2017a), Noor and Rosni (2013) as well as Abdullahs (2012) view that the problems caused by urban sprawl are exceeded the
2 expected of benefits due to increasing of population growth that live based on their own desires. Nevertheless, many academicians are invited to provide the ideas on urban sprawl for effectively containment, especially focuses about the sustainability development (Hua and Ping, 2018). Since urbanization process taking place worldwide and are considered a universal phenomenon, therefore population growth, economy and infrastructure could be responsible to the increasing of this bewildering phenomenon. Specifically, any development of an urban area with no ability to visualize the growth through planning, policies and decision making process could resulted the sprawl. Therefore, urban sprawl is likely to be considered as the development of a city due to unplanned, uncontrolled, and uncoordinated growth, it could impact the wildlife habitat, encroachment of natural resources and farmland, increased environmental degradation, as well as social and economy deprivation (Hua, 2018, 2017b; Tehrany et al., 2013). Malaysia already going towards an over urbanized nation with 75% of the population is expected to live in urban areas in 2020 (Abdullah, 2012). His study also indicated, urban sprawl in Malaysia will continuously become part of the landscape of metropolitan and other major cities with the expansion of regional economic corridors. Greater Kuala Lumpur, an area surrounded by 10 municipalities surrounding Kuala Lumpur are considered far reaching the socio-economic and cultural conditions. These cities are having desire to compete among each other, and this had caused the economic activities to concentrated in the urban area and leaving the rural areas far behind in term of development. Since Greater Kuala Lumpur had a greater growth in the area and this trend had cause greater number of populations to reside in suburban areas rather than city. Sepang is considered very significant in term of suburban living and sprawl. The study area was mainly selected based on the rapid urbanization and sudden increase in population especially in This is probably due to government s decision on the relocation of the administrative of Putrajaya in Putrajaya is the biggest integrated development with a total land area of ha, conveniently located within the district of Sepang but with separated autonomy. Another integrated development located within Sepang is Cyberjaya, the IT-themed city aspired as Malaysia s Silicon Valley. Cyberjaya is part of Multimedia Super Corridor, a special economic corridor and high technology business district, Federal Government s knowledge based initiative. Sepang also houses KLIA and F1 Sepang circuit, both generated many chain of businesses and employment. This study examined the conceptualization and measurement of sprawl whereby its equates with non-urban e.g. farmland, cropland and open space that change into urban land e.g. building, infrastructures. Therefore, urban sprawl must be considered as the rate of increase relative to physical urban growth or land use change in a space-time context. Consequently the main objective of this study is to assess the land use change from 1990 to 2018 through detection techniques using Land Use Land Cover (LULC) and Normalized Differences Vegetation Index (NDVI). Both methods are considered accurate, common, and effective in change detection for mapping of urban sprawl (Lu et al., 2004). The review on theoretical for measured urban sprawl Another definition by pattern of growth is brought by Ewing and Hamidi (2008), refers urban sprawl as undesirable land use patterns whether scattered, leapfrog, ribbon or continuous low density development and at the same time has poor accessibility and lack of functional open spaces. The growth patterns are usually determined by the
3 availability of adjacent land and variations of terrain. Accessibility has direct correlation with the extent of scattered-ness of the pattern. The more scattered the pattern, the lower their accessibility. Ewing also included any urban growth pattern that have poor accessibility and lack of functional open space. Combination rather than individually separated on the application techniques of remote sensing and GIS in the study for urban sprawl are better especially in monitoring nor simulation for the physical, social and economic data (Mohd Noor et al., 2012). Majority researchers are tends to use remote sensing and GIS to monitor and measure the urban sprawl (Hua, 2018; Noor and Rosni, 2013; Mohd Noor et al., 2012). Nevertheless, having strong definition on sprawl term with focus towards the problematic and undesirable development characteristic which majority stakeholders are debate on. Therefore, the advantageous of using remote sensing is the capability of producing consistent spatial dataset with coverage of larger areas assisted with its high spatial and temporal resolution. In other words, remote sensing can be considered as unique view on the spatial temporal change of the urban growth process and land use change (Herold et al., 2003). Another advantageous of using satellite remote sensing are land cover monitoring and detection at various scales to provide useful results (Wilson et al., 2003; Stefanov et al., 2001). The present technology enable the integration of remote sensing and Geographical Information System (GIS) with Global Positioning System (GPS) allowing land use change detection and assessment become more effective (Muller and Zeller, 2002; Weng, 2002). The technique of mapping urban areas as source of data for modelling and urban growth analysis as well as dynamic change detection in land use land cover was proven as very beneficial (Wilson et al., 2003; Herold et al., 2003; Stefanov et al., 2001). Materials and methods Study area The study area is Sepang, Selangor, Malaysia located at N and E with a total coverage of km 2 and the main land use are: built-up areas, vegetation and open spaces (Fig. 1a and b. The population within 20 years from 1995 is approximately 90,000 and the number is rising up to 190,000 in 2015 (Statistical Department of Malaysia, 2015). Geographically it is in the southern part of Selangor, neighboring to the district of Hulu Langat in the northeast, district of Kuala Langat in the west, and Petaling in the north and also neighboring to District of Nilai, Negeri Sembilan and surrounding the federal territory and administrative capital of Putrajaya. The municipal administration office originally located in pekan Sepang, a very small town consists of not more than 3 shop houses at that time. When the Kuala Lumpur International Airport (KLIA) was officially inaugurated in 1998, the office was moved to Salak Tinggi. For a second time, after Putrajaya was established and become the new administrative capital of Malaysia, the municipal was moved to Cyberjaya in Primary data sources of Landsat thematic mapper (TM) and operational land imager (OLI) and thermal infrared sensor (TIRS) Remotely sensed data was acquired from the United State Geological Survey (USGS) Earth Explorer for Landsat data of Thematic Mapper (TM) as well as
, which is important for abstracting process on the raw map using")
 Time Path/row 12/27 1990 30 10.30am 127/58 11/25 1992 30 11.15am 127/58 11/28 1994 30 10.")
4 Operational Land Imager (OLI) and Thermal Infrared Sensor (TIRS). Supported by Landsat data, the boundary of Sepang district, Malaysia is based on the Department of Survey and Mapping Malaysia (JUPEM), which is important for abstracting process on the raw map using Area of Interest (AOI) technique in mapping procedures. The details on primary satellite data can be shown in Table 1. Table 1. Primary satellite data of Landsat TM and OLI/TIRS Sensors Month/day Year Spatial resolution (m) Time Path/row 12/ am 127/58 11/ am 127/58 11/ am 127/58 06/ am 127/58 02/ am 127/58 Landsat TM 03/ am 127/58 05/ am 127/58 12/ am 127/58 03/ am 127/58 07/ am 127/58 01/ am 127/58 06/ am 127/58 03/ am 127/58 Landsat OLI/TIRS 03/ am 127/58 04/ am 127/58 Band combination 1,2,3,4,7 2,3,4,5,7 a
 Data preprocessing and land use/land cover classification It is essential for a newly obtained time series of")
5 b Figure 1. a Sepang district as study area in the research study. b The spatial distribution of Sepang District (Source: Sepang Municipal Council 2016) Data preprocessing and land use/land cover classification It is essential for a newly obtained time series of remotely sensed data to be preprocessed before any analytical process are made. First, using ArcGIS Ver. 10.1, the images have to go through pre-processing for geo-referencing, mosaicking, and sub
6 setting where only then, the specific area can be selected through Area of Interest (AOI) technique (Behera et al., 2012). The main purposes to conduct preprocessing are to correct the sensor- and platformspecific radiometric and geometric distortions of data. This correction technique on the radiometric is required because of the variation in scene illumination and viewing geometry, atmospheric conditions, and sensor noise and responses. Fortunately, all satellite images obtained is cloud free or <10% cloud coverage (Tan et al., 2010). To avoid error and imprecise interpretation, the images for Landsat TM and OLI/TIRS were in original resolution of 30 m (Table 1). Next, further processing for band combination of in Landsat TM and in Landsat OLI/TIRS are carried out in ArcGIS 10. Then classification of land use is conducted in ENVI Version 4.0. Classification was performed using Maximum Likelihood supervised using selected regions and Regions of Interest (ROI), which based on delineated classes of built-up area, vegetation area, water bodies, and open space area (Table 2). The built-up areas classes consists of residential, industrial, commercial, administration, cemetery and transportation, and sewage treatment plant. The vegetation classes consists of all forest and agricultural land, as well as open space whereby it include barren land. The final class is the water bodies which consists of rivers, lakes, stream, canals and reservoirs. Table 2. Land use classification based on maximum likelihood supervised techniques Land use class Built up area Vegetation area Water bodies Open space area Definition Includes all residential, industrial, commercial, administration, cemetery and transportation, and sewage treatment plant Includes all forest field and agricultural lands Includes all water bodies (river, lakes, gravels, stream, canals, and reservoirs) Includes all land area that are in soil and barren area due to the human activities Accuracy assessment It is compulsory to conduct accuracy assessment of classified images from 1990 to 2018 (i.e. 15 images) to ensure accuracy, integrity and quality. Kappa tests are used to measure the accuracy of classification which have capability to test all confusion matrix of elements based on minimum requirement (Halmy et al., 2015). The Kappa tests can be measured based on the producer and user rating of assignment, which can be interpreted in formula as Equation 1: (Eq.1) where, P(A) is the total of k raters agree, and P(E) is the total of k raters which expected to agree by chance (El-Kawy et al., 2011; Pontius and Millones, 2011). The accuracy of user can be explained as probability defined the pixel on image to represent a class on ground, while accuracy of producer is the probability pixel is correctly classified and usually it determine how good for particular area can be classified (Pontius and Millones, 2011). Therefore, four (4) classes had been set up earlier, whereby the delineated should be 50 points and above for each category to enhance the accuracy
7 assessment percentage (El-Kawy et al., 2011; Pontius and Malanson, 2005). So, the accuracy assessment for 1990, 1992, 1994, 1996, 1998, 2000, 2002, 2004, 2006, 2008, 2010, 2012, 2014, 2016, and 2018 are having the kappa value of 0.87, 0.84, 0.82, 0.83, 0.86, 0.88, 0.91, 0.80, 0.82, 0.82, 0.90, 0.86, 0.85, 0.84, and 0.91, respectively (Table 3a-o). Identified categories of LULC in accuracy assessment are considered achieved the required minimum, which is need to be at least 80% (Weng, 2010). Hence, the data can be exported into ENVI 4.0 for further analysis. Table 3. a The accuracy assessment for 1990 of Sepang district Class name (1990) Reference total Classified total Number correct Producers accuracy (%) User accuracy (%) Built up area Vegetation area Water bodies Open space area Overall classification accuracy = 98.33%; Kappa coefficient = Table 3. b The accuracy assessment for 1992 of Sepang district Class name (1992) Reference total Classified total Number correct Producers accuracy (%) User accuracy (%) Built up area Vegetation area Water bodies Open space area Overall classification accuracy = 96.64%; Kappa coefficient = Table 3. c The accuracy assessment for 1994 of Sepang district Class name (1994) Reference total Classified total Number correct Producers accuracy (%) User accuracy (%) Built up area Vegetation area Water bodies Open space area Overall classification accuracy = 95.08%; Kappa coefficient = Table 3. d The accuracy assessment for 1996 of Sepang district Class name (1996) Reference total Classified total Number correct Producers accuracy (%) User accuracy (%) Built up area Vegetation area Water bodies Open space area Overall classification accuracy = 94.31%; Kappa coefficient =
8 Table 3. e The accuracy assessment for 1998 of Sepang district Class name (1998) Reference Classified Number Producers User total total correct accuracy (%) accuracy (%) Built up area Vegetation area Water bodies Open space area Overall classification accuracy = 97.94%; Kappa coefficient = Table 3. f The accuracy assessment for 2000 of Sepang district Class name (2000) Reference Classified Number Producers User accuracy total total correct accuracy (%) (%) Built up area Vegetation area Water bodies Open space area Overall classification accuracy = 95.86%; Kappa coefficient = Table 3. g The accuracy assessment for 2002 of Sepang district Class name (2002) Reference Classified Number Producers User total total correct accuracy (%) accuracy (%) Built up area Vegetation area Water bodies Open space area Overall classification accuracy = 96.24%; Kappa coefficient = Table 3. h The accuracy assessment for 2004 of Sepang district Class name (2004) Reference Classified Number Producers User total total correct accuracy (%) accuracy (%) Built up area Vegetation area Water bodies Open space area Overall classification accuracy = 92.77%; Kappa coefficient = Table 3. i The accuracy assessment for 2006 of Sepang district Class name (2006) Reference Classified Number Producers User total total correct accuracy (%) accuracy (%) Built up area Vegetation area Water bodies Open space area Overall classification accuracy = 93.14%; Kappa coefficient =
9 Table 3. j The accuracy assessment for 2008 of Sepang district Class name (2008) Reference Classified Number Producers User total total correct accuracy (%) accuracy (%) Built up area Vegetation area Water bodies Open space area Overall classification accuracy = 90.44%; Kappa coefficient = Table 3. k The accuracy assessment for 2010 of Sepang district Class name (2010) Reference Classified Number Producers User accuracy total total correct accuracy (%) (%) Built up area Vegetation area Water bodies Open space area Overall classification accuracy = 95.13%; Kappa coefficient = Table 3. l The accuracy assessment for 2012 of Sepang district Class name (2012) Reference Classified Number Producers User accuracy total total correct accuracy (%) (%) Built up area Vegetation area Water bodies Open space area Overall classification accuracy = 93.15%; Kappa coefficient = Table 3. m The accuracy assessment for 2014 of Sepang district Class name (2014) Reference Classified Number Producers User accuracy total total correct accuracy (%) (%) Built up area Vegetation area Water bodies Open space area Overall classification accuracy = 95.01%; Kappa coefficient = Table 3. n The accuracy assessment for 2016 of Sepang district Class name (2016) Reference Classified Number Producers User accuracy total total correct accuracy (%) (%) Built up area Vegetation area Water bodies Open space area Overall classification accuracy = 91.06%; Kappa coefficient =
10 Table 3. o The accuracy assessment for 2018 of Sepang district Class name (2018) Reference total Classified total Number correct Producers accuracy (%) User accuracy (%) Built up area Vegetation area Water bodies Open space area Overall classification accuracy = 95.63%; Kappa coefficient = Analysis of change detection in land use land cover In LULC change detection, post-classification detection technique is proposed in this study using ENVI 4.0, where two classified images were compared to provide the information of changes on the pixel basis. In other words, these two images were interpreted to produce the changes from- to information. A m to ground resolution of Landsat TM and Landsat OLI/TIRS were resampled and geo-rectified based on WGS84 UTM with RMSE less than 0.5 pixels were projected. Then, classified images based on two comparisons of data sets using cross-tabulation to determine the qualitative and quantitative changes for the periods from 1990 to The frequency and percentage of changes can be calculated according to simple formula as Equations 2 and 3: (Eq.2) (Eq.3) where, K is the magnitude of changes, A is the percentage of changes, F is the first data, and I is the references data (Mahmud and Achide, 2012). This research study uses LULC methods to map the urban sprawl by determine the differences of land use changes and to explain the percentages changes within the period of time. Normalized difference vegetation index (NDVI) Normalized difference vegetation index (NDVI) is measuring the vegetation through quantifies between near-infrared of differences (which refer to the stronger reflected light by vegetation) and red light (which refer to the light that absorbs by vegetation). The NDVI value is ranges from -1 to 1, but it is no exact boundary line between each type of land cover. For instance, when the value is negatives, which showing the pixel are in water coverage; meanwhile the value that close to +1, then the result are having high possibility of green leaves surrounding the area. Nevertheless, when the value of NDVI is close to zero, then the land use indicates no green leaves and probably showing an urbanized area. The NDVI can be interpreted into formula as Equation 4: (Eq.4) where, NIR - RED and NIR + RED indicate the surface reflectance averaged over ranges of wavelengths in the visible of red (λ~0.6 µm) and near infrared, IR (λ~0.8 µm),
11 respectively. In other words, NDVI is a standardized way to measure the healthy vegetation. When the NDVI value is higher, then the healthier is the vegetation at the study area. Normalized difference built-up index (NDBI) Having similar with NDVI, the normalized difference built-up index (NDBI) is used to measured the build-up area through quantifies between differences of short-wave infrared (SWIR) and near-infrared (NIR). The NDBI value is ranges from -1 to 1, whereby the negative value showing the pixel are non-built-up coverage area; meanwhile the positive value are having high possibility of built-up area surrounding the environment. The NDBI can be expressed into formula as Equation 5: (Eq.5) where, SWIR NIR and SWIR + NIR can be defined as surface reflectance averaged over ranges of wavelengths in the short infrared (λ~0.7 µm) and near infrared (λ~0.8 µm). When the NDBI value is higher, this circumstances indicate the study area is clustered with highly built-up activities within surrounding area. Results and discussion According to Table 4, the result indicated the density of LULC changes from 1990 to 2018 with four classes: built-up area, vegetation area, water bodies, and open space area (Fig. 2). Except in year 1992, the built-up area (BUA) class is observed to have continuously increase for 25 years. The percentage of increment is about 25.4% from 1990 to The study concluded that BUA classes are considered having the most increment due to rapid urbanization and population growth. It is followed by OSA class from 1990 to 2004 with an increment of 4.75% in average but beginning to decrease by 18.5% in the next 13 years. In other words, majority OSA class has gain benefit from the vegetation area (VA), and the most open space is suspected to change into BUA and/or other classes. Vegetation Area (VA) class consistently decreasing from 1990 to 2018 (Fig. 3) by 64.33%. This amount to ha of land. Except for waterbodies which has not seen any significant change, this uppermost land use changes is due to high demand in BOA to cater with population need and demand for residentialindustrial-commercial activities as well as transportation facilities. Table 4. Change of the LULC density classes from 1990 to 2018 LULC density classes Ha % Ha % Ha % Ha % Ha % Ha % Ha % Ha % BUA VA WB OSA

12 Ha % Ha % Ha % Ha % Ha % Ha % Ha % BUA VA WB OSA
13 Figure 2. The LULC change from 1990 to 2018 in Sepang district
14 Figure 3. The comparison of areas and rate of changes in LULC classes between each two years from 1990 to 2018 Combining LULC change with Normalized Difference Vegetation Index (NDVI) and Normalized Difference Built-up Index (NDBI) techniques is considered recent and novelty. An NDVI is an equation that takes into account the amount of infrared reflected by plants. In classification process, supervised classification method based maximum likelihood algorithm was employed for NDVI, which is based on a set of user-defined classes and training areas through creating appropriate spectral signatures from Landsat TM and OLI/ TIRS. The result of changes of NDVI density classes for 25 years indicated that the vegetation index gradually reduced about 27.91% from year 1990 to year 2010, but the value sustained about 28.75% for the next 8 years from 2010 onwards (see Table 5). Table 5. Change of the NDVI density classes from 1990 to 2018 NDVI density classes Ha % Ha % Ha % Ha % Ha % Ha % Ha % Ha % H M L Ha % Ha % Ha % Ha % Ha % Ha % Ha % H M L
15 In other words, the higher the value of index, indicated the healthier the vegetation would be. Therefore, the value constantly changing due to the majority of vegetation classes are subjected to transform to open space and built-up classes. The pattern of vegetation classes derived from NDVI density (see Fig. 4) were predominantly the main land use class in year 1990 to Beginning 1996 onwards, patches of other classes spread across Sepang starting to gradually increase year by year. This was interpreted as an encroachment and an environmental degradation of forest, farm and cropland and further reducing agricultural productive land. The encroachment of these land uses, the environmental degradation and reduced in agricultural productivities are among the characteristic of urban sprawl defined earlier in this study.
 is an arithmetic manipulation of NDVI except it is used for mapping built-up areas.")

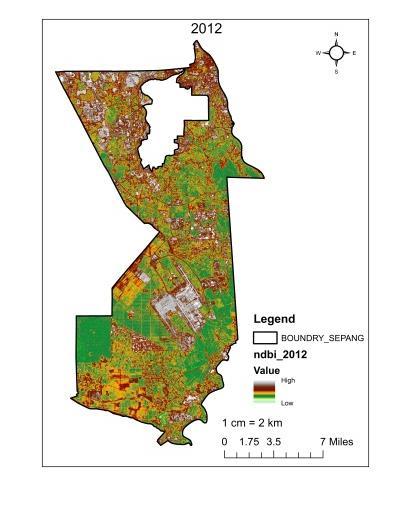
16 Figure 4. The NDVI density from 1990 to 2018 in Sepang district A Normalized Difference Built-up Index (NDBI) is an arithmetic manipulation of NDVI except it is used for mapping built-up areas. The result of changes of index of very-high and high of NDBI density classes for 25 years indicated inconsistent of ups and downs of built-up classes. In contrarily, the result of changes of index of mediumand-low of NDBI indicated a consistent decreased throughput the longitudinal study. This is due to the fact that the highly demand for development on land use purposes will eventually cause an increasing in building index and reducing in vegetation index (Ewing and Hamidi, 2014). The pattern of built-up classes derived from NDBI density (see Fig. 5) was not the primary land use in early years. However, as early as the beginning of the longitudinal study, the built-up classes were already shown a sign of leapfrog, low density and scattered with polycentric development. Increased in built-up classes are necessary result in increase of impervious surface which effect water quality and increased of runoff water. By interpretation, Sepang has no specific urban growth boundary. Sepang was also part of Greater Kuala Lumpur with greater number of populations to reside in suburban areas. To add to the scenario, Putrajaya was rapidly growing at beginning of mid-1990s and continuously to do so, while Cyberjaya which also located within Sepang was the special economic corridor. Thus, Sepang was critically sprawled; backed with all the sprawl pattern leapfrog, low density and scattered development; without any urban growth boundary; formed an urban environmental degradation, become the overpopulated suburban living for Putrajaya and Cyberjaya; and houses mass population for Greater Kuala Lumpur.
17

18 Figure 5. The NDBI density from 1990 to 2018 in Sepang district Conclusion Urbanization and rapid population growth are a major cause of land use changes and land conversions. It is essential in change detection to determine what type of land classes has change and the rate of change. Analyzing the spatial change with temporal aspects of urban growth can contribute to an effective planning and mitigate urban sprawl. Through this study, the urban expansion of Sepang over different period using time-series LULC and NDVI variation was achieved. The classification was able to clearly distinguished built-up area, vegetation area, water bodies, and open space. Land use land cover change detection showed an increased percentage of built-up area and open space, while reduce vegetation area. Only waterbodies had not shown any significant change. An NDVI quantified a steady declined of vegetation classes. The pattern of vegetation derived from NDVI density showed an encroachment and an environmental degradation of forest, farm and cropland and further reducing agricultural productive land. This is urban sprawl by definition. On the contrary, NDBI indicated inconsistent of ups and downs of built-up classes. However, the pattern of vegetation derived from NDBI density indicated urban sprawl patterns, urban sprawl characteristics and are associated with urban sprawl causes. Thus, the study proved urbanization and rapid population growth has caused urban sprawl to Sepang. REFERENCES [1] Abdullah, J. (2012): City competitiveness and urban sprawl: their implications to socioeconomic and cultural life in Malaysian cities. Procedia-Social and Behavioral Sciences 50: [2] Barnes, K. B., Morgan III, J. M., Roberge, M. C., Lowe, S. (2001): Sprawl Development. Its Patterns, Consequences and Measurement. A white paper. Towson University, Maryland. [3] Behera, D. M., Borate, S. N., Panda, S. N., Behera, P. R., Roy, P. S. (2012): Modelling and analyzing the watershed dynamics using Cellular Automata (CA) Markov model A geo-information based approach. Journal of Earth System Science 121(4): [4] Burchell, R. W., Lowenstein, G., Dolphin, W. R., Galley, C. C., Downs, A., Seskin, S., Gray Still, K., Moore, T. (2002): Costs of Sprawl Transportation Cooperative Research Program, Report 74. National Academic Press, Washington, DC.
19 [5] Bussauw, K. (2012): Challenges, threats and opportunities in post-conflict urbandevelopment in Kosovo. Habitat International 36: [6] El Garouani, A., Mulla, D. J., El Garouani, S., Knight, J. (2017): Analysis of urban growth and sprawl from remote sensing data: Case of Fez, Morocco. International Journal of Sustainable Built Environment 6(1): [7] El-Kawy, O. A., Rød, J. K., Ismail, H. A., Suliman, A. S. (2011): Land use and land cover change detection in the western Nile delta of Egypt using remote sensing data. Applied Geography 31(2): [8] Ewing, R., Hamidi, S. (2014): Measuring urban sprawl and validating sprawl measures. Technical Report Prepared for the National Cancer Institute, National Institutes of Health, the Ford Foundation, and Smart Growth America. Smart Growth America, Washington, DC. [9] Halmy, M. W. A., Gessler, P. E., Hicke, J. A., Salem, B. B. (2015): Land use/land cover change detection and prediction in the north-western coastal desert of Egypt using Markov-CA. Applied Geography 63: [10] Herold, M., Goldstein, N. C., Clarke, K. C. (2003): The spatiotemporal form of urban growth: measurement, analysis and modeling. Remote Sensing of Environment 86(3): [11] Hua, A. K., Ping, O. W. (2018): The influence of land-use/land-cover changes on land surface temperature: a case study of Kuala Lumpur metropolitan city. European Journal of Remote Sensing 51(1): [12] Hua, A. K. (2017a): Application of Ca-Markov model and land use/land cover changes in Malacca River Watershed, Malaysia. Applied Ecology and Environmental Research 15(4): [13] Hua, A. K. (2017b): Land use land cover changes in detection of water quality: a study based on remote sensing and multivariate statistics. Journal of Environmental and Public Health. [14] Hua, A. K. (2018): SPATIAL-temporal analysis of pattern changes and prediction in Penang Island, Malaysia using LULC and CA-Markov model. Applied Ecology and Environmental Research 16(4): [15] Lu, D., Mausel, P., Brondizio, E., Moran, E. (2004): Change detection techniques. International Journal of Remote Sensing 25(12): [16] Mahmud, A., Achide, A. S. (2012): Analysis of land use/land cover changes to monitor urban sprawl in Keffi-Nigeria. Environmental Research Journal 6(2): [17] Mohd Noor, N., Alias, A., Mazlan, H., Zainora, M. A. (2012): Managing Urban Land In Developing Countries Using GIS And Remote Sensing: Towards Resilient Cities. Department of Urban and Regional Planning, IIUM, Gombak, Malaysia. [18] Muller, D., Zeller, M. (2002): Land use dynamics in the central highlands of Vietnam: a spatial model combining village survey data with satellite imagery interpretation. Agricultural Economics 27(3): [19] Noor, N. M., Rosni, N. A. (2013): Determination of spatial factors in measuring urban sprawl in Kuantan using remote sensing and GIS. Procedia-Social and Behavioral Sciences 85: [20] Nuissl, H., Rink, D. (2005): The Production of urban sprawl in Eastern Germany as a phenomenon of post-socialist transformation. Cities 22: [21] Peiser, R. B. (2001): Decomposing urban sprawl. Town Planning Review 72(3): [22] Pontius, G. R., Malanson, J. (2005): Comparison of the structure and accuracy of two land change models. International Journal of Geographical Information Science 19(2): [23] Pontius Jr, R. G., Millones, M. (2011): Death to Kappa: birth of quantity disagreement and allocation disagreement for accuracy assessment. International Journal of Remote Sensing 32(15):
20 [24] Squires, G. D. (Ed.) (2002): Urban Sprawl: Causes, Consequences and Policy Responses. The Urban Institute Press, Washington, DC. [25] Statistical Department of Malaysia (2015): Population and Housing Census Department of Statistic Malaysia, Putrajaya. [26] Sepang Municipal Council (2016). Sepang Local Plan 2020 (Ammendment 1). Retrieved from [27] Statistical Department of Malaysia (1992): Population and Housing Census Department of Statistic Malaysia, Putrajaya. [28] Stefanov, W. L., Ramsey, M. S., Christensen, P. R. (2001): Monitoring urban land cover change: An expert system approach to land cover classification of semiarid to arid urban centers. Remote Sensing of Environment 77(2): [29] Tan, K. C., San Lim, H., MatJafri, M. Z., Abdullah, K. (2010): Landsat data to evaluate urban expansion and determine land use/land cover changes in Penang Island, Malaysia. Environmental Earth Sciences 60(7): [30] Tehrany, M. S., Pradhan, B., Jebur, M. N. (2013): Remote sensing data reveals ecoenvironmental changes in urban areas of Klang Valley, Malaysia: contribution from object based analysis. Journal of the Indian Society of Remote Sensing 41(4): [31] Weng, Q. (2002): Land use change analysis in the Zhujiang Delta of China using satellite remote sensing, GIS and stochastic modelling. Journal of Environmental Management 64(3): [32] Weng, Q. H. (2010): Remote Sensing and GIS Integration. McGraw-Hill, New York. [33] Wilson, E. H., Hurd, J. D., Civco, D. L., Prisloe, M. P., Arnold, C. (2003): Development of a geospatial model to quantify, describe and map urban growth. Remote Sensing of Environment 86(3): [34] Yue, M.-Y. (2011): Rethinking Asian cities and urbanization: four transformations in four decades. Asian Geographer 28(1):
STUDY OF NORMALIZED DIFFERENCE BUILT-UP (NDBI) INDEX IN AUTOMATICALLY MAPPING URBAN AREAS FROM LANDSAT TM IMAGERY
 INDEX IN AUTOMATICALLY MAPPING URBAN AREAS FROM LANDSAT TM IMAGERY") STUDY OF NORMALIZED DIFFERENCE BUILT-UP (NDBI) INDEX IN AUTOMATICALLY MAPPING URBAN AREAS FROM LANDSAT TM IMAGERY Dr. Hari Krishna Karanam Professor, Civil Engineering, Dadi Institute of Engineering &
STUDY OF NORMALIZED DIFFERENCE BUILT-UP (NDBI) INDEX IN AUTOMATICALLY MAPPING URBAN AREAS FROM LANDSAT TM IMAGERY Dr. Hari Krishna Karanam Professor, Civil Engineering, Dadi Institute of Engineering &
1. Introduction. Chaithanya, V.V. 1, Binoy, B.V. 2, Vinod, T.R. 2. Publication Date: 8 April DOI: https://doi.org/ /cloud.ijarsg.
 Cloud Publications International Journal of Advanced Remote Sensing and GIS 2017, Volume 6, Issue 1, pp. 2088-2096 ISSN 2320 0243, Crossref: 10.23953/cloud.ijarsg.112 Research Article Open Access Estimation
Spatiotemporal Analysis of Noida, Greater Noida and Surrounding Areas (India) Using Remote Sensing and GIS Approaches
 Using Remote Sensing and GIS Approaches") Spatiotemporal Analysis of Noida, Greater Noida and Surrounding Areas (India) Using Remote Sensing and GIS Approaches Gopal Krishna* Indian Agricultural Research Institute, New Delhi, India ABSTRACT Spatiotemporal
Spatiotemporal Analysis of Noida, Greater Noida and Surrounding Areas (India) Using Remote Sensing and GIS Approaches Gopal Krishna* Indian Agricultural Research Institute, New Delhi, India ABSTRACT Spatiotemporal
Abstract: About the Author:
 REMOTE SENSING AND GIS IN LAND USE PLANNING Sathees kumar P 1, Nisha Radhakrishnan 2 1 1 Ph.D Research Scholar, Department of Civil Engineering, National Institute of Technology, Tiruchirappalli- 620015,
MANAGING URBANISATION AND URBAN SPRAWL IN MALAYSIA BY USING REMOTE SENSING AND GIS APPLICATIONS
 PLANNING MALAYSIA: Journal of the Malaysian Institute of Planners SPECIAL ISSUE IV (2016), Page 17-30 MANAGING URBANISATION AND URBAN SPRAWL IN MALAYSIA BY USING REMOTE SENSING AND GIS APPLICATIONS Nur
Applications of GIS and Remote Sensing for Analysis of Urban Heat Island
 Chuanxin Zhu Professor Peter V. August Professor Yeqiao Wang NRS 509 December 15, 2016 Applications of GIS and Remote Sensing for Analysis of Urban Heat Island Since the last century, the global mean surface
Critical Assessment of Land Use Land Cover Dynamics Using Multi-Temporal Satellite Images
 Environments 2015, 2, 61-90; doi:10.3390/environments2010061 OPEN ACCESS environments ISSN 2076-3298 www.mdpi.com/journal/environments Article Critical Assessment of Land Use Land Cover Dynamics Using
Application of Remote Sensing Techniques for Change Detection in Land Use/ Land Cover of Ratnagiri District, Maharashtra
 IOSR Journal of Applied Geology and Geophysics (IOSR-JAGG) e-issn: 2321 0990, p-issn: 2321 0982.Volume 3, Issue 6 Ver. II (Nov. - Dec. 2015), PP 55-60 www.iosrjournals.org Application of Remote Sensing
Comparison between Land Surface Temperature Retrieval Using Classification Based Emissivity and NDVI Based Emissivity
 Comparison between Land Surface Temperature Retrieval Using Classification Based Emissivity and NDVI Based Emissivity Isabel C. Perez Hoyos NOAA Crest, City College of New York, CUNY, 160 Convent Avenue,
International Journal of Intellectual Advancements and Research in Engineering Computations
 ISSN:2348-2079 Volume-5 Issue-2 International Journal of Intellectual Advancements and Research in Engineering Computations Agricultural land investigation and change detection in Coimbatore district by
Urban Growth Analysis: Calculating Metrics to Quantify Urban Sprawl
 Urban Growth Analysis: Calculating Metrics to Quantify Urban Sprawl Jason Parent jason.parent@uconn.edu Academic Assistant GIS Analyst Daniel Civco Professor of Geomatics Center for Land Use Education
Urban Sprawl Prediction and Change Detection Analysis in and around Thiruvannamalai Town Using Remote Sensing and GIS
 Urban Sprawl Prediction and Change Detection Analysis in and around Thiruvannamalai Town Using Remote Sensing and GIS Hemanandhini.S 1, Suresh babu.s 2, Vinay.M.S 3 Department of Remote Sensing, Adhiyamaan
Progress and Land-Use Characteristics of Urban Sprawl in Busan Metropolitan City using Remote sensing and GIS
 Progress and Land-Use Characteristics of Urban Sprawl in Busan Metropolitan City using Remote sensing and GIS Homyung Park, Taekyung Baek, Yongeun Shin, Hungkwan Kim ABSTRACT Satellite image is very usefully
Monitoring Vegetation Growth of Spectrally Landsat Satellite Imagery ETM+ 7 & TM 5 for Western Region of Iraq by Using Remote Sensing Techniques.
 Monitoring Vegetation Growth of Spectrally Landsat Satellite Imagery ETM+ 7 & TM 5 for Western Region of Iraq by Using Remote Sensing Techniques. Fouad K. Mashee, Ahmed A. Zaeen & Gheidaa S. Hadi Remote
INTERNATIONAL JOURNAL OF GEOMATICS AND GEOSCIENCES Volume 2, No 1, 2011
 INTERNATIONAL JOURNAL OF GEOMATICS AND GEOSCIENCES Volume 2, No 1, 2011 Copyright 2010 All rights reserved Integrated Publishing services Research article ISSN 0976 4380 Spatio-Temporal changes of Land
Land Use and Land Cover Detection by Different Classification Systems using Remotely Sensed Data of Kuala Tiga, Tanah Merah Kelantan, Malaysia
 Land Use and Land Cover Detection by Different Classification Systems using Remotely Sensed Data of Kuala Tiga, Tanah Merah Kelantan, Malaysia Wani Sofia Udin*, Zuhaira Nadhila Zahuri Faculty of Earth
A Logistic Regression Method for Urban growth modeling Case Study: Sanandaj City in IRAN
 A Logistic Regression Method for Urban growth modeling Case Study: Sanandaj City in IRAN Sassan Mohammady GIS MSc student, Dept. of Surveying and Geomatics Eng., College of Eng. University of Tehran, Tehran,
Temporal Changes in Urban Green Space Based on Normalized Difference Vegetation Index
 Applied Mathematical Sciences, Vol. 8, 2014, no. 55, 2743-2751 HIKARI Ltd, www.m-hikari.com http://dx.doi.org/10.12988/ams.2014.432230 Temporal Changes in Urban Green Space Based on Normalized Difference
Investigation of the Effect of Transportation Network on Urban Growth by Using Satellite Images and Geographic Information Systems
 Presented at the FIG Congress 2018, May 6-11, 2018 in Istanbul, Turkey Investigation of the Effect of Transportation Network on Urban Growth by Using Satellite Images and Geographic Information Systems
VISUALIZATION URBAN SPATIAL GROWTH OF DESERT CITIES FROM SATELLITE IMAGERY: A PRELIMINARY STUDY
 CO-439 VISUALIZATION URBAN SPATIAL GROWTH OF DESERT CITIES FROM SATELLITE IMAGERY: A PRELIMINARY STUDY YANG X. Florida State University, TALLAHASSEE, FLORIDA, UNITED STATES ABSTRACT Desert cities, particularly
Modeling Urban Land Cover Growth Dynamics Based on Land Change Modeler (LCM) Using Remote Sensing: A Case Study of Gurgaon, India
 Using Remote Sensing: A Case Study of Gurgaon, India") Advances in Computational Sciences and Technology ISSN 0973-6107 Volume 10, Number 10 (2017) pp. 2947-2961 Research India Publications http://www.ripublication.com Modeling Urban Land Cover Growth Dynamics
Advances in Computational Sciences and Technology ISSN 0973-6107 Volume 10, Number 10 (2017) pp. 2947-2961 Research India Publications http://www.ripublication.com Modeling Urban Land Cover Growth Dynamics
Predicting the Vegetation Expansion in Selangor, Malaysia using the NDVI and Cellular Automata Markov Chain
 Proceedings of the World Congress on Civil, Structural, and Environmental Engineering (CSEE 16) Prague, Czech Republic March 30 31, 2016 Paper No. ICGRE 115 DOI: 10.11159/icgre16.115 Predicting the Vegetation
Vegetation Change Detection of Central part of Nepal using Landsat TM
 Vegetation Change Detection of Central part of Nepal using Landsat TM Kalpana G. Bastakoti Department of Geography, University of Calgary, kalpanagb@gmail.com Abstract This paper presents a study of detecting
Use of Corona, Landsat TM, Spot 5 images to assess 40 years of land use/cover changes in Cavusbasi
 New Strategies for European Remote Sensing, Olui (ed.) 2005 Millpress, Rotterdam, ISBN 90 5966 003 X Use of Corona, Landsat TM, Spot 5 images to assess 40 years of land use/cover changes in Cavusbasi N.
URBAN CHANGE DETECTION OF LAHORE (PAKISTAN) USING A TIME SERIES OF SATELLITE IMAGES SINCE 1972
 USING A TIME SERIES OF SATELLITE IMAGES SINCE 1972") URBAN CHANGE DETECTION OF LAHORE (PAKISTAN) USING A TIME SERIES OF SATELLITE IMAGES SINCE 1972 Omar Riaz Department of Earth Sciences, University of Sargodha, Sargodha, PAKISTAN. omarriazpk@gmail.com ABSTRACT
URBAN CHANGE DETECTION OF LAHORE (PAKISTAN) USING A TIME SERIES OF SATELLITE IMAGES SINCE 1972 Omar Riaz Department of Earth Sciences, University of Sargodha, Sargodha, PAKISTAN. omarriazpk@gmail.com ABSTRACT
Landuse and Landcover change analysis in Selaiyur village, Tambaram taluk, Chennai
 Landuse and Landcover change analysis in Selaiyur village, Tambaram taluk, Chennai K. Ilayaraja Department of Civil Engineering BIST, Bharath University Selaiyur, Chennai 73 ABSTRACT The synoptic picture
7.1 INTRODUCTION 7.2 OBJECTIVE
 7 LAND USE AND LAND COVER 7.1 INTRODUCTION The knowledge of land use and land cover is important for many planning and management activities as it is considered as an essential element for modeling and
This is trial version
 Journal of Rangeland Science, 2012, Vol. 2, No. 2 J. Barkhordari and T. Vardanian/ 459 Contents available at ISC and SID Journal homepage: www.rangeland.ir Full Paper Article: Using Post-Classification
MODELLING OF URBAN LAND USE AND ASSESSMENT OF FUTURE URBAN EXPANSION: APPLICATION IN THE MUNICIPALITY OF MYTILENE, LESVOS ISLAND, GREECE.
 Proceedings of the 13 th International Conference on Environmental Science and Technology Athens, Greece, 5-7 September 2013 MODELLING OF URBAN LAND USE AND ASSESSMENT OF FUTURE URBAN EXPANSION: APPLICATION
Research Article A Quantitative Assessment of Surface Urban Heat Islands Using Satellite Multitemporal Data over Abeokuta, Nigeria
 International Atmospheric Sciences Volume 2016, Article ID 3170789, 6 pages http://dx.doi.org/10.1155/2016/3170789 Research Article A Quantitative Assessment of Surface Urban Heat Islands Using Satellite
Modelling of the Interaction Between Urban Sprawl and Agricultural Landscape Around Denizli City, Turkey
 Modelling of the Interaction Between Urban Sprawl and Agricultural Landscape Around Denizli City, Turkey Serhat Cengiz, Sevgi Gormus, Şermin Tagil srhtcengiz@gmail.com sevgigormus@gmail.com stagil@balikesir.edu.tr
Detection of Land Use and Land Cover Change around Eti-Osa Coastal Zone, Lagos State, Nigeria using Remote Sensing and GIS
 International Research Journal of Environment Sciences E-ISSN 2319 1414 Detection of Land Use and Land Cover Change around Eti-Osa Coastal Zone, Lagos State, Nigeria using Remote Sensing and GIS Abstract
Urbanization and Sustainable Development of Cities: A Ready Engine to Promote Economic Growth and Cooperation
 Urbanization and Sustainable Development of Cities: A Ready Engine to Promote Economic Growth and Cooperation Wan Portia Hamzah Institute of Strategic and International Studies (ISIS) Malaysia 10 September
PREDICTION OF FUTURE LAND USE LAND COVER CHANGES OF VIJAYAWADA CITY USING REMOTE SENSING AND GIS
 PREDICTION OF FUTURE LAND USE LAND COVER CHANGES OF VIJAYAWADA CITY USING REMOTE SENSING AND GIS K. Sundara Kumar 1 *, N V A Sai Sankar Valasala 2, J V Subrahmanyam V 3, Mounika Mallampati 4 Kowsharajaha
Available online at ScienceDirect. Procedia Environmental Sciences 30 (2015 )
") Available online at www.sciencedirect.com ScienceDirect Procedia Environmental Sciences 30 (2015 ) 238 243 International Conference on Environmental Forensics 2015 (ienforce2015) Measuring land cover change
Available online at www.sciencedirect.com ScienceDirect Procedia Environmental Sciences 30 (2015 ) 238 243 International Conference on Environmental Forensics 2015 (ienforce2015) Measuring land cover change
Land Use/Land Cover Mapping in and around South Chennai Using Remote Sensing and GIS Techniques ABSTRACT
 Land Use/Land Cover Mapping in and around South Chennai Using Remote Sensing and GIS Techniques *K. Ilayaraja, Abhishek Singh, Dhiraj Jha, Kriezo Kiso, Amson Bharath institute of Science and Technology
Preparation of LULC map from GE images for GIS based Urban Hydrological Modeling
 International Conference on Modeling Tools for Sustainable Water Resources Management Department of Civil Engineering, Indian Institute of Technology Hyderabad: 28-29 December 2014 Abstract Preparation
Using Geographic Information Systems and Remote Sensing Technology to Analyze Land Use Change in Harbin, China from 2005 to 2015
 Using Geographic Information Systems and Remote Sensing Technology to Analyze Land Use Change in Harbin, China from 2005 to 2015 Yi Zhu Department of Resource Analysis, Saint Mary s University of Minnesota,
The National Spatial Strategy
 Purpose of this Consultation Paper This paper seeks the views of a wide range of bodies, interests and members of the public on the issues which the National Spatial Strategy should address. These views
AssessmentofUrbanHeatIslandUHIusingRemoteSensingandGIS
 Global Journal of HUMANSOCIAL SCIENCE: B Geography, GeoSciences, Environmental Science & Disaster Management Volume 16 Issue 2 Version 1.0 Type: Double Blind Peer Reviewed International Research Journal
Landscape analysis of urban growth patterns in Seremban, Malaysia, using spatio-temporal data
 IOP Conference Series: Earth and Environmental Science PAPER OPEN ACCESS Landscape analysis of urban growth patterns in Seremban, Malaysia, using spatio-temporal data To cite this article: Maher M Aburas
Yanbo Huang and Guy Fipps, P.E. 2. August 25, 2006
 Landsat Satellite Multi-Spectral Image Classification of Land Cover Change for GIS-Based Urbanization Analysis in Irrigation Districts: Evaluation in Low Rio Grande Valley 1 by Yanbo Huang and Guy Fipps,
Land Use/Cover Changes & Modeling Urban Expansion of Nairobi City
 Land Use/Cover Changes & Modeling Urban Expansion of Nairobi City Overview Introduction Objectives Land use/cover changes Modeling with Cellular Automata Conclusions Introduction Urban land use/cover types
INVESTIGATION LAND USE CHANGES IN MEGACITY ISTANBUL BETWEEN THE YEARS BY USING DIFFERENT TYPES OF SPATIAL DATA
 INVESTIGATION LAND USE CHANGES IN MEGACITY ISTANBUL BETWEEN THE YEARS 1903-2010 BY USING DIFFERENT TYPES OF SPATIAL DATA T. Murat Celikoyan, Elif Sertel, Dursun Zafer Seker, Sinasi Kaya, Uğur Alganci ITU,
Spatio-temporal dynamics of the urban fringe landscapes
 Spatio-temporal dynamics of the urban fringe landscapes Yulia Grinblat 1, 2 1 The Porter School of Environmental Studies, Tel Aviv University 2 Department of Geography and Human Environment, Tel Aviv University
SPATIAL CHANGE ANALISYS BASED ON NDVI VALUES USING LANDSAT DATA: CASE STUDY IN TETOVO, MACEDONIA
 Physical Geography; Cartography; Geographic Information Systems & Spatial Planing SPATIAL CHANGE ANALISYS BASED ON NDVI VALUES USING LANDSAT DATA: CASE STUDY IN TETOVO, MACEDONIA DOI: http://dx.doi.org/10.18509/gbp.2016.11
APPLICATION OF LAND CHANGE MODELER FOR PREDICTION OF FUTURE LAND USE LAND COVER A CASE STUDY OF VIJAYAWADA CITY
 APPLICATION OF LAND CHANGE MODELER FOR PREDICTION OF FUTURE LAND USE LAND COVER A CASE STUDY OF VIJAYAWADA CITY K. Sundara Kumar 1, Dr. P. Udaya Bhaskar 2, Dr. K. Padmakumari 3 1 Research Scholar, 2,3
RESULT. 4.1 Temporal Land use / Land Cover (LULC) inventory and Change Analysis
 inventory and Change Analysis") Chapter 4 RESULTS RESULT 4.1 Temporal Land use / Land Cover (LULC) inventory and Change Analysis The LULC maps of each study period were prepared by digital supervised classification of Landsat TM satellite
Chapter 4 RESULTS RESULT 4.1 Temporal Land use / Land Cover (LULC) inventory and Change Analysis The LULC maps of each study period were prepared by digital supervised classification of Landsat TM satellite
Quantifying Land Use/Cover Dynamics of Nainital Town (India) Using Remote Sensing and GIS Techniques
 Using Remote Sensing and GIS Techniques") Quantifying Land Use/Cover Dynamics of Nainital Town (India) Using Remote Sensing and GIS Techniques Jiwan Rawat 1*, Vivekananda Biswas 1 and Manish Kumar 1 1 Centre of Excellence for NRDMS in Uttarakhand,
Quantifying Land Use/Cover Dynamics of Nainital Town (India) Using Remote Sensing and GIS Techniques Jiwan Rawat 1*, Vivekananda Biswas 1 and Manish Kumar 1 1 Centre of Excellence for NRDMS in Uttarakhand,
An Internet-based Agricultural Land Use Trends Visualization System (AgLuT)
") An Internet-based Agricultural Land Use Trends Visualization System (AgLuT) Second half yearly report 01-01-2001-06-30-2001 Prepared for Missouri Department of Natural Resources Missouri Department of
An Internet-based Agricultural Land Use Trends Visualization System (AgLuT) Second half yearly report 01-01-2001-06-30-2001 Prepared for Missouri Department of Natural Resources Missouri Department of
CHANGES IN VIJAYAWADA CITY BY REMOTE SENSING AND GIS
 International Journal of Civil Engineering and Technology (IJCIET) Volume 8, Issue 5, May 2017, pp.217 223, Article ID: IJCIET_08_05_025 Available online at http://www.ia aeme.com/ijciet/issues.asp?jtype=ijciet&vtyp
Modeling Un-authorized Land Use Sprawl with Integrated Remote Sensing-GIS Technique and Cellular Automata
 Modeling Un-authorized Land Use Sprawl with Integrated Remote Sensing-GIS Technique and Cellular Automata Norzailawati Mohd. Noor and Mazlan Hashim Department of Remote Sensing, Faculty of Geoinformation
Urban Expansion of the City Kolkata since last 25 years using Remote Sensing
 [ VOLUME 5 I ISSUE 2 I APRIL JUNE 2018] E ISSN 2348 1269, PRINT ISSN 2349-5138 Urban Expansion of the City Kolkata since last 25 years using Remote Sensing Soumita Banerjee Researcher, Faculty Council
MAPPING LAND USE/ LAND COVER OF WEST GODAVARI DISTRICT USING NDVI TECHNIQUES AND GIS Anusha. B 1, Sridhar. P 2
 MAPPING LAND USE/ LAND COVER OF WEST GODAVARI DISTRICT USING NDVI TECHNIQUES AND GIS Anusha. B 1, Sridhar. P 2 1 M. Tech. Student, Department of Geoinformatics, SVECW, Bhimavaram, A.P, India 2 Assistant
Urban Growth Analysis In Akure Metropolis
 Urban Growth Analysis In Akure Metropolis Olaoluwa A. Idayat, Samson A. Samuel, Muibi K.H, Ogbole John, Alaga A, T., Ajayi Victoria Abstract: Urban Land use changes, quantification and the analysis of
Urban Process and Future Development of Colombo Metropolitan Area, Sri Lanka: An Application of Geospatial Techniques
 Urban Process and Future Development of Colombo Metropolitan Area, Sri Lanka: An Application of Geospatial Techniques January 2017 Suwandaralalage Indika Shyamantha SUBASINGHE Urban Process and Future
A Review of Concept of Peri-urban Area & Its Identification
 A Review of Concept of Peri-urban Area & Its Identification Ar. Manita Saxena Research Scholar Department of Architecture and Planning M.A.N.I.T, Bhopal Dr. Supriya Vyas Assistant Professor, Department
Environmental Impact Assessment Land Use and Land Cover CISMHE 7.1 INTRODUCTION
 7 LAND USE AND LAND COVER 7.1 INTRODUCTION The knowledge of land use and land cover is important for many planning and management activities as it is considered an essential element for modeling and understanding
Geospatial Information for Urban Sprawl Planning and Policies Implementation in Developing Country s NCR Region: A Study of NOIDA City, India
 Geospatial Information for Urban Sprawl Planning and Policies Implementation in Developing Country s NCR Region: A Study of NOIDA City, India Dr. Madan Mohan Assistant Professor & Principal Investigator,
LAND USE AND LAND COVER CHANGES AND URBAN SPRAWL IN RIYADH, SAUDI ARABIA: AN ANALYSIS USING MULTI-TEMPORAL LANDSAT DATA AND SHANNON'S ENTROPY INDEX
 LAND USE AND LAND COVER CHANGES AND URBAN SPRAWL IN RIYADH, SAUDI ARABIA: AN ANALYSIS USING MULTI-TEMPORAL LANDSAT DATA AND SHANNON'S ENTROPY INDEX M. T. Rahman a a King Fahd University of Petroleum and
Landuse/Landcover Change Detection in Umshing- Mawkynroh of East Khasi Hills District, Meghalaya Using Spatial Information Technology
 International Journal of Scientific and Research Publications, Volume 6, Issue 1, January 2016 197 Landuse/Landcover Change Detection in Umshing- Mawkynroh of East Khasi Hills District, Meghalaya Using
Modeling urban growth pattern for sustainable archaeological sites: A case study in Siem Reap, Cambodia
 Modeling urban growth pattern for sustainable archaeological sites: A case study in Siem Reap, CHANVOLEAK OURNG; DANIEL S. RODRIGUES; LÍGIA T. SILVA; RUI A. R. RAMOS Engineering School Department of Civil
Quick Response Report #126 Hurricane Floyd Flood Mapping Integrating Landsat 7 TM Satellite Imagery and DEM Data
 Quick Response Report #126 Hurricane Floyd Flood Mapping Integrating Landsat 7 TM Satellite Imagery and DEM Data Jeffrey D. Colby Yong Wang Karen Mulcahy Department of Geography East Carolina University
Monitoring and Change Detection along the Eastern Side of Qena Bend, Nile Valley, Egypt Using GIS and Remote Sensing
 Advances in Remote Sensing, 2013, 2, 276-281 http://dx.doi.org/10.4236/ars.2013.23030 Published Online September 2013 (http://www.scirp.org/journal/ars) Monitoring and Change Detection along the Eastern
Mapping Land Use Changing and Urban Growth Using Landsat Data (Study Area: Pekan, Pahang State, Malaysia)
") Mapping Land Use Changing and Urban Growth Using Landsat Data (Study Area: Pekan, Pahang State, Malaysia) 1 Mohamad Eliyass Bin Jamaruppin, 1,3* Luhur Bayuaji, 1 Ngahzaifa Ab Ghani, 4 Farid Wajdi Akashah,
Mapping Land Use Changing and Urban Growth Using Landsat Data (Study Area: Pekan, Pahang State, Malaysia) 1 Mohamad Eliyass Bin Jamaruppin, 1,3* Luhur Bayuaji, 1 Ngahzaifa Ab Ghani, 4 Farid Wajdi Akashah,
Spatial Analysis and Modeling of Urban Land Use Changes in Lusaka, Zambia: A Case Study of a Rapidly Urbanizing Sub- Saharan African City
 Spatial Analysis and Modeling of Urban Land Use Changes in Lusaka, Zambia: A Case Study of a Rapidly Urbanizing Sub- Saharan African City January 2018 Matamyo SIMWANDA Spatial Analysis and Modeling of
Digital Change Detection Using Remotely Sensed Data for Monitoring Green Space Destruction in Tabriz
 Int. J. Environ. Res. 1 (1): 35-41, Winter 2007 ISSN:1735-6865 Graduate Faculty of Environment University of Tehran Digital Change Detection Using Remotely Sensed Data for Monitoring Green Space Destruction
Links between socio-economic and ethnic segregation at different spatial scales: a comparison between The Netherlands and Belgium
 Links between socio-economic and ethnic segregation at different spatial scales: a comparison between The Netherlands and Belgium Bart Sleutjes₁ & Rafael Costa₂ ₁ Netherlands Interdisciplinary Demographic
Land cover/land use mapping and cha Mongolian plateau using remote sens. Title. Author(s) Bagan, Hasi; Yamagata, Yoshiki. Citation Japan.
 Bagan, Hasi; Yamagata, Yoshiki. Citation Japan.") Title Land cover/land use mapping and cha Mongolian plateau using remote sens Author(s) Bagan, Hasi; Yamagata, Yoshiki International Symposium on "The Imp Citation Region Specific Systems". 6 Nove Japan.
Title Land cover/land use mapping and cha Mongolian plateau using remote sens Author(s) Bagan, Hasi; Yamagata, Yoshiki International Symposium on "The Imp Citation Region Specific Systems". 6 Nove Japan.
INTERNATIONAL JOURNAL OF GEOMATICS AND GEOSCIENCES Volume 4, No 1, 2013
 INTERNATIONAL JOURNAL OF GEOMATICS AND GEOSCIENCES Volume 4, No 1, 2013 Copyright 2010 All rights reserved Integrated Publishing services Research article ISSN 0976 4380 Spatio-temporal analysis of land
Urban Area Delineation Using Pattern Recognition Technique
 Cloud Publications International Journal of Advanced Remote Sensing and GIS 2018, Volume 7, Issue 1, pp. 2466-2470 ISSN 2320 0243, Crossref: 10.23953/cloud.ijarsg.333 Methodology Article Urban Area Delineation
Analysis of Urban Surface Biophysical Descriptors and Land Surface Temperature Variations in Jimeta City, Nigeria
 Global Journal of Human Social Science Vol. 10 Issue 1 (Ver 1.0), April 2010 Page 19 Analysis of Urban Surface Biophysical Descriptors and Land Surface Temperature Variations in Jimeta City, Nigeria Ambrose
Remote Sensing and GIS Techniques for Monitoring Industrial Wastes for Baghdad City
 The 1 st Regional Conference of Eng. Sci. NUCEJ Spatial ISSUE vol.11,no.3, 2008 pp 357-365 Remote Sensing and GIS Techniques for Monitoring Industrial Wastes for Baghdad City Mohammad Ali Al-Hashimi University
Most people used to live like this
 Urbanization Most people used to live like this Increasingly people live like this. For the first time in history, there are now more urban residents than rural residents. Land Cover & Land Use Land cover
Study of Land Use and Land Cover of Chaksu block, Jaipur through Remote Sensing and GIS
 Study of Land Use and Land Cover of Chaksu block, Jaipur through Remote Sensing and GIS Ruchi Middha *, Sonal Jain* and Shelja K.Juneja ** *RESEARCH SCHOLAR, ENVIRONMENTAL SCIENCE, THE IIS UNIVERSITY,
IMPACT OF URBAN EVOLUTION ON LAND-USE CHANGE OF SARGODHA CITY, PAKISTAN
 Impact of Urban Evolution on Land-Use Change of Sargodha City in Pakistan J. Sc. & Tech. Univ. Peshawar, 2015, 39 (2), 29-36. IMPACT OF URBAN EVOLUTION ON LAND-USE CHANGE OF SARGODHA CITY, PAKISTAN SAJJAD
Global City Definition
 Regional Training Workshop on Human Settlement Indicators Global City Definition Dennis Mwaniki Global Urban Observatory, Research and Capacity Development Branch, UN-Habitat Bangkok, Thailand Outline
Modeling and Predicting of Future Urban Growth in the Charleston, South Carolina Area
 Modeling and Predicting of Future Urban Growth in the Charleston, South Carolina Area Jeffery Allen Testimony presented to the U.S. Commission on Ocean Policy January 15, 2002 Charleston, South Carolina
Remote Sensing the Urban Landscape
 Remote Sensing the Urban Landscape Urban landscape are composed of a diverse assemblage of materials (concrete, asphalt, metal, plastic, shingles, glass, water, grass, shrubbery, trees, and soil) arranged
Brazil Paper for the. Second Preparatory Meeting of the Proposed United Nations Committee of Experts on Global Geographic Information Management
 Brazil Paper for the Second Preparatory Meeting of the Proposed United Nations Committee of Experts on Global Geographic Information Management on Data Integration Introduction The quick development of
Dynamic Expansion and Urbanization of Greater Cairo Metropolis, Egypt Ahmed Abdelhalim M. Hassan
 Ahmed Abdelhalim M. Hassan (MSc Ahmed Abdelhalim M. Hassan, Institue of Landscape Ecology, Muenster University, Robert-Koch Straße 28, D-48149 Münster, Germany, ahmedahalim@uni-muenster.de) 1 ABSTRACT
Measuring Urban Sprawl A Case Study of China
 Institute for Regional Development Planning, University of Stuttgart Applying Remote Sensing and GIS on Monitoring and Measuring Urban Sprawl A Case Study of China Outline Research hbackground and dobjectives
West meets East: Monitoring and modeling urbanization in China Land Cover-Land Use Change Program Science Team Meeting April 3, 2012
 West meets East: Monitoring and modeling urbanization in China Land Cover-Land Use Change Program Science Team Meeting April 3, 2012 Annemarie Schneider Center for Sustainability and the Global Environment,
Object-based classification of residential land use within Accra, Ghana based on QuickBird satellite data
 International Journal of Remote Sensing Vol. 28, No. 22, 20 November 2007, 5167 5173 Letter Object-based classification of residential land use within Accra, Ghana based on QuickBird satellite data D.
A Method to Improve the Accuracy of Remote Sensing Data Classification by Exploiting the Multi-Scale Properties in the Scene
 Proceedings of the 8th International Symposium on Spatial Accuracy Assessment in Natural Resources and Environmental Sciences Shanghai, P. R. China, June 25-27, 2008, pp. 183-188 A Method to Improve the
CHAPTER 1 INTRODUCTION
 1 CHAPTER 1 INTRODUCTION 1.1 Background of the study 1.1.1 Urban growth and its global importance Urbanization and climate change are two environmental phenomen of the 21st century, and these two processes
An Internet-based Agricultural Land Use Trends Visualization System (AgLuT)
") An Internet-based Agricultural Land Use Trends Visualization System (AgLuT) Prepared for Missouri Department of Natural Resources Missouri Department of Conservation 07-01-2000-12-31-2001 Submitted by
An Internet-based Agricultural Land Use Trends Visualization System (AgLuT) Prepared for Missouri Department of Natural Resources Missouri Department of Conservation 07-01-2000-12-31-2001 Submitted by
Donatas Burneika, Ruta Ubareviciene (Institute of geology and geography, Vilnius)
") The economic crisis and development of Vilnius urban region spatial aspects Donatas Burneika, Ruta Ubareviciene (Institute of geology and geography, Vilnius) Main aim The aim of the presentation is to
The economic crisis and development of Vilnius urban region spatial aspects Donatas Burneika, Ruta Ubareviciene (Institute of geology and geography, Vilnius) Main aim The aim of the presentation is to
USING LANDSAT IN A GIS WORLD
 USING LANDSAT IN A GIS WORLD RACHEL MK HEADLEY; PHD, PMP STEM LIAISON, ACADEMIC AFFAIRS BLACK HILLS STATE UNIVERSITY This material is based upon work supported by the National Science Foundation under
The Positional and Thematic Accuracy for Analysis of Multi-Temporal Satellite Images on Mangrove Areas
 The Positional and Thematic Accuracy for Analysis of Multi-Temporal Satellite Images on Mangrove Areas Paulo Rodrigo Zanin¹, Carlos Antonio O. Vieira² ¹Universidade Federal de Santa Catarina, Campus Universitário
DEPARTMENT OF GEOGRAPHY B.A. PROGRAMME COURSE DESCRIPTION
 DEPARTMENT OF GEOGRAPHY B.A. PROGRAMME COURSE DESCRIPTION (3 Cr. Hrs) (2340100) Geography of Jordan (University Requirement) This Course pursues the following objectives: - The study the physical geographical
UNITED NATIONS E/CONF.96/CRP. 5
 UNITED NATIONS E/CONF.96/CRP. 5 ECONOMIC AND SOCIAL COUNCIL Eighth United Nations Regional Cartographic Conference for the Americas New York, 27 June -1 July 2005 Item 5 of the provisional agenda* COUNTRY
Analysis of Landuse, Landcover Change and Urban Expansion in Akure, Nigeria (pp )
") Journal of Innovative Research in Engineering and Sciences 2(4), June, 2011. ISSN : 2141-8225. http://www.grpjournal.org. Printed in Nigeria. All rights researved. Global Research Publishing, 2011. Analysis
Journal of Innovative Research in Engineering and Sciences 2(4), June, 2011. ISSN : 2141-8225. http://www.grpjournal.org. Printed in Nigeria. All rights researved. Global Research Publishing, 2011. Analysis
RECENT DECLINE IN WATER BODIES IN KOLKATA AND SURROUNDINGS Subhanil Guha Department of Geography, Dinabandhu Andrews College, Kolkata, West Bengal
 International Journal of Science, Environment and Technology, Vol. 5, No 3, 2016, 1083 1091 ISSN 2278-3687 (O) 2277-663X (P) RECENT DECLINE IN WATER BODIES IN KOLKATA AND SURROUNDINGS Subhanil Guha Department
AP Human Geography Free-response Questions
 AP Human Geography Free-response Questions 2000-2010 2000-preliminary test 1. A student concludes from maps of world languages and religions that Western Europe has greater cultural diversity than the
Geospatial technology for land cover analysis
 Home Articles Application Environment & Climate Conservation & monitoring Published in : Middle East & Africa Geospatial Digest November 2013 Lemenkova Polina Charles University in Prague, Faculty of Science,
Spatiotemporal dynamics of land use pattern response to urbanization in Biratnagar Sub- Metropolitan City, Nepal.
 Spatiotemporal dynamics of land use pattern response to urbanization in Biratnagar Sub- Metropolitan City, Nepal. Dr. Bhagawat Rimal, GIS Expertise Specialist / Urban Development and Land use change Everest
Advanced Image Analysis in Disaster Response
 Advanced Image Analysis in Disaster Response Creating Geographic Knowledge Thomas Harris ITT The information contained in this document pertains to software products and services that are subject to the
Comparative Analysis of Supervised and
 Applied Mathematical Sciences, Vol.,, no., 68-69 HIKARI Ltd, www.m-hikari.com http://dx.doi.org/.988/ams.. Comparative Analysis of Supervised and Unsupervised Classification on Multispectral Data Asmala
Contents. Introduction Study area Data and Methodology Results Conclusions
 Modelling Spatial Changes in Suburban Areas of Istanbul Using Landsat 5 TM Data Şinasi Kaya(Assoc. Prof. Dr. ITU) Elif Sertel(Assoc. Prof. Dr. ITU) Dursun Z. Şeker(Prof. Dr. ITU) 1 Contents Introduction