RESULT. 4.1 Temporal Land use / Land Cover (LULC) inventory and Change Analysis
|
|
|
- Dennis Carter
- 5 years ago
- Views:
Transcription
1 Chapter 4 RESULTS
 inventory and Change Analysis The LULC maps of each study period were prepared by digital supervised classification of Landsat TM satellite data using ground")
2 RESULT 4.1 Temporal Land use / Land Cover (LULC) inventory and Change Analysis The LULC maps of each study period were prepared by digital supervised classification of Landsat TM satellite data using ground truth and ancillary information s. Satellite standard FCC images of the study area for the year 1995, 2000, 2005 and 2010 are presented in Figure Eleven LULC classes viz. Dense Forest, Medium to Fairly Dense Forest, Open Forest, Terrace Agriculture, Valley Agriculture, Bush/Scrub, Grass Land, Waste land, Water Body, Wetland and Built-up Land were identified and mapped following digital supervised classification. Figure 14: Standard FCC images of the study area of 1995, 2000, 2005 and
3 The LULC maps for the year 1995 and 2000 are presented in Figure-15 and for the year 2005 and 2010 are shown in Figure-16. Figure 15: LULC map of the study area of 1995 and
4 Figure 16: LULC map of the study area of 2005 and
5 To assess the classification accuracy of LULC map, a confusion matrix method was employed. The data pertaining accuracy assessments of LULC maps are presented in Table-16. Overall classification accuracy and Kappa value for all the four time period LULC maps was greater than 85% and 0.85 or more, respectively. In assessing LULC classification accuracy, it was observed that Water Body and Wetland provided the highest producer s accuracy and user s accuracy of 100%. While for forest and agriculture categories % producer s accuracy and % user s accuracy, respectively were observed. The lower producer s accuracy and user s accuracy below 66-85% were observed for Waste Land, Bush / Scrub Land, Grass Land and Built up Land LULC classes. Table 16: Accuracy assessments of classified LULC maps (1995, 2000, 2005 and 2010) LULC classes PA UA PA UA PA UA PA UA Dense Forest Medium to Fairly Dense Forest Open Forest Terrace Agriculture Valley Agriculture Bush/Scrub Grass Land Waste Land Water Body Wetland Built-up land Year Overall Classification Accuracy Overall Kappa Statistics (Note: PA = Producer Accuracy and UA = User Accuracy) 66
6 Area Statistics of Temporal LULC Maps The area statistics of LULC of the area (Phewa lake watershed) for the study periods are presented in Table-17 and Figure-17. Terraces Agriculture, Dense Forest, Medium to Fairly Dense Forest were the most dominant land use/land cover classes covering more than 75 % of the study area (Phewa Lake Watershed). The LULC in the watershed have undergone significant changes and conversions over the study years. In 1995, Terrace Agriculture, Dense Forest and Medium to Fairly Dense Forest constituted a relatively large proportion, %, 20.52% and 13.53% of the watershed, respectively. Relatively considerable areas were covered by Open Forest (2.30%), Valley Agriculture (8.95%), Bush /Scrub (0.71%), Grass Land (0.75%), Waste Land (1.55%), Water Body (4.41%), Wetland (1.08%) and Built-up Land (1.67%) in the year The spatial extents of LULC classes in 1995 were considered as a baseline for change detection analysis. Terrace Agriculture Land is found in nearby sloppy area of villages viz. Kaskikot, Sarangkot, Dhikurpokhari, Bhadaure and Chapakot. Dense Forest is the second most dominant land use/ land cover types in the watershed. This area is locked on the upper part in Bhadaure, Pumdi Bhumdi, Chapakot and the boarder of Dhikurpokhari and small portion in Kaskikot villages. Another important LULC cover type is Medium to Fairly Dense Forest and this kind of forest was dominant at Bhadaure Tamagi villages. Similarly, on the area of Sarangkot, Kaskikot and Chapakot, and few patches on Dhikurpokhari villages and some patches in nearby Pokhara city area, Medium to Fairly Dense Forest LULC class was dominant. Open Forest was dominant on Dhikurpokhari, Sarangkot villages and few patches on Chapakot found around the road side of Pame, and nearby valley and nearby village areas. Valley Agriculture Land located mainly in adjoining areas of Pokhara city and lacustrine plains of the area near Pame, and Thulakhet villages. Water Body LULC class including Phewa Lake occupies greatest part of water bodies. Bush / Scrub land found in upper belt of Dhikurpokhari, kaskikot, Bhadaure, Chapakot villages and few patches in valley. Immediate adjoining areas of Phewa Lake, Harpan Khola river and its tributaries are the main areas occupied with Waste Land. Likewise, Built-up area is another important LULC class in the study periods. Major Built up area is in Pokhara Sub-metropolitan city. Minor LULC classes viz. Wetland and Grass Land covered ha (1.08%), and ha (0.75%), respectively. Like LULC map of 1995, the LULC map after five years i.e. in 2000, the areas of LULC classes viz. Terrace Agriculture Land, Dense and Medium to Fairly Dense Forests were also most dominant LULC classes. 67
7 Table 17: Area statistics of LULC classes for the study periods LULC Class Area (ha) % Area (ha) % Area (ha) % Area (ha) % Dense Forest Medium to Fairly Dense Forest Open Forest Terrace Agriculture Valley Agriculture Bush/Scrub Land Grass Land Waste Land Water Body Wetland Built-up Land Total
8 In LULC map of 2000, the areas under different LULC classes were - Dense Forest ha (18.61%), Medium to Fairly Dense Forest ha (13.88%), Terrace Agriculture Land ha (44.13%), Open Forest (2.53), Valley Agriculture (8.21%), Bush/Scrub land (1.71%), Grass Land ha (0.67%), Waste Land ha (2.35%), Water Body ha (4.27%), Wetland ha (1.01%) and Built-up Land ha (2.64%). About 75% percentage of the total area of the watershed was occupied by these types of LULC classes. Wetland, Bush / Scrub Land, Grass Land and Waste Land area were the minor LULC classes covering 5.74% of the study area. Major part of Terrace Agriculture and Dense Forest was found in nearby area of village s viz. Dhikurpokhari, Bhadure, Chapakot and Bhumdi, While Medium to Fairly Dense Forest and Open Forest was locked in Kaskikot, Sarangkot, Chapaokot and Bhadaure villages in the year In 2000 after five years from 1995, Dense Forest, Terrace Agriculture and Valley Agriculture declined to 18.61%, 44.13% and 8.21%, respectively. Medium to Fairly Dense Forest, Open Forest, Bush/Scrub and Built-up land increased to 13.88%, 2.53%, 1.71% and 2.64%, respectively. Grass land, Water Body and wetland, had shown a relatively small decline of 0.67%, 4.27% and 1.01%, respectively while Waste Land area had slightly increase (2.35%) during this period. LULC map of 2005 also showed that in the watershed Terrace Agriculture Land, Dense and Medium to Fairly Dense Forest were the dominant LULC classes covering more than 75% of the study area. Wetland, Bush/Scrub Land, Grass Land, Valley Agriculture and Waste Land area were the minor LULC classes. Similarly in 2005, Terrace Agriculture was found in the sloppy area of all villages and Dense Forest in upper part of Bhadure, Bhumdi and Boarder of Dhikurpokhari while Open Forest and Medium to Fairly Dense Forest was locked in centre portion of Dhikurpokhari, Bhadure, Chapkot, Kaskikot and Sarangkot villages in 2005 and Terrace Agriculture Land is the most dominant LULC class occupying ha (43.66%) area. After Terrace Agriculture Land, Dense Forest and Medium to Fairly Dense Forest are the other dominant LULC types. These LULC types cover ha (17.37%) and ha (14.30%) area, respectively. Another important land use/land cover is Open Forest which accounts for ha area (2.92%) of the watershed. Valley Agriculture Land and Water Body cover ha area (7.12%) and ha area (4.14%), respectively. Phewa Lake shares the large portion of Water Body. Built-up area is a notable land use type in 2005 that contained hectares (3.68%) now days it extends in Pokhara Sub-metropolitan city. Bush/Scrub Land was another 69
9 Area (%) important LULC which occupied ha (2.57%) area of upper part of Kaskikot, Dhikurpokhari and Bhadaure villages. Also Waste Land occupied ha (2.82%) which is extended to Harpankhola and its tributaries river. Out of the total area, Wetland covers ha (0.93%) area of west part of Phewa Lake, Similarly, ha (0.5%) area covered by Grass Land. After 15 years in 2010, Dense Forest, Terrace Agriculture and Valley Agriculture declined to 15.62%, 43.23% and 6.04% of the watershed, respectively. Medium to Fairly Dense Forest, Open Forest, Bush/Scrub and Built-up land increased to 14.68%, 3.32%, 3.30% and 5.14% of the watershed, respectively. While, Grass land, Water Body and wetland, have shown a relatively small decline 0.28%, 4.05% and 0.9%, respectively. On the other hand, Waste Land has increased 3.46% during this period. The results of LULC distribution in 1995, 2000, 2005 and 2010 showed that Terrace Agriculture, Dense Forest and Medium to Fairly Dense Forest were the dominant LULC category. Overall, Medium to Fairly Dense Forest, Open Forest, Waste Land, Bush/Scrub and Built-up Land increased, whereas other land uses such as Dense Forest, Terrace Agriculture Land, Valley Agriculture Land, Grass Land, Water Body and Wetland decreased significantly during all periods DF MF OF TA VA BA GS WS WB WE BU LULC Classes Figure 17: Area statistics of LULC classes for the study periods 70
. 4.1.2 Temporal LULC Change Analysis Temporal LULC change analysis was carried out for 5 year intervals (1995-2000, 2000-2005 and 2005-2010) as well as 15 year interval (1995 2010).")
10 (Note: DF=Dense Forest, MF=Medium to Fairly Dense Forest, OF=Open Forest, TA =Terrace Agriculture, VA=Valley Agriculture, BA=Bush/Scrub land, GS=Grass Land, WS=Waste Land, WB=Water Body, WE=Wetland, BU=Built-up Land) Temporal LULC Change Analysis Temporal LULC change analysis was carried out for 5 year intervals ( , and ) as well as 15 year interval ( ). The rate of change of each LULC class can provide the information on the trend of conversion with respect to time. It also allows us to make a comparison among the different classes and to provide inputs for the LULC change prediction model. As a result the land use/land cover map of the four periods was analyzed based on rate of change. The LULC change maps of , , and are presented in Figure-18 and LULC change statistics of the study periods are tabulated in Table-18. Figure 18: LULC Change Maps of Phewa Lake Watersheds 71
11 Change in Area (%) Table 18: Area statistics of LULC change in the watershed (% area) The patterns of LULC changes in the study periods are illustrated in Figure DF MF OF TA VA BA GS WS WB WE BU Figure 19: Rate of LULC Change for Four Periods 72
.")
12 (Note: DF=Dense Forest, MF=Medium to Fairly Dense Forest, OF=Open Forest, TA=Terrace Agriculture, VA=Valley Agriculture, BA=Bush/Scrub Land, GS=Grass Land, WS=Waste Land, WB=Water Body, WE=Wetland, BU=Built-up Land). The data in Table 18 and Figure 19 indicated that Medium to Fairly Dense Forest, Open Forest, Waste Land, Bush/Scrub and Built-up Land have exhibited a positive rate of change for all the change study periods. On the contrary, Dense Forest, Terrace Agriculture, Valley Agriculture; Grass Land, Water Body and Wetland experienced a negative change in all change study periods. The rates of LULC changes were found high in Dense Forest, Medium to Fairly Dense Forest, Built-up, Terrace Agriculture, Valley agriculture Land, Waste Land, Bush/ Scrub and Open Forest. Relative less LULC change was also observed in Grass Land and Wetland categories. The percentage rate changes of area statistics in Dense Forest, Waste Land, Bush/Scrub and Wetland classes during 1995 to 2000 were high when compared with change between 2000 and 2005 and 2005 and 2010; while Open Forest, Valley Agriculture and Grass Land was higher in 2005 and Also the change of Medium to Fairly Dense Forest and Terrace Agriculture were observed high in 2000 to However, the rate of change of area statistics was observed highest in 1995 to 2010 for all LULC categories. The LULC change dynamics were also critically assessed using LULC change matrixes of the change study periods viz to 2000, 2000 to 2005, 2005 to 2010 and 1995 to The change and no change matrix of the study periods are presented in Tables 19, 20, 21 and 22 for , , and , respectively. Table 19: Change no change matrix of LULC change from 1995 to


13 Table 20: Change no change matrix of LULC change from 2000 to 2005 Table 21: Change no change matrix of LULC change from 2005 to 2010 Table 22: Change no change matrix of LULC change from 1995 to
14 (Note: DF=Dense Forest, MF=Medium to Fairly Dense Forest, OF=Open Forest, TA=Terrace Agriculture, VA=Valley Agriculture, BA=Bush/Scrub Land, GS=Grass Land, WS=Waste Land, WB=Water Body, WT=Wetland and BU=Built-up Land). Conversion of Dense Forest to other Land Use: ha of Dense Forest have converted into other LULC classes during the period 1995 to ha of Dense Forest had been converted into Medium to Fairly Dense Forest, especially in the region of lower belt of Bhadaure Tamagi, of Kaskikot and Dhikurpokhari villages ha and 7.74 ha of Dense Forest converted to Terrace and Valley Agriculture Land, respectively. No change area under Dense Forest was ha. Similarly, from 2000 to 2005, ha, 8.94 ha, and 6.38 ha of Dense Forest changed to Medium to Fairly Dense Forest, Terrace and Valley Agriculture Land, respectively. Also from 2005 to 2010, ha, ha and 1.45 ha of Dense Forest changed to Medium to Fairly Dense Forest, Terrace and Valley Agriculture Land, respectively. Similarly from 1995 to 2010, ha, ha and ha of Dense Forest changed to Medium to Fairly Dense Forest, Terrace and Valley Agriculture Land, respectively. The change of Dense Forest to other LULC classes during all the change periods was found to be practically nil. Conversion of Medium to Fairly Dense Forest to other Land Use: Appreciable areas under Medium to Fairly Dense Forest had been changed into Dense Forest. These types of changes were observed at Panchase, Bhadaure, Dhikurpokhari, Chapakot, Pumdi and Sarangkot villages. Conversion of Medium to Fairly Dense Forest to Dense Forest, Open Forest and agricultural categories were observed in Sarangkot, Dhikurpokhari and Chapakot villages. During change period of , ha, ha, ha and 9.36 ha of Medium to Fairly Dense Forest had been converted into Dense Forest, Open Forest, Terrace Agriculture and Valley Agriculture Land, respectively. Similarly, during 2000 to 2005, ha, ha, 5.76 ha and 4.95 ha of Medium to Fairly Dense Forest changed to Dense Forest, Open Forest, Terrace and Valley Land, respectively. During change period 2005 to 2010, ha, ha, ha and 8.01 ha of Medium to Fairly Dense Forest changed into Dense Forest, Open Forest, Terrace and Valley Agriculture Land, respectively. During 1995 to 2010, ha, ha, ha and ha of Medium to Fairly Dense Forest had been converted into Dense Forest, Open Forest, Terrace and Valley Land, respectively. The change of Medium to Fairly Dense Forest to other land use category such as Grass, Water Body, and Wetland were practically nil in all the change periods. 75
15 Conversion of Open Forest to other Land Use: Open Forest has been changed into Medium to Fairly Dense Forest, Bush/Scrub, Waste, Agricultural and Built-up Land. This change is observed at Panchase Bhadaure, Dhikurpokhari, Chapakot, Pumdi and Sarangkot villages. Conversion of Open Forest to Bush/ Scrub Land has been found in Sarangkot, Dhikurpokhari and Chapakot villages. During period, ha, ha, ha, 0.27 ha and 0.27 ha of Open Forest converted into Medium to Fairly Dense Forest, Terrace, Valley, Waste and Built-up Land, respectively. During 2000 to 2005, ha, ha, ha, 6.81 ha, 1.62 ha and 0.81 ha of Open Forest changed to Medium to Fairly Dense Forest, Terrace, Valley Agricultural Land, Bush/ Scrub, Waste and Built-up Land respectively. Similarly, during 2005 to 2010 period, ha, ha, ha, 8.28 ha, 1.35 ha and 0.72 ha of Open Forest area converted into Medium to Fairly Dense Forest, Terrace, Valley, Bush/Scrub, Waste and Built-up Land, respectively. In similar pattern during 1995 to 2010 period, ha, ha, 2.99 ha, 6.91 ha, 0.63 ha and 0.63 ha of Open Forest has been converted into Medium to Fairly Dense Forest, Terrace, Valley, Bush/Scrub, Waste and Built-up Land, respectively. The conversions of Open Forest to other land use classes were negligible in all the change periods. Conversion of Terrace Agriculture to other Land Use: This type of land use change found in upper region of Phewa Lake watershed ha, ha, ha and ha of Terrace Agriculture Land has been converted into Bush/Scrub, Grass, Waste and Built-up Land during 1995 to 2000 period. Similarly, during 2000 to 2005 period, ha, ha, ha and ha of this class changed to Bush/Scrub, Grass, Waste and Built-up Land, respectively. During change period, , ha, ha, ha, and ha of this class had gone to Bush/Scrub, Grass, Waste Land and Built-up Land, respectively. In the same manner during the period of 1995 to 2010, ha, ha, ha and ha of Terrace Agriculture Land was converted into Bush/Scrub, Grass, Waste and Built-up Land, respectively. The change of Terrace Agriculture Land to other land use category such as, Forest classes, Water Body, Wetland and so on were practically nil in all the change periods. Conversion of Built-up Land to other land use: This type of LULC class consists of Pokhara city area and all villages of the study area. From the data of tables of changed no changed matrices, it was observed that the Build-up area converted to Bush/Scrub, Grass and Waste Land by ha, 2.64 ha and 7.10 ha during , by ha, 2.11 ha and 9.34 ha during , and by ha, 0.62 ha and ha during change period of , 76
16 respectively. Similarly, during change period of 1995 to 2010, ha, 0.86 ha and 8.88 ha of Built-up Land had been converted into Bush/Scrub, Grass and Waste Land, respectively. Conversion of Valley Agriculture Land to other land use: Changed matrix data indicated that this class had been converted to Bush/ Scrub, Grass land, Waste Land, Water Body, Wetland and Built-up Land by ha, 0.54 ha, ha, ha, 5.13 ha and ha, respectively during change period of 1995 to This LULC class changed to Bush/ Scrub, Grass Land, Waste Land, Water Body, Wetland and Built-up Land by ha, 0.18 ha, ha, ha, 4.24 ha and ha, respectively during and ha, 0.10 ha, ha, ha, 4.77 ha and ha, respectively for the change period of Similarly during , ha, 0.31 ha, ha, ha, 1.53 ha and ha of Valley Agriculture Land converted into Bush/ Scrub, Grass, Waste Land, Water Body, Wetland and Built-up Land, respectively. The change of valley agriculture to other LULC lasses was very negligible. The changes of other minor LULC classes such as Bush/Scrub, Grass Land, Waste Land, Water Body and Wetland were very negligible during the all change periods Sub-watershed wise Spatial Distribution LULC Classes Five sub-watersheds considering topographical parameters viz. contour lines and drainage system were delineated in the studied watershed. Among the 12 LULC classes identified and mapped, Terraces Agriculture Land; Dense Forest and Medium to Fairly Dense Forest were the most dominant classes found in all sub-watersheds. The sub-watershed wise area statistics of LULC classes of four study periods (1995, 2000, 2005 and 2010) are presented in Table-23. These sub-watersheds were named as Harpan system (HS), Andheri system (AS), Mid sub-watershed (MS), South Flowing System (SFS) and North Flowing System (NFS) covering area of ha, ha, ha, and ha, respectively Dense Forest: This LULC class is found in all the sub-watersheds while HS subwatershed is occupying large area and minimum of area observed in in SFS sub-watershed in the year Dense Forest covered ha, ha, ha, 0.00 ha, and ha in the sub-watershed of HS, AS, MS, SFS and NFS, respectively in Similarly the areas under Dense Forest in HS, AS, MS, SFS and NFS were, ha, ha, ha, 0.00 ha and ha, respectively during 2000; ha, ha, 71.2 ha and ha, respectively during 2005 and ha, ha, 39.3 ha, 0.00 ha, and ha, respectively during
17 Table - 23: Sub watershed wise area statistics of LULC classes LULC Area(ha) Area(ha) Area(ha) Area(ha) Class HS AS MS SFS NFS HS AS MS SFS NFS HS AS MS SFS NFS HS AS MS SFS NFS DF MF OF TA VA BA GS WS WB WE BU Total Table 24: Sub watershed wise area statistics of changes in LULC classes LULC Area change (ha) Area change (ha) Area change (ha) Area change (ha) Class HS AS MS SFS NFS HS AS MS SFS NFS HS AS MS SFS NFS HS AS MS SFS NFS DF MF OF TA VA BA GS WS WB WE BU (Note: HS= Harpan System, AS=Andheri System, MS=Mid Sub-watershed, SFS=South Flowing System and NFS= North Flowing System, DF=Dense Forest,, MF=Medium to Fairly Dense Forest, OF=Open Forest, TA=Terrace Agriculture, VA=Valley Agriculture, BA=Bush/Scrub Land, GS=Grass Land, WS=Waste Land, WB=Water Body, WE=Wetland, BU=Built-up Land). 78
18 Medium to Fairly Dense Forest: This LULC class occurred in almost all sub-watersheds where MS sub-watershed is occupying maximum area and minimum of area in NFS except HS in the year Data presented in Table 23 showed that Medium to Fairly Dense Forest covered 69.8 ha, ha, ha, ha and ha in HS, AS, MS, SFS and NFS sub-watersheds, respectively during the year 1995; ha, ha, ha, ha, and ha, respectively in LULC 2000; ha, ha, ha, ha and ha, respectively in the year 2005 and ha, ha, ha, ha, and ha, respectively in the year Open Forest: This LULC class is observed in almost all sub-watersheds while AS occupying large area and minimum of area found in NFS in all the study periods. Open Forest occupied 21.5 ha, ha, 26.3 ha, 28.5 ha and 0.0 ha, respectively in the year 1995 and 27.0 ha, ha, 52.1 ha, 54.9 ha and 0.00 ha, respectively in the year 2000 respectively in HS, AS, MS, SFS and NFS. In the year 2005, 35.8 ha, ha, 79.8 ha, 57.7 ha and 0.00 ha, respectively and in the year 2010, 46.5 ha, ha, ha, 60.8 ha and 0.00 ha, respectively were occupied by Open Forest in that sub-watersheds of HS, AS, MS, SFS and NFS. Terrace Agriculture: This LULC class is one of the dominant classes found in all the study periods in all the sub-watersheds. The maximum area under this class found in AS and minimum area observed in NFS at all the periods. In the year 1995, HS, AS, MS, SFS and NFS sub-watersheds covered ha, ha, ha, ha and ha, respectively with Terrace Agriculture. While in the year 2000, Terrace Agriculture covered ha, ha, ha, ha and ha, respectively in the HS, AS, MS, SFS and NFS subwatersheds. In the year 2005 and 2010, Terrace Agriculture covered areas of 1149 ha, ha, ha, ha, 250.9; and ha, ha, ha, ha and ha, respectively in the HS, AS, MS, SFS and NFS sub-watersheds. Valley Agriculture: The maximum and minimum area of this class found in SFS and AS sub-watershed, respectively in all the study periods however minimum area was observed in North in In 1995, HS, AS, MS, SFS and NFS sub- watersheds occupied 42.7 ha, 23.2 ha, ha, ha and 17.6 ha, respectively under valley agriculture while in 2000, these subwatersheds covered 33.4 ha, 13.0 ha, ha, ha and 17.5 ha, respectively with valley agriculture. On the other hand in 2005 and 2010 these sub-watersheds covered 33.0 ha, 12.1 ha, 79
19 317.3 ha, ha, 16.9 ha, respectively and 31.3 ha, 11.6 ha, ha, ha and 14.2 ha, respectively with valley agriculture. Bush / Scrub Land: It is described as a forest where the vegetative canopy cover density is less than 10%. It is the result of both biotic and abiotic pressures. Scrub is a stunted tree or bush/ shrub. This LULC class has been identified in all the sub-watersheds. In 1995 HS, AS, MS, SFS and NFS sub-watersheds covered 20.1 ha, 20.0 ha, 18.0 ha, 17.3 ha and 14.2 ha, respectively with this LULC class, while in 2000 these sub-watersheds, occupied 69.1 ha, 26.6 ha, 62.6 ha, 37.7 ha and 32.6 ha of areas, respectively of Bush/Scrub Land. On the other hand in 2005 and 2010 in these sub-watersheds covered 84.4 ha, 71.4 ha, 87.6 ha, 41.3 ha, 38.9 ha, and 96.5 ha, ha, 90.4 ha, 42.3 ha and 40.3 ha areas, respectively under this LULC class. Overall, Harpan and Andheri sub-watersheds occupied higher and north flowing lesser area in all change periods. Grass Land: This is minor LULC class in the study area with small areal extent and found in all the sub-watersheds in all the study periods. In all the years, NFS sub-watershed this LULC class were not found. Sub-watershed-wise, Grass Land decreased at each five years time interval from 1995 to Waste Land: Waste Land may be described as degraded land which can be brought under vegetative cover with reasonable effort and which is currently under unutilized land. This land is deteriorating due to lack of appropriate water and soil management or on account of natural causes. This minor LULC class was not found in SFS sub-watershed in all study periods. The minimum and maximum area of this class was covered by SFS and MS sub-watersheds, respectively in all the periods. Water Body: Water body is an area of impounded water, and often with a regulated flow of water. It includes man-made lakes / tanks besides natural lakes, rivers and streams. Only the mid sub-watershed (MS) covered this dominant LULC class in all periods in the form of lake, ponds and streams around lacustrine plain. Wetland: Only in the MS, NFS and SFS sub-watersheds this class was found. The maximum area of Wetland class was observed in NFS at all the periods. Overall, the minimum area under this class was found in MS sub-watershed during 2000, 2005 and 2010 but in 1995 minimum area was occupied by SFS sub-watershed. 80
20 Built-up Land: All residential area, industrial, commercial and public built ups; other continuous and non continuous urban fabrics, villages, settlements and related built up areas fall in this category. This class covered all the sub-watersheds in all the study periods. The maximum area under this class found in SFS sub-watershed in all the periods and the areas covered by this class were ha, ha, ha and ha in 1995, 2000, 2005 and 2010, respectively. Similarly the area statistics of this class was observed 8.5 ha, 6.8 ha, 7.4 ha, 3.6 ha; 9.6 ha, 11.8 ha, 10.4 ha, 6.6 ha; 15.0 ha, 13.3 ha, 13.1 ha, 8.0 ha and 19.4 ha, 20.9 ha, 22.1 ha, 9.6 ha in HS, AS, MS and NFS sub-watersheds respectively during the study periods 1995, 2000, 2005 and In this study, sub-watershed wise land use / land cover change analysis was also done with respect to changes in areas of LULC classes between 1995 and 2000, 2000 and 2005, 2005 and 2010 and also between 1995 and The data pertaining to sub-watershed wise changes in LULC classes between , , and are presented in Figure-20 and Table-24. Overall increasing trend was observed for Medium to Fairly Dense Forest, Open Forest, Waste Land, Bush/ Scrub and Built-up Land in all the sub-watersheds in all the change periods. Whereas, LULC classes such as Dense Forest, Terrace Agriculture, Valley Agriculture, Grass Land, Wetland and Water Body showed decreasing trends in all the periods for all the sub-watersheds. Dense Forest is decreased by ha, 6.7 ha ha, 0.00 ha and 9.2 ha in ; 2.3 ha, 14.8 ha, 73.1 ha, 0.00 ha, and 2.8 ha in ; 18.5 ha, 59.1 ha, 31.9 ha, 0.00 and 53.4 ha in and ha, 80.5 ha, ha 0.00 ha and 65.4 ha in in the sub-watersheds of HS, AS, MS, SFS and NFS, respectively. On the other hand, Medium to Fairly Dense Forest and Open Forest are increased by ha, 2.9 ha, 4.0 ha, 4.6 ha, 7.0 ha; and 5.5 ha, 4.3 ha, 25.8 ha, 26.4 ha, 0.0 ha, respectively in ; 4.9 ha, 0.2 ha, 1.6 ha, 8.8 ha and 2.9 ha; and 8.8 ha, 2.8 ha, 27.7 ha 2.8 and 0.0 ha, respectively in ; 6.0 ha, 1.5 ha, 1.7 ha, 21.7 ha, 58.3 ha; and 10.7 ha, 10.8 ha, 21.4 ha, 3.1 ha and 0.0 ha in and ha, 4.6 ha, 7.2 ha, 35.1 ha, 68.2 ha and 25.0 ha, 17.9 ha, 75.0 ha, 32.2 ha, 0.0 ha in in HS, AS, MS, SFS and NFS sub-watershed, respectively. Similarly, Waste Land, Bush/Scrub and Built-up Land is increased by 12.9 ha, 18.2 ha, 47.8 ha, 14.5 ha, 0.00 ha; 49.0 ha, 6.7 ha, 44.6 ha, 24.4 ha, 18.4 ha and 1.2 ha, 5.0 ha, 3.1 ha, 99.0 ha, 3.0 ha in , 0.8 ha, 1.4 ha, 27.8 ha, 30.4 ha, 0.00 ha; 15.3 ha, 44.7 ha, 25.0 ha, 3.6 ha, 6.3 ha and 5.4 ha, 1.5 ha, 81
21 Change in Area (ha) Change in Area (ha) DF MF OF TA VA BA GS WS WB WE BU HS AS MS SFS NFS DF MF OF TA VA BA GS WS WB WE BU HS AS MS SFS NFS
22 Change in Area (ha) DF MF OF TA VA BA GS WS WB WE BU HS AS MS SFS NFS Figure 20: Subwatershed wise LULC change for Four Periods 83
23 (Note: DF=Dense Forest, MF=Medium to Fairly Dense Forest OF=Open Forest, TA=Terrace Agriculture, VA=Valley Agriculture, BA=Bush/Scrub Land, GS=Grass Land, WS=Waste Land, WB=Water Body, WE=Wetland, BU=Built-up Land, HS=Harpan System, AS=Andheri System, MS=Mid Sub-watershed, SFS=South Flowing System and NFS= North Flowing System). 2.7 ha, ha, 1.4 ha in ; 1.8 ha, 2.3 ha, 39.1 ha, 35.2 ha, 0.00 ha; 12.1 ha, 61.7 ha, 2.8 ha, 1.0 ha, 1.4 ha and 4.4 ha, 7.6 ha, 8.9 ha, ha, 1.6 ha in and 15.4 ha, 21.8 ha, ha, 80.1 ha, 0.00 ha; 76.5 ha, ha, 72.4 ha, 25.0 ha, 26.1 ha and 11.0 ha, 14.1 ha, 14.7 ha, ha, 6.0 ha in in HS, AS, MS, SFS and NFS sub-watershed, respectively. On the other hand, Terrace Agriculture, Valley Agriculture and Grass Land decreased by (16.3 ha, 13.7 ha, 63.7 ha, 2.3 ha, 14.3 ha), (9.3 ha, 10.2 ha, 6.2 ha, ha, 0.1 ha) and (0.6 ha, 6.4 ha, 1.0 ha, 9.8 ha, 0.0 ha) in ; (30.6 ha, 23.0 ha, 7.0 ha, 9.3 ha, 6.0 ha); (0.4 ha, 0.9 ha, 4.0 ha, ha, 0.6 ha) and (2.2 ha, 12.0 ha, 0.1 ha, 4.6 ha, 0.0 ha) in , (11.2 ha, 9.9 ha, 31.7 ha, 27.3 ha, 4.3 ha); (1.7 ha, 0.5 ha, 6.6 ha, ha, 2.7 ha) and ( 3.5 ha, 14.2 ha, 0.2 ha, 6.2 ha, 0.0 ha) in and (58.1 ha, 46.6 ha, ha, 38.9 ha, 24.6 ha); (11.4 ha, 11.6 ha, 16.8 ha, ha, 3.4 ha) and (6.3 ha, 32.7 ha, 1.3 ha, 20.6 ha, 0.0 ha) in of HS, AS, MS, SFS and NFS sub-watershed, respectively. Data presented in Table-24 and Figure-22 indicated that Medium to Fairly Dense Forest, Open Forest, Waste Land, Bush/Scrub and Built-up Land have exhibited a positive rate of change for all study periods in all the sub-watersheds. While, Dense Forest, Terrace Agriculture, Valley Agriculture and Grass Land experienced a negative change in all periods in all subwatersheds. The rate of LULC change was found high in Dense Forest and Medium to Fairly Dense Forest in HS sub-watershed in and while rate of change of Open Forest was high in MS in all study periods. However the rate of change of Dense Forest was found higher in MS and NFS sub-watersheds in and respectively. Also the rate of change of Medium to Fairly Dense Forest was higher in SFS and NFS sub-watersheds in the periods and respectively. Higher rate of change of Valley Agriculture was observed in SFS sub-watershed. The rate of change of Bush/Scrub was higher in AS sub-watershed in , and , while in HS sub-watershed occupied higher rate of Bush/Scrub Land. Higher 84
24 rate of change of Waste and Built-up Land were noticed in MS and SFS sub-watersheds respectively in all study periods. Sub-watershed wise very less LULC changes were observed for Grass Land, Water Body, and Wetland classes. Overall the results of LULC change analysis showed that the expansion of Built-up, Bush/Scrub and Waste Land for loss of Agriculture Land, Grass Lands, Wetland and Open Forest while an increase in Medium to Fairly Dense Forest and Open Forest leading to decrease in Dense Forest during the study periods in the all subwatersheds. 4.2 Land use / Land cover (LULC) Change Prediction Modelling Factors of LULC Change In this study, for LULC change prediction, infrastructure and socio-economic drivers (road network & human settlement) and terrain physical drivers (DEM derived slope) were used. For LULC change prediction the decisions that were needed generally include site selection or land allocation decisions that satisfy multiple objectives, each relating to its own suitability level of land conversion (Soe and Le, 2006). To achieve the said objective, multi-criteria evaluation (MCE) approach was adopted, which deals with situations in which a single decision-maker is faced with a multiplicity of usually incompatible criteria or in which a number of decisionmakers must consider criteria, each of which depends upon the decisions of all the decisionmakers (Ademiluyi and Otun, 2009). MCE technique was used here to assess the weightings of the each driver and these weightings were used as inputs for LULC change modeling. The criteria were set for eight land use land cover classes accordingly (Annex A, Table 1). The images used in this study are presented in Figures 21 and 22. Figure 21: Terrain Physical Driver 85
25 . Figure 22: infrastructure and socio-economic drivers 86

26 Different factors have different importance affecting LULC change while creating overall suitability. Therefore, the weight to each of the factor image was assigned according to its importance for each land use class. The Analytic Hierarchy Process (AHP) is a theory of measurement through pair-wise comparisons and relies on the judgments of experts to derive priority scales. This process requires weighting factors rate from extremely "less important" (1) to "more important" (9). Consistency ratio (CR) is calculated as the AHP ratings are filled out to identify the inconsistencies in the pair-wise comparison ratings. Saaty and Vargas, (2001) pointed that CR greater than 0.1 should be re-evaluated. The assignment of rating needs analyst s intuition and repetition unless the consistency is acceptable as shown below for Built-up class (Figure - 23). Figure 23: Analytical Hierarchy Process (AHP) ratings and Consistency ratio The AHP weights derived from the pair wise comparison matrix to be assigned each of the factors are presented in (Table-25). 87
. 4.2.")
27 Table 25: Factor Weights Derived from AHP (Note: DF=Dense Forest, MF=Medium to Fairly Dense Forest OF=Open Forest, TA=Terrace Agriculture, VA= Valley Agriculture BA=Bush/Scrub land, GS =Grass Land, WS=Waste Land, BU=Built-up) Suitability Maps for LULC Change Modelling Once the factors were developed and factors weights were derived, all the information was aggregated using Weighted Linear Combination (WLC) available in MCE module in IDRISI. The WLC multiplies each factor images by its weights and sums the results which will have the same range of values as standardized factor images used. The result is then multiplied by each of the constraints to mask out unsuitable areas as the resultant suitability map. Here, in this study, the suitability of areas for each LULC class was determined with consideration of drivers or factors, i.e., slope, distance from road and distance from settlements. The suitability maps were prepared with different criteria and relative weights for each LULC class. The suitability maps determine which pixel will change as per the highest suitability of each land use/cover type. The higher the suitability of a pixel, the possibility of the neighbouring pixels to change into that particular class is higher. The suitability map of each land use/cover maps were standardized with the fuzzy factor standardization. Therefore a simple linear distance decay function is appropriate for this basic assumption. It serves the basic idea of contiguity. The land use land cover maps have been standardized to the same continuous suitability scale (0 255) using fuzzy set membership analysis process. The basic assumption for preparing suitability images is the pixel closer to an existing land use land cover type has the higher suitability. It means a pixel that is completely within vegetation has the highest suitability value (255) and pixels far from existing vegetation pixels will have less suitability values. The farthest pixels from vegetation will show the lowest suitability values. The standardized suitability land use land cover images of Dense Forest, Medium to Fairly Dense Forest, Open Forest, Terrace Agriculture, Valley Agriculture, Bush/ Scrub Land, Grass Land, Waste Land, and Built-up Land classes were prepared with fuzzy function, and presented in Figure

28 Figure 24: Suitability Maps for LULC Classes 89
29 4.2.3 Transition Probability Matrix for LULC Change Modeling Markov Chain analysis process for LULC change prediction produces the transition probability matrix from the two period LULC maps and on the basic of this transition matrix a set of condition probability images for each LULC classes are generated from the information of two LULC maps. The Markov transition probability matrix and images of changing among LULC from 2000 to 2005, 2005 to 2010 and 2000 to 2010 with conditional probability error 10 %; are presented in Tables-26, 27 and 28 and Figures-25, 26 and 27, respectively. As seen from the data of Table 26, Dense Forest has a higher (0.67) probability of remaining as Dense Forest and probability values of 0.23, 0.07 and 0.03 were for changing of Dense Forest to Medium to Fairly Dense Forest, to Terrace and to Valley Agriculture Land, respectively for the projected year of The probabilities of changing of Dense Forest to other LULC classes were very low. The probability of no change in Medium to Fairly Dense Forest and Open Forest were 0.61 and 0.54, respectively, while the probability of changes in Medium to Fairly Dense Forest and Open Forest to Dense Forest, Terrace and Valley Agriculture Land were 0.33, 0.01, 0.04 and 0.00, 0.02 and 0.01, respectively. Also, the probability of change of Medium to Fairly Dense Forest to Open Forest and Open Forest to Medium to Fairly Dense Forest were 0.1 and 0.26 respectively. The probability of change of Dense Forest, Medium to Fairly Dense Forest and Open Forest to other LULC were also very low. Similarly the probability of remaining Terrace Agriculture, Valley Agriculture, Bush/ Scrub Land, Grass Land, Waste Land, Water Body, Wetland and Built-up Land as respective LULC class were 0.47, 0.45, 0.14, 0.24, 0.50, 0.65, 0.71 and 0.35, respectively. While the probability of Terrace Agriculture, Valley Agriculture, Bush/ Scrub Land, Grass Land, Waste Land, Water Body, Wetland and Built-up Land change to other LULC classes showed moderate to low. Similarly, data pertaining to Tables 27 and 28 showed that the probability of remaining as no change of the LULC classes viz. Dense Forest, Medium to Fairly Dense Forest, Open Forest, Terrace Agriculture, Valley Agriculture, Bush / Scrub Land, Grass Land, Waste Land, Water Body, Wetland and Built-up Land were 0.78, 0.67, 0.54, 0.52, 0.48, 0.55, 0.61, 0.77, 0.71, 0.76, 0.51, respectively for the projected year of LULC 2015 and 0.82, 0.65, 0.57, 0.61, 0.62, 0.49, 0.83, 0.71, 0.72, 0.76 and 0.62, respectively for the projected year The probabilities of changes of these LULC categories to other categories were moderately low to low. 90
30 Table 26: Transitional Probability Matrix for Projected DF MF OF TA VA BA GS WS WB WT BU DF MF OF TA VA BA GS WS WB WT BU (Note: DF=Dense Forest, MF=Medium to Fairly Dense Forest, OF=Open Forest, TA=Terrace Agriculture, VA=Valley Agriculture, BA=Bush/Scrub Land, GS=Grass Land, WS=Waste Land, WB=Water Body, WE=Wetland and BU=Built-up Land). 91
31 Table 27: Transitional Probability Matrix for Projected DF MF OF TA VA BA GS WS WB WT BU DF MF OF TA VA BA GS WS WB WT BU (Note: DF=Dense Forest, MF= Medium to Fairly Dense Forest, OF=Open Forest, TA=Terrace Agriculture, VA=Valley Agriculture, BA=Bush/Scrub land, GS =Grass Land, WS=Waste Land, WB=Water Body, WE=Wetland and BU=Built-up Land). 92
32 Table 28: Transitional Probability Matrix for Projected DF MF OF TA VA BA GS WS WB WT BU DF MF OF TA VA BA GS WS WB WT BU (Note: DF=Dense Forest, MF=Medium to Fairly Dense Forest, OF=Open Forest, TA=Terrace Agriculture, VA=Valley Agriculture BA=Bush/Scrub land, GS =Grass Land, WS=Waste Land, WB=Water Body, WE=Wetland and BU=Built-up Land). 93

33 Figure 25: Conditional Probability
34 Figure 26: Conditional Probability
35 Figure 27: Conditional Probability
36 4.2.4 LULC Change Modelling by CA Markov and GEOMOD CA-Markov process was executed with the probability transition matrix from the Markov chain process with the suitability map of each land use/cover class and the contiguity filter. In this study, suitability maps for Dense Forest, Medium to Fairly Dense Forest, Open Forest, Terrace Agriculture, Valley Agriculture, Bush/ Scrub Land, Grass Land and Waste Land were generated from the MCE-AHP process and for Water Body and Wetland were generated with reclassification of actual LULC map of Cellular Automata Markov (CA_MARKOV) modeling technique (Modeler in IDRISI Taiga software) was applied to generate the predicted LULC maps of 2010, 2015 and The CA_MARKOV model used LULC map of 2010 as base map input for generating projected LULC maps of 2015 and The transition probability maps produced by MARKOV Chain analysis process from 2005 and 2010 LULC maps and 2000 and 2010 LULC map, and LULC classes suitability maps produced by MCE technique were used for generating projected LULC maps of 2015 and While for projected LULC map of 2010, the transition probability map produced by MARKOV Chain analysis process using 2000 and 2005 LULC maps and base LULC map of actual LULC map of 2005 were taken as inputs. The GEOMOD (Pontius and Chen, 2006) however is a grid-based LULC change model and simulates the change between two LULC categories only. Therefore, in this study, GEOMOD model was implemented to predict and compare changes in the major land uses for 2010, 2015 and 2020 periods. For projecting LULC maps of 2015 and 2020 using GEOMOD modelling, LULC maps of 2005 and 2010, and LULC maps of 2000 and 2010, respectively were provided as basic inputs. Modelling for the future LULC the previously re-classified LULC maps were used along with the suitability map of each LULC class. Both the models used suitability maps derived from MCE-AHP process. Before projecting future LULC, the projected maps of 2010 derived by CA-MARKOV and GEOMOD were compared with actual LULC map of 2010 prepared by digital analysis of satellite data for assessment of accuracies of LULC prediction by the both LULC change models. The projected LULC maps of 2010, 2015 and 2020 generated by CA-MARKOV and GEOMOD are presented below in Figures - 28, 29 and 30, respectively. 97
37 Figure 28: CA - Markov Predicted LULC Maps 98
38 Figure 29: GEOMOD Predicted Spatial Maps of Forest LULC Classes 99
39 Figure 30: GEOMOD Predicted Non Forest LULC Classes 100
40 The area statistics of LULC classes of actual LULC map of 2010 and projected LULC map of 2010 derived by using CA Markov model are presented in Table The data in the Table - 29 indicated that the areas of LULC classes in model derived projected map and actual LULC maps are comparable. Table - 29: Area Statistics of Actual and CA-MARKOV Model Predicted LULC classes for the year 2010 Predicted 2010 Real 2010 (ha) (ha) Difference LULC Class Area Area (%) % % (ha) (ha) Dense Forest Medium to Fairly Dense Forest Open Forest Terrace Agriculture Valley Agriculture Bush/Scrub Land Grass Land Waste Land Water Body Wetland Built-up Land Total The area statistics of CA-MARKOV model projected LULC classes for the year 2015 and 2020 as well as actual for the year 2010 are presented in Table The data presented in the table showed that the major changes in areal extent were found in Dense Forest, Medium to Fairly Dense Forest, Open Forest, Terrace Agriculture, Valley Agriculture, Bush/Scrub and Waste Land. Minor changes were observed in other LULC classes. Dense Forest, Terrace Agriculture, Valley Agriculture, Wetland and Grass Land are predicted to decrease by ha, ha, ha, 8.91 ha and 2.07 ha, respectively, while Medium to Fairly Dense Forest, Open Forest, Bush / Scrub, Waste Land and Built-up Land are projected to increase by ha, ha, ha, ha and ha, respectively between the years 2010 to Similar 101
41 patterns of changes of these LULC classes are predicted by CA-MARKOV model between the years 2010 to Table - 30: Area Statistics of Actual for the year 2010 and CA-MARKOV Model Predicted LULC classes for the year 2015 and 2020 Area in (ha) LULC Class Dense Forest Medium to Fairly Dense Forest Open Forest Terrace Agriculture Land Valley Agriculture Land Bush/Scrub Land Grass Land Waste Land Water Body Wetland Built-up Land Total The results of areal distributions of GEOMOD model predicted major LULC classes for the year 2015 and 2020 and actual for the year 2010 are presented in Table The results of this analysis indicated that the major changes were found in the LULC classes of Dense Forest, Medium to Fairly Dense Forest, Open Forest, Terrace Agriculture, Valley Agriculture, Waste Land and Built-up Land. Dense Forest, Terrace Agriculture, Valley Agriculture, decreased by ha, ha and ha, respectively, whereas, Medium to Fairly Dense Forest, Open Forest, Waste Land and Built-up Land increased by ha, ha, ha and ha, respectively between the years 2010 to Similar patterns of changes were also predicted between the years 2010 to
42 Table - 31: Area Statistics of Actual for the year 2010 and GEOMOD Model Predicted LULC classes for the year 2015 and 2020 Area in (ha) LULC Class Dense Forest Medium to Fairly Dense Forest Open Forest Terrace Agriculture Land Valley Agriculture Land Waste Land Built-up Land Total LULC The LULC projection / prediction results of both the change prediction models revealed similar trends of changes in LULC classes in all projection periods. The rates of changes of LULC are approximately same in both the models because GEOMOD used the same number of grid cells as real LULC during the simulation process and CA Markov employed inputs of LULC changes develop as a growth process in areas of higher suitability adjacent to existing areas Validation of s of LULC Prediction Models Model validation is one of the important stages in the prediction of LULC. After any predictive model generates a simulated map, it is desirable to validate the accuracy of the prediction result. The VALIDATE module in Idrisi was used for this purpose. Various Kappa statistic parameters viz. Kno = Kappa for no information, Klocation = Kappa for location, Kquantity = Kappa for quantity and Kstandard = Kappa standard were used for assessment of accuracy. Validation of projected LULC was done by comparing simulation results / outputs from, CA-Markov and GEOMOD models for the predicted LULC map of 2010 with the actual LULC map of 2010 derived by digital analysis of satellite data based on the Kappa index of agreement. Also, the accuracy assessment of the CA-MARKOV model projected / predicted LULC map of 103
43 2010 was carried out by using the ground truth information following confusion matrix approach. Validation results of comparison of projected LULC of 2010 by CA Markov model with actual LULC of 2010 is presented in Table 32. Table 32: Kappa Parameters of Projected LULC of 2010 by CA Markov Against actual LULC of 2010 Kappa Value Kno Klocation KlocationStrata KStandard The data presented in the Table 32 showed that the overall Kappa parameters values were more than 85% indicating good agreement of CA-MAKOV model predicted LULC output vs. actual LULC map. Similarly, Validation results of comparison of projected LULC of 2010 by GEOMOD model for each LULC class wise with actual LULC of 2010 are presented in Table 33. Table - 33: Kappa Parameters of LULC class wise Projected LULC of 2010 by GEOMOD model against actual LULC of 2010 Validation of Projected 2010 Kno Klocation Klocation strata Kstandard LULC Dense Forest Medium to Fairly Dense Forest Open Forest Terrace Agriculture Valley Agriculture Waste Land Built-up land
44 The data presented in Table - 33 indicated that the overall Kappa parameters values were more than 90% for each LULC classes showing very good agreement of GEOMOD model predicted LULC outputs (each LULC class wise) vs. actual LULC map. The analysis results of confusion matrix for assessment of accuracy of CA-MARKOV model predicted LULC outputs are presented in Table The overall analysis accuracy and Kappa were more than 85% indicated the acceptance of CA-MARKOV model predicted LULC results (Anderson et al., 1976). Table - 34: Accuracy assessments of CA-MARKOV Model Projected LULC of 2010 and Actual LULC of 2010 LULC classes PA UA Dense Forest Medium to Fairly Dense Forest Open Forest Terrace agriculture Valley agriculture Bush/scrub Grass land Waste land Water body Wetland Built-up land Overall classification accuracy (%) Overall Kappa Statistics 0.87 In assessing confusion matrix (Table 34), it was observed that few LULC classes viz. Water Body, Wetland and Built-up Land provided the highest (100%) producer s as well as user s accuracies. For forest and agriculture categories, more than 80% producer s and user s accuracies were achieved. The lowest producer s and user s accuracies less than 75% were observed for LULC classes such as Waste Land, Bush / Scrub Land and Grass Land. The data presented in Tables-32 and 33 showed that the overall accuracy of the prediction results from CA 105
45 MARKOV model is less than the GEOMOD model. The overall accuracy of prediction results from GEOMOD model has high value of Kappa Index (0.997). Therefore, accuracy results of this study indicated that GEOMOD model was more accurate in predicting LULC as compared to CA- MARKOV model Sub-watershed wise Spatial Distributions of Future Predicted LULC Sub-watershed-wise area statistics of predicted LULC for the years 2015 and 2020 and actual LULC of 2010 are presented in Table 35. The sub-watershed-wise change area statistics of LULC classes as predicted by CA-MARKOV model for the years 2015 and 2020 from actual 2010 showed overall increasing trends for Medium to Fairly Dense Forest, Open Forest, Waste Land, Bush/Scrub and Built-up Land and decreasing trends for other LULC classes in all subwatersheds. The sub-watershed wise changes in areas of LULC classes between the years and are presented in Table-36 and illustrated in Figure-31. Dense Forest: The maximum and minimum areas of Dense Forest occupied in HS and MS sub-watersheds, respectively in both the study periods. The Dense Forest was predicted to decrease by 44.9 ha, 49.5 ha, 15.7 ha, 0.00, 16.0 ha, and ha, 79.2 ha, 18.6 ha, 0.00 ha, 20.2 ha, respectively in HS, AS, MS, SFS and NFS sub-watersheds, respectively, during periods between 2010 to 2015 and 2010 to The results showed that the rate of change in Dense Forest was very high in HS and AS sub-watersheds. Medium to Fairly Dense Forest: This class is the dominant LULC class and found in all sub- watersheds. The maximum and minimum areas of Medium to Fairly Dense Forest covered by MS and NFS sub-watersheds, respectively in both the periods. Medium to Fairly Dense Forest was predicted to increase by 51.3 ha, 29.6 ha, 0.3 ha, 11.1 ha, 1.5 ha, and ha, 43.2 ha, 0.9 ha, 16.0 ha, 4.5 ha, respectively in HS, AS, MS, SFS and NFS sub-watersheds, respectively during periods 2010 to 2015 and 2010 to Open Forest: The Open Forest was predicted to increase by 1.1 ha, 12.6 ha, 12.9 ha, 5.0 ha, 0.0 ha and 10.5 ha, 23.8 ha, 16.6 ha, 5.4 ha, 0.0 ha, respectively in HS, AS, MS, SFS and NFS, sub-watersheds, respectively during periods 2010 to 2015 and 2010 to The rate of change of increase of Open Forest was observed high in AS and MS sub-watersheds. 106
46 Table 35: Sub-watershed wise area Statistics of Actual (2010) and CA-MARKOV Model Predicted LULC classes for the years 2015 and Area(ha) Area(ha) Area(ha) LULC HS AS MS SFS NFS HS AS MS SFS NFS HS AS MS SFS NFS DF MF OF TA VA BA GS WS WB WE BU Total (Note: HS=Harpan System, AS=Andheri System, MS=Mid sub-watershed, SFS=South Flowing System and NFS= North Flowing System, DF=Dense Forest, MF=Medium to Fairly Dense Forest, OF=Open Forest, TA=Terrace Agriculture, VA=Valley Agriculture, BA=Bush/Scrub Land, GS =Grass Land, WS=Waste Land, WB=Water Body, WE=Wetland, BU=Built-up Land). 107
47 Terrace Agriculture: This LULC class also presence in all the sub- watersheds and was seen as one of the dominant LULC classes. Most of Terrace Agriculture Land is found in hilly part of the area. The maximum and minimum areas of Terrace Agriculture were found in AS and NFS sub- watersheds, respectively. The Terrace Agriculture was predicted to decrease by 3.8 ha, 69.5 ha, 17.0 ha, 10.6 ha, 2.9 ha, respectively and 4.9 ha, 80.5 ha, 31.3 ha, 16.2 ha, 3.0 ha, respectively in HS, AS, MS, SFS and NFS sub- watersheds, respectively during periods 2010 to 2015 and 2010 to Most of the Terrace Agriculture areas were converted into Built-up Land, Bush/Scrub and Waste land in all the sub watersheds during change periods. Table - 36: Comparisons of sub-watershed wise LULC Changes ( and ) Change in Area (ha) Change in Area (ha) LULC HS AS MS SFS NFS HS AS MS SFS NFS DF MF OF TA VA BA GS WS WB WE BU (Note: HS=Harpan System, AS=Andheri System, MS=Mid-sub-watershed, SFS=South Flowing System and NFS= North Flowing System, DF=Dense Forest, MF=Medium to Fairly Dense Forest, OF=Open Forest, TA=Terrace Agriculture, VA=Valley Agriculture, BA=Bush/Scrub Land, GS=Grass Land, WS=Waste Land, WB =Water Body, WE=Wetland, BU=Built-up Land). 108
48 Figure 31: Sub-watershed wise LULC Changes ( and ) 109
49 Valley Agriculture: The minimum area of this class covered by AS sub-watershed and while larger area was occupied by MS and SFS sub-watershed in all study periods. The Valley Agriculture was predicted to decrease by 0.8 ha, 2.3 ha, 11.0 ha, ha, 0.2 ha, respectively and 2.5 ha, 2.7 ha, 29.9 ha, ha, 0.6 ha, respectively in HS, AS, MS, SFS and NFS subwatersheds, respectively during the periods of 2010 to 2015 and 2010 to The change in area of this LULC class is higher in SFS sub-watershed. Bush/Scrub: This is a minor land use class of the study area. Bush/Scrub Land was predicted to decrease by 0.3 ha, 33.8 ha, 10.9 ha, 5.4 ha, 16.2 ha, respectively and 18.9 ha, 34.0 ha, 35.2 ha, 9.3 ha, 16.9 ha, respectively, in HS, AS, MS, SFS and NFS sub-watersheds, respectively during the change study periods of 2010 to 2015 and 2010 to The results showed that Bush/Scrub Land changed to different land uses in all the sub-watersheds but the higher change is observed in AS and MS sub-watersheds. Grass Land: This class is also minor LULC class in the watershed. The Grass Land was predicted to decrease by 5.9 ha, 0.1 ha, 0.2 ha, 0.8 ha, 0.00 ha, respectively and 6.6 ha, 0.2 ha, 1.1 ha, 1.8 ha, 0.00 ha, respectively in HS, AS, MS, SFS and NFS sub-watersheds respectively during the periods 2010 to 2015 and 2010 to The larger change of Grass Land was found in HS sub - watersheds during both periods. Waste Land: Waste Land was covered by HS, AS, MS and SFS sub-watersheds only. The area extent of this class was predicted to increase by 1.0 ha, 29.2 ha, 17.4 ha, 9.2 ha, respectively and 2.1 ha, 44.6 ha, 29.1 ha, 21.6 ha, respectively in HS, AS, MS and SFS subwatersheds, respectively during both the periods. The large increase in this LULC class was found in AS and MS sub-watersheds. Built-up Land: This class is one of the dominant LULC class found in all sub-watersheds. Built-up Land was predicted to increase by 1.7 ha, 16.4 ha, 2.9 ha, 87.9 ha, 5.2 ha, respectively and 5.7 ha, 16.9 ha, 4.6 ha, ha, 6.7 ha, respectively in HS, AS, MS, SFS and NFS subwatersheds for the study periods and The major change occurred in South Flowing sub-watershed. Water Body and Wet Land: These LULC classes were minor categories. These classes were not changed in areas in HS, AS and SFS sub-watersheds, however, small changes are found in MS and NFS sub-watersheds in both the periods. 110
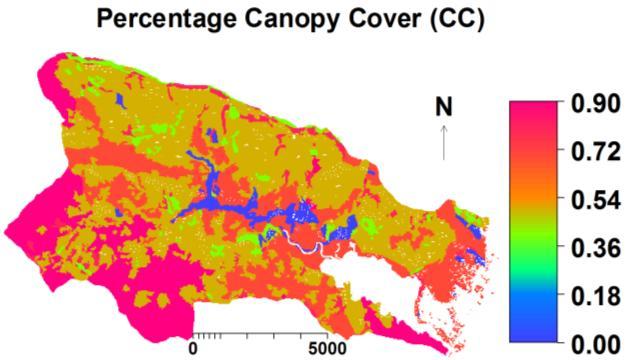
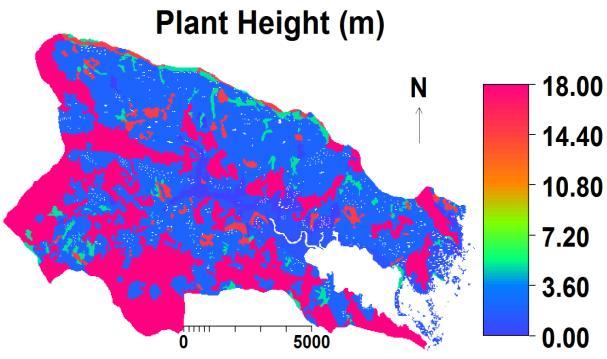
50 The results of area distributions for predicted LULC 2015 and 2020 by CA-MARKOV and GEOMOD showed that the major changes were observed in Dense Forest, Medium to Fairly Dense Forest, Open Forest, Terrace Agriculture and Valley Agriculture. Dense Forest, Terrace Agriculture, Valley Agriculture, Wetland and Grass Land decreased by ha, ha, ha, 8.91 ha and 2.07 ha, respectively, and Medium to Fairly Dense Forest, Open Forest, Bush/Scrub, Waste Land and Built-up- Land are increased by ha, ha, ha, ha and ha, respectively for the period 2010 to 2015 (Table-30). Similar rates of changes were also predicted for the period 2010 to Subwatershed wise major changes are observed for Dense Forest in HS and AS sub-watersheds; Medium to Fairly Dense Forest in HS, AS and SFS sub-watersheds; Open Forest in AS, MS and SFS sub-watersheds; Terrace Agriculture in AS and MS; Waste Land in AS, MS and SFS subwatersheds; and Built-up Land in SFS sub-watershed. 4.3 Soil Erosion Mapping In this study, Revised Morgan, Morgan & Fenny (RMMF) soil erosion model was used in GIS (Geographic Information System) environment to predict soil erosion loss and also map soil erosion risk in the studied watershed. Various soil erosion factors such as LULC, soil, terrainslope and rainfall were used in the model to assess current and future rates of soil erosion losses and mapping of soil erosion risk areas Inputs Parameters of Soil Erosion Model Different maps such as LULC maps of different periods 1995, 2000, 2005 and 2010 and also predicted LULC of 2015 and 2020, surface soil texture and digital elevation model derived slope map have been used. Attributes values for the various input parameters were assigned based on ground truth information and literatures (Morgan et al., 1984 and Morgan, 2001). In this study, various inputs parameters used in RMMF soil erosion model, derived from different data sources are described in section [Landform (Slope derived from existing DEM), Soil (soil moisture content at field capacity, bulk density, soil detachability index and cohesion of surface soil), Rainfall (annual rainfall and number of rainy days/year) and LULC maps (The percentage of rainfall contributing to permanent interception, the ratio of actual to potential evapo-transpiration, the crop cover management factor, canopy cover, ground cover, 111
51 plant height and effective hydrological depth)] were used. The values of the percentage of rainfall contributing to permanent interception (A), the ratio of actual to potential evapotranspiration (E t/ /E 0 ), the crop cover management factor (C), % canopy cover (CC), % ground cover (GC), plant height (PH) in meter and effective hydrological depth (EHD) in meter used in the model for Dense Forest, Medium to Fairly Dense Forest, Open Forest, Terrace Agriculture, Valley Agriculture, Bush/Scrub, Grass and Waste Land respectively, in all the periods are presented in the Table-12 and Figure-32. The values of soil moisture content at field capacity (MS), bulk density of the top soil layer (BD) in Mg/m 3, soil detachability index (K) in g/j and cohesion of surface soil in KPa were 0.35, 0.20, 0.28, 0.25; 1.3, 1.3, 1.2, 1.3; 0.8, 0.8, 0.7, 0.9 and 9.0, 3.0, 2.0, 3.0 in the Silt clay loam, Loam, Sandy Loam and Silt loam surface soil texture classes found in the study area Table -15 and Figure-33. Terrain input parameter (Slope in degree) of the study area varies from 0 to degree. Rainfall parameters (annual rainfall and rain day/year) of the study area vary from 3746 to 4906mm and 107 to 161 respectively. The intensity of erosive rain used in the model is 25mm/hr from (Morgan, 2001) for tropical climate. Soil erosion model input maps of vegetation, soil, terrain and rain fall parameters are presented in Figure-32, 33, 34 and 35 respectively Soil Erosion Risk Assessment The areal extent of soil erosion risk classes for the whole watershed is presented in Table- 37. The RMMF model estimated annual potential soil erosion loss for the entire Phewa Lake watershed varied from 0.1 to t/ha/yr; 0.1 to t/ha/yr; 0.1 to t/ha/yr; 0.1 to t/ha/yr; 0.1 to t/ha/yr and 0.1 to t/ha/yr, for the years of 1995, 2000, 2005, 2010, 2015 and 2020, respectively. While the weighted average soil loss for the whole watershed varied over the periods such as t/ha/yr, t/ha/yr, t/ha/yr, t/ha/yr, t/ha/yr and t/ha/yr for the year 1995, 2000, 2005, 2010, 2015 and 2020, respectively. The maps of soil loss for the past (1995, 2000, 2005 and 2010) and future years (2015 and 2020) are presented in Figures-36 and 37, respectively. Soil erosion risk map showing soil erosion risk classes was prepared by grouping of RMMF model predicted soil erosion rates. 112

52 Figure - 32: Maps of Vegetation Inputs Parameters 113


53 Figure - 33: Maps of Soil Input Parameters 114


54 Figure 34: Maps of Terrain Input Parameters Figure 35: Maps of Rain Fall Input Parameters 115
55 The six soil erosion risk classes were made based on the potential soil loss values and these classes are - < 5 t/ha/yr (Nil to slight), between 5 and 10 t/ha/yr (Slight); between 10 and 15 t/ha/yr (Moderate); between 15 and 25 t/ha/yr (Moderately high); between 25 and 50 t/ha/yr (Severe) and > 50 t/ha/yr (Very severe) The maps of soil erosion risk with various risk classes for the past study periods (1995, 2000, 2005 and 2010) and predicted years (2015 and 2020) are shown in Figures-38 and 39, respectively. The data presented in Table-37 showed that ha (62.09%), ha (60.72%), ha (59.32%), ha (58.01%), ha (57.1%) and ha (56.39%) for the years 1995, 2000, 2005, 2010, 2015 and 2020, respectively covered by mostly the forest area and Valley Agriculture with the annual potential soil erosion loss of < 5 t/ha/yr (Nil to slight) and Slight (5-10 t/ha/yr) erosion risk categories. Whereas, the middle part of the watershed at lower slope where, ha (19.04%), ha (18.92%), ha (18.74%), ha (18.62%), ha (18.80%) and ha (18.69%) for the years 1995, 2000, 2005, 2010, 2015 and 2020, respectively covered with mostly Open Forest, Bush/Scrub, Grass and Terrace Agriculture and these areas are under Moderate (soil loss: t/ha/yr) to Moderately high erosion risk class(soil loss: t/ha/yr). Mid-highland region of the watershed, where rainfall and the slope gradient are relatively high and mostly covered with abundant Terrace Agriculture area, Severe erosion risk (soil loss: t/ha/yr.) classes of about % were found between all the periods. Generally, a Very severe soil erosion risk of soil loss > 50 t/ha/yr class mostly covered by Waste Land of the areas of ha (2.15%), ha (2.94%), ha (3.78%), ha (4.22%), ha (4.46%) and ha (4.8%) for the years 1995, 2000, 2005, 2010, 2015 and 2020, respectively were observed. About 56-62% of total area of watershed was found under Nil to slight and slight soil erosion risk classes in all the periods. About 18-19% of watershed lies in Moderate to Moderately high risk of soil erosion categories, while about 12-13% of area showed Severe to Very severe of soil erosion risk classes for all the periods. From 1995 to 2010 of each five years time interval Nil to slight, Moderately high and Severe erosion area decreased while other erosion risk classes increased. Similarly Nil to slight, Moderately high and Severe erosion area are predicted to decrease from 2010 to 2015 and 2010 to 2020, respectively while Slight, Moderate and Very severe erosion areas were predicted to increase. 116
56 Figure 36: Soil Loss Maps of the Phewa Lake Watershed under Past and Current Scenarios 117
57 Figure 37: Soil Loss Maps of the Phewa Lake Watershed under Future Scenarios 118
58 Figure 38: Erosion Risk Maps of the Phewa Lake Watershed under past and Current Scenarios 119

59 Figure 39: Erosion Risk Maps of the Phewa Lake Watershed under Future Scenarios 120
Geospatial Analysis of Land Use Land Cover Change Modeling at Phewa Lake Watershed of Nepal by using Cellular Automata Markov Model
 Research Article International Journal of Current Engineering and Technology E-ISSN 2277 4106, P-ISSN 2347-5161 2014 INPRESSCO, All Rights Reserved Available at http://inpressco.com/category/ijcet Geospatial
Geospatial Analysis of Land Use Land Cover Change Modeling at Phewa Lake Watershed of Nepal by Using Cellular Automata Markov Model
 Research Article International Journal of Current Engineering and Technology E-ISSN 2277 4106, P-ISSN 2347-5161 2014 INPRESSCO, All Rights Reserved Available at http://inpressco.com/category/ijcet Geospatial
Geospatial Analysis of Land Use Land Cover Change Modeling in Phewa Lake Watershed of Nepal by Using GEOMOD Model
 The Himalayan Physics Vol. 6 & 7, April 2017 (65-72) 65 ISSN 2542-2545 Geospatial Analysis of Land Use Land Cover Change Modeling in Phewa Lake Watershed of Nepal by Using GEOMOD Model R.R. Regmi¹*, S.K.
Chapter 3 MATERIALS AND METHODS
 Chapter 3 MATERIALS AND METHODS MATERIALS AND METHODS 3.1 Study Area The details of location, geology, and landforms, climatic condition, soil association and land use/land cover of the study area are
Abstract: About the Author:
 REMOTE SENSING AND GIS IN LAND USE PLANNING Sathees kumar P 1, Nisha Radhakrishnan 2 1 1 Ph.D Research Scholar, Department of Civil Engineering, National Institute of Technology, Tiruchirappalli- 620015,
Land Use/Cover Changes & Modeling Urban Expansion of Nairobi City
 Land Use/Cover Changes & Modeling Urban Expansion of Nairobi City Overview Introduction Objectives Land use/cover changes Modeling with Cellular Automata Conclusions Introduction Urban land use/cover types
Modelling LULC for the period using GIS and Remote sensing: a case study of Tikrit, Iraq
 IOP Conference Series: Earth and Environmental Science OPEN ACCESS Modelling LULC for the period 2010-2030 using GIS and Remote sensing: a case study of Tikrit, Iraq To cite this article: Sinan Jasim Hadi
Application of Remote Sensing Techniques for Change Detection in Land Use/ Land Cover of Ratnagiri District, Maharashtra
 IOSR Journal of Applied Geology and Geophysics (IOSR-JAGG) e-issn: 2321 0990, p-issn: 2321 0982.Volume 3, Issue 6 Ver. II (Nov. - Dec. 2015), PP 55-60 www.iosrjournals.org Application of Remote Sensing
7.1 INTRODUCTION 7.2 OBJECTIVE
 7 LAND USE AND LAND COVER 7.1 INTRODUCTION The knowledge of land use and land cover is important for many planning and management activities as it is considered as an essential element for modeling and
APPLICATION OF LAND CHANGE MODELER FOR PREDICTION OF FUTURE LAND USE LAND COVER A CASE STUDY OF VIJAYAWADA CITY
 APPLICATION OF LAND CHANGE MODELER FOR PREDICTION OF FUTURE LAND USE LAND COVER A CASE STUDY OF VIJAYAWADA CITY K. Sundara Kumar 1, Dr. P. Udaya Bhaskar 2, Dr. K. Padmakumari 3 1 Research Scholar, 2,3
Landuse and Landcover change analysis in Selaiyur village, Tambaram taluk, Chennai
 Landuse and Landcover change analysis in Selaiyur village, Tambaram taluk, Chennai K. Ilayaraja Department of Civil Engineering BIST, Bharath University Selaiyur, Chennai 73 ABSTRACT The synoptic picture
Road Network Planning for Sustainable Urban Development in Kirtipur Municipality, Nepal
 Road Network Planning for Sustainable Urban Development in Kirtipur Municipality, Nepal Bikash Kumar Karna Survey Officer, Survey Department, Min Bhawan, Kathmandu, Nepal. Abstract Road network deals with
Critical Assessment of Land Use Land Cover Dynamics Using Multi-Temporal Satellite Images
 Environments 2015, 2, 61-90; doi:10.3390/environments2010061 OPEN ACCESS environments ISSN 2076-3298 www.mdpi.com/journal/environments Article Critical Assessment of Land Use Land Cover Dynamics Using
Remote Sensing and GIS Application in Change Detection Study Using Multi Temporal Satellite
 Cloud Publications International Journal of Advanced Remote Sensing and GIS 2013, Volume 2, Issue 1, pp. 374-378, Article ID Tech-181 ISSN 2320-0243 Case Study Open Access Remote Sensing and GIS Application
ESTIMATION OF LANDFORM CLASSIFICATION BASED ON LAND USE AND ITS CHANGE - Use of Object-based Classification and Altitude Data -
 ESTIMATION OF LANDFORM CLASSIFICATION BASED ON LAND USE AND ITS CHANGE - Use of Object-based Classification and Altitude Data - Shoichi NAKAI 1 and Jaegyu BAE 2 1 Professor, Chiba University, Chiba, Japan.
Yaneev Golombek, GISP. Merrick/McLaughlin. ESRI International User. July 9, Engineering Architecture Design-Build Surveying GeoSpatial Solutions
 Yaneev Golombek, GISP GIS July Presentation 9, 2013 for Merrick/McLaughlin Conference Water ESRI International User July 9, 2013 Engineering Architecture Design-Build Surveying GeoSpatial Solutions Purpose
DETECTION AND ANALYSIS OF LAND-USE/LAND-COVER CHANGES IN NAY PYI TAW, MYANMAR USING SATELLITE REMOTE SENSING IMAGES
 DETECTION AND ANALYSIS OF LAND-USE/LAND-COVER CHANGES IN NAY PYI TAW, MYANMAR USING SATELLITE REMOTE SENSING IMAGES Kay Khaing Oo 1, Eiji Nawata 1, Kiyoshi Torii 2 and Ke-Sheng Cheng 3 1 Division of Environmental
Understanding and Measuring Urban Expansion
 VOLUME 1: AREAS AND DENSITIES 21 CHAPTER 3 Understanding and Measuring Urban Expansion THE CLASSIFICATION OF SATELLITE IMAGERY The maps of the urban extent of cities in the global sample were created using
VILLAGE INFORMATION SYSTEM (V.I.S) FOR WATERSHED MANAGEMENT IN THE NORTH AHMADNAGAR DISTRICT, MAHARASHTRA
 FOR WATERSHED MANAGEMENT IN THE NORTH AHMADNAGAR DISTRICT, MAHARASHTRA") VILLAGE INFORMATION SYSTEM (V.I.S) FOR WATERSHED MANAGEMENT IN THE NORTH AHMADNAGAR DISTRICT, MAHARASHTRA Abstract: The drought prone zone in the Western Maharashtra is not in position to achieve the agricultural
VILLAGE INFORMATION SYSTEM (V.I.S) FOR WATERSHED MANAGEMENT IN THE NORTH AHMADNAGAR DISTRICT, MAHARASHTRA Abstract: The drought prone zone in the Western Maharashtra is not in position to achieve the agricultural
Site Suitability Analysis for Urban Development: A Review
 Site Suitability Analysis for Urban Development: A Review Santanu Kumar Misra Associate Professor (Dept. of CSE) Sikkim Manipal Institute of Technology Majitar, Sikkim misra_santanu@rediffmail.com Shrijana
Environmental Impact Assessment Land Use and Land Cover CISMHE 7.1 INTRODUCTION
 7 LAND USE AND LAND COVER 7.1 INTRODUCTION The knowledge of land use and land cover is important for many planning and management activities as it is considered an essential element for modeling and understanding
Correspondence should be addressed to Santosh Kumar,
 Cloud Publications International Journal of Advanced Remote Sensing and GIS 2014, Volume 3, Issue 1, pp. 516-524, Article ID Tech-253 ISSN 2320-0243 Case Study Open Access Site Suitability Analysis for
Modeling Urban Land Cover Growth Dynamics Based on Land Change Modeler (LCM) Using Remote Sensing: A Case Study of Gurgaon, India
 Using Remote Sensing: A Case Study of Gurgaon, India") Advances in Computational Sciences and Technology ISSN 0973-6107 Volume 10, Number 10 (2017) pp. 2947-2961 Research India Publications http://www.ripublication.com Modeling Urban Land Cover Growth Dynamics
Advances in Computational Sciences and Technology ISSN 0973-6107 Volume 10, Number 10 (2017) pp. 2947-2961 Research India Publications http://www.ripublication.com Modeling Urban Land Cover Growth Dynamics
Accuracy Assessment of Land Cover Classification in Jodhpur City Using Remote Sensing and GIS
 Accuracy Assessment of Land Cover Classification in Jodhpur City Using Remote Sensing and GIS S.L. Borana 1, S.K.Yadav 1 Scientist, RSG, DL, Jodhpur, Rajasthan, India 1 Abstract: A This study examines
CHAPTER V LAND USE / LAND COVER AND SITE SUITABILITY ANALYSIS
 CHAPTER V LAND USE / LAND COVER AND SITE SUITABILITY ANALYSIS 5.0 Introduction Land use refers to the human activities on land, which are directly related to the land. It encompasses a vide varieties in
79 International Journal of Scientific & Engineering Research, Volume 4, Issue 12, December-2013 ISSN
 79 International Journal of Scientific & Engineering Research, Volume 4, Issue 12, December-2013 Approach to Assessment tor RS Image Classification Techniques Pravada S. Bharatkar1 and Rahila Patel1 ABSTRACT
A GIS based Land Capability Classification of Guang Watershed, Highlands of Ethiopia
 A GIS based Land Capability Classification of Guang Watershed, Highlands of Ethiopia Gizachew Ayalew 1 & Tiringo Yilak 2 1 Amhara Design and Supervision Works Enterprise (ADSWE), Bahir Dar, Ethiopia 2
IMPROVING REMOTE SENSING-DERIVED LAND USE/LAND COVER CLASSIFICATION WITH THE AID OF SPATIAL INFORMATION
 IMPROVING REMOTE SENSING-DERIVED LAND USE/LAND COVER CLASSIFICATION WITH THE AID OF SPATIAL INFORMATION Yingchun Zhou1, Sunil Narumalani1, Dennis E. Jelinski2 Department of Geography, University of Nebraska,
Description of Simandou Archaeological Potential Model. 12A.1 Overview
 12A Description of Simandou Archaeological Potential Model 12A.1 Overview The most accurate and reliable way of establishing archaeological baseline conditions in an area is by conventional methods of
International Journal of Scientific & Engineering Research, Volume 6, Issue 7, July ISSN
 International Journal of Scientific & Engineering Research, Volume 6, Issue 7, July-2015 1428 Accuracy Assessment of Land Cover /Land Use Mapping Using Medium Resolution Satellite Imagery Paliwal M.C &.
Distinct landscape features with important biologic, hydrologic, geomorphic, and biogeochemical functions.
 1 Distinct landscape features with important biologic, hydrologic, geomorphic, and biogeochemical functions. Have distinguishing characteristics that include low slopes, well drained soils, intermittent
PREDICTION OF FUTURE LAND USE LAND COVER CHANGES OF VIJAYAWADA CITY USING REMOTE SENSING AND GIS
 PREDICTION OF FUTURE LAND USE LAND COVER CHANGES OF VIJAYAWADA CITY USING REMOTE SENSING AND GIS K. Sundara Kumar 1 *, N V A Sai Sankar Valasala 2, J V Subrahmanyam V 3, Mounika Mallampati 4 Kowsharajaha
GIS application in locating suitable sites for solid waste landfills
 GIS application in locating suitable sites for solid waste landfills Jayawickrama, N. T. and Weerasinghe, V. P. A Abstract In Sri Lanka solid wastes are haphazardly dumped in unsuitable locations frequently.
Investigation of the Effect of Transportation Network on Urban Growth by Using Satellite Images and Geographic Information Systems
 Presented at the FIG Congress 2018, May 6-11, 2018 in Istanbul, Turkey Investigation of the Effect of Transportation Network on Urban Growth by Using Satellite Images and Geographic Information Systems
Modelling of the Interaction Between Urban Sprawl and Agricultural Landscape Around Denizli City, Turkey
 Modelling of the Interaction Between Urban Sprawl and Agricultural Landscape Around Denizli City, Turkey Serhat Cengiz, Sevgi Gormus, Şermin Tagil srhtcengiz@gmail.com sevgigormus@gmail.com stagil@balikesir.edu.tr
Pierce Cedar Creek Institute GIS Development Final Report. Grand Valley State University
 Pierce Cedar Creek Institute GIS Development Final Report Grand Valley State University Major Goals of Project The two primary goals of the project were to provide Matt VanPortfliet, GVSU student, the
Summary Description Municipality of Anchorage. Anchorage Coastal Resource Atlas Project
 Summary Description Municipality of Anchorage Anchorage Coastal Resource Atlas Project By: Thede Tobish, MOA Planner; and Charlie Barnwell, MOA GIS Manager Introduction Local governments often struggle
Pipeline Routing Using Geospatial Information System Analysis
 Pipeline Routing Using Geospatial Information System Analysis Mahmoud Reza 1 Delavar and Fereydoon 2 Naghibi 1-Assistance Professor, Dept. of Surveying and Geomatic Eng., Eng. Faculty, University of Tehran,
INTERNATIONAL JOURNAL OF GEOMATICS AND GEOSCIENCES Volume 6, No 2, 2015
 INTERNATIONAL JOURNAL OF GEOMATICS AND GEOSCIENCES Volume 6, No 2, 2015 Copyright by the authors - Licensee IPA- Under Creative Commons license 3.0 Research article ISSN 0976 4380 An Analysis of Land use
Integrated Remote Sensing and GIS Approach for Groundwater Exploration using Analytic Hierarchy Process (AHP) Technique.
 Technique.") ISSN (Online) : 2319-8753 ISSN (Print) : 2347-6710 International Journal of Innovative Research in Science, Engineering and Technology An ISO 3297: 2007 Certified Organization, Volume 2, Special Issue
ISSN (Online) : 2319-8753 ISSN (Print) : 2347-6710 International Journal of Innovative Research in Science, Engineering and Technology An ISO 3297: 2007 Certified Organization, Volume 2, Special Issue
CHAPTER-7 INTERFEROMETRIC ANALYSIS OF SPACEBORNE ENVISAT-ASAR DATA FOR VEGETATION CLASSIFICATION
 147 CHAPTER-7 INTERFEROMETRIC ANALYSIS OF SPACEBORNE ENVISAT-ASAR DATA FOR VEGETATION CLASSIFICATION 7.1 INTRODUCTION: Interferometric synthetic aperture radar (InSAR) is a rapidly evolving SAR remote
This is trial version
 Journal of Rangeland Science, 2012, Vol. 2, No. 2 J. Barkhordari and T. Vardanian/ 459 Contents available at ISC and SID Journal homepage: www.rangeland.ir Full Paper Article: Using Post-Classification
Land Use / Land Cover Change of Delhi: A Study using Remote Sensing and GIS Techniques
 International Research Journal of Earth Sciences ISSN 2321 2527 Int. Res.J. Earth Sci. Land Use / Land Cover Change of Delhi: A Study using Remote Sensing and GIS Techniques Abstract Singh Bijender 1 and
Spatiotemporal Analysis of Noida, Greater Noida and Surrounding Areas (India) Using Remote Sensing and GIS Approaches
 Using Remote Sensing and GIS Approaches") Spatiotemporal Analysis of Noida, Greater Noida and Surrounding Areas (India) Using Remote Sensing and GIS Approaches Gopal Krishna* Indian Agricultural Research Institute, New Delhi, India ABSTRACT Spatiotemporal
Spatiotemporal Analysis of Noida, Greater Noida and Surrounding Areas (India) Using Remote Sensing and GIS Approaches Gopal Krishna* Indian Agricultural Research Institute, New Delhi, India ABSTRACT Spatiotemporal
INVESTIGATION LAND USE CHANGES IN MEGACITY ISTANBUL BETWEEN THE YEARS BY USING DIFFERENT TYPES OF SPATIAL DATA
 INVESTIGATION LAND USE CHANGES IN MEGACITY ISTANBUL BETWEEN THE YEARS 1903-2010 BY USING DIFFERENT TYPES OF SPATIAL DATA T. Murat Celikoyan, Elif Sertel, Dursun Zafer Seker, Sinasi Kaya, Uğur Alganci ITU,
A Comprehensive Inventory of the Number of Modified Stream Channels in the State of Minnesota. Data, Information and Knowledge Management.
 A Comprehensive Inventory of the Number of Modified Stream Channels in the State of Minnesota Data, Information and Knowledge Management Glenn Skuta Environmental Analysis and Outcomes Division Minnesota
INTERNATIONAL JOURNAL OF GEOMATICS AND GEOSCIENCES Volume 4, No 2, 2013
 INTERNATIONAL JOURNAL OF GEOMATICS AND GEOSCIENCES Volume 4, No 2, 2013 Copyright 2010 All rights reserved Integrated Publishing services Research article ISSN 0976 4380 Evaluation of landuse / landcover
Object-based classification of residential land use within Accra, Ghana based on QuickBird satellite data
 International Journal of Remote Sensing Vol. 28, No. 22, 20 November 2007, 5167 5173 Letter Object-based classification of residential land use within Accra, Ghana based on QuickBird satellite data D.
LAND COVER CATEGORY DEFINITION BY IMAGE INVARIANTS FOR AUTOMATED CLASSIFICATION
 LAND COVER CATEGORY DEFINITION BY IMAGE INVARIANTS FOR AUTOMATED CLASSIFICATION Nguyen Dinh Duong Environmental Remote Sensing Laboratory Institute of Geography Hoang Quoc Viet Rd., Cau Giay, Hanoi, Vietnam
THE REVISION OF 1:50000 TOPOGRAPHIC MAP OF ONITSHA METROPOLIS, ANAMBRA STATE, NIGERIA USING NIGERIASAT-1 IMAGERY
 I.J.E.M.S., VOL.5 (4) 2014: 235-240 ISSN 2229-600X THE REVISION OF 1:50000 TOPOGRAPHIC MAP OF ONITSHA METROPOLIS, ANAMBRA STATE, NIGERIA USING NIGERIASAT-1 IMAGERY 1* Ejikeme, J.O. 1 Igbokwe, J.I. 1 Igbokwe,
Review Using the Geographical Information System and Remote Sensing Techniques for Soil Erosion Assessment
 Polish J. of Environ. Stud. Vol. 19, No. 5 (2010), 881-886 Review Using the Geographical Information System and Remote Sensing Techniques for Soil Erosion Assessment Nuket Benzer* Landscape Architecture
High resolution wetland mapping I.
 High resolution wetland mapping I. Based on the teaching material developed by Steve Kas, GeoVille for WOIS Product Group #5 Dr. Zoltán Vekerdy and János Grósz z.vekerdy@utwente.nl vekerdy.zoltan@mkk.szie.hu
DEVELOPMENT OF DIGITAL CARTOGRAPHIC DATABASE FOR MANAGING THE ENVIRONMENT AND NATURAL RESOURCES IN THE REPUBLIC OF SERBIA
 DEVELOPMENT OF DIGITAL CARTOGRAPHIC BASE FOR MANAGING THE ENVIRONMENT AND NATURAL RESOURCES IN THE REPUBLIC OF SERBIA Dragutin Protic, Ivan Nestorov Institute for Geodesy, Faculty of Civil Engineering,
Landuse/Landcover Change Detection in Umshing- Mawkynroh of East Khasi Hills District, Meghalaya Using Spatial Information Technology
 International Journal of Scientific and Research Publications, Volume 6, Issue 1, January 2016 197 Landuse/Landcover Change Detection in Umshing- Mawkynroh of East Khasi Hills District, Meghalaya Using
CHANGES IN VIJAYAWADA CITY BY REMOTE SENSING AND GIS
 International Journal of Civil Engineering and Technology (IJCIET) Volume 8, Issue 5, May 2017, pp.217 223, Article ID: IJCIET_08_05_025 Available online at http://www.ia aeme.com/ijciet/issues.asp?jtype=ijciet&vtyp
Digital Change Detection Using Remotely Sensed Data for Monitoring Green Space Destruction in Tabriz
 Int. J. Environ. Res. 1 (1): 35-41, Winter 2007 ISSN:1735-6865 Graduate Faculty of Environment University of Tehran Digital Change Detection Using Remotely Sensed Data for Monitoring Green Space Destruction
CHAPTER 4 METHODOLOGY
 71 CHAPTER 4 METHODOLOGY 4.1 GENERAL Drought, a vague phenomenon, has been defined and analyzed in various ways. Drought assessment involves analysis of spatially and temporally varying water related data.
Chapter 14 The technical role of government authorities in watershed management
 Chapter 14 The technical role of government authorities in watershed management 14.1 Objectives and procedural outline 1) Purpose of this chapter as related to participatory watershed management The participatory
Evaluating Urban Vegetation Cover Using LiDAR and High Resolution Imagery
 Evaluating Urban Vegetation Cover Using LiDAR and High Resolution Imagery Y.A. Ayad and D. C. Mendez Clarion University of Pennsylvania Abstract One of the key planning factors in urban and built up environments
International Journal of Intellectual Advancements and Research in Engineering Computations
 ISSN:2348-2079 Volume-5 Issue-2 International Journal of Intellectual Advancements and Research in Engineering Computations Agricultural land investigation and change detection in Coimbatore district by
the Clinch/Hidden Valley study site were used in this mountainous classification.
 the Clinch/Hidden Valley study site were used in this mountainous classification. Deciduous forest was present on over half of the image (Table 97). Coniferous forest and herbaceous were the only other
LAND USE AND LAND COVER ANALYSIS USING 8- BAND DATA: A CASE STUDY OF BELGAUM CITY AND ITS SURROUNDING.
 LAND USE AND LAND COVER ANALYSIS USING 8- BAND DATA: A CASE STUDY OF BELGAUM CITY AND ITS SURROUNDING. Mrs. Rita Basanna *, Dr. A.K. Wodeyar ** ABSTRACT Monitoring land-use change has become an important
Measuring and Monitoring SDGs in Portugal: Ratio of land consumption rate to population growth rate Mountain Green Cover Index
 Measuring and Monitoring SDGs in Portugal: 11.3.1Ratio of land consumption rate to population growth rate 15.4.2 Mountain Green Cover Index United Nations World Geospatial Information Congress João David
Spatial Analysis and Modeling of Urban Land Use Changes in Lusaka, Zambia: A Case Study of a Rapidly Urbanizing Sub- Saharan African City
 Spatial Analysis and Modeling of Urban Land Use Changes in Lusaka, Zambia: A Case Study of a Rapidly Urbanizing Sub- Saharan African City January 2018 Matamyo SIMWANDA Spatial Analysis and Modeling of
An Internet-based Agricultural Land Use Trends Visualization System (AgLuT)
") An Internet-based Agricultural Land Use Trends Visualization System (AgLuT) Second half yearly report 01-01-2001-06-30-2001 Prepared for Missouri Department of Natural Resources Missouri Department of
An Internet-based Agricultural Land Use Trends Visualization System (AgLuT) Second half yearly report 01-01-2001-06-30-2001 Prepared for Missouri Department of Natural Resources Missouri Department of
MAPPING LAND USE/ LAND COVER OF WEST GODAVARI DISTRICT USING NDVI TECHNIQUES AND GIS Anusha. B 1, Sridhar. P 2
 MAPPING LAND USE/ LAND COVER OF WEST GODAVARI DISTRICT USING NDVI TECHNIQUES AND GIS Anusha. B 1, Sridhar. P 2 1 M. Tech. Student, Department of Geoinformatics, SVECW, Bhimavaram, A.P, India 2 Assistant
A soft computing logic method for agricultural land suitability evaluation
 A soft computing logic method for agricultural land suitability evaluation B. Montgomery 1, S. Dragićević 1* and J. Dujmović 2 1 Geography Department, Simon Fraser University, 8888 University Drive, Burnaby,
Determination of Suitable Landfill Site Using Geospatial Techniques: A Case study of Vasai-Virar City
 Determination of Suitable Landfill Site Using Geospatial Techniques: A Case study of Vasai-Virar City Ms. Priyanka S. Deshmukh 1, Prof. Upendra R. Saharkar 2 1 P.G Student, Department of Civil Engineering,
A Method for Mapping Settlement Area Boundaries in the Greater Golden Horseshoe
 A Method for Mapping Settlement Area Boundaries in the Greater Golden Horseshoe Purpose This paper describes a method for mapping and measuring the lands designated for growth and urban expansion in the
INTEGRATION OF GIS AND MULTICRITORIAL HIERARCHICAL ANALYSIS FOR AID IN URBAN PLANNING: CASE STUDY OF KHEMISSET PROVINCE, MOROCCO
 Geography Papers 2017, 63 DOI: http://dx.doi.org/10.6018/geografia/2017/280211 ISSN: 1989-4627 INTEGRATION OF GIS AND MULTICRITORIAL HIERARCHICAL ANALYSIS FOR AID IN URBAN PLANNING: CASE STUDY OF KHEMISSET
Use of Corona, Landsat TM, Spot 5 images to assess 40 years of land use/cover changes in Cavusbasi
 New Strategies for European Remote Sensing, Olui (ed.) 2005 Millpress, Rotterdam, ISBN 90 5966 003 X Use of Corona, Landsat TM, Spot 5 images to assess 40 years of land use/cover changes in Cavusbasi N.
Quick Response Report #126 Hurricane Floyd Flood Mapping Integrating Landsat 7 TM Satellite Imagery and DEM Data
 Quick Response Report #126 Hurricane Floyd Flood Mapping Integrating Landsat 7 TM Satellite Imagery and DEM Data Jeffrey D. Colby Yong Wang Karen Mulcahy Department of Geography East Carolina University
Simulation of Wetlands Evolution Based on Markov-CA Model
 Simulation of Wetlands Evolution Based on Markov-CA Model ZHANG RONGQUN 1 ZHAI HUIQING 1 TANG CHENGJIE 2 MA SUHUA 2 1 Department of Geography informantion science, College of information and Electrical
The Road to Data in Baltimore
 Creating a parcel level database from high resolution imagery By Austin Troy and Weiqi Zhou University of Vermont, Rubenstein School of Natural Resources State and local planning agencies are increasingly
Defining the Limit of Regulated Areas. C.1 Defining the River or Stream Flood Hazard 138. C.2 Defining the River or Stream Erosion Hazard 139
 C.1 Defining the River or Stream Flood Hazard 138 C.2 Defining the River or Stream Erosion Hazard 139 C.3 Defining Watercourses 141 C.4 Defining the Lake Ontario Shoreline Flood, Erosion and Dynamic Beach
Managing uncertainty when aggregating from pixels to parcels: context sensitive mapping and possibility theory
 Department of Geography Managing uncertainty when aggregating from pixels to parcels: context sensitive mapping and possibility theory Dr Lex Comber ajc36@le.ac.uk www.le.ac.uk/gg/staff/academic_comber.htm
USING GIS FOR DEVELOPING SUSTAINABLE URBAN GROWTH CASE KYRENIA REGION
 USING GIS FOR DEVELOPING SUSTAINABLE URBAN GROWTH CASE KYRENIA REGION Can Kara 1,* Nuhcan Akçit 2, * 1 Nearest University, Nicosia, Faculty of Architecture, Nicosia Cyprus, Email: can.kara@neu.edu.tr 2
Raster Spatial Analysis Specific Theory
 RSATheory.doc 1 Raster Spatial Analysis Specific Theory... 1 Spatial resampling... 1 Mosaic... 3 Reclassification... 4 Slicing... 4 Zonal Operations... 5 References... 5 Raster Spatial Analysis Specific
Land Resources Expansion Monitoring and Management: A RS-GIS Approach
 International Journal of Scientific and Research Publications, Volume 2, Issue 10, October 2012 1 Land Resources Expansion Monitoring and Management: A RS-GIS Approach Ajay Singh Tomar *, U. C.Singh **
Abstract. 1. Introduction. 2. Materials and Methods. 2.1 Study Area
 Land Use and Land Cover Mapping by using Remote Sensing and GIS Techniques a Case Study of Kasaba Hobli, Hoskote Taluk, Bangalore Rural District, Karnataka, India. Prof. Dr. P. K. Srimani, F.N.A.Sc., Prof
Land Use and Land Cover Mapping and Change Detection in Jind District of Haryana Using Multi-Temporal Satellite Data
 Land Use and Land Cover Mapping and Change Detection in Jind District of Haryana Using Multi-Temporal Satellite Data Ravindra Prawasi, M.P. Sharma, T. P. Babu, Om Pal, Saroj, Kirti Yadav, R.S.Hooda Abstract
Wastelands Analysis and Mapping of Bhiwani District, Haryana
 Wastelands Analysis and Mapping of Bhiwani District, Haryana Virender Sihag Research Scholar, Department of Geography, OPJS University, Churu, Rajasthan ABSTRACT This study aimed at monitoring, mapping,
Calculating Land Values by Using Advanced Statistical Approaches in Pendik
 Presented at the FIG Congress 2018, May 6-11, 2018 in Istanbul, Turkey Calculating Land Values by Using Advanced Statistical Approaches in Pendik Prof. Dr. Arif Cagdas AYDINOGLU Ress. Asst. Rabia BOVKIR
Land Use and Land Cover Detection by Different Classification Systems using Remotely Sensed Data of Kuala Tiga, Tanah Merah Kelantan, Malaysia
 Land Use and Land Cover Detection by Different Classification Systems using Remotely Sensed Data of Kuala Tiga, Tanah Merah Kelantan, Malaysia Wani Sofia Udin*, Zuhaira Nadhila Zahuri Faculty of Earth
Shalaby, A. & Gad, A.
 Urban Sprawl Impact Assessment on the Fertile Agricultural Land of Egypt Using Remote Sensing and Digital Soil Database, Case study: Qalubiya Governorate Shalaby, A. & Gad, A. National Authority for Remote
Multifunctional theory in agricultural land use planning case study
 Multifunctional theory in agricultural land use planning case study Introduction István Ferencsik (PhD) VÁTI Research Department, iferencsik@vati.hu By the end of 20 th century demands and expectations
1. Introduction. S.S. Patil 1, Sachidananda 1, U.B. Angadi 2, and D.K. Prabhuraj 3
 Cloud Publications International Journal of Advanced Remote Sensing and GIS 2014, Volume 3, Issue 1, pp. 525-531, Article ID Tech-249 ISSN 2320-0243 Research Article Open Access Machine Learning Technique
Development of statewide 30 meter winter sage grouse habitat models for Utah
 Development of statewide 30 meter winter sage grouse habitat models for Utah Ben Crabb, Remote Sensing and Geographic Information System Laboratory, Department of Wildland Resources, Utah State University
M.C.PALIWAL. Department of Civil Engineering NATIONAL INSTITUTE OF TECHNICAL TEACHERS TRAINING & RESEARCH, BHOPAL (M.P.), INDIA
, INDIA") INVESTIGATIONS ON THE ACCURACY ASPECTS IN THE LAND USE/LAND COVER MAPPING USING REMOTE SENSING SATELLITE IMAGERY By M.C.PALIWAL Department of Civil Engineering NATIONAL INSTITUTE OF TECHNICAL TEACHERS
INVESTIGATIONS ON THE ACCURACY ASPECTS IN THE LAND USE/LAND COVER MAPPING USING REMOTE SENSING SATELLITE IMAGERY By M.C.PALIWAL Department of Civil Engineering NATIONAL INSTITUTE OF TECHNICAL TEACHERS
GIS Modeling for an Optimal Road Route Location: Case Study of Moiben-Kapcherop-Kitale Road
 American Journal of Geographic Information System 2017, 6(1): 26-39 DOI: 10.5923/j.ajgis.20170601.03 GIS Modeling for an Optimal Road Route Location: Case Study of Moiben-Kapcherop-Kitale Road Isaac K.
Dr. S.SURIYA. Assistant professor. Department of Civil Engineering. B. S. Abdur Rahman University. Chennai
 Hydrograph simulation for a rural watershed using SCS curve number and Geographic Information System Dr. S.SURIYA Assistant professor Department of Civil Engineering B. S. Abdur Rahman University Chennai
GIS Based Delineation of Micro-watershed and its Applications: Mahendergarh District, Haryana
 Kamla-Raj 2012 J Hum Ecol, 38(2): 155-164 (2012) GIS Based Delineation of Micro-watershed and its Applications: Mahendergarh District, Haryana Gulshan Mehra and Rajeshwari * Department of Geography, Kurukshetra
SITE SUITABILITY ANALYSIS FOR URBAN DEVELOPMENT USING GIS BASE MULTICRITERIA EVALUATION TECHNIQUE IN NAVI MUMBAI, MAHARASHTRA, INDIA
 International Journal of Advanced Research in Engineering and Technology (IJARET) Volume 10, Issue 1, January- February 2019, pp. 55-69, Article ID: IJARET_10_01_006 Available online at http://www.iaeme.com/ijaret/issues.asp?jtype=ijaret&vtype=10&itype=01
URBAN CHANGE DETECTION OF LAHORE (PAKISTAN) USING A TIME SERIES OF SATELLITE IMAGES SINCE 1972
 USING A TIME SERIES OF SATELLITE IMAGES SINCE 1972") URBAN CHANGE DETECTION OF LAHORE (PAKISTAN) USING A TIME SERIES OF SATELLITE IMAGES SINCE 1972 Omar Riaz Department of Earth Sciences, University of Sargodha, Sargodha, PAKISTAN. omarriazpk@gmail.com ABSTRACT
URBAN CHANGE DETECTION OF LAHORE (PAKISTAN) USING A TIME SERIES OF SATELLITE IMAGES SINCE 1972 Omar Riaz Department of Earth Sciences, University of Sargodha, Sargodha, PAKISTAN. omarriazpk@gmail.com ABSTRACT
URBAN GROWTH SIMULATION: A CASE STUDY
 URBAN GROWTH SIMULATION: A CASE STUDY V. Swathi 1, S. Sai Veena 2, K. Srinivasa Raju 3 1 Research Scholar, 2 Under Graduate Student, 3 Professor * Corresponding Author; Email: p201244029@hyderabad.bits-pilani.ac.in.
A Logistic Regression Method for Urban growth modeling Case Study: Sanandaj City in IRAN
 A Logistic Regression Method for Urban growth modeling Case Study: Sanandaj City in IRAN Sassan Mohammady GIS MSc student, Dept. of Surveying and Geomatics Eng., College of Eng. University of Tehran, Tehran,
Land Use Change Detection in Baragaon Block, Varanasi District Using Remote Sensing
 International Journal of Engineering Science Invention ISSN (Online): 2319 6734, ISSN (Print): 2319 6726 Volume 2 Issue 7ǁ July. 2013 ǁ PP.49-53 Land Use Change Detection in Baragaon Block, Varanasi District
Comparison of MLC and FCM Techniques with Satellite Imagery in A Part of Narmada River Basin of Madhya Pradesh, India
 Cloud Publications International Journal of Advanced Remote Sensing and GIS 013, Volume, Issue 1, pp. 130-137, Article ID Tech-96 ISS 30-043 Research Article Open Access Comparison of MLC and FCM Techniques
LAND COVER IN OHIO S TOWNSHIPS: AN ANALYSIS OF TOWNSHIP LAND COVER AND POPULATION CHANGE
 THE EXURBAN CHANGE PROJECT REPORT NUMBER EX-3: LAND COVER IN OHIO S TOWNSHIPS: AN ANALYSIS OF TOWNSHIP LAND COVER AND POPULATION CHANGE (FEBRUARY 2002) Prepared by: Jason W. Reece Data Manager & GIS Analyst
Principals and Elements of Image Interpretation
 Principals and Elements of Image Interpretation 1 Fundamentals of Photographic Interpretation Observation and inference depend on interpreter s training, experience, bias, natural visual and analytical