Fundamentals of Remote Sensing REMS5001 CAPSTONE PROJECT
|
|
|
- Pamela Page
- 5 years ago
- Views:
Transcription
1 Fundamentals of Remote Sensing REMS5001 CAPSTONE PROJECT Due Date December 10, 2014 W
2 TABLE OF CONTENTS 1.0 Introduction Study Area Procedures Vector National Road and Hydro Networks.. 2 Digital Elevation Model (DEM)... 3 Orthorectification).. 3 Land Cover Classification. 4 Filtering and Vectorization Conclusions... 6 References... 7 Appendix 1 Orthorectification Metadata.. 8 Appendix 2 Land Cover Classification Metadata.. 10 Appendix 3 SPOT 5 image and Land Cover Classification Map. 8 Appendix 4 Data Organization and Data Catalogue 9 LIST OF FIGURES Figure 1: Regional Digital elevation model for Nova Scotia illustration location of multispectral SPOT 5 satellite imagery used in this study. 1 Figure 2: Google Earth Image showing location of SPOT 5 imagery relative to nearest regional center and Cape Breton Highlands National Park.. 2 Figure 3: Screen grab illustrating compilation ArcGIS workspace associated with this project. 2 Figure 4: Screen grab illustrating overlap of vector road-hydro reference data and final orthorectified SPOT 5 Imagery 3 Figure 5: Screen grab of false colour composite and correlation to final information class types... 4 Figure 6: Comparison of Herbaceous and Deciduous information classes illustrating spectral overlap Figure 7: Google Earth, SPOT false colour composite and final land cover classification images for the Wetland information class 5 Figure A1-1: Screen grab illustrating the distribution of ground control points (pink) and check points (yellow) used to orthorectify the SPOT 5 imagery. 8 Figure A2-1: Spectral profile of final 8 information classes. 12 Figure A2-2: X-Y plot of band 1 vs. 4 illustrating distribution of information classes at 2 standard deviations.. 12 i
3 Figure A2-3: Final thematic classification compared to SPOT 5 image for Developed information class illustrating the overlap with Barren land cover class.. 12 Figure A2-4: Final classification compared to SPOT 5 image for Developed information class illustrating the overlap with Barren land cover class. 13 Figure A3-1: False colour composite and land cover classification of SPOT 5 Imagery Figure A4-1: Schematic diagram summarizing folder hierarchy and data storage Figure A4-2: Road and Hydro networks trimmed to SPOT 5 scene footprint underlain by DEM mosaic LIST OF TABLES Table A1-1: Check Point residual and RMS data used to orthorectify SPOT 5 Imagery. 8 Table A1-2: Ground Control Point residual and RMS data used to orthorectify SPOT 5 imagery 9 Table A2-1: Summary of representative and final merged spectral classes that characterize 8 information classes Table A2-2: Best Average Separability data calculated using Euclidean Distance. 10 Table A2-3: Classification Accuracy Assessment Filtered Results 11 Table A2-4: Classification Accuracy Assessment Filtered Results 11 TABLE A4-1: Summary of vertical and horizontal accuracies for individual DEMS used to create final mosaic DEM ii
.")
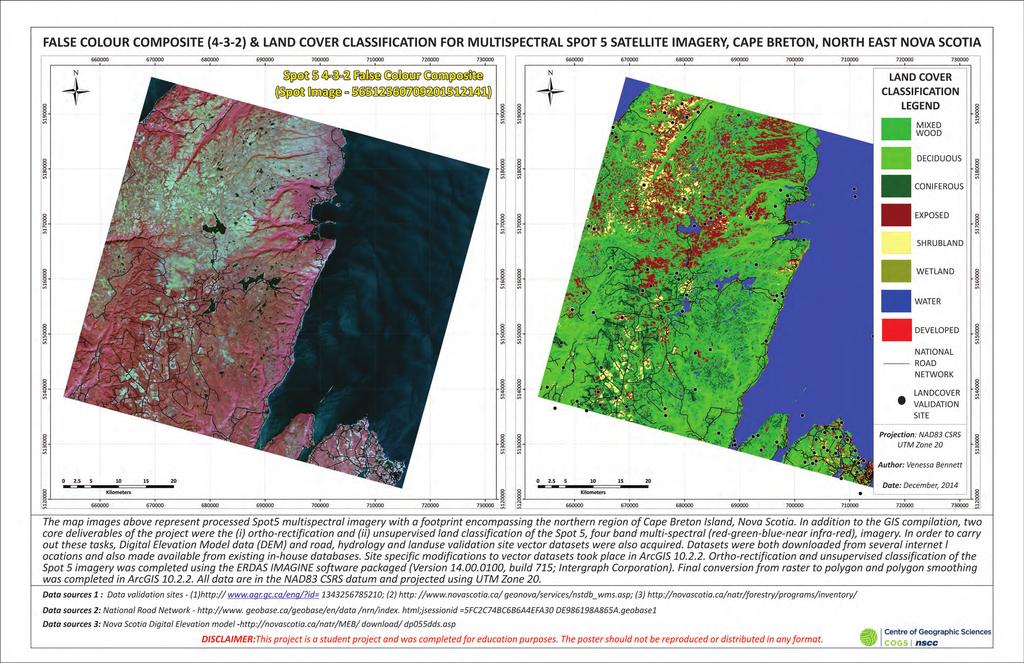
4 1.0 Introduction The following report provides an overview of a Geographic Information Systems (GIS) compilation package, focussing on SPOT5 multispectral imagery from the northern region of Cape Breton Island, Nova Scotia (Figure 1). In addition to the GIS compilation, two core deliverables of the project were the (i) ortho-rectification and (ii) unsupervised land classification of the SPOT 5, four band multi-spectral (red-green-blue-near infra-red), imagery. In order to carry out these tasks, Digital Elevation Model data (DEM) and road, hydrology and landuse validation site vector datasets were also acquired. Each dataset is briefly discussed with respect to data sources and the associated data manipulation and/or image processing techniques employed prior to final compilation in an ArcGIS workspace. Datasets were both downloaded from several internet locations and also made available from existing in-house databases. Site specific modifications to vector datasets took place in ArcGIS Ortho-rectification and unsupervised classification of the SPOT 5 imagery was completed using the ERDAS IMAGINE software packaged (Version , build 715; Intergraph Corporation). Final conversion from raster to polygon and polygon smoothing was completed in ArcGIS Metadata pertaining to orthorectification accuracy, classification separability and accuracy are provided in Appendices 1 and 2. An 11x17 in map illustrating the results of the unsupervised classification on the SPOT 5 data is provided in Appendix 3. All data are in the NAD83 CSRS datum and projected using UTM Zone 20. Figure 1: Regional Digital elevation model for Nova Scotia illustration location of multispectral SPOT 5 satellite imagery used in this study. Nova Scotia Digital Elevation model sourced from download/dp055dds.asp. 2.0 Study Area The SPOT 5 ( j.img) data is located between the latitudes of o N and o N and longitudes of o W and o W. The largest regional centre closest to the scene footprint is town of Sydney ( o N, o W, Figure 1). The region encompassed by the SPOT 5 imagery is sparsely populated, characterised by relatively minor land use activities (compared to other regions of Nova Scotia). Logging and minor farming activities are visible in the southern half of the scene. The increase in percentage of exposed bedrock coincides with an increase in overall relief in the northern half of the imagery. The Cape Breton Highlands National Park broadly overlaps this part of the SPOT 5 Image (Figure 2). 1
 consists of six vector files (3 line, 1 point, 1 polygon) and four raster datasets and (Figure 3). Each dataset is discussed below. Figure 3: Screen grab illustrating compilation ArcGIS 10.2.")

5 Figure 2: Google Earth Image showing location of SPOT 5 imagery relative to nearest regional center and Cape Breton Highlands National Park 3.0 Procedures The final compilation ArcGIS workspace (Landcover_VBennett.mxd) consists of six vector files (3 line, 1 point, 1 polygon) and four raster datasets and (Figure 3). Each dataset is discussed below. Figure 3: Screen grab illustrating compilation ArcGIS workspace associated with this project. Vector National Road and Hydro Networks The National Road and Hydro network datasets (NRN, NHN) represent vector line data encompassing all of Nova Scotia. The two vector datasets were used as the reference dataset to orthorectify the raw SPOT 5 imagery. The data were first clipped to the scene footprint and subsequently merged for use in Erdas Imagine. The compilation file is provided in the final ArcGIS workspace in addition to the national road and hydro shape files. The hydro dataset was particularly useful in the Cape Breton area due to the paucity of roads across the scene area. 2
.")
6 Digital Elevation Model (DEM) A DEM mosaic that coincides with the footprint of the SPOT 5 data was created from individual DEM files publicly available from A table summarizing vertical and horizontal accuracies for each DEM used in the mosaic is provided in Appendix 4 (Table A4-1). For this project, the final mosaic DEM was assumed to have a horizontal accuracy of 3 m and a vertical accuracy of 9.6 m. Fifteen individual DEM s were used to create a mosaic encompassing the entire SPOT 5 scene. No DEM data were available for a small portion of the NE corner of the multispectral image which was entirely located over ocean. A separate ArcGIS workspace (DEM_Mosaic_N83CSRS), an associated geodatabase (DEM_NAD83CSRS.gdb)housing the individual DEMS and a final mosaic (in NAD83CSRS datum) in addition to metadata information are included in the data deliverables for this project. The individual DEM s were merged into a mosaic in ArcGIS using the Mosaic to New raster tool. The final mosaic was clipped to the scene footprint and re-projected to NAD83CSRS UTM z20 for use in ERDAS Imagine. The clipped mosaic is located in the (Landcover_VBennett.mxd) workspace. Orthorectification The SPOT 5 scene (651_256) was imported into ERDAS Imagine, in addition to the merged and clipped Road_Hydro dataset. Ortho-rectification was completed using the SPOT geometric model which is a custom mathematical model allowing accurate orthorectification of SPOT panchromatic or multispectral data that uses a pushbroom sensor type. Fifty five ground control points were selected from the SPOT Image and the vector reference imagery. Nine additional check points were defined across the image and reference data to assess resultant model accuracy. Ground Control Point and CP summary tables with residuals and Root Mean Square (RMS) calculations, in addition to a screen grab illustrating the distribution of the control points are located in Appendix 1 (Tables A1-2, A1-3, Figure A1-1). For accurate ortho-rectification, the average RMS value should be less than the spatial resolution of the SPOT 5 imagery (i.e. <20m; (FRS Oct 2014, Lecture 8, slides 20-21). Final average RMS values calculated for GCP and CP datasets were (m) and (m), respectively. These values are significantly below the 20 m resolution of the SPOT 5 imagery for both the GCP and CP datasets. The RMS results indicate the selection of control points was sufficiently evenly distributed to allow for an accurate geometric model and final geocorrection of the dataset. Figure 4 shows the results of the ortho-rectification for the SE corner of the SPOT 5 image, centred on the town of Sydney Mines. The overlay of the road vector network shows good visual correlation with the underlying roads within the raster image. Figure 4: Screen grab illustrating overlap of vector road-hydro reference data and final orthorectified SPOT 5 Imagery 3

7 Land Cover Classification A land cover classification was carried on the SPOT 5 imagery in order to generate both raster and vector thematic imagery for use in ArcGIS Statistical recognition methodologies are used to group the multispectral data into to spectral and ultimately, more simplified information classes. For this study, the intent was to integrate land cover classifications completed on SPOT imagery covering all of Nova Scotia and carried out by several different analysts. To successfully achieve this, a consistent classification method and classification scheme was adopted that was based on the GeoBase Land Cover 2000 project (see Appendix 4) Thirteen information classes and associated universal codes were provided to classify to the 651_256 SPOT 5 image. Eight of the thirteen information classes were identified in the 651_256 SPOT 5 scene. An unsupervised classification, in which the software allows the computer to group pixels into unique clusters based on spectral similarity (Jensen 2005), was completed on the dataset. Time was not available to conduct the appropriate field verification, nor was the analyst an expert in land cover types in this particular region of Nova Scotia. The K means algorithm was used to complete the unsupervised classification. Fifty classes (i.e data cluster centres) were assigned after 10 iterations of the k-means algorithm. The algorithm assigns each pixel to a cluster center where the value of the pixel is closest to the mean of the cluster center. After a preliminary visual examination of land cover class types occurring across the SPOT 5 scene, each recognized land cover type was subsequently examined to identify representative spectral classes and how many spectral classes characterised a land cover type. A summary table is provided in Appendix 2 illustrating the association between land cover type (information class) and associated spectral class (Table A2-1). Digital surficial geology data for Nova Scotia ( was used to identify land feature types in the northern part of the imagery. Additionally, in-house, digital forestry data was also utilized to identify broad distribution of vegetation species. A 1(red gun)-2(green gun)- 4(blue gun)false colour composite was particularly useful for first-order subdivision of the imagery (Figure 5). Figure 5: Screen grab of false colour composite and correlation to final information class types. A significant problem in the final classified data that uses only 4-band multispectral data is the high degree of spectral overlap between many information classes. In several instances, the representative spectral class was the same for 2 (or more) information classes. Figure 6 illustrates the overlap problem using the Herbaceous vs. Deciduous Information classes where spectral class 49 was most diagnostic for both information classes. 4
. As the Herbaceous land cover class could not be resolved spectrally from Deciduous, it was removed from the final classification.")

8 Figure 6: Comparison of Herbaceous and Deciduous information classes illustrating spectral overlap Separability metadata illustrating the spectral overlap between information classes is provided in Appendix 2 (Table A2-2, Figure A2-1, A2-2). As the Herbaceous land cover class could not be resolved spectrally from Deciduous, it was removed from the final classification. Similar problems occur between, (i) Exposed/barren vs. Shrubland (Appendix 2, Figure A2-3) (ii) Exposed/barren vs. Developed (Appendix 2, Figure A2-4) (iii) Wetland vs. Barren and Deciduous, Mixed Wood and Shrubland. The wetland information class was the least spectrally distinct of all final 8 information class defined for the final classification. A review of the false colour composite and the counterpart Google Earth imagery (Figure 7) illustrates the wetland class represents several other spatially resolveable information classes including barren/exposed, shrubland, deciduous. Figure 7: Google Earth, SPOT false colour composite and final land cover classification images for the Wetland information class. The high degree of spectral overlap between several land cover information classes degraded the resultant classification accuracy if allowances were not made during accuracy assessment. Accuracy assessment was carried out using a point validation dataset acquired in-house. The validation data represents a synthesis of 5
9 1:50,000 scale digital datasets including the Land Cover for Agricultural regions of Canada dataset, the Nova Scotia Topographic Database (NSTDB) and the Department of Natural Resources (DNR) Forest Inventory. Information on the Land Cover for Agricultural Regions of Canada data is located at Information on the NSTSB is found and details of the Nova Scotia Forestry inventory is located Two accuracy assessments were completed, the first involved an assessment of classified image using nine information classes and ignoring the spectral overlap problems (i.e. Herbaceous included). The resultant accuracy of the classified data was 56.7% (See Appendix 2, Table A2-3). A second accuracy assessment was also performed that conducted the following modifications: 1. The Herbaceous information class was removed from the accuracy assessment. Where the Deciduous class (220) occurred in place of Herbaceous (100), this was considered a match. 2. Where the Barren class (33) was classified as Developed (34) and vice versa, this was also deemed a match. 3. Where the Barren (33) was classified as Shrubland (50), this was considered a match. 4. Where the wetlands (80) overlapped with barren (30) this was considered a match. When these allowances were made, the resultant accuracy assessment was 78.5 % (Appendix 2, Table A2-4). Filtering and Vectorization Prior to export of the classified image to ArcGIS , filtering of the classified data was carried out to reduce erroneous pixels and smooth individual class boundaries. Clumping statistics were calculated for the image, in which contiguous groups of pixels were clumped into one thematic class. Various filters were then applied to the clumped data. The eliminate filter removes a user-specified size of clumps and replaces them with values of the adjacent (majority) clump. A pixel size of 50 was set as it provided the best compromise between loss of data and excessive pixel detail (noise). A statistical filter was then applied to the data in which a 3x3 pixel window was assigned a value based on the most frequently occurring DN value in that 3x3 pixel block (majority function). The final classified, filtered and smoothed imagery was imported into ArcGIS where it was subsequently vectorized using the raster to polygon tool. Both the vector and raster classified image can be found in the Landcover_VBennett.mxd. A layer file is also provided in the case that thematic coding is corrupted or lost during transfer of data. 4.0 Conclusions The GIS data compilation product associated with this report contains the results of ortho-rectification and land cover classification conducted on SPOT 5 imagery acquired in 2007 and focussed on the northern part of Cape Breton. The scene footprint overlaps the location of the Cape Breton Highlands National Park and is characterized by comparatively minor anthropogenic land use activities (mainly logging and farming), with respect the rest of Nova Scotia. Accurate ortho-rectification was achieved using a reference dataset comprised of merged and clipped line data from the National Road Network for Canada (10 m accuracy) and the National Hydro Network for Canada (30 m maximum accuracy). A Digital Elevation Model (DEM) mosaic was created from 15 individual DEM and used to resample the SPOT 5 imagery to permit subsequent land cover classification. An unsupervised classification was completed using the K-Means Algorithm provided in the Erdas Imagine software package. Eight information classes were defined from 50 spectral classes. An accuracy assessment using externally supplied validation sites highlighted the significant spectral overlap that occurs between information classes, such that accurate resolution of certain information classes was not possible (e.g. deciduous vs. herbaceous). Allowances were made during a second round of accuracy assessment that took into account the spectral overlap occurring in the four-band multispectral data. Improvement on the overall classification accuracy is unlikely because of the limited number of multispectral bands available to fingerprint each information class. Additional field verification may help with overall accuracy. Application of a different 6
10 classification scheme that is more amenable to the resolution the four band multispectral imagery provided may represent a longer term solution to achieving better classification results. Final filtering, smoothing and vectorization of the classified image were completed prior to final export into ArcGIS All pertinent datasets that may be required by the user are located in a series of folders (see Appendix 4 for detail), and a compilation ArcGIS workspace is provided for easy access to final generated data products. References Jensen, J. R. Introductory Digital Image Processing, 3 rd edition, Prentice Hall, Fundamentals of Remote Sensing Oct 2014, Lecture 8 (geocorrection, slides 20-21). Unpublished lecture, Centre of geographic Sciences. 7

11 Appendix 1 Orthorectification Metadata Figure A1-1: Screen grab illustrating the distribution of ground control points (pink) and check points (yellow) used to orthorectify the SPOT 5 imagery. PointID Xinput Yinput Xref Yref Xresidual _meter Yresidual _meter RMS Error Contribution PointID Xinput Yinput Xref Yref Xresidual _meter Yresidual _meter RMS Error Contribution GCP # GCP # GCP # GCP # GCP # GCP # GCP # GCP # GCP # Table A1-1: Check Point residual and RMS data used to orthorectify SPOT 5 imagery 8
12 PointID Xinput Yinput Xref Yref Xresidual _meters Yresidual _meters RMS Error Contribution GCP # GCP # GCP # GCP # GCP # GCP # GCP # GCP # GCP # GCP # GCP # GCP # GCP # GCP # GCP # GCP # GCP # GCP # GCP # GCP # GCP # GCP # GCP # GCP # GCP # GCP # GCP # GCP # GCP # GCP # GCP # GCP # GCP # GCP # GCP # GCP # GCP # GCP # GCP # GCP # GCP # GCP # GCP # GCP # GCP # GCP # GCP # GCP # GCP # GCP # GCP # GCP # GCP # GCP # GCP # Table A1-2: Ground Control Point residual and RMS data used to orthorectify SPOT 5 imagery 9
13 Appendix 2 Classification Metadata Information Class Code Representative spectral classes Overlapping Information Classes Merged Classes Deciduous , 44, 45, 46, 49 Herbaceous, Shrubland, Mixed Wood, Wetland 43, 44, 46 Coniferous ,19, 20, 21, 27 Mixed Wood, Wetland Mixed Wood , 29, 31, 33, 35, 37, 38, 40, 43, 44, 46 Deciduous, Coniferous, Shrubland, Wetland 10, 16, 19, 20, 21, 23, 24, 27 7, 11, 12, 13, 14, 15, 17, 18, 22, 25, 26, 29, 30, 31, 32, 33, 34, 35, 36, 37, 38, 40 Shrubland 50 31,38, 44, 45, 46, 47, 48, 50 Herbaceous, Deciduous, Exposed Land, Developed 48 Water 20 1, 2, 3, 4, 5,6, 8 No overlap 1, 2, 3, 4, 5,6, 8, 9 Exposed Land 33 42, 45, 47, 48, 50 Shrubland, Developed, Herbaceous 41, 45, 47 Developed 34 32, 28, 42, 45, 47, 48, 50 Exposed Land, Herbaceous 42, 50 Wetland 80 16, 17, 18, 21, 26, 28, 29, 30, 32, 34, 36, 39, 41, 45, 47 Spectral Variation extreme Herbaceous , 49 Exposed Land, Developed no designation. Overlap with deciduous Table A2-1: Summary of representative and final merged spectral classes that characterize eight information classes used for classification of SPOT 5 imagery. Bands AVE MIN Class Pairs 1: 2 1: 3 1: 4 1: 5 1: 6 1: 7 1: 8 2: 3 2: 4 2: 5 2: 6 2: 7 2: 8 3: 4 3: 5 3: 6 3: 7 3: 8 4: 5 4: 6 4: 7 4: 8 5: 6 5: 7 5: 8 6: 7 6: 8 7: Table A2-2: Best Average Separability data calculating using Euclidean Distance, using bands 1-4 simultaneous. Classes - 1 Shrubland; 2 Wetland ; 3 Developed; 3 Developed; 4 Barren/Exposed; 5 Deciduous; 6 Coniferous; 7 10
14 Class Reference Classified Number Producers Users Name Totals Totals Correct Accuracy Accuracy Class % % Class % 30.00% Class % 60.00% Class % 46.67% Class % 50.00% Class % 92.31% Class % 53.33% Class % 21.43% Totals Overall Classification Accuracy = 57.01% Table A2-3: Classification Accuracy Assessment Filtered Results Class Reference Classified Number Producers Users Name Totals Totals Correct Accuracy Accuracy Class % % Class % % Class % % Class % 86.67% Class % 50.00% Class % 92.31% Class % 73.33% Class % 21.43% Totals Overall Classification Accuracy = 78.50% Table A2-4: Classification Accuracy Assessment Filtered Results 11


15 Figure A2-1: Spectral profile of final 8 information classes. Figure A2-2: X-Y plot of band 1 vs. 4 illustrating distribution of information classes at 2 standard deviations. Figure A2-3: Final thematic classification compared to SPOT 5 image for Developed information class illustrating the overlap with Barren land cover class. 12

16 Figure A2-4: Final classification compared to SPOT 5 image for Developed information class illustrating the overlap with Barren land cover class. 13
17 Appendix 3 Final Landcover Classification 11 x 17 Map 14
18 15

19 Appendix 4 Data Organization and Data Catalogue Figure A4-1 provides a schematic outline of the folder structure housing all relevant data for the image processing and GIS Compilation project. The parent folder housing all the data is called P2_Bennett_Venessa, and within that folder are 6 subfolders that contain the different datasets for the project. A digital pdf copy of this report is located in the Reports subfolder. Figure A4-1: Schematic diagram summarizing folder hierarchy and data storage. ArcMap Portal: An ArcGIS workspace contains the main data products generated from this report including, the orthorectified SPOT 5 image, the land cover classification (vector and raster), that are housed in the 651_526 group layer and the DEM mosaic, SPOT 5 footprint, and the Road and Hydro network vector files which are located in a group layer called reference. The workspace is in the NAD83CSRS UTM zone 20 projection. Reference Data-Vector: Figure A4-2 illustrates the final DEM mosaic and trimmed road and hydro vector datasets. The data can be downloaded from The original shape files provided for the project were in the NAD83CSRS datum. The national road data has an estimated accuracy of + 10 m. Additional metadata details for the NRN dataset is found at E569E5D39D6B. The hydrographic dataset was created from 1: scale datasets (either provincial or federal datasets). The maximum accuracy for the data is 30 m, but can be accurate to a few meters if provincial data is the source data. For this project, an accuracy of 30 m was assumed. Further details on the NHN meta data can be found at Reference Data-DEM: A DEM mosaic that coincides with the footprint of the SPOT 5 data was created from individual DEM files publicly available from The Canadian Digital Elevation Data (CDED) comprises regularly spaced ground elevations derived from 1: : digital data associated with the National Topographic Data Base (NTDB). Ground Elevations are recorded in metres relative to Mean Sea Level (MSL), based on the North American Datum 1983 (NAD83) horizontal reference datum. A full metadata summary is located at 16

20 Table A4-1 summarizes vertical and horizontal accuracies for each DEM used in the mosaic. For this project, the final mosaic DEM was assumed to have a horizontal accuracy of 3 m and a vertical accuracy of 9.6 m. CDED Region Horizontal Accuracy Vertical Accuracy 011K01, SYDNEY K06, MARGAREE K07, ST. ANNS HARBOUR K08, BRAS D'OR K09, INGONISH K10, CHÉTICAMP RIVER K15, PLEASANT BAY 3 5 TABLE A4-1: Summary of vertical and horizontal accuracies for individual DEMS used to create final mosaic DEM Figure A4-2: Road and Hydro networks trimmed to SPOT 5 scene footprint underlain by DEM mosaic Orthorectified SPOT image: SPOT 5 scene ( j.img) has a spatial resolution of 20 m and consists of 4 bandwidths (blue, green, red and near infra-red). The 10 m resolution panchromatic data was not used in this project. Full details about the accuracy of the SPOT 4 and 5 datasets for Canada is located at The SPOT 5 image used in the project was collected on September 20, 2007 at 15:12:14 pm using the High Resolution Visible sensor number 1. A map of the orthorectified SPOT 5 image is provided in Appendix 3. A false colour composite is displayed in the image. Landcover Classification: A land cover classification was carried on the SPOT 5 imagery in order to generate both raster and vector thematic imagery for use in ArcGIS Eight Information classes were used to create both filtered and smoothed raster and vector datasets for display in ArcGIS. The thematics maps are classified and coloured according to standards defined by the GeoBase Land Cover 2000 project that was primarily developed for vectorization of Landsat 5 and 7 imagery. A description of the Geobase Land Cover, 2000 data is located A map of land cover classification results in vector format image is provided in Appendix 3. 17
7.1 INTRODUCTION 7.2 OBJECTIVE
 7 LAND USE AND LAND COVER 7.1 INTRODUCTION The knowledge of land use and land cover is important for many planning and management activities as it is considered as an essential element for modeling and
Outcrop suitability analysis of blueschists within the Dry Lakes region of the Condrey Mountain Window, North-central Klamaths, Northern California
 Outcrop suitability analysis of blueschists within the Dry Lakes region of the Condrey Mountain Window, North-central Klamaths, Northern California (1) Introduction: This project proposes to assess the
Lecture 5. GIS Data Capture & Editing. Tomislav Sapic GIS Technologist Faculty of Natural Resources Management Lakehead University
 Lecture 5 GIS Data Capture & Editing Tomislav Sapic GIS Technologist Faculty of Natural Resources Management Lakehead University GIS Data Input Surveying/GPS Data capture Facilitate data capture Final
Display data in a map-like format so that geographic patterns and interrelationships are visible
 Vilmaliz Rodríguez Guzmán M.S. Student, Department of Geology University of Puerto Rico at Mayagüez Remote Sensing and Geographic Information Systems (GIS) Reference: James B. Campbell. Introduction to
NR402 GIS Applications in Natural Resources
 NR402 GIS Applications in Natural Resources Lesson 1 Introduction to GIS Eva Strand, University of Idaho Map of the Pacific Northwest from http://www.or.blm.gov/gis/ Welcome to NR402 GIS Applications in
LiDAR APPLICATIONS REMS6090. Assignment 2 HYDROLOGICAL APPLICATIONS of LiDAR DATA Due Date April 8, Venessa Bennett W
 LiDAR APPLICATIONS REMS6090 Assignment 2 HYDROLOGICAL APPLICATIONS of LiDAR DATA Due Date April 8, 2015 Venessa Bennett W0279429 1.0 Introduction High accuracy Digital Elevation Models (DEM) derived from
ISO Land Cover for Agricultural Regions of Canada, Circa 2000 Data Product Specification. Revision: A
 ISO 19131 Land Cover for Agricultural Regions of Canada, Circa 2000 Data Product Specification Revision: A Data specification: Land Cover for Agricultural Regions, circa 2000 Table of Contents 1. OVERVIEW...
Submitted to. Prepared by
 Prepared by Tim Webster, PhD Candace MacDonald Applied Geomatics Research Group NSCC, Middleton Tel. 902 825 5475 email: tim.webster@nscc.ca Submitted to Harold MacNeil Engineering Manager Halifax Water
Digital Elevation Models (DEM)
") Digital Elevation Models (DEM) Digital representation of the terrain surface enable 2.5 / 3D views Rule #1: they are models, not reality Rule #2: they always include some errors (subject to scale and data
Digital Elevation Models (DEM) Digital representation of the terrain surface enable 2.5 / 3D views Rule #1: they are models, not reality Rule #2: they always include some errors (subject to scale and data
Lecture 9: Reference Maps & Aerial Photography
 Lecture 9: Reference Maps & Aerial Photography I. Overview of Reference and Topographic Maps There are two basic types of maps? Reference Maps - General purpose maps & Thematic Maps - maps made for a specific
Delineation of high landslide risk areas as a result of land cover, slope, and geology in San Mateo County, California
 Delineation of high landslide risk areas as a result of land cover, slope, and geology in San Mateo County, California Introduction Problem Overview This project attempts to delineate the high-risk areas
Lab 1: Importing Data, Rectification, Datums, Projections, and Coordinate Systems
 Lab 1: Importing Data, Rectification, Datums, Projections, and Coordinate Systems Topics covered in this lab: i. Importing spatial data to TAS ii. Rectification iii. Conversion from latitude/longitude
Introduction to Geographic Information Systems (GIS): Environmental Science Focus
: Environmental Science Focus") Introduction to Geographic Information Systems (GIS): Environmental Science Focus September 9, 2013 We will begin at 9:10 AM. Login info: Username:!cnrguest Password: gocal_bears Instructor: Domain: CAMPUS
Introduction to Geographic Information Systems (GIS): Environmental Science Focus September 9, 2013 We will begin at 9:10 AM. Login info: Username:!cnrguest Password: gocal_bears Instructor: Domain: CAMPUS
Delineation of Watersheds
 Delineation of Watersheds Adirondack Park, New York by Introduction Problem Watershed boundaries are increasingly being used in land and water management, separating the direction of water flow such that
Use of Corona, Landsat TM, Spot 5 images to assess 40 years of land use/cover changes in Cavusbasi
 New Strategies for European Remote Sensing, Olui (ed.) 2005 Millpress, Rotterdam, ISBN 90 5966 003 X Use of Corona, Landsat TM, Spot 5 images to assess 40 years of land use/cover changes in Cavusbasi N.
Lauren Jacob May 6, Tectonics of the Northern Menderes Massif: The Simav Detachment and its relationship to three granite plutons
 Lauren Jacob May 6, 2010 Tectonics of the Northern Menderes Massif: The Simav Detachment and its relationship to three granite plutons I. Introduction: Purpose: While reading through the literature regarding
These modules are covered with a brief information and practical in ArcGIS Software and open source software also like QGIS, ILWIS.
 Online GIS Training and training modules covered are: 1. ArcGIS, Analysis, Fundamentals and Implementation 2. ArcGIS Web Data Sharing 3. ArcGIS for Desktop 4. ArcGIS for Server These modules are covered
How to Create Stream Networks using DEM and TauDEM
 How to Create Stream Networks using DEM and TauDEM Take note: These procedures do not describe all steps. Knowledge of ArcGIS, DEMs, and TauDEM is required. TauDEM software ( http://hydrology.neng.usu.edu/taudem/
Louisiana Transportation Engineering Conference. Monday, February 12, 2007
 Louisiana Transportation Engineering Conference Monday, February 12, 2007 Agenda Project Background Goal of EIS Why Use GIS? What is GIS? How used on this Project Other site selection tools I-69 Corridor
CHAPTER 1 THE UNITED STATES 2001 NATIONAL LAND COVER DATABASE
 CHAPTER 1 THE UNITED STATES 2001 NATIONAL LAND COVER DATABASE Collin Homer*, Jon Dewitz, Joyce Fry, and Nazmul Hossain *U.S. Geological Survey (USGS) Center for Earth Resources Observation and Science
NWT Open Report Delineation of Watersheds in the Mackenzie Mountains
 NWT Open Report 2015-007 Delineation of Watersheds in the Mackenzie Mountains K.L. Pierce and H. Falck Recommended Citation: Pierce, K.L. and Falck, H., 2015. Delineation of watersheds in the Mackenzie
Overview key concepts and terms (based on the textbook Chang 2006 and the practical manual)
") Introduction Geo-information Science (GRS-10306) Overview key concepts and terms (based on the textbook 2006 and the practical manual) Introduction Chapter 1 Geographic information system (GIS) Geographically
Introduction Geo-information Science (GRS-10306) Overview key concepts and terms (based on the textbook 2006 and the practical manual) Introduction Chapter 1 Geographic information system (GIS) Geographically
Welcome to NR502 GIS Applications in Natural Resources. You can take this course for 1 or 2 credits. There is also an option for 3 credits.
 Welcome to NR502 GIS Applications in Natural Resources. You can take this course for 1 or 2 credits. There is also an option for 3 credits. The 1st credit consists of a series of readings, demonstration,
Digital Elevation Models (DEM) / DTM
 / DTM") Digital Elevation Models (DEM) / DTM Uses in remote sensing: queries and analysis, 3D visualisation, layers in classification Fogo Island, Cape Verde Republic ASTER DEM / image Banks Peninsula, Christchurch,
Digital Elevation Models (DEM) / DTM Uses in remote sensing: queries and analysis, 3D visualisation, layers in classification Fogo Island, Cape Verde Republic ASTER DEM / image Banks Peninsula, Christchurch,
Digital Change Detection Using Remotely Sensed Data for Monitoring Green Space Destruction in Tabriz
 Int. J. Environ. Res. 1 (1): 35-41, Winter 2007 ISSN:1735-6865 Graduate Faculty of Environment University of Tehran Digital Change Detection Using Remotely Sensed Data for Monitoring Green Space Destruction
Quality and Coverage of Data Sources
 Quality and Coverage of Data Sources Objectives Selecting an appropriate source for each item of information to be stored in the GIS database is very important for GIS Data Capture. Selection of quality
International Journal of Intellectual Advancements and Research in Engineering Computations
 ISSN:2348-2079 Volume-5 Issue-2 International Journal of Intellectual Advancements and Research in Engineering Computations Agricultural land investigation and change detection in Coimbatore district by
International Journal of Scientific & Engineering Research, Volume 6, Issue 7, July ISSN
 International Journal of Scientific & Engineering Research, Volume 6, Issue 7, July-2015 1428 Accuracy Assessment of Land Cover /Land Use Mapping Using Medium Resolution Satellite Imagery Paliwal M.C &.
Hydrology and Floodplain Analysis, Chapter 10
 Hydrology and Floodplain Analysis, Chapter 10 Hydrology and Floodplain Analysis, Chapter 10.1 Introduction to GIS GIS Geographical Information System Spatial Data Data linked with geographical location
Using ArcGIS for Hydrology and Watershed Analysis:
 Using ArcGIS 10.2.2 for Hydrology and Watershed Analysis: A guide for running hydrologic analysis using elevation and a suite of ArcGIS tools Anna Nakae Feb. 10, 2015 Introduction Hydrology and watershed
DATA SOURCES AND INPUT IN GIS. By Prof. A. Balasubramanian Centre for Advanced Studies in Earth Science, University of Mysore, Mysore
 DATA SOURCES AND INPUT IN GIS By Prof. A. Balasubramanian Centre for Advanced Studies in Earth Science, University of Mysore, Mysore 1 1. GIS stands for 'Geographic Information System'. It is a computer-based
Spatial Data Analysis with ArcGIS Desktop: From Basic to Advance
 Spatial Data Analysis with ArcGIS Desktop: From Basic to Advance 1. Course overview Modern environmental, energy as well as resource modeling and planning require huge amount of geographically located
Classification of Erosion Susceptibility
 GEO327G: GIS & GPS Applications in Earth Sciences Classification of Erosion Susceptibility Denali National Park, Alaska Zehao Xue 12 3 2015 2 TABLE OF CONTENTS 1 Abstract... 3 2 Introduction... 3 2.1 Universal
Erosion Susceptibility in the area Around the Okanogan Fire Complex, Washington, US
 Erosion Susceptibility in the area Around the Okanogan Fire Complex, Washington, US 1. Problem Construct a raster that represents susceptibility to erosion based on lithology, slope, cover type, burned
THE REVISION OF 1:50000 TOPOGRAPHIC MAP OF ONITSHA METROPOLIS, ANAMBRA STATE, NIGERIA USING NIGERIASAT-1 IMAGERY
 I.J.E.M.S., VOL.5 (4) 2014: 235-240 ISSN 2229-600X THE REVISION OF 1:50000 TOPOGRAPHIC MAP OF ONITSHA METROPOLIS, ANAMBRA STATE, NIGERIA USING NIGERIASAT-1 IMAGERY 1* Ejikeme, J.O. 1 Igbokwe, J.I. 1 Igbokwe,
SATELLITE REMOTE SENSING
 SATELLITE REMOTE SENSING of NATURAL RESOURCES David L. Verbyla LEWIS PUBLISHERS Boca Raton New York London Tokyo Contents CHAPTER 1. SATELLITE IMAGES 1 Raster Image Data 2 Remote Sensing Detectors 2 Analog
Environmental Impact Assessment Land Use and Land Cover CISMHE 7.1 INTRODUCTION
 7 LAND USE AND LAND COVER 7.1 INTRODUCTION The knowledge of land use and land cover is important for many planning and management activities as it is considered an essential element for modeling and understanding
Geo 327G Semester Project. Landslide Suitability Assessment of Olympic National Park, WA. Fall Shane Lewis
 Geo 327G Semester Project Landslide Suitability Assessment of Olympic National Park, WA Fall 2011 Shane Lewis 1 I. Problem Landslides cause millions of dollars of damage nationally every year, and are
Tutorial 8 Raster Data Analysis
 Objectives Tutorial 8 Raster Data Analysis This tutorial is designed to introduce you to a basic set of raster-based analyses including: 1. Displaying Digital Elevation Model (DEM) 2. Slope calculations
ArcGIS 10.0 Imagery. Joseph B. Bowles
 ArcGIS 10.0 Imagery Joseph B. Bowles Presentation Overview Imagery and raster data What is a mosaic dataset Use of mosaic datasets Build a mosaic dataset Migrate to mosaic datasets Q&A Characteristics
Generation and analysis of Digital Elevation Model (DEM) using Worldview-2 stereo-pair images of Gurgaon district: A geospatial approach
 using Worldview-2 stereo-pair images of Gurgaon district: A geospatial approach") 186 Generation and analysis of Digital Elevation Model (DEM) using Worldview-2 stereo-pair images of Gurgaon district: A geospatial approach Arsad Khan 1, Sultan Singh 2 and Kaptan Singh 2 1 Department
186 Generation and analysis of Digital Elevation Model (DEM) using Worldview-2 stereo-pair images of Gurgaon district: A geospatial approach Arsad Khan 1, Sultan Singh 2 and Kaptan Singh 2 1 Department
IMPROVING REMOTE SENSING-DERIVED LAND USE/LAND COVER CLASSIFICATION WITH THE AID OF SPATIAL INFORMATION
 IMPROVING REMOTE SENSING-DERIVED LAND USE/LAND COVER CLASSIFICATION WITH THE AID OF SPATIAL INFORMATION Yingchun Zhou1, Sunil Narumalani1, Dennis E. Jelinski2 Department of Geography, University of Nebraska,
Lab 1: Importing Data, Rectification, Datums, Projections, and Output (Mapping)
") Lab 1: Importing Data, Rectification, Datums, Projections, and Output (Mapping) Topics covered in this lab: i. Importing spatial data to TAS ii. Rectification iii. Conversion from latitude/longitude to
Lab 1: Importing Data, Rectification, Datums, Projections, and Output (Mapping) Topics covered in this lab: i. Importing spatial data to TAS ii. Rectification iii. Conversion from latitude/longitude to
Harrison 1. Identifying Wetlands by GIS Software Submitted July 30, ,470 words By Catherine Harrison University of Virginia
 Harrison 1 Identifying Wetlands by GIS Software Submitted July 30, 2015 4,470 words By Catherine Harrison University of Virginia cch2fy@virginia.edu Harrison 2 ABSTRACT The Virginia Department of Transportation
Land Cover Data Processing Land cover data source Description and documentation Download Use Use
 Land Cover Data Processing This document provides a step by step procedure on how to build the land cover data required by EnSim. The steps provided here my be long and there may be short cuts (like using
USING HYPERSPECTRAL IMAGERY
 USING HYPERSPECTRAL IMAGERY AND LIDAR DATA TO DETECT PLANT INVASIONS 2016 ESRI CANADA SCHOLARSHIP APPLICATION CURTIS CHANCE M.SC. CANDIDATE FACULTY OF FORESTRY UNIVERSITY OF BRITISH COLUMBIA CURTIS.CHANCE@ALUMNI.UBC.CA
SIE 509 Principles of GIS Exercise 5 An Introduction to Spatial Analysis
 SIE 509 Principles of GIS Exercise 5 An Introduction to Spatial Analysis Due: Oct. 31, 2017 Total Points: 50 Introduction: The Governor of Maine is asking communities to look at regionalization for major
Raster Spatial Analysis Specific Theory
 RSATheory.doc 1 Raster Spatial Analysis Specific Theory... 1 Spatial resampling... 1 Mosaic... 3 Reclassification... 4 Slicing... 4 Zonal Operations... 5 References... 5 Raster Spatial Analysis Specific
Landuse and Landcover change analysis in Selaiyur village, Tambaram taluk, Chennai
 Landuse and Landcover change analysis in Selaiyur village, Tambaram taluk, Chennai K. Ilayaraja Department of Civil Engineering BIST, Bharath University Selaiyur, Chennai 73 ABSTRACT The synoptic picture
USING GIS CARTOGRAPHIC MODELING TO ANALYSIS SPATIAL DISTRIBUTION OF LANDSLIDE SENSITIVE AREAS IN YANGMINGSHAN NATIONAL PARK, TAIWAN
 CO-145 USING GIS CARTOGRAPHIC MODELING TO ANALYSIS SPATIAL DISTRIBUTION OF LANDSLIDE SENSITIVE AREAS IN YANGMINGSHAN NATIONAL PARK, TAIWAN DING Y.C. Chinese Culture University., TAIPEI, TAIWAN, PROVINCE
Table 4.1 Images used for the Study. Spatial Resolution (Meter) Resolution (Bits) 30 (For 6th band 120)
 Resolution (Bits) 30 (For 6th band 120)")
Digital Elevation Models (DEM) / DTM
 / DTM") Digital Elevation Models (DEM) / DTM Uses in remote sensing: queries and analysis, 3D visualisation, classification input Fogo Island, Cape Verde Republic ASTER DEM / image Banks Peninsula, Christchurch,
Digital Elevation Models (DEM) / DTM Uses in remote sensing: queries and analysis, 3D visualisation, classification input Fogo Island, Cape Verde Republic ASTER DEM / image Banks Peninsula, Christchurch,
Yanbo Huang and Guy Fipps, P.E. 2. August 25, 2006
 Landsat Satellite Multi-Spectral Image Classification of Land Cover Change for GIS-Based Urbanization Analysis in Irrigation Districts: Evaluation in Low Rio Grande Valley 1 by Yanbo Huang and Guy Fipps,
Abstract. TECHNOFAME- A Journal of Multidisciplinary Advance Research. Vol.2 No. 2, (2013) Received: Feb.2013; Accepted Oct.
 Received: Feb.2013; Accepted Oct.") Vol.2 No. 2, 83-87 (2013) Received: Feb.2013; Accepted Oct. 2013 Landuse Pattern Analysis Using Remote Sensing: A Case Study of Morar Block, of Gwalior District, M.P. Subhash Thakur 1 Akhilesh Singh 2
Vol.2 No. 2, 83-87 (2013) Received: Feb.2013; Accepted Oct. 2013 Landuse Pattern Analysis Using Remote Sensing: A Case Study of Morar Block, of Gwalior District, M.P. Subhash Thakur 1 Akhilesh Singh 2
Summary Description Municipality of Anchorage. Anchorage Coastal Resource Atlas Project
 Summary Description Municipality of Anchorage Anchorage Coastal Resource Atlas Project By: Thede Tobish, MOA Planner; and Charlie Barnwell, MOA GIS Manager Introduction Local governments often struggle
Deriving Uncertainty of Area Estimates from Satellite Imagery using Fuzzy Land-cover Classification
 International Journal of Information and Computation Technology. ISSN 0974-2239 Volume 3, Number 10 (2013), pp. 1059-1066 International Research Publications House http://www. irphouse.com /ijict.htm Deriving
SPOT DEM Product Description
 SPOT DEM Product Description Version 1.1 - May 1 st, 2004 This edition supersedes previous versions Acronyms DIMAP DTED DXF HRS JPEG, JPG DEM SRTM SVG Tiff - GeoTiff XML Digital Image MAP encapsulation
Software. People. Data. Network. What is GIS? Procedures. Hardware. Chapter 1
 People Software Data Network Procedures Hardware What is GIS? Chapter 1 Why use GIS? Mapping Measuring Monitoring Modeling Managing Five Ms of Applied GIS Chapter 2 Geography matters Quantitative analyses
Module 2.1 Monitoring activity data for forests using remote sensing
 Module 2.1 Monitoring activity data for forests using remote sensing Module developers: Frédéric Achard, European Commission (EC) Joint Research Centre (JRC) Jukka Miettinen, EC JRC Brice Mora, Wageningen
Land Accounts - The Canadian Experience
 Land Accounts - The Canadian Experience Development of a Geospatial database to measure the effect of human activity on the environment Who is doing Land Accounts Statistics Canada (national) Component
ArcGIS Data Models: Raster Data Models. Jason Willison, Simon Woo, Qian Liu (Team Raster, ESRI Software Products)
") ArcGIS Data Models: Raster Data Models Jason Willison, Simon Woo, Qian Liu (Team Raster, ESRI Software Products) Overview of Session Raster Data Model Context Example Raster Data Models Important Raster
ArcGIS Data Models: Raster Data Models Jason Willison, Simon Woo, Qian Liu (Team Raster, ESRI Software Products) Overview of Session Raster Data Model Context Example Raster Data Models Important Raster
a system for input, storage, manipulation, and output of geographic information. GIS combines software with hardware,
 Introduction to GIS Dr. Pranjit Kr. Sarma Assistant Professor Department of Geography Mangaldi College Mobile: +91 94357 04398 What is a GIS a system for input, storage, manipulation, and output of geographic
2. GETTING STARTED WITH GIS
 2. GETTING STARTED WITH GIS What are geographic information systems and what are they used for? ArcGIS: ArcMap, ArcCatalog and ArcToolbox Vector data vs. raster data vs. attribute tables Polygons, polylines,
Urban Growth Analysis: Calculating Metrics to Quantify Urban Sprawl
 Urban Growth Analysis: Calculating Metrics to Quantify Urban Sprawl Jason Parent jason.parent@uconn.edu Academic Assistant GIS Analyst Daniel Civco Professor of Geomatics Center for Land Use Education
Course overview. Grading and Evaluation. Final project. Where and When? Welcome to REM402 Applied Spatial Analysis in Natural Resources.
 Welcome to REM402 Applied Spatial Analysis in Natural Resources Eva Strand, University of Idaho Map of the Pacific Northwest from http://www.or.blm.gov/gis/ Where and When? Lectures Monday & Wednesday
Task 1: Start ArcMap and add the county boundary data from your downloaded dataset to the data frame.
 Exercise 6 Coordinate Systems and Map Projections The following steps describe the general process that you will follow to complete the exercise. Specific steps will be provided later in the step-by-step
SRJC Applied Technology 54A Introduction to GIS
 SRJC Applied Technology 54A Introduction to GIS Overview Lecture of Geographic Information Systems Fall 2004 Santa Rosa Junior College Presented By: Tim Pudoff, GIS Coordinator, County of Sonoma, Information
PROANA A USEFUL SOFTWARE FOR TERRAIN ANALYSIS AND GEOENVIRONMENTAL APPLICATIONS STUDY CASE ON THE GEODYNAMIC EVOLUTION OF ARGOLIS PENINSULA, GREECE.
 PROANA A USEFUL SOFTWARE FOR TERRAIN ANALYSIS AND GEOENVIRONMENTAL APPLICATIONS STUDY CASE ON THE GEODYNAMIC EVOLUTION OF ARGOLIS PENINSULA, GREECE. Spyridoula Vassilopoulou * Institute of Cartography
CUYAHOGA COUNTY URBAN TREE CANOPY & LAND COVER MAPPING
 CUYAHOGA COUNTY URBAN TREE CANOPY & LAND COVER MAPPING FINAL REPORT M IKE GALVIN S AVATREE D IRECTOR, CONSULTING GROUP P HONE: 914 403 8959 E MAIL: MGALVIN@SAVATREE. COM J ARLATH O NEIL DUNNE U NIVERSITY
1. Introduction. S.S. Patil 1, Sachidananda 1, U.B. Angadi 2, and D.K. Prabhuraj 3
 Cloud Publications International Journal of Advanced Remote Sensing and GIS 2014, Volume 3, Issue 1, pp. 525-531, Article ID Tech-249 ISSN 2320-0243 Research Article Open Access Machine Learning Technique
Large Scale Mapping Policy for the Province of Nova Scotia
 Large Scale Mapping Policy for the Province of Nova Scotia December, 2005 Version 1.0 TABLE OF CONTENTS PAGE BACKGROUND...3 POLICY...5 Policy 1.0 Large Scale Mapping Program...5 Policy 2.0 Service Offering...5
Introduction. Project Summary In 2014 multiple local Otsego county agencies, Otsego County Soil and Water
 Introduction Project Summary In 2014 multiple local Otsego county agencies, Otsego County Soil and Water Conservation District (SWCD), the Otsego County Planning Department (OPD), and the Otsego County
SECTION 1: Identification Information
 Page 1 of 6 Home Data Catalog Download Data Data Status Web Services About FAQ Contact Us SECTION 1: Identification Information Originator: Minnesota DNR - Division of Forestry Title: GAP Land Cover -
USE OF LANDSAT IMAGERY FOR EVALUATION OF LAND COVER / LAND USE CHANGES FOR A 30 YEAR PERIOD FOR THE LAKE ERIE WATERSHED
 USE OF LANDSAT IMAGERY FOR EVALUATION OF LAND COVER / LAND USE CHANGES FOR A 30 YEAR PERIOD FOR THE LAKE ERIE WATERSHED Mark E. Seidelmann Carolyn J. Merry Dept. of Civil and Environmental Engineering
4. GIS Implementation of the TxDOT Hydrology Extensions
 4. GIS Implementation of the TxDOT Hydrology Extensions A Geographic Information System (GIS) is a computer-assisted system for the capture, storage, retrieval, analysis and display of spatial data. It
Modeling the Rural Urban Interface in the South Carolina Piedmont: T. Stephen Eddins Lawrence Gering Jeff Hazelton Molly Espey
 Modeling the Rural Urban Interface in the South Carolina Piedmont: T. Stephen Eddins (teddins@clemson.edu) Lawrence Gering Jeff Hazelton Molly Espey ABSTRACT Continuing growth of America s cities has created
MERGING (MERGE / MOSAIC) GEOSPATIAL DATA
 GEOSPATIAL DATA") This help guide describes how to merge two or more feature classes (vector) or rasters into one single feature class or raster dataset. The Merge Tool The Merge Tool combines input features from input
This help guide describes how to merge two or more feature classes (vector) or rasters into one single feature class or raster dataset. The Merge Tool The Merge Tool combines input features from input
Overlay Analysis II: Using Zonal and Extract Tools to Transfer Raster Values in ArcMap
 Overlay Analysis II: Using Zonal and Extract Tools to Transfer Raster Values in ArcMap Created by Patrick Florance and Jonathan Gale, Edited by Catherine Ressijac on March 26, 2018 If you have raster data
Outline. Chapter 1. A history of products. What is ArcGIS? What is GIS? Some GIS applications Introducing the ArcGIS products How does GIS work?
 Outline Chapter 1 Introducing ArcGIS What is GIS? Some GIS applications Introducing the ArcGIS products How does GIS work? Basic data formats The ArcCatalog interface 1-1 1-2 A history of products Arc/Info
GIS IN ECOLOGY: ANALYZING RASTER DATA
 GIS IN ECOLOGY: ANALYZING RASTER DATA Contents Introduction... 2 Raster Tools and Functionality... 2 Data Sources... 3 Tasks... 4 Getting Started... 4 Creating Raster Data... 5 Statistics... 8 Surface
Exercise 3: GIS data on the World Wide Web
 Exercise 3: GIS data on the World Wide Web These web sites are a few examples of sites that are serving free GIS data. Many other sites exist. Search in Google or other search engine to find GIS data for
INSTITUTE OF AERONAUTICAL ENGINEERING (Autonomous) Dundigal, Hyderabad
 Dundigal, Hyderabad") INSTITUTE OF AERONAUTICAL ENGINEERING (Autonomous) Dundigal, Hyderabad -00 0 CIVIL ENGINEERING TUTORIAL QUESTION BANK Course Name : Remote Sensing and GIS Course Code : A00 Class : IV B. Tech I Semester
INSTITUTE OF AERONAUTICAL ENGINEERING (Autonomous) Dundigal, Hyderabad -00 0 CIVIL ENGINEERING TUTORIAL QUESTION BANK Course Name : Remote Sensing and GIS Course Code : A00 Class : IV B. Tech I Semester
Data Structures & Database Queries in GIS
 Data Structures & Database Queries in GIS Objective In this lab we will show you how to use ArcGIS for analysis of digital elevation models (DEM s), in relationship to Rocky Mountain bighorn sheep (Ovis
Object Based Imagery Exploration with. Outline
 Object Based Imagery Exploration with Dan Craver Portland State University June 11, 2007 Outline Overview Getting Started Processing and Derivatives Object-oriented classification Literature review Demo
9/24/2014. Georeferencing: conclusions
 Georeferencing: conclusions 1 GEOG 300: UTM REVIEW QUIZ (0%) 1. The UTM system is composed of zones, each degrees longitude wide 2. The 0 value for northings is located at 3. The 0 value for eastings is
Chapter 6. Fundamentals of GIS-Based Data Analysis for Decision Support. Table 6.1. Spatial Data Transformations by Geospatial Data Types
 Chapter 6 Fundamentals of GIS-Based Data Analysis for Decision Support FROM: Points Lines Polygons Fields Table 6.1. Spatial Data Transformations by Geospatial Data Types TO: Points Lines Polygons Fields
12/26/2012. Geographic Information Systems * * * * GIS (... yrezaei
 ( - Geographic Information Systems ( ( 1 2 3 Information System Data base DB IS IS DB (Knowledge ( ( (System (Information System - (Georefrence Analysis Data + Knowledge ======== Information 4 5 ( < 10%
Rio Santa Geodatabase Project
 Rio Santa Geodatabase Project Amanda Cuellar December 7, 2012 Introduction The McKinney research group (of which I am a part) collaborates with international and onsite researchers to evaluate the risks
GIS CONCEPTS ARCGIS METHODS AND. 3 rd Edition, July David M. Theobald, Ph.D. Warner College of Natural Resources Colorado State University
 GIS CONCEPTS AND ARCGIS METHODS 3 rd Edition, July 2007 David M. Theobald, Ph.D. Warner College of Natural Resources Colorado State University Copyright Copyright 2007 by David M. Theobald. All rights
Terms GIS GPS Vector Data Model Raster Data Model Feature Attribute Table Point Line Polygon Pixel RGB Overlay Function
 FINAL REVIEW FOR GIS (2016) PRACTICAL COMPONENT The first 40 mins of the exam will be open book and will require you to make a map using all the techniques learned over the semester. This map will be e-mailed
DEVELOPMENT OF DIGITAL CARTOGRAPHIC DATABASE FOR MANAGING THE ENVIRONMENT AND NATURAL RESOURCES IN THE REPUBLIC OF SERBIA
 DEVELOPMENT OF DIGITAL CARTOGRAPHIC BASE FOR MANAGING THE ENVIRONMENT AND NATURAL RESOURCES IN THE REPUBLIC OF SERBIA Dragutin Protic, Ivan Nestorov Institute for Geodesy, Faculty of Civil Engineering,
Pan-Arctic Digital Elevation Map (Pan-Arctic DEM)
") Memorandum to CAFF Board 07/28/2017 BACKGROUND: Pan-Arctic Digital Elevation Map (Pan-Arctic DEM) ArcticDEM is a National Geospatial-Intelligence Agency (NGA)-National Science Foundation (NSF) publicprivate
Memorandum to CAFF Board 07/28/2017 BACKGROUND: Pan-Arctic Digital Elevation Map (Pan-Arctic DEM) ArcticDEM is a National Geospatial-Intelligence Agency (NGA)-National Science Foundation (NSF) publicprivate
ISU GIS CENTER S ARCSDE USER'S GUIDE AND DATA CATALOG
 ISU GIS CENTER S ARCSDE USER'S GUIDE AND DATA CATALOG 2 TABLE OF CONTENTS 1) INTRODUCTION TO ARCSDE............. 3 2) CONNECTING TO ARCSDE.............. 5 3) ARCSDE LAYERS...................... 9 4) LAYER
THE ESTABLISHMENT OF DIGITAL HIGH RESOLUTION GEODATABASES FOR WEBGIS: FROM DIGITAL CAMPUS TO DIGITAL NATIONAL PARK
 THE ESTABLISHMENT OF DIGITAL HIGH RESOLUTION GEODATABASES FOR WEBGIS: FROM DIGITAL CAMPUS TO DIGITAL NATIONAL PARK Y. C. Ding a, *, C. C. Huang a a Digital Earth Research Center (DERC), Chinese Culture
Preparation of LULC map from GE images for GIS based Urban Hydrological Modeling
 International Conference on Modeling Tools for Sustainable Water Resources Management Department of Civil Engineering, Indian Institute of Technology Hyderabad: 28-29 December 2014 Abstract Preparation
Lab #3 Map Projections.
 Lab #3 Map Projections http://visual.merriam-webster.com/images/earth/geography/cartography/map-projections.jpg Map Projections Projection: a systematic arrangement of parallels and meridians on a plane
Research on Topographic Map Updating
 Research on Topographic Map Updating Ivana Javorovic Remote Sensing Laboratory Ilica 242, 10000 Zagreb, Croatia Miljenko Lapaine University of Zagreb, Faculty of Geodesy Kaciceva 26, 10000 Zagreb, Croatia
High Speed / Commuter Rail Suitability Analysis For Central And Southern Arizona
 High Speed / Commuter Rail Suitability Analysis For Central And Southern Arizona Item Type Reports (Electronic) Authors Deveney, Matthew R. Publisher The University of Arizona. Rights Copyright is held
GIS and Forest Engineering Applications FE 257 Lecture and laboratory, 3 credits
 GIS and Forest Engineering Applications FE 257 Lecture and laboratory, 3 credits Instructor: Michael Wing Associate Professor Forest Engineering, Resources, and Management Oregon State University Crop
Southwestern Ontario Orthophotography Project (SWOOP) 2015 Digital Elevation Model
 2015 Digital Elevation Model") Southwestern Ontario Orthophotography Project (SWOOP) 2015 Digital Elevation Model User Guide Provincial Mapping Unit Mapping and Information Resources Branch Corporate Management and Information Division
Southwestern Ontario Orthophotography Project (SWOOP) 2015 Digital Elevation Model User Guide Provincial Mapping Unit Mapping and Information Resources Branch Corporate Management and Information Division