Guide for Mechanistic-Empirical Design
|
|
|
- Donna Richard
- 5 years ago
- Views:
Transcription
1 Copy No. Guide for Mechanistic-Empirical Design OF NEW AND REHABILITATED PAVEMENT STRUCTURES FINAL DOCUMENT APPENDIX EE-1: INPUT DATA FOR THE CALIBRATION AND VALIDATION OF THE DESIGN GUIDE FOR NEW CONSTRUCTED FLEXIBLE PAVEMENT SECTIONS NCHRP Prepared for National Cooperative Highway Research Program Transportation Research Board National Research Council Submitted by ARA, Inc., ERES Division 505 West University Avenue Champaign, Illinois August 2003
2 Acknowledgment of Sponsorship This work was sponsored by the American Association of State Highway and Transportation Officials (AASHTO) in cooperation with the Federal Highway Administration and was conducted in the National Cooperative Highway Research Program which is administered by the Transportation Research Board of the National Research Council. Disclaimer This is the final draft as submitted by the research agency. The opinions and conclusions expressed or implied in this report are those of the research agency. They are not necessarily those of the Transportation Research Board, the National Research Council, the Federal Highway Administration, AASHTO, or the individual States participating in the National Cooperative Highway Research program. Acknowledgements The research team for NCHRP Project 1-37A: Development of the 2002 Guide for the Design of New and Rehabilitated Pavement Structures consisted of Applied Research Associates, Inc., ERES Consultants Division (ARA-ERES) as the prime contractor with Arizona State University (ASU) as the primary subcontractor. Fugro-BRE, Inc., the University of Maryland, and Advanced Asphalt Technologies, LLC served as subcontractors to either ARA-ERES or ASU along with several independent consultants. Research into the subject area covered in this Appendix was conducted at ASU and Fugro-BRE, Inc. The authors of this Appendix are Dr. M.W. Witczak and Dr. C.E. Zapata. Mr. Harold Von Quintus provided assistance in assembling some of the inputs. Foreword The information provided in this appendix overviews and lists all the data required for calibration of performance models for newly constructed flexible pavements including pavement data, climatic information, material characterization data, and distress data. The traffic data is provided in an electronic format (attached with the Design Guide CDs). Also, in this appendix, the assumptions made for the missing variable and the basis on which these assumptions were made are explained. This appendix is the first in a series of two volumes on calibration sections for new constructed flexible pavements. The other volume is: Appendix EE-2: Input Data for the Calibration and Validation of the 2002 Design Guide for Rehabilitated Pavement Sections with HMA Overlays ii
3 General Table of Contents Appendix EE-1 Input Data for the Calibration and Validation of the 2002 Design Guide for the New constructed Flexible Pavement Sections Page Main Text 2 Annex A 19 Input Data for the Calibration and Validation of the 2002 Design Guide for New Constructed Pavement Sections Annex B 99 Ground Water Table Depth Information Provided by Harold Von Quintus as part of the Report Calibration and Validation of the Fatigue Cracking and Rutting Prediction Models for the 2002 Design Guide Submitted on 20 March Annex C 112 GWT Depth and Depth to Bedrock Data Gathered from the US Geological Survey, State DOT s and LTPP Boring Logs. Annex D 119 Estimating Original Air Voids OF GPS LTPP Sections. Annex E 156 Correlation of CBR Values with Soil Index Properties. iii
4 INTRODUCTION This appendix includes the pavement data, climatic information, material characterization data and distress values for flexible pavement sections used for the calibration of the design of new flexible pavements. The data was extracted from the LTPP database. The information provided in this section covered all the input required to run the design guide software and simulate the same condition the pavement sections were exposed to. The original traffic was used for the simulation runs. However, the traffic data is provided in an electronic format (attached with the Design Guide CDs). Also, in this appendix the assumptions made for the missing variable and the base on which these assumptions were made are explained. BACKGROUND The input data and sources of information needed for the calibration and validation of the distress prediction models for new construction are tabulated and attached to this report as Annex-A. 94 test sections from the Long Term Pavement Performance (LTPP) database were used for this purpose. The distribution of the sections is shown in Figure 1. The following is a summary of the tables and their components provided in the Annex-A of this report. The tables contain a complete list of input data and distress data extracted from the LTPP database or, in some cases, from different sources when the information was not available. Table 1 Analysis Conditions - State Code - SHRP Identification Number - State - Project Type - Pavement Type - Base/Subgrade Construction Completion Date - Asphalt Construction Completion Date - Traffic Opening Date - Design Period Table 2 Pavement Lane Properties - Lane Width - Pavement Slope - Initial IRI - Thermal Conductivity - Heat Capacity - Surface Short Wave Absorptivity Table 3 Environmental/Climatic - Latitude - Longitude - Elevation EE-1.1
5 - Groundwater Table Depth Table 4 Pavement Structure - Number of Layers - Layer Number - Layer Type - Representative Thickness Table 5 Aggregate Gradation for Asphalt Mix - Layer Number - Layer Type - Percentage Retained ¾" Sieve - Percentage Retained 3/8" Sieve - Percentage Retained #4 Sieve - Percentage Passing #200 Sieve Table 6 Effective Binder Content by Volume at Time of Construction - Layer Number - Layer Time - Binder Content by Weight, Pb - Specific Gravity of the Binder, Gb - Bulk Specific Gravity of the Mix, Gmb - Maximum Theoretical Specific Gravity of the Mix, Gmm - Bulk Specific Gravity of the Aggregate, Gsb - Effective Specific Gravity of the Aggregate, Gse - Effective Binder Content by Volume at Time of Construction, Vbe Table 7 Original Air Voids (at Time of Construction) and Total Unit Weight - Layer Number - Layer Type - Air Voids at Age = t - Age = t - Mean Annual Air Temperature, Maat - Original Viscosity at 77 o F - Original Air Voids - Total Unit Weight Table 8 Asphalt Binder Data - Layer Number - Layer Type - Viscosity Grade - Penetration Grade - Penetration at 77F - Viscosity at 140F - Viscosity at 275F EE-1.2
6 Table 9 - Unbound Materials Data - Layer Number - Layer Type - Dry Thermal Conductivity - Dry Heat Capacity - Liquid Limit - Plastic Limit - Plasticity Index - Percent Passing #200 Sieve - Percent Passing #4 Sieve - Diameter D 60 - Optimum Moisture Content from LTTP Database - Estimated Optimum Moisture Content for Level 3 Analysis - Maximum Dry Unit Weight from LTPP Database - Estimated Maximum Dry Unit Weight for Level 3 Analysis - Specific Gravity of Solids - Saturated Hydraulic Conductivity - AASHTO Soil Classification - Unified Soil Classification System (USCS) Classification - Estimated Resilient Modulus based on AASHTO Soil Classification The following tables contain the measured distress information needed to calibrate the results obtained from the analysis: Table 10 Distress Data Rutting - Survey Date - Maximum displacement between reference wire line and pavement surface in left lane half, LLH-Depth Mean, in inches - Maximum displacement between reference wire line and pavement surface in right lane half, RLH-Depth Mean, in inches - Maximum value of LLH-Depth Mean or RLH-Depth Mean, in inches - Average displacement between reference wire line and pavement surface between left lane half and right lane half data, in inches Table 11 Distress Data Alligator Cracking - Survey Date - Area of low severity alligator cracking, in ft 2 - Area of medium severity alligator cracking, in ft 2 - Area of high severity alligator cracking, in ft 2 - Total Sum alligator cracking, in ft 2 Table 12 Distress Data - Longitudinal Cracking in the Wheel Path - Length of low severity longitudinal cracking in the wheel path, in ft - Length of medium severity longitudinal cracking in the wheel path, in ft - Length of high severity longitudinal cracking in the wheel path, in ft - Total Sum alligator cracking, in ft EE-1.3
7 Table 13 Distress Data - Thermal Cracking - Length of low severity transverse cracking in the wheel path, in ft - Length of medium severity transverse cracking in the wheel path, in ft - Length of high severity transverse cracking in the wheel path, in ft - Weighted average, in ft Table 14 Summary of Distress Data Available - Distress data available for each of the 94 sections EE-1.4
8 Figure 1. LTPP Sections Used for Calibration and Validation of the 2002 Design Guide EE-1.5
9 Comments on Collected Data to Input into the Design Guide Software Most of the information shown on the tables was extracted from the LTPP database and provided by Fugro-BRE. However, some of the elements needed as input data and presented in the aforementioned tables could not be found on the LTPP Database and hence, not provided by Fugro-BRE. In these cases, the data was obtained from different sources of information or reasonably assumed. This section is intended to describe either the sources or the assumptions needed to complete the data set for those parameters for which it was not possible to get the complete information from the LTPP database. Table 1 Analysis Conditions Base/Subbase Construction Completion Date This information was not found in the LTPP database in most of the cases. It was assumed to be 2 months prior to the Asphalt Construction Completion date. Design Period The design period was chosen based on the time the measured distress data was available in the database. Table 2 Pavement Lane Properties Pavement Slope A value of 1.5% was assumed for all of the sections. Initial International Roughness Index (IRI) A value of 150 m/km was assumed for all of the sections. Thermal Conductivity Reasonable values of thermal conductivity range from 0.44 to 0.81 BTU/hr-ft- o F. A default value of 0.67 BTU/hr-ft- o F was assumed for all of the sections. Heat Capacity Reasonable values of heat capacity range from 0.22 to 0.40 BTU/lb- o F. A default value of 0.22 BTU/hr-ft- o F was assumed for all of the sections. Surface Short Wave Absorptivity Reasonable values of surface short wave absorptivity for weathered asphalt (gray) range from 0.80 to A default value of 0.85 was assumed for all of the sections. Table 3 - Environmental/Climatic Input EE-1.6
10 Latitude and Longitude This data was provided in degrees by Fugro-BRE. When inputting into the 2002 Design Guide, the format needed is degrees.minutes. Therefore, conversion to degrees and minutes was needed. Groundwater Table Depth If the boring log did not show information on groundwater table depth, this value was set up at the bottom of the borehole, which was considered the most conservative assumption. Information not found on the LTPP database was extracted from the report presented by Harold Von Quintus on March Tables B-1, B-2, and B-3 (Annex- B). The data shown in this report was gathered from Soil Conservation Service reports and maps. Additional data was gathered from the US Geological Survey records, state DOTs, and LTPP boring logs and comments (Annex- C). Table 3 shows the source of information of the data gathered for the calibration and validation of the new pavement sections. Table 4 - Pavement Structure Number of Layers The number of layers data was obtained from the database. In several cases, the surface asphalt layer thickness was reported to be less than 1 inch. Furthermore, no information was generally found for these layers. Due to software limitations, the Design Guide cannot handle asphalt layers of less than 1 inch in thickness. For the aforementioned reasons, sections for which the surface layer was reported to be less than 1 inch, this layer was combined with the layer immediately beneath it. Generally the subgrade was reported to be an uncompacted layer. Therefore, the top 12 inches of the subgrade was assumed to be compacted material. This compacted "sublayer" is not included in the Number of Layers column shown in Table 4. The Number of Layers column includes the bedrock or rigid layer, if such information was available. Depth to Bedrock or Depth to a Rigid Layer In most of the cases, records of depth to bedrock were not found in the LTPP database. In order to complete this information, the following sources were used: Report presented by Harold Von Quintus on March 2001 (Tables B-1, B-2, and B-3) with data from the Soil Conservation Service reports and maps (Annex- B). Data available from the US Geological Survey and state DOTs. (Annex- C) State DOTs records (Annex- C) LTPP boring log information and comments (Annex- C) Table 4 shows the source of information from which the bedrock depth was attained, in the Comments column. EE-1.7
11 Table 5 - Aggregate Gradation for Asphalt Mix Data was gathered from the LTPP database (Table AG04) and provided by Fugro-BRE. Table 6 - Effective Binder Content by Volume at Time of Construction The LTPP database does not have available this information. To obtain values of effective binder content by volume at time of construction, the following information was gathered: Binder Content by weight (Pb) from LTPP Table TST_AC04 Specific Gravity of the Binder (Gb) from LTPP Table AE03 Bulk Specific Gravity of the Mix (Gmb) at time of construction from LTPP Table AC_02 Maximum Theoretical Specific Gravity of the Mix (Gmm) from LTPP Table TST_AC03 Combined Bulk Specific Gravity of the Aggregate (Gsb) from LTPP Table INV_PMA With this information, the Effective Specific Gravity of the Aggregate (Gse) was calculated as follows: 100 Pb Gse = 100 Pb Gmm Gb...(1) and the Effective Binder Content by Volume (Vbe): ( Gse Gsb) Pb Vbe = Gmb ( 100 Pb) Gb Gse Gsb...(2) Bulk Specific Gravity of the Mix (Gmb) at Time of Construction For several sections, the Gmb value at the time of construction was not available in the LTPP database. Therefore, this value was calculated from the Maximum Theoretical Specific Gravity of the Mix (Gmm) and the Original Air Voids (VA orig ) as follows: Gmb = Gmm 1 VAorig...(3) 100 The sections with Gmb values calculated from equation (3) can be recognized by the superscript 2 in Table 6. Maximum Theoretical Specific Gravity of the Mix (Gmm) Gmm values used in the calculation of the Vbe, were gathered from the TESTING Table of the LTPP database. There were few sections for which these values were not found on this table. In those cases, the Gmm values from the INVENTORY table were used. The Gmm values from the INVENTORY table can be recognized by the superscript 3 in Table 6. EE-1.8
12 Effective Binder Content by Volume (Vbe) at Time of Construction In cases where not enough data was available to calculate Vbe, a rough correlation with Pb was used, based on the data shown in Figure 2. The following correlation was found: Vbe = 2 Pb...(4) Vbe values calculated by equation (4) are recognized by the superscript 4 in Table 6. Table 7 - Original Air Voids (at Time of Construction) and Total Unit Weight The air voids at time of construction was extracted from the LTPP database by Fugro-BRE and was transferred to the ASU research team. During the review of the data, it was observed that the information on the original air voids extracted from the INVENTORY tables for the GPS sections might be in error. It was then decided to carry out the computation of these values based on available information. The data collected to calculate the original air voids was the following: Air Voids at Age = t Age = t Mean Annual Air Temperature, Maat Original Viscosity at 77 o F Vbe (%) Vbe = 2 Pb R 2 = Pb (%) Figure 2. Correlation between Effective Binder Content by Volume (Vbe) and Binder Content by Weight (Pb) EE-1.9
13 The Inter Team Technical Report explaining how the air voids at time of construction for the GPS sections were computed is shown in Annex- D. Original air voids data for the SPS sections was considered to be reasonable and therefore, it was extracted directly from the LTPP database. The SPS sections are marked with the superscript 1 in Table 7. Original Viscosity at 77 o F Information on the original viscosity at 77 o F was not available for the GPS sections in the LTPP database. However, penetration at 77 o F was available. In those cases (recognized by the superscript 2 in Table 7) the penetration (Pen) values were converted to viscosity (η) values by the model developed by Mirza and Witczak, 1995 (see reference in Annex- D) at the University of Maryland. The regression model is given below: ( Pen) log( Pen) 2 logη = log...(5) In cases were the penetration was not provided, the viscosity value was inferred from the A and VTS values based on the binder grade provided for the layer. The following equation was used for this purpose: log logη = A + VTS logt R...(6) where: η = Viscosity, cpoises T R = Temperature in Rankine A, VTS = Regression parameters as function of binder grade Section for which the viscosity was calculated by equation (6) are recognized by the superscript 3 in Table 7. Table 8 - Asphalt Binder Data At present, only Level 3 analysis has been validated, which only requires as input either the viscosity grade or the penetration grade. The rest of information has been filed for future reference. In cases where the binder grade was missing, the viscosity at 140 o F was used to infer the value (information marked with superscript 1 in Table 8). Table 9a - Unbound Materials Data The following data is summarized in Table 9a: Layer Number Layer Type Dry Thermal Conductivity, in BTU/hr-ft- o F Dry Heat Capacity, in BTU/lb- o F Liquid Limit Plastic Limit Plasticity Index EE-1.10
14 Percent Passing #200 Sieve Percent Passing #4 Sieve Diameter D 60, in mm Dry Thermal Conductivity Values for Dry Thermal Conductivity were not available in the LTPP database. Default values were available from Part 2-CHAPTER 3 Environmental Effects, based on the AASHTO soil classification: Table 1. Dry Thermal Conductivity Default Values Soil Type Range (BTU/ft-hro F) Recommended (BTU/ft-hr- o F) A-1-a A-1-b A A A A A A A A A A Dry Heat Capacity Values for Heat Capacity were not available in the LTPP database. Reasonable values range from 0.17 to 0.20 BTU/lb- o F. Liquid Limit and Plastic Limit The Liquid and Plastic Limits (Atterberg Limits) are not needed as input parameters in the Design Guide software. However, they must be obtained in order to classify the granular unbound materials. For lime treated subbases, the LTPP database did not report Atterberg Limits. In this case, values were inferred base on the lime content of the material, that is, the effect of lime content on the Atterberg limits (Yoder and Witczak, 1975, Principles of Pavement Design). Figure 3 shows the effect of lime content on the material properties such as the Liquid and the Plastic Limits, and hence on the Plasticity Index. The layers for which this assumption was needed are recognized by the superscript 2 in Table 9a. Percent Passing #200 and Percent Passing #4 For some treated subbases, this information was missing. In those cases, the gradation (% Passing #200 and % Passing #4) for the treated subbases (TS) was assumed to be equal to the EE-1.11
15 gradation reported for the layer immediately beneath them. The layers for which this assumption was made are recognized with the superscript 3 in Table 9a. Diameter D 60 Information on diameter D 60 is not available in the LTPP Database. Values were obtained manually from the Grain Size Distribution information provided by Fugre-BRE. The Design Guide software has a lower boundary for Diameter D 60 values of 0.07 mm. In cases where the D 60 of the material was lower than 0.07 mm, it was approximated to the minimum required. The layers for which this assumption was made are pointed out in the last column of Table 9a. Figure 3. Effect of Lime Content on Atterberg Limits (Yoder and Witczak, 1975) Table 9b - Unbound Materials Data The following data is summarized in Table 9b: Optimum Moisture Content, in %, from LTTP Database Estimated Optimum Moisture Content, in %, for Level 3 Analysis EE-1.12
16 Maximum Dry Unit Weight, in pcf, from LTPP Database Estimated Maximum Dry Unit Weight, in pcf, for Level 3 Analysis Specific Gravity of Solids Saturated Hydraulic Conductivity, in ft/hr AASHTO Soil Classification Unified Soil Classification System (USCS) Classification Estimated Resilient Modulus based on AASHTO Soil Classification Optimum Moisture Content from LTPP Database The measured optimum moisture content values gathered from the LTPP database were not used for the Calibration and Validation of the Design Guide because only Level 3 analysis was performed. However, this information is valuable for Levels 1 and 2 analyses. Estimated Optimum Moisture Content for Level 3 Analysis For Level 3 analysis, the optimum moisture content was internally estimated by the Enhanced Integrated Climatic Model (EICM) based on gradation and plasticity information for the soil. Please refer to Table 3.13 on Part 2- CHAPTER 3- ENVIRONMENTAL EFFECTS of the Design Guide for detailed explanation and equations. Maximum Dry Unit Weight from LTPP Database The measured maximum dry unit weight values gathered from the LTPP database were not used for the Calibration and Validation of the Design Guide because only Level 3 analysis was performed. However, this information is valuable for Levels 1 and 2 analyses. Estimated Maximum Dry Unit Weight for Level 3 Analysis For Level 3 analysis, the maximum dry unit weight was internally estimated by the Enhanced Integrated Climatic Model (EICM) module based on gradation, plasticity, and the estimated optimum moisture content for Level 3. Please refer to Table 3.13 on Part 2- CHAPTER 3- ENVIRONMENTAL EFFECTS of the Design Guide for detailed explanation and equations. Specific Gravity of Solids Information on the specific gravity of solids for unbound materials is not available in the LTPP database. For Level 3 analysis, this value was internally estimated by the EICM based on gradation and plasticity properties of each unbound layer. Please refer to Table 3.12 on Part 2- CHAPTER 3- ENVIRONMENTAL EFFECTS of the Design Guide for detailed explanation and equations. Saturated Hydraulic Conductivity Information on saturated hydraulic conductivity for unbound materials is not available in the LTPP database. For Level 3 analysis, this value was internally estimated by the EICM based on gradation and plasticity properties of each unbound layer. Please refer to Table 3.16 on Part 2- CHAPTER 3- ENVIRONMENTAL EFFECTS of the Design Guide for detailed explanation and equations. Saturated hydraulic conductivity for the bedrock was assumed to be 5 ft/hr. EE-1.13
17 Table 9c - Unbound Materials Data The following data is summarized in Table 9c: AASHTO Soil Classification Unified Soil Classification System (USCS) Classification Estimated Resilient Modulus at Optimum Conditions based on AASHTO Soil Classification Estimated Resilient Modulus at Optimum Conditions based on AASHTO Soil Classification The input resilient modulus at optimum conditions was obtained by relationships developed between soil index properties and the California Bearing Ratio (CBR). Once relationships were developed to predict CBR values, the following correlation was used to relate properties directly to estimates of modulus, M R : M R 0.64 = 2555 CBR...(7) Detailed analysis and correlations are presented in Annex- E of this report. Measured Distress Data to Compare with Estimated Results from the Design Guide Software The following tables contain the measured distress information needed to calibrate the results obtained from the analysis: Table 10 Distress Data Rutting The following data is summarized in Table 10: Survey Date Maximum displacement between reference wire line and pavement surface in left lane half, LLH-Depth Mean, in inches Maximum displacement between reference wire line and pavement surface in right lane half, RLH-Depth Mean, in inches Maximum value of LLH-Depth Mean or RLH-Depth Mean, in inches Average displacement between left lane half and right lane half data, in inches The average displacement between the left and the right lanes was used to calibrate the 2002 Design Guide rutting model. In those cases where no information was provided for both lanes, the maximum displacement between the left and right lanes was considered for the calibration. Table 11 Distress Data Alligator Cracking The following data is summarized in Table 11: EE-1.14
18 Survey Date Area of low severity alligator cracking, in ft 2 Area of medium severity alligator cracking, in ft 2 Area of high severity alligator cracking, in ft 2 Total Sum alligator cracking, in ft 2 Table 12 Distress Data - Longitudinal Cracking in the Wheel Path The following data is summarized in Table 12: Length of low severity longitudinal cracking in the wheel path, in ft Length of medium severity longitudinal cracking in the wheel path, in ft Length of high severity longitudinal cracking in the wheel path, in ft Total Sum alligator cracking, in ft Table 13 Distress Data - Thermal Cracking The following data is summarized in Table 13: Length of low severity transverse cracking in the wheel path, in ft Length of medium severity transverse cracking in the wheel path, in ft Length of high severity transverse cracking in the wheel path, in ft Weighted average, in ft Weighed Average Similarly to the distress weighted average calculated above, a weighted average of the transverse cracking was based on the severity level of the distress defined in the LTPP database: Weighted Low _ severity + 3Medium _ severity + 5High _ severity Average =.(10) 9 Table 14 Summary of Distress Data Available Table 14 presents a summary of the distress data available for the 94 sections used in the calibration of the new pavement design models. EE-1.15
19 Additional Information Provided by FUGRO-BRE Additional information was provided by FUGRO-BRE that has not yet been used in the calibration and validation of the Design Guide. This information can be found in the report titled Calibration and Validation of the Fatigue Cracking and Rutting Prediction Models for the 2002 Design Guide, submitted on March 20, It includes: Summary and listing of the LTPP test sections where the load-related cracks, in the wheel paths, may have initiated at the surface and are propagating downward through the HMA layers. Summary of the permeability for the subgrade soils supporting each LTPP test section included in the calibration and validation factorials for new construction. Summary of resilient modulus test results for all unbound layers and materials included in the pavement structures for the calibration and validation factorials for new construction. Summary of laboratory resilient modulus and back-calculated layer elastic modulus for each structural layer included in the back-calculation process for the calibration and validation factorials for new construction. The additional information presented above can be used for calibration and validation of hierarchical levels 1 and 2. At present, only Level 3 analysis is being calibrated. EE-1.16
20 ANNEX- A Input Data for the Calibration and Validation of the 2002 Design Guide for New Constructed Pavement Sections EE-1.17
21 Table 1 Analysis Conditions Section State Code SHRP ID State Project Type Pavement Type 1 Base/Subgrade Construction Completion Date Asphalt Construction Completion Date Traffic Opening Date Design Period (years) Alabama GPS CONV 8/1/ /1/ /1/ Alabama GPS DS/FD 8/1/ /1/ /1/ Alabama GPS DS/FD 2/1/1988 4/1/1988 4/1/ Alaska GPS CONV 5/1/1983 7/1/1983 7/1/ Alaska GPS CONV 8/1/ /1/ /1/ Arizona SPS CONV 6/1/1993 8/1/1993 8/1/ Arizona SPS DS/FD 6/1/1993 8/1/1993 8/1/ Arizona SPS DS/FD 6/1/1993 8/1/1993 8/1/ Arizona SPS DS/FD(TB) 6/1/1993 8/1/1993 8/1/ Arizona SPS DS/FD(TB) 6/1/1993 8/1/1993 8/1/ Arizona SPS DS/FD(TB) 6/1/1993 8/1/1993 8/1/ Arizona GPS DS/FD 2/1/1978 4/1/1978 9/1/ Arizona GPS DS/FD 4/1/1979 6/1/ /1/ Arizona GPS CONV 5/1/1977 7/1/1977 7/1/ Colorado GPS CONV 4/1/1972 6/1/1972 6/1/ Colorado GPS CONV 6/1/1982 8/1/ /1/ Colorado GPS CONV 12/1/1983 2/1/ /1/ Connecticut GPS CONV 5/1/1985 7/1/1985 7/1/ Florida SPS DS/FD(TB) 9/1/ /01/ /01/ Florida SPS DS/FD(TB) 9/1/ /01/ /01/ Florida SPS DS/FD(TB) 9/1/ /01/ /01/ Florida SPS DS/FD(TB) 9/1/ /01/ /01/ Florida GPS CONV 10/1/ /1/ /1/ Florida GPS CONV 4/1/1974 6/1/1974 6/1/ Florida GPS CONV 10/1/ /1/ /1/ Florida GPS CONV 6/1/1987 8/1/1987 8/1/ Florida GPS CONV 8/1/ /1/ /1/ Florida GPS DS/FD(TB) 4/1/1986 6/1/1986 6/1/ Florida GPS CONV 12/1/1970 2/1/1971 2/1/ Georgia GPS CONV 4/1/1981 6/1/1981 6/1/ Georgia GPS DS/FD 9/1/ /1/ /1/ Georgia GPS DS/FD(TB) 4/1/1977 6/1/1977 6/1/ Georgia GPS DS/FD(TB) 4/1/1977 6/1/1977 6/1/ Georgia GPS DS/FD 4/1/1978 6/1/1978 6/1/ Idaho GPS CONV 6/1/1973 8/1/1973 8/1/ Idaho GPS CONV 8/1/ /1/ /1/ Idaho GPS CONV 8/1/ /1/ /1/ Idaho GPS CONV 8/1/ /1/ /1/ Kansas GPS DS/FD 11/1/1984 1/1/1985 1/1/ Massachusetts GPS DS/FD 7/1/1974 9/1/1974 9/1/ Massachusetts GPS DS/FD 9/1/ /1/ /1/ Michigan GPS CONV 7/1/1971 9/1/1971 9/1/ Michigan GPS CONV 5/1/1985 7/1/1985 7/1/ Minnesota GPS CONV 10/1/1978 1/1/1979 1/1/ Minnesota GPS DS/FD 11/1/1978 1/1/1979 1/1/ Missouri GPS DS/FD 2/1/1986 4/1/1986 5/1/ Montana GPS CONV 4/1/1981 6/1/1981 6/1/ Montana GPS CONV 4/1/1988 6/1/1988 6/1/ Nevada GPS DS/FD 4/1/1984 6/1/1984 6/1/ New Jersey GPS DS/FD 5/1/1974 7/1/1974 7/1/ New Jersey GPS DS/FD 11/1/1971 1/1/1972 1/1/ New Jersey GPS DS/FD 7/1/1973 9/1/1973 9/1/ New Jersey GPS DS/FD(TB) 5/1/1974 7/1/ /1/ New Jersey GPS DS/FD 9/1/ /1/ /1/ New Mexico SPS DS/FD 9/1/ /1/ /1/ New Mexico SPS CONV 9/1/ /1/ /1/ New Mexico SPS DS/FD(TB) 9/1/ /1/ /1/ New Mexico SPS DS/FD(TB) 9/1/ /1/ /1/ New Mexico SPS DS/FD(TB) 9/1/ /1/ /1/ New Mexico SPS DS/FD(TB) 9/1/ /1/ /1/ New Mexico GPS DS/FD 8/1/ /1/ /1/ New Mexico GPS DS/FD 8/1/ /1/ /1/ New Mexico GPS CONV 4/1/1984 6/1/1984 6/1/ EE-1.18
22 Table 1 (Cont d) Analysis Conditions Section State Code SHRP ID State Project Type Pavement Type 1 Base/Subgrade Construction Completion Date Asphalt Construction Completion Date Traffic Opening Date North Carolina GPS CONV 5/1/1982 7/1/1982 7/1/ North Carolina GPS CONV 9/1/ /1/ /1/ North Carolina GPS CONV 8/1/ /1/ /1/ North Carolina GPS CONV 10/1/ /1/ /1/ North Carolina GPS CONV 12/1/1989 2/1/1990 2/1/ Oklahoma GPS DS/FD(TB,TS) 2/1/1986 4/1/1986 7/1/ Oklahoma GPS DS/FD 2/1/1987 4/1/1987 4/1/ Oklahoma GPS DS/FD 4/1/1984 6/1/1984 6/1/ Pennsylvania GPS CONV 6/1/1987 8/1/1987 8/1/ South Carolina GPS CONV 4/1/1985 6/1/1985 7/1/ Tennessee GPS CONV 4/1/1986 6/1/1986 6/1/ Texas GPS CONV 1/1/1989 3/1/1989 4/1/ Texas GPS DS/FD(TS) 1/1/1986 3/1/1986 3/1/ Texas GPS CONV 11/1/1981 1/1/1982 1/1/ Texas GPS DS/FD(TS) 12/1/1983 2/1/1984 6/1/ Texas GPS DS/FD(TS) 8/1/ /1/1971 8/1/ Texas GPS CONV 6/1/1972 8/1/1972 8/1/ Texas GPS CONV 10/1/ /1/1973 5/1/ Texas GPS DS/FD(TS) 5/1/1988 7/1/1988 7/1/ Texas GPS CONV 12/1/1974 2/1/1975 2/1/ Texas GPS DS/FD(TS) 1/1/1981 3/1/1981 3/1/ Texas GPS CONV 5/1/1986 7/1/1986 9/1/ Vermont GPS CONV 6/1/1984 8/1/ /1/ Vermont GPS CONV 7/1/1984 9/1/ /1/ Virginia GPS CONV 8/1/ /1/ /1/ Virginia GPS DS/FD(TS) 10/1/ /1/ /1/ Virginia GPS DS/FD 3/1/1985 5/1/1985 5/1/ Washington GPS CONV 9/1/ /1/ /1/ Washington GPS DS/FD 7/1/1973 9/1/ /1/ Wyoming GPS CONV 5/1/1980 7/1/1980 7/1/ New Brunswick GPS CONV 7/1/1978 9/1/1978 9/1/ CONV = Conventional; DS/FD = Deep Strength/Full Depth; TB = Treated Base; TS = Treated Subbase Design Period (years) EE-1.19
23 Table 2 Pavement Lane Properties Section Lane Width (ft) Pavement Slope (%) Initial IRI (m/km) 1 Thermal Conductivity (BTU/hr-ft- o F) Heat Capacity (BTU/lb- o F) Surface Short Wave Absorptivity Table 2 (Cont d) Pavement Lane Properties EE-1.20
24 Section Lane Width (ft) Pavement Slope (%) Initial IRI (m/km) 1 Thermal Conductivity (BTU/hr-ft- o F) Heat Capacity (BTU/lb- o F) Surface Short Wave Absorptivity IRI: International Roughness Index EE-1.21
25 Table 3 Environmental / Climatic Properties Section Latitude North (degrees) Longitude West (degrees) Elevation (ft) Groundwater Table Depth 1 (ft) Source of Information U.S Geological Survey Harold Von Quintus Report U.S Geological Survey >20 Harold Von Quintus Report U.S Geological Survey >20 Harold Von Quintus Report >20 Harold Von Quintus Report >20 Harold Von Quintus Report >20 Harold Von Quintus Report >20 Harold Von Quintus Report >20 Harold Von Quintus Report U.S Geological Survey U.S Geological Survey >20 Harold Von Quintus Report U.S Geological Survey > 7.5 LTPP boring log LTPP Database LTPP Database Harold Von Quintus Report Harold Von Quintus Report Harold Von Quintus Report Harold Von Quintus Report LTPP boring log - Moist soil encountered Harold Von Quintus Report LTPP boring log - Moist soil encountered Harold Von Quintus Report LTPP boring log - Wet sand encountered U.S Geological Survey DOT LTPP Database U.S Geological Survey U.S Geological Survey U.S Geological Survey >20 Harold Von Quintus Report U.S Geological Survey >20 Harold Von Quintus Report Harold Von Quintus Report Harold Von Quintus Report - Perched water Feb-May U.S Geological Survey U.S Geological Survey U.S Geological Survey U.S Geological Survey U.S Geological Survey Coordinates provided by Fugro - Harold Von Quintus Report U.S Geological Survey DOT Data U.S Geological Survey LTPP Database U.S Geological Survey U.S Geological Survey U.S Geological Survey U.S Geological Survey U.S Geological Survey U.S Geological Survey >20 Harold Von Quintus Report >20 Harold Von Quintus Report >20 Harold Von Quintus Report >20 Harold Von Quintus Report >20 Harold Von Quintus Report >20 Harold Von Quintus Report U.S Geological Survey >14 LTPP boring log >20 Harold Von Quintus Report EE-1.22
26 Table 3 (Cont d) Environmental / Climatic Properties Section Latitude North (degrees) Longitude West (degrees) Elevation (ft) Groundwater Table Depth 1 (ft) >20 Harold Von Quintus Report >20 Harold Von Quintus Report >20 Harold Von Quintus Report U.S Geological Survey >20 Harold Von Quintus Report U.S Geological Survey Harold Von Quintus Report LTPP Database Harold Von Quintus Report U.S Geological Survey >20 Harold Von Quintus Report Harold Von Quintus Report >11 Harold Von Quintus Report LTPP Database >20 Harold Von Quintus Report U.S Geological Survey Harold Von Quintus Report >8.3 Harold Von Quintus Report U.S Geological Survey > 15.5 LTPP boring log U.S Geological Survey >20 Harold Von Quintus Report LTPP Database >20 Harold Von Quintus Report U.S Geological Survey U.S Geological Survey >20 Harold Von Quintus Report U.S Geological Survey U.S Geological Survey LTPP Database > 6.5 LTPP boring log 1 From pavement surface Source of Information EE-1.23
27 Table 4 Pavement Structure Section No. of Layers Layer Number Layer Type 1 Representative Thickness (in) Comments AC 1.6 AC surface layer combined with AC layer beneath 2 AC GB GS SS BR > 5 ft (USGS-Regional) AC 1.1 LTPP data shows 0.9" 2 AC AC 3 4 GB SS BR BR = 21 ft (Harold Von Quintus Report) AC AC GB SS BR BR=13.6 ft ( LTTP Data) AC 3 2 GB SS BR = Infinite (Harold Von Quintus Report) AC GB 6 3 GS SS BR > 20 ft AC GB SS AC GB 12 3 SS AC AC SS BR = 50 ft (Harold Von Quintus Report) AC ATB SS BR = 50 ft (Harold Von Quintus Report) AC ATB GB SS BR = 50 ft (Harold Von Quintus Report) AC 4 2 ATB GB SS BR = 50 ft (Harold Von Quintus Report) AC 6.5 AC surface layer combined with AC layer beneath 2 GB SS BR = 200 ft (DOT and USGS data) AC 10 AC surface layer combined with AC layer beneath 2 GB SS BR = 20 ft (LTPP-General) AC GB SS BR = Infinite (Harold Von Quintus Report) AC 4.2 AC surface layer combined with AC layer beneath 2 GB GS 11 4 SS BR > 7.2 ft AC GB GS GS SS BR = 35 ft (LTTP database) Table 4 (Cont d) Pavement Structure EE-1.24
28 Section No. of Layers Layer Number Layer Type 1 Representative Thickness (in) Comments AC GB GS SS BR = Infinite (Harold Von Quintus Report) AC AC GB 12 4 SS BR = Infinite (Harold Von Quintus Report) AC 2 2 AC ATB 8 4 SS BR AC AC ATB 12 4 SS BR AC AC 2 3 ATB 4 4 GB 4 5 SS BR AC AC 5 3 ATB GB 4 5 SS BR AC 5 AC surface layer combined with AC layer beneath 2 GB GS 12 4 SS BR > 9 ft AC GB GS 15 4 SS BR = 50 ft (Harold Von Quintus Report) AC 2.3 AC surface layer combined with AC layer beneath 2 GB GS SS BR > 14 ft AC GB 10 3 GS SS BR BR = 19.7 ft from top of subgrade (Harold Von Quintus Report) AC 2.7 AC surface layer combined with AC layer beneath 2 GB 12 3 SS BR > 17 ft AC 3.9 AC surface layer combined with AC layer beneath 2 ATB 6 3 GS SS BR > 7 ft (LTPP boring log) AC GB GS 12 4 SS BR > 17 ft (LTPP boring log) AC 3 2 AC GB SS BR = 50 ft (Harold Von Quintus Report) Table 4 (Cont d) Pavement Structure Section No. of Layers Layer Number Layer Type 1 Representative Thickness (in) Comments AC 8.7 AC surface layer combined with AC layer beneath 2 GB SS BR = 30 ft (DOT Information) EE-1.25
29 AC 3.2 AC surface layer combined with AC layer beneath 2 ATB SS BR = 150 ft (DOT Information) AC 3.7 AC surface layer combined with AC layer beneath 2 ATB SS BR = 150 ft (DOT Information) AC AC GB SS BR = Infinite (Harold Von Quintus Report) AC 3.7 AC surface layer combined with AC layer beneath 2 GB SS 48 4 BR BR = 5 ft (LTTP database) AC AC GB SS BR = Infinite (Harold Von Quintus Report) AC GB SS BR = Infinite (Harold Von Quintus Report) AC AC 6 3 GB SS BR = Infinite (Harold Von Quintus Report) AC AC SS BR = 145 ft (USGS) AC AC GB SS 41 5 BR BR = 5 ft (LTTP boring log - refusal) AC AC GB SS BR BR = 6 ft (LTTP boring log - refusal) AC GB SS BR = 500 ft ( DOT) AC GB 5 3 SS 38 4 BR BR = 3.9 ft (DOT boring logs) AC AC GB SS BR BR = 8.3 ft from top of subgrade (Harold Von Quintus Report) AC 15.7 AC surface layer combined with AC layer beneath 2 SS BR > 5.5 ft (Soil Conservation Service reports) AC AC 9.6 AC layer combined with layer beneath 3 GB SS BR = 38 ft (DOT boring logs) AC 4.9 AC surface layer combined with AC layer beneath 2 GB GS SS BR > 16.5 ft (LTTP boring log) Table 4 (Cont d) Pavement Structure Section No. of Layers Layer Number Layer Type 1 Representative Thickness (in) Comments AC GB SS BR = Infinite (Harold Von Quintus Report) AC 7 AC surface layer combined with AC layer beneath 2 GB SS BR > 20 ft (LTTP boring log) AC AC 5.9 EE-1.26
30 3 GB SS BR BR = 3.3 ft (LTTP database) AC AC GB GS SS BR > 5 ft (LTTP boring log and Soil Conservation Service reports) AC AC GB 11 4 SS BR > 7 ft (Soil Conservation Service reports) AC ATB GS SS BR BR = 10 ft from top of subgrade (LTTP database) AC AC SS BR > 4.5 ft (LTTP boring log) AC GB SS AC GB SS AC ATB SS AC ATB SS AC ATB 4 3 GB SS AC ATB 8 3 GB SS AC 8.9 AC surface layer combined with AC layer beneath 2 GB SS BR = 1500 ft (USGS) AC 6.3 AC surface layer combined with AC layer beneath 2 GB SS BR = 1377 ft (USGS) AC GB 6 3 SS BR = Infinite (Harold Von Quintus Report) AC 2 2 AC GB SS BR = 50 ft (Harold Von Quintus Report) Table 4 (Cont d) Pavement Structure Section No. of Layers Layer Number Layer Type 1 Representative Thickness (in) Comments AC GB 12 3 SS BR = Infinite (Harold Von Quintus Report) AC AC GB SS BR = Infinite (Harold Von Quintus Report) AC AC GB 12 4 SS BR > 6.5 ft (LTTP boring log) AC GB 12 3 GS 24 4 SS BR = Infinite (Harold Von Quintus Report) EE-1.27
31 AC ATB TS 6 4 SS BR > 14 ft (LTTP boring log) AC AC SS BR = Infinite (Harold Von Quintus Report) AC AC SS BR = Infinite (Harold Von Quintus Report) AC 3 2 AC GB 12 4 SS BR BR = 25 ft from top of subgrade (Harold Von Quintus Report) AC 3.2 AC surface layer combined with AC layer beneath 2 GB SS BR > 14 ft (LTTP boring log) AC GB SS BR BR = 25 ft from top of subgrade (Harold Von Quintus Report) AC 1.2 LTPP data shows 1.0" 2 AC GB SS BR BR = 25 ft from top of subgrade (Harold Von Quintus Report) AC AC GB TS 6 5 SS BR = 50 ft (Harold Von Quintus Report) AC AC GB SS BR = Infinite (Harold Von Quintus Report) AC 1.1 LTPP: AC thickness=0.9 in. Software limitation for thickness < 1 in. 2 AC SS BR = Infinite (Harold Von Quintus Report) AC 2.7 AC surface layer combined with AC layer beneath 2 GB TS 8 4 SS BR > 10 ft (LTTP boring log) AC GB SS BR BR = 20 ft from top of subgrade (Harold Von Quintus Report) Table 4 (Cont d) Pavement Structure Section No. of Layers Layer Number Layer Type 1 Representative Thickness (in) Comments AC AC GB SS BR = Infinite (Harold Von Quintus Report) AC AC GB TS SS BR = 50 ft (Harold Von Quintus Report) AC 5.7 AC surface layers combined with AC layer beneath 2 GB SS BR > 15.5 ft (LTTP boring log) AC GB TS SS AC GB SS BR BR = 25 ft from top of subgrade (Harold Von Quintus Report) EE-1.28
32 AC 3 2 AC GB SS BR = Infinite (Harold Von Quintus Report) AC 3 2 AC 5 3 GB GS SS BR = 50 ft (Harold Von Quintus Report) AC AC GB SS 72 5 BR BR = 6 ft (Harold Von Quintus Report) AC AC GB TS SS BR > 50 ft (Harold Von Quintus Report) AC AC GB SS BR BR = 16.7 ft from top of subgrade (Harold Von Quintus Report) AC GB GS SS BR > 6.5 ft (LTTP boring log) AC AC GB SS 48 5 BR BR = 5.1 ft (LTTP boring log - refusal) AC GB SS BR = Infinite (Harold Von Quintus Report) AC AC GB GS SS BR > 6.5 ft (LTTP boring log) 1 AC=Asphalt Concrete; GB=Granular Base; ATB=Asphalt Treated Base; GS=Granular Subbase; TS= Treated Subbase; SS=Subgrade; BR=Bedrock Table 5 Aggregate Gradation for Asphalt Mixtures Section Layer Number Layer Type 1 % Retained 3/4" Sieve % Retained 3/8" Sieve %Retained #4 Sieve % Passing #200 Sieve AC AC AC AC AC AC AC AC AC AC AC AC AC AC ATB AC ATB AC ATB AC AC AC AC EE-1.29
33 AC AC AC AC AC AC ATB AC AC ATB AC AC ATB AC AC ATB AC AC AC AC AC AC ATB AC AC AC AC AC ATB AC ATB AC AC AC AC AC AC AC AC Table 5 (Cont d) Aggregate Gradation for Asphalt Mixtures Section Layer Number Layer Type 1 % Retained 3/4" Sieve % Retained 3/8" Sieve %Retained #4 Sieve % Passing #200 Sieve AC AC AC AC AC AC AC AC AC AC AC AC AC AC AC AC AC AC AC AC AC AC AC ATB AC AC AC EE-1.30
34 AC AC ATB AC ATB AC ATB AC ATB AC AC AC AC AC AC AC AC AC AC AC AC ATB AC AC AC AC AC AC AC AC AC AC AC AC AC AC Table 5 (Cont d) Aggregate Gradation for Asphalt Mixtures Section Layer Number % Layer Type 1 Retained 3/4" Sieve % Retained 3/8" Sieve %Retained #4 Sieve % Passing #200 Sieve AC AC AC AC AC AC AC AC AC AC AC AC AC AC AC AC AC AC AC AC AC AC AC AC AC AC AC AC=Asphalt Concrete; ATB=Asphalt Treated Base EE-1.31
35 EE-1.32
36 Table 6 Effective Binder Content Section Layer Number Layer 1 Type Pb (%) Gb Gmb Gmm Gsb Gse Vbe (%) AC AC AC AC AC AC AC AC AC AC AC AC AC AC ATB AC ATB AC ATB AC AC AC AC AC AC AC AC AC AC ATB AC AC ATB AC AC ATB AC AC ATB AC AC AC AC AC AC ATB AC AC AC AC AC ATB AC ATB AC AC AC AC AC AC AC AC EE-1.33
37 Table 6 (Cont d) Effective Binder Content Section Layer Number Layer 1 Type Pb (%) Gb Gmb Gmm Gsb Gse Vbe (%) AC AC AC AC AC AC AC AC AC AC AC AC AC AC AC AC AC AC AC AC AC AC AC ATB AC AC AC AC AC ATB AC ATB AC ATB AC ATB AC AC AC AC AC AC AC AC AC AC AC AC ATB AC AC AC AC AC AC AC AC AC AC AC AC Table 6 (Cont d) Effective Binder Content EE-1.34
38 Section Layer Number Layer Type 1 Pb (%) Gb Gmb Gmm Gsb Gse Vbe (%) AC AC AC AC AC AC AC AC AC AC AC AC AC AC AC AC AC AC AC AC AC AC AC AC AC AC AC AC AC AC=Asphalt Concrete; ATB=Asphalt Treated Base 2 Section for which Gmb was calculated from Equation (3) 3 Gmm values from the INVENTORY LTPP Table 4 Vbe calculated from correlation with Pb - Equation (4) EE-1.35
39 Table 7 Original Air voids and Total Unit Weight Section Layer Number Layer Type Air Voids at Age = t (%) Age t (months) Maat ( o F) Original 77 o F (MPoises) Original Air Voids (%) Total Unit Weight (pcf) AC AC AC AC AC AC AC AC AC AC AC AC AC AC ATB AC ATB AC ATB AC AC AC AC AC AC AC AC AC AC ATB AC AC ATB AC AC ATB AC AC ATB AC AC AC AC AC AC ATB AC AC AC AC AC ATB AC ATB AC AC AC AC AC AC EE-1.36
40 Table 7 (Cont d) Original Air voids and Total Unit Weight Section Layer Number Layer Type Air Voids at Age = t (%) Age t (months) Maat ( o F) Original 77 o F (MPoises) Original Air Voids (%) Total Unit Weight (pcf) AC AC AC AC AC AC AC AC AC AC AC AC AC AC AC AC AC AC AC AC AC AC AC AC AC ATB AC AC AC AC AC ATB AC ATB AC ATB AC ATB AC AC AC AC AC AC AC AC AC AC AC AC ATB AC AC AC AC AC AC AC AC AC AC Table 7 (Cont d) Original Air voids and Total Unit Weight EE-1.37
41 Section Layer Number Layer Type Air Voids at Age = t (%) Age t (months) Maat ( o F) Original 77 o F (MPoises) Original Air Voids (%) Total Unit Weight (pcf) AC AC AC AC AC AC AC AC AC AC AC AC AC AC AC AC AC AC AC AC AC AC AC AC AC AC AC AC AC AC AC SPS sections - Original air voids extracted from the LTPP database 2 Section for which the original viscosity at 77 o F was calculated from Equation (5) 3 Section for which the original viscosity at 77 o F was calculated from Equation (6) 4 Assumed value EE-1.38
42 Table 8 Asphalt Binder Grade Data Section Layer Num Layer Type Vis. Grade Pen Grade Pen 77 o F Visc 140 o F (Poises) Visc 275 o F (cstokes) Comments AC AC AC AC AC AC Binder grade not available on LTPP database 2 AC AC Binder grade not available on LTPP database 3 AC AC Binder grade not available on LTPP database AC AC AC AC AC AC Binder grade not available on LTPP database AC AC AC AC AC AC AC AC Binder grade not available on LTPP database 2 AC AC Binder grade not available on LTPP database AC AC ATB AC AC AC ATB AC AC AC ATB AC AC AC AC AC LTPP database: AR AC - Pen Binder grade not available on LTPP database AC - Pen AC AC AC - Pen Binder grade not available on LTPP database AC - Pen Binder grade not available on LTPP database 2 AC - Pen Binder grade not available on LTPP database AC AC AC AC ATB AC AC AC AC AC ATB AC AC AC AC AC ATB AC AC AC AC AC ATB AC AC AC AC - Pen AC AC AC AC AC AC AC AC ATB AC AC - Pen AC AC AC AC AC AC AC AC ATB AC AC AC ATB AC AC AC AC AC AC - Pen AC - Pen AC - Pen AC AC EE-1.39
43 Table 8 (Cont d) Asphalt Binder Grade Data Section Layer Num Layer Type Vis. Grade Pen Grade Pen 77 o F Visc 140 o F (Poises) Visc 275 o F (cstokes) Comments AC AC AC AC AC AC LTPP database: VAC-20 2 AC AC LTPP database: VAC AC AC AC AC AC AC AC AC AC - Pen AC - Pen AC - Pen AC - Pen AC - Pen AC - Pen AC - Pen AC - Pen AC - Pen AC AC LTPP database: AR AC AC AC AC AC - Pen AC - Pen AC AC AC AC AC AC ATB AC AC AC AC AC AC AC AC AC AC AC ATB AC AC AC ATB AC AC AC ATB AC AC AC ATB AC AC - Pen AC - Pen AC - Pen AC AC AC AC AC AC AC AC AC AC AC AC AC AC AC AC AC AC ATB AC AC AC AC AC AC AC AC AC AC AC AC AC AC AC AC AC AC AC AC AC AC AC AC AC Table 8 (Cont d) Asphalt Binder Grade Data EE-1.40
44 Section Layer Num Layer Type Vis. Grade Pen Grade Pen 77 o F Visc 140 o F (Poises) Visc 275 o F (cstokes) Comments AC AC AC AC AC AC AC AC AC AC AC AC AC AC AC AC AC AC AC AC AC AC AC AC AC AC AC - Pen AC - Pen AC - Pen AC - Pen AC AC AC AC AC AC AC AC AC AC AC AC AC AC LTPP database: AR AC - Pen AC - Pen AC AC AC - Pen AC - Pen Binder grade inferred from viscosity at 140 o F EE-1.41
45 Table 9a Unbound Materials Data Section Layer Num Layer Type 1 Dry Thermal Conductivity (BTU/hr-ft- o F) Heat Capacity (BTU/lb- o F) Liquid Limit (LL) Plastic Limit (PL) Plasticity Index (PI) % Passing #200 Sieve % Passing #4 Sieve GB GS SS GB SS BR GB SS BR GB SS GB GS SS GB SS GB SS SS SS GB SS GB SS GB SS GB SS GB SS GB GS SS GB GS GS SS GB GS SS GB SS SS BR SS BR GB SS BR GB SS BR GB GS SS GB GS SS GB GS SS GB GS SS BR D 60 (mm) EE-1.42
46 Table 9a (Cont d) Unbound Materials Data Section Layer Num Layer Type 1 Dry Thermal Conductivity (BTU/hr-ft- o F) Heat Capacity (BTU/lb- o F) Liquid Limit (LL) Plastic Limit (PL) Plasticity Index (PI) % Passing #200 Sieve % Passing #4 Sieve GB SS GS SS GB GS SS GB SS GB SS SS SS GB SS GB SS BR GB SS GB SS GB SS SS GB SS BR GB SS BR GB SS GB SS BR GB SS BR SS GB SS GB GS SS GB SS GB SS GB SS BR GB GS SS GB SS GS SS BR SS GB SS GB SS SS D 60 (mm) Table 9a (Cont d) Unbound Materials Data EE-1.43
47 Section Layer Num Layer Type 1 Dry Thermal Conductivity (BTU/hr-ft- o F) Heat Capacity (BTU/lb- o F) Liquid Limit (LL) Plastic Limit (PL) Plasticity Index (PI) % Passing #200 Sieve % Passing #4 Sieve SS GB SS GB SS GB SS GB SS GB SS GB SS GB SS GB SS GB SS GB GS SS SS SS SS GB SS BR GB SS GB SS BR GB SS BR GB TS SS GB SS SS GB TS SS GB SS BR GB SS GB TS SS GB SS GB TS SS GB SS BR GB SS GB GS SS D 60 (mm) Table 9a (Cont d) Unbound Materials Data EE-1.44
48 Section Layer Num Layer Type 1 Dry Thermal Heat Capacity Conductivity (BTU/hrft- o (BTU/lb- o F) F) Liquid Limit (LL) Plastic Limit (PL) Plasticity Index (PI) % Passing #200 Sieve % Passing #4 Sieve D 60 (mm) 5E+05 3 GB SS BR E+05 3 GB TS SS GB SS BR E+05 2 GB GS SS E+05 3 GB SS BR GB SS E+05 3 GB GS SS GB = Granular base; GS = Granular subbase; SS = Subgrade; BR = Bedrock EE-1.45
49 Table 9b Unbound Materials Data Section Optimum Moisture Content 2 (%) Optimum Moisture Content (%) MAX_DRY_UN IT_WT. (UG05) Est Max Dry Unit Weight for Level 3 Analysis Specific Gravity of Soilds Saturated Hydraulic Conductivity AASHTO CLASS USCS CLASS Est. Resilient Modulus (psi) E+00 A-1-a GW-GM E+00 A-1-b SM E-05 A-2-4 SC E+00 A-1-b SM E-05 A-2-4 SM E+00 A-2-4 GM E-05 A-2-4 SM E+00 A-1-a SP-SM E+00 A-1-a SP-SM E+00 A-1-a GW-GM E+00 A-1-a GW-GM E+00 A-1-a GP-GM E+00 A-1-b SW-SM E+00 A-1-a SP-SM E+00 A-2-4 SC E-05 A-1-a SP-SM E-05 A-1-b SM E+00 A-1-b SM E+00 SM E+00 SP-SM E+00 SC E-05 GW-GM E+00 A-1-b SW-SM E-05 A-1-b SW E-05 A-2-4 SC E-05 A-2-4 GC E-05 A-1-b GP-GC E-06 A-2-6 SC E+00 A-2-4 SM E+00 A-4 CL E-05 A-4 CL E+00 A-1-a GP-GM E+00 A-1-a GW-GM E-06 A-6 Cl E-06 A-6 CL E+00 A-1-a GP-GM E+00 A-1-a GP-GM E-07 A-6 CL E+00 A-1-a SP-SM E-01 A-2-4 SM E+00 A-1-b SP-SM E+00 A-1-b SP-SM E+00 A-1-b SM E+00 A-1-a SP-SM E+00 A-1-b SM E+00 A-1-a SP-SM E E+00 A-1-a SP-SM E-01 A-3 SP-SM E-02 A-3 SP E+00 A-1-b SM E-03 A-2-4 SM E-03 A-3 SP-SM E E+00 A-2-4 SM E-02 A-3 SP-SM E-03 A-3 SP E+00 A-1-b SP-SM E-01 A-3 SP E-02 A-3 SP EE-1.46
50 Table 9b (Cont d) Unbound Materials Data Section Optimum Moisture Content 2 (%) Optimum Moisture Content from DG MAX_DRY_U NIT_WT. (UG05) Est Max Dry Unit Weight for Level 3 Analysis Specific Gravity of Soilds Saturated Hydraulic Conductivity AASHTO CLASS USCS CLASS Est. Resilient Modulus (psi) E+00 A-1-b SP-SM E-01 A-2-4 SP-SM E-01 A-2-4 SM E-01 A-3 SP-SM E-02 A-4 SM E-01 A-2-4 SM E-02 A-3 SP E+00 A-1-b SM E-05 A-1-b SM E+00 A-1-a SP-SM E-06 A-6 CL E-01 A-3 SP E-03 A-3 SP-SM E+00 A-1-a GM E-03 A-4 ML E+00 A-1-a GP-GM E-05 A-1-a GW-GM E+00 A-1-a SP-SM E-04 A-4 ML E+00 A-1-a SW-SM E+00 A-1-a GP-GM E+00 A-1-a GP E+00 A-1-b GM E-05 A-2-4 SM E+00 A-1-a GW E+00 A-1-b SP-SM E+00 A-1-b SP-SM E+00 A-1-b SM E+00 A-1-a SP-SM E-01 A-3 SP E+00 A-1-a SP-SM E-01 A-3 SP E+00 A-1-b SW-SM E+00 A-3 SP-SM E-02 A-2-4 SM E+00 A-1-a SM E-05 A-6 CL E+00 A-1-a SP-SM E+00 A-1-a GW-GM E-05 A-2-6 GC E+00 A-1-a GP-GM E-06 A-6 CL E+00 A-1-a SP-SM E+00 A-1-b SW-SM E+00 A-1-a SP-SM E+00 A-1-b SW-SM E+00 A-1-b SW-SM E+00 A-1-b SW-SM E-01 A-3 SP-SM E-05 A-2-4 SW-SC E+00 A-1-b SP-SM E-05 A-1-a GP E-05 A-1-b GM E-01 A-1-b SP-SM E+00 A-6 CL E-06 A-1-a SW E+00 A-7-6 CH E-08 A-1-a SW E-08 A-7-6 CH 8000 EE-1.47
51 Table 9b (Cont d) Unbound Materials Data Section Optimum Moisture Content 2 (%) Optimum Moisture Content from DG MAX_DRY_U NIT_WT. (UG05) Est Max Dry Unit Weight for Level 3 Analysis Specific Gravity of Soilds Saturated Hydraulic Conductivity AASHTO CLASS USCS CLASS Est. Resilient Modulus (psi) E-08 A-7-6 CH e+00 A-7-6 CH E-07 A-1-a SW E+00 A-7-6 CH E-07 A-1-a SW E+00 A-1-a GP-GM E-05 A-2-4 SP E+00 A-1-b SP-SM E-05 A-2-4 SP-SM E-05 A-1-b SC E-02 A-3 SP E+00 A-1-a GP-GM E-03 A-4 ML E+00 A-2-4 GM E-05 A-2-6 SM E+00 A-1-a GP-GM E-06 A-7-6 ML E+00 A-1-b GM E-02 A-4 ML E+00 A-1-a GM E-05 A-1-a SW-SM E-05 A-4 SM E-07 A-7-6 CL E-06 A-4 CL E-02 A-2-4 SM E-05 A-1-a GP-GM E-05 A-4 CL-ML E+00 A-1-b SM E-03 A-2-4 SM E+00 A-1-b GM E-06 A-4 CL E-05 A-2-4 SM E-06 A-6 CL E+00 A-1-a GP-GM E-05 A-1-b GM E-05 A-2-4 SC E+00 A-1-a GP-GM E-04 A-4 ML E-07 A-4 ML E-05 A-1-a GP-GM E-05 A-5 ML E-07 A-7-6 CH E-01 A-2-4 SM E-02 A-3 SP E+00 A-1-a SM E-07 A-7-6 CH E+00 A-1-b GM E-06 A-7-6 CL E-07 A-7-6 CL E-05 A-6 SC E-06 A-6 CL E+00 A-1-b SM E-06 A-7-6 SC E-06 A-7-6 SC E-05 A-4 CL E-07 A-7-6 CH E+00 A-1-a GP E+00 A-1-a GW-GM Table 9b (Cont d) Unbound Materials Data EE-1.48
52 Section Optimum Moisture Content 2 (%) Optimum Moisture Content from DG MAX_DRY_UN IT_WT. (UG05) Est Max Dry Unit Weight for Level 3 Analysis Specific Gravity of Soilds Saturated Hydraulic Conductivity AASHTO CLASS USCS CLASS Est. Resilient Modulus (psi) E+00 A-1-a GP-GM E-01 A-2-4 SP-SM E-01 A-7-6 CH E+00 A-4 GM E+00 A-4 CL E+00 A-4 GM E-04 A-4 ML E-06 A-4 CL E+00 A-2-4 GM E+00 A-5 ML E+00 A-1-a GW e+-00 A-1-a GP-GM E-05 A-1-a GP-GM E+00 A-1-a GP-GM E-05 A-2-4 SM E+-00 A-1-a GP-GM E-02 A-2-4 SM E-05 A-2-4 SM E+00 A-1-b SP-SM E-02 A-2-4 SM GB = Granular base; GS = Granular subbase; SS = Subgrade; BR = Bedrock EE-1.49
53 Table 10 Permanent Deformation Data Section Survey Date LLH Mean Depth (in) RLH Mean Depth (in) Max Mean Depth (in) Average Rutting (in) /05/ /12/ /02/ /15/ /16/ /15/ /31/ /22/ /08/ /23/ /05/ /03/ /08/ /08/ /11/ /05/ /21/ /26/ /15/ /22/ /26/ /22/ /30/ /14/ /21/ /14/ /30/ /07/ /04/ /04/ /09/ /13/ /07/ /21/ /12/ /23/ /12/ /15/ /30/ /07/ /11/ /30/ /08/ /12/ /30/ /08/ /11/ Table 10 (Cont d) Permanent Deformation Data EE-1.50
54 Section Survey Date LLH Mean Depth (in) RLH Mean Depth (in) Max Mean Depth (in) Average Rutting (in) /30/ /08/ /12/ /20/ /05/ /20/ /16/ /30/ /02/ /25/ /18/ /03/ /26/ /04/ /22/ /09/ /08/ /04/ /13/ /11/ /15/ /15/ /22/ /15/ /26/ /20/ /25/ /21/ /08/ /20/ /25/ /22/ /19/ /07/ /06/ /14/ /08/ /21/ /13/ /08/ /10/ /21/ /14/ /20/ /05/ /26/ /25/ Table 10 (Cont d) Permanent Deformation Data EE-1.51
55 Section Survey Date LLH Mean Depth (in) RLH Mean Depth (in) Max Mean Depth (in) Average Rutting (in) /05/ /22/ /30/ /12/ /25/ /25/ /30/ /08/ /08/ /16/ /17/ /18/ /05/ /15/ /09/ /21/ /14/ /09/ /13/ /08/ /12/ /09/ /13/ /18/ /05/ /15/ /09/ /21/ /17/ /06/ /05/ /15/ /09/ /22/ /27/ /16/ /01/ /21/ /16/ /10/ /29/ /09/ /04/ /28/ /04/ /13/ Table 10 (Cont d) Permanent Deformation Data Section Survey Date LLH Mean Depth (in) RLH Mean Depth (in) Max Mean Depth (in) Average Rutting (in) EE-1.52
56 /20/ /04/ /27/ /04/ /10/ /13/ /24/ /25/ /23/ /04/ /10/ /13/ /24/ /25/ /23/ /08/ /04/ /28/ /07/ /17/ /02/ /04/ /25/ /17/ /09/ /23/ /20/ /19/ /26/ /21/ /21/ /28/ /12/ /05/ /29/ /17/ /02/ /04/ /17/ /09/ /24/ /02/ /10/ /08/ /23/ /26/ Table 10 (Cont d) Permanent Deformation Data Section Survey Date LLH Mean Depth (in) RLH Mean Depth (in) Max Mean Depth (in) Average Rutting (in) /04/ /06/ /23/ EE-1.53
57 /30/ /27/ /23/ /16/ /04/ /05/ /22/ /30/ /29/ /05/ /15/ /07/ /21/ /16/ /09/ /05/ /21/ /13/ /07/ /15/ /22/ /30/ /2/ /8/ /09/ /13/ /11/ /25/ /03/ /13/ /07/ /05/ /17/ /27/ /29/ /20/ /03/ /29/ /30/ /14/ /17/ /22/ /31/ /17/ Table 10 (Cont d) Permanent Deformation Data Section Survey Date LLH Mean Depth (in) RLH Mean Depth (in) Max Mean Depth (in) Average Rutting (in) /18/ /10/ /28/ /23/ /25/ EE-1.54
58 /11/ /01/ /29/ /22/ /23/ /14/ /25/ /05/ /09/ /13/ /11/ /15/ /28/ /05/ /12/ /05/ /24/ /03/ /29/ /05/ /12/ /06/ /24/ /26/ /04/ /05/ /12/ /05/ /24/ /03/ /23/ /05/ /12/ /06/ /24/ /04/ /30/ /01/ /19/ /01/ /19/ Table 10 (Cont d) Permanent Deformation Data Section Survey Date LLH Mean Depth (in) RLH Mean Depth (in) Max Mean Depth (in) Average Rutting (in) /01/ /19/ /01/ /19/ /02/ /22/ /02/ /22/ EE-1.55
59 /31/ /21/ /24/ /18/ /16/ /31/ /22/ /24/ /18/ /17/ /05/ /22/ /27/ /27/ /15/ /09/ /15/ /13/ /19/ /11/ /18/ /20/ /03/ /09/ /10/ /13/ /18/ /10/ /15/ /18/ /09/ /02/ /15/ /18/ /18/ /15/ /20/ /06/ /22/ Table 10 (Cont d) Permanent Deformation Data Section Survey Date LLH Mean Depth (in) RLH Mean Depth (in) Max Mean Depth (in) Average Rutting (in) /17/ /13/ /08/ /09/ /23/ /17/ /28/ /10/ /22/ /20/ EE-1.56
60 /11/ /18/ /27/ /07/ /01/ /21/ /19/ /26/ /11/ /05/ /24/ /27/ /11/ /01/ /06/ /26/ /30/ /10/ /11/ /11/ /17/ /20/ /19/ /18/ /14/ /18/ /23/ /23/ /05/ /25/ /13/ /12/ /10/ /26/ /04/ /21/ /10/ Table 10 (Cont d) Permanent Deformation Data Section Survey Date LLH Mean Depth (in) RLH Mean Depth (in) Max Mean Depth (in) Average Rutting (in) /12/ /16/ /11/ /12/ /12/ /04/ /18/ /07/ /30/ /27/ /03/ /17/ EE-1.57
61 /14/ /16/ /18/ /21/ /20/ /10/ /22/ /10/ /16/ /17/ /06/ /15/ /17/ /14/ /16/ /21/ /21/ /28/ /14/ /12/ /17/ /20/ /10/ /09/ /08/ /04/ /27/ /25/ /17/ /27/ /12/ /17/ /15/ /23/ /06/ Table 10 (Cont d) Permanent Deformation Data Section Survey Date LLH Mean Depth (in) RLH Mean Depth (in) Max Mean Depth (in) Average Rutting (in) /09/ /07/ /20/ /27/ /12/ /04/ /15/ /12/ /20/ /10/ /07/ /18/ /09/ /24/ EE-1.58
62 /15/ /11/ /20/ /17/ /17/ /02/ /02/ /28/ /28/ /04/ /04/ /16/ /16/ /17/ /09/ /05/ /22/ /08/ /31/ /27/ /26/ /22/ /13/ /03/ /09/ /16/ /19/ /19/ /16/ /17/ /08/ /11/ Table 10 (Cont d) Permanent Deformation Data Section Survey Date LLH Mean Depth (in) RLH Mean Depth (in) Max Mean Depth (in) Average Rutting (in) /24/ /19/ /10/ /24/ /07/ /30/ /29/ /28/ /03/ /24/ EE-1.59
63 Table 11 Alligator Cracking Data Section Survey Date Low Severity Cracking (ft 2 ) Medium Severity Cracking (ft 2 ) High Severity Cracking (ft 2 ) Total Alligator Cracking (ft 2 ) /20/ /02/ /24/ /15/ /15/ /16/ /15/ /19/ /31/ /29/ /22/ /23/ /05/ /03/ /30/ /08/ /11/ /05/ /31/ /21/ /26/ /15/ /22/ /26/ /24/ /30/ /22/ /25/ /14/ /21/ /14/ /21/ /30/ /17/ /08/ /07/ /03/ /10/ /14/ /08/ /13/ /20/ /11/ /22/ /16/ /13/ Table 11 (Cont d) Alligator Cracking Data EE-1.60
64 Section Survey Date Low Severity Cracking (ft 2 ) Medium Severity Cracking (ft 2 ) High Severity Cracking (ft 2 ) Total Alligator Cracking (ft 2 ) /15/ /30/ /17/ /07/ /06/ /02/ /09/ /13/ /07/ /21/ /12/ /23/ /12/ /13/ /15/ /30/ /07/ /11/ /12/ /17/ /30/ /08/ /12/ /13/ /15/ /30/ /07/ /11/ /12/ /17/ /30/ /08/ /12/ /13/ /20/ /02/ /16/ /03/ /26/ /29/ /28/ /17/ /22/ /09/ /08/ /04/ Table 11 (Cont d) Alligator Cracking Data EE-1.61
65 Section Survey Date Low Severity Cracking (ft 2 ) Medium Severity Cracking (ft 2 ) High Severity Cracking (ft 2 ) Total Alligator Cracking (ft 2 ) /13/ /15/ /22/ /15/ /26/ /21/ /15/ /08/ /19/ /07/ /13/ /04/ /06/ /12/ /13/ /08/ /10/ /21/ /14/ /20/ /31/ /05/ /22/ /30/ /12/ /25/ /08/ /08/ /11/ /17/ /02/ /18/ /09/ /16/ /18/ /09/ /16/ /18/ /09/ /15/ /19/ /09/ /17/ /15/ /09/ /17/ /21/ Table 11 (Cont d) Alligator Cracking Data EE-1.62
66 Section Survey Date Low Severity Cracking (ft 2 ) Medium Severity Cracking (ft 2 ) High Severity Cracking (ft 2 ) Total Alligator Cracking (ft 2 ) /15/ /04/ /08/ /16/ /12/ /04/ /08/ /18/ /05/ /18/ /09/ /17/ /13/ /06/ /05/ /18/ /11/ /09/ /22/ /31/ /27/ /16/ /03/ /21/ /30/ /16/ /10/ /29/ /20/ /04/ /24/ /04/ /10/ /09/ /24/ /27/ /25/ /26/ /23/ /04/ /10/ /09/ /24/ /27/ /25/ /26/ /23/ Table 11 (Cont d) Alligator Cracking Data EE-1.63
67 Section Survey Date Low Severity Cracking (ft 2 ) Medium Severity Cracking (ft 2 ) High Severity Cracking (ft 2 ) Total Alligator Cracking (ft 2 ) /17/ /02/ /30/ /25/ /17/ /09/ /23/ /20/ /19/ /08/ /16/ /05/ /25/ /10/ /21/ /24/ /13/ /17/ /12/ /05/ /29/ /13/ /17/ /02/ /30/ /24/ /17/ /09/ /24/ /25/ /02/ /10/ /26/ /08/ /14/ /23/ /26/ /13/ /04/ /06/ /23/ /30/ /27/ /23/ /16/ Table 11 (Cont d) Alligator Cracking Data EE-1.64
68 Section Survey Date Low Severity Cracking (ft 2 ) Medium Severity Cracking (ft 2 ) High Severity Cracking (ft 2 ) Total Alligator Cracking (ft 2 ) /04/ /05/ /22/ /30/ /29/ /05/ /15/ /31/ /19/ /07/ /21/ /16/ /27/ /01/ /07/ /09/ /12/ /05/ /05/ /13/ /21/ /24/ /22/ /30/ /02/ /14/ /26/ /08/ /08/ /25/ /11/ /05/ /25/ /03/ /04/ /16/ /05/ /26/ /29/ /17/ /01/ /27/ /20/ /03/ /29/ /06/ Table 11 (Cont d) Alligator Cracking Data EE-1.65
69 Section Survey Date Low Severity Cracking (ft 2 ) Medium Severity Cracking (ft 2 ) High Severity Cracking (ft 2 ) Total Alligator Cracking (ft 2 ) /18/ /14/ /17/ /31/ /17/ /18/ /10/ /28/ /23/ /12/ /25/ /11/ /01/ /23/ /23/ /05/ /14/ /25/ /05/ /09/ /06/ /24/ /26/ /04/ /05/ /24/ /03/ /23/ /05/ /12/ /06/ /24/ /04/ /30/ /05/ /12/ /06/ /24/ /04/ /31/ /01/ /19/ /08/ /01/ /19/ /08/ Table 11 (Cont d) Alligator Cracking Data EE-1.66
70 Section Survey Date Low Severity Cracking (ft 2 ) Medium Severity Cracking (ft 2 ) High Severity Cracking (ft 2 ) Total Alligator Cracking (ft 2 ) /01/ /19/ /08/ /01/ /19/ /08/ /02/ /22/ /08/ /02/ /22/ /08/ /31/ /26/ /24/ /15/ /18/ /29/ /16/ /09/ /31/ /26/ /24/ /15/ /18/ /30/ /17/ /05/ /22/ /27/ /27/ /16/ /26/ /15/ /25/ /27/ /25/ /28/ /09/ /15/ /02/ /03/ /09/ /10/ /10/ /10/ Table 11 (Cont d) Alligator Cracking Data EE-1.67
71 Section Survey Date Low Severity Cracking (ft 2 ) Medium Severity Cracking (ft 2 ) High Severity Cracking (ft 2 ) Total Alligator Cracking (ft 2 ) /15/ /18/ /02/ /18/ /15/ /20/ /06/ /17/ /13/ /15/ /06/ /08/ /03/ /09/ /14/ /18/ /23/ /17/ /14/ /05/ /10/ /02/ /22/ /20/ /11/ /23/ /17/ /14/ /05/ /10/ /13/ /02/ /18/ /20/ /22/ /08/ /23/ /11/ /20/ /03/ /29/ /27/ /01/ /01/ /21/ /19/ /26/ Table 11 (Cont d) Alligator Cracking Data EE-1.68
72 Section Survey Date Low Severity Cracking (ft 2 ) Medium Severity Cracking (ft 2 ) High Severity Cracking (ft 2 ) Total Alligator Cracking (ft 2 ) /18/ /24/ /09/ /27/ /26/ /11/ /23/ /01/ /06/ /13/ /26/ /04/ /30/ /25/ /10/ /11/ /17/ /17/ /06/ /20/ /24/ /08/ /19/ /12/ /14/ /10/ /26/ /23/ /31/ /11/ /23/ /15/ /20/ /14/ /22/ /10/ /30/ /05/ /25/ /07/ /12/ /20/ /24/ /10/ /20/ /22/ Table 11 (Cont d) Alligator Cracking Data EE-1.69
73 Section Survey Date Low Severity Cracking (ft 2 ) Medium Severity Cracking (ft 2 ) High Severity Cracking (ft 2 ) Total Alligator Cracking (ft 2 ) /11/ /25/ /15/ /02/ /16/ /26/ /04/ /21/ /29/ /12/ /14/ /16/ /12/ /05/ /11/ /12/ /25/ /19/ /26/ /04/ /18/ /16/ /07/ /25/ /30/ /27/ /11/ /03/ /19/ /15/ /27/ /17/ /14/ /10/ /26/ /18/ /31/ /21/ /21/ /12/ /22/ /20/ /10/ /22/ /28/ /16/ Table 11 (Cont d) Alligator Cracking Data EE-1.70
74 Section Survey Date Low Severity Cracking (ft 2 ) Medium Severity Cracking (ft 2 ) High Severity Cracking (ft 2 ) Total Alligator Cracking (ft 2 ) /13/ /17/ /17/ /25/ /07/ /02/ /06/ /26/ /06/ /11/ /15/ /17/ /14/ /09/ /29/ /16/ /16/ /21/ /29/ /21/ /22/ /28/ /10/ /27/ /26/ /17/ /05/ /20/ /16/ /09/ /02/ /10/ /09/ /08/ /25/ /17/ /27/ /17/ /15/ /23/ /09/ /29/ /23/ /08/ /27/ ######## Table 11 (Cont d) Alligator Cracking Data EE-1.71
75 Section Survey Date Low Severity Cracking (ft 2 ) Medium Severity Cracking (ft 2 ) High Severity Cracking (ft 2 ) Total Alligator Cracking (ft 2 ) /4/ /14/ /25/ /10/ /12/ /20/ /11/ /10/ /07/ /18/ /09/ /24/ /15/ /11/ /20/ /04/ /28/ /16/ /21/ /13/ /03/ /12/ /05/ /09/ /16/ /19/ /19/ /16/ /17/ /08/ /11/ /24/ /19/ /10/ /24/ /07/ /30/ EE-1.72
76 Table 12 Longitudinal Cracking Data Section Survey Date Low Severity Cracking (ft) Medium Severity Cracking (ft) High Severity Cracking (ft) Total Longitudinal Cracking (ft) /20/ /02/ /24/ /15/ /19/ /29/ /22/ /22/ /08/ /23/ /05/ /03/ /30/ /08/ /11/ /05/ /31/ /21/ /26/ /15/ /22/ /26/ /24/ /30/ /22/ /25/ /14/ /21/ /14/ /21/ /30/ /17/ /08/ /07/ /03/ /10/ /14/ /08/ /13/ /20/ /11/ /22/ /16/ /13/ /15/ /30/ Table 12 (Cont d) Longitudinal Cracking Data EE-1.73
77 Section Survey Date Low Severity Cracking (ft) Medium Severity Cracking (ft) High Severity Cracking (ft) Total Longitudinal Cracking (ft) /17/ /07/ /06/ /02/ /09/ /13/ /07/ /21/ /12/ /23/ /12/ /13/ /15/ /30/ /07/ /11/ /12/ /17/ /30/ /08/ /12/ /13/ /15/ /30/ /07/ /11/ /12/ /17/ /30/ /08/ /12/ /13/ /20/ /02/ /16/ /29/ /28/ /17/ /22/ /09/ /08/ /04/ /13/ /15/ /22/ /15/ /26/ Table 12 (Cont d) Longitudinal Cracking Data EE-1.74
78 Section Survey Date Low Severity Cracking (ft) Medium Severity Cracking (ft) High Severity Cracking (ft) Total Longitudinal Cracking (ft) /21/ /15/ /08/ /13/ /04/ /06/ /12/ /13/ /08/ /10/ /21/ /14/ /20/ /22/ /30/ /12/ /25/ /25/ /08/ /08/ /11/ /17/ /02/ /18/ /09/ /16/ /18/ /09/ /16/ /18/ /09/ /15/ /19/ /09/ /17/ /15/ /09/ /17/ /21/ /12/ /04/ /08/ /18/ /09/ /17/ /13/ Table 12 (Cont d) Longitudinal Cracking Data EE-1.75
79 Section Survey Date Low Severity Cracking (ft) Medium Severity Cracking (ft) High Severity Cracking (ft) Total Longitudinal Cracking (ft) /06/ /05/ /18/ /11/ /09/ /22/ /31/ /27/ /16/ /03/ /21/ /30/ /16/ /10/ /29/ /12/ /13/ /12/ /4/ /24/ /2/ /13/ /25/ /20/ /04/ /24/ /04/ /10/ /09/ /24/ /27/ /25/ /26/ /23/ /04/ /10/ /09/ /24/ /27/ /25/ /26/ /23/ /17/ /02/ /30/ /25/ Table 12 (Cont d) Longitudinal Cracking Data EE-1.76
80 Section Survey Date Low Severity Cracking (ft) Medium Severity Cracking (ft) High Severity Cracking (ft) Total Longitudinal Cracking (ft) /17/ /09/ /23/ /08/ /16/ /05/ /25/ /10/ /24/ /13/ /17/ /12/ /05/ /29/ /13/ /30/ /24/ /09/ /24/ /25/ /02/ /10/ /26/ /08/ /14/ /23/ /26/ /13/ /04/ /06/ /23/ /30/ /27/ /23/ /16/ /04/ /05/ /22/ /30/ /29/ /05/ /15/ /31/ /19/ /07/ /21/ Table 12 (Cont d) Longitudinal Cracking Data EE-1.77
81 Section Survey Date Low Severity Cracking (ft) Medium Severity Cracking (ft) High Severity Cracking (ft) Total Longitudinal Cracking (ft) /16/ /27/ /01/ /07/ /09/ /12/ /05/ /05/ /13/ /21/ /24/ /02/ /14/ /26/ /08/ /08/ /25/ /11/ /05/ /25/ /03/ /04/ /16/ /05/ /26/ /29/ /17/ /01/ /27/ /20/ /06/ /18/ /14/ /17/ /31/ /17/ /18/ /10/ /28/ /23/ /12/ /25/ /11/ /01/ /23/ Table 12 (Cont d) Longitudinal Cracking Data EE-1.78
82 Section Survey Date Low Severity Cracking (ft) Medium Severity Cracking (ft) High Severity Cracking (ft) Total Longitudinal Cracking (ft) /23/ /05/ /14/ /25/ /05/ /09/ /06/ /24/ /26/ /04/ /05/ /24/ /03/ /23/ /05/ /12/ /06/ /24/ /04/ /30/ /01/ /19/ /08/ /01/ /19/ /08/ /01/ /19/ /08/ /01/ /19/ /08/ /02/ /22/ /08/ /02/ /22/ /08/ /31/ /26/ /24/ /15/ /18/ /29/ /16/ /09/ Table 12 (Cont d) Longitudinal Cracking Data EE-1.79
83 Section Survey Date Low Severity Cracking (ft) Medium Severity Cracking (ft) High Severity Cracking (ft) Total Longitudinal Cracking (ft) /31/ /26/ /24/ /15/ /18/ /30/ /17/ /27/ /27/ /16/ /26/ /15/ /25/ /27/ /25/ /28/ /09/ /15/ /02/ /10/ /10/ /15/ /18/ /02/ /15/ /20/ /06/ /17/ /13/ /15/ /06/ /08/ /03/ /09/ /14/ /18/ /14/ /05/ /10/ /02/ /22/ /20/ /11/ /14/ /05/ /10/ Table 12 (Cont d) Longitudinal Cracking Data EE-1.80
84 Section Survey Date Low Severity Cracking (ft) Medium Severity Cracking (ft) High Severity Cracking (ft) Total Longitudinal Cracking (ft) /13/ /02/ /18/ /20/ /22/ /08/ /23/ /11/ /20/ /03/ /01/ /01/ /21/ /19/ /26/ /18/ /24/ /09/ /27/ /26/ /11/ /17/ /17/ /06/ /20/ /24/ /08/ /19/ /12/ /18/ /14/ /10/ /26/ /23/ /31/ /11/ /23/ /15/ /20/ /14/ /22/ /10/ /30/ /05/ /07/ /12/ Table 12 (Cont d) Longitudinal Cracking Data EE-1.81
85 Section Survey Date Low Severity Cracking (ft) Medium Severity Cracking (ft) High Severity Cracking (ft) Total Longitudinal Cracking (ft) /20/ /24/ /10/ /20/ /22/ /11/ /25/ /15/ /02/ /16/ /26/ /29/ /12/ /14/ /16/ /12/ /05/ /11/ /12/ /25/ /19/ /16/ /25/ /27/ /11/ /03/ /19/ /15/ /27/ /10/ /26/ /18/ /31/ /21/ /21/ /12/ /22/ /20/ /10/ /22/ /28/ /16/ /13/ /17/ /17/ Table 12 (Cont d) Longitudinal Cracking Data EE-1.82
86 Section Survey Date Low Severity Cracking (ft) Medium Severity Cracking (ft) High Severity Cracking (ft) Total Longitudinal Cracking (ft) /25/ /07/ /02/ /06/ /26/ /06/ /11/ /15/ /09/ /29/ /16/ /16/ /21/ /29/ /21/ /22/ /28/ /10/ /27/ /26/ /17/ /05/ /20/ /16/ /09/ /02/ /10/ /25/ /17/ /27/ /17/ /15/ /23/ /09/ /29/ /23/ /08/ /27/ /12/ /04/ /14/ /25/ /10/ /12/ /20/ /11/ Table 12 (Cont d) Longitudinal Cracking Data EE-1.83
87 Section Survey Date Low Severity Cracking (ft) Medium Severity Cracking (ft) High Severity Cracking (ft) Total Longitudinal Cracking (ft) /10/ /07/ /18/ /09/ /24/ /20/ /04/ /28/ /16/ /13/ /12/ /05/ /09/ /16/ /19/ /19/ /16/ /17/ /08/ /11/ /24/ /19/ /10/ /24/ /07/ /30/ EE-1.84
88 Table 13 Thermal Cracking Data Section Survey Date Low Severity Transverse Cracking (ft) Medium Severity Transverse Cracking (ft) High Severity Transverse Cracking (ft) Weighted Average (ft) /20/ /24/ /15/ /19/ /29/ /22/ /23/ /31/ /21/ /26/ /15/ /22/ /26/ /24/ /30/ /22/ /25/ /14/ /21/ /14/ /21/ /17/ /08/ /07/ /03/ /10/ /14/ /08/ /13/ /20/ /11/ /22/ /16/ /13/ /15/ /17/ /07/ /06/ /02/ /09/ /13/ /07/ /21/ /12/ /23/ /12/ /13/ Table 13 (Cont d) Thermal Cracking Data EE-1.85
89 Section Survey Date Low Severity Transverse Cracking (ft) Medium Severity Transverse Cracking (ft) High Severity Transverse Cracking (ft) Weighted Average (ft) /15/ /07/ /11/ /12/ /17/ /08/ /12/ /13/ /15/ /07/ /11/ /12/ /17/ /08/ /12/ /13/ /20/ /16/ /24/ /17/ /22/ /09/ /08/ /04/ /13/ /15/ /15/ /22/ /15/ /26/ /26/ /21/ /08/ /22/ /13/ /06/ /14/ /12/ /13/ /08/ /21/ /14/ /07/ /20/ /05/ /26/ /24/ Table 13 (Cont d) Thermal Cracking Data EE-1.86
90 Section Survey Date Low Severity Transverse Cracking (ft) Medium Severity Transverse Cracking (ft) High Severity Transverse Cracking (ft) Weighted Average (ft) /12/ /25/ /25/ /08/ /08/ /11/ /17/ /02/ /18/ /16/ /18/ /16/ /18/ /15/ /19/ /17/ /17/ /15/ /04/ /08/ /16/ /04/ /08/ /18/ /17/ /13/ /18/ /11/ /31/ /03/ /30/ /12/ /12/ /13/ /12/ /24/ /02/ /25/ /24/ /09/ /27/ /26/ /23/ /09/ /27/ /26/ /23/ Table 13 (Cont d) Thermal Cracking Data EE-1.87
91 Section Survey Date Low Severity Transverse Cracking (ft) Medium Severity Transverse Cracking (ft) High Severity Transverse Cracking (ft) Weighted Average (ft) /24/ /24/ /08/ /25/ /09/ /23/ /08/ /25/ /10/ /24/ /13/ /12/ /29/ /13/ /24/ /09/ /24/ /25/ /14/ /26/ /13/ /23/ /16/ /05/ /15/ /19/ /16/ /01/ /07/ /12/ /25/ /07/ /24/ /14/ /26/ /08/ /08/ /06/ /05/ /03/ /17/ /16/ /26/ /29/ /01/ /20/ Table 13 (Cont d) Thermal Cracking Data Section Survey Date Low Severity Transverse Cracking (ft) Medium Severity Transverse Cracking (ft) High Severity Transverse Cracking (ft) Weighted Average (ft) EE-1.88
92 /06/ /14/ /17/ /31/ /17/ /18/ /28/ /23/ /12/ /25/ /11/ /01/ /23/ /14/ /05/ /09/ /13/ /11/ /29/ /26/ /23/ /30/ /01/ /19/ /01/ /19/ /01/ /19/ /01/ /19/ /02/ /22/ /02/ /22/ /26/ /15/ /29/ /16/ /26/ /15/ /30/ /17/ /27/ /16/ /26/ /25/ /27/ Table 13 (Cont d) Thermal Cracking Data Section Survey Date Low Severity Transverse Cracking (ft) Medium Severity Transverse Cracking (ft) High Severity Transverse Cracking (ft) Weighted Average (ft) /25/ /28/ EE-1.89
93 /09/ /15/ /02/ /17/ /18/ /20/ /10/ /15/ /18/ /02/ /30/ /20/ /22/ /15/ /06/ /03/ /14/ /18/ /14/ /05/ /02/ /20/ /11/ /14/ /05/ /13/ /02/ /18/ /20/ /08/ /23/ /11/ /20/ /01/ /21/ /26/ /18/ /09/ /26/ /11/ /23/ /13/ /04/ /25/ Table 13 (Cont d) Thermal Cracking Data Section Survey Date Low Severity Transverse Cracking (ft) Medium Severity Transverse Cracking (ft) High Severity Transverse Cracking (ft) Weighted Average (ft) /17/ /06/ /24/ /08/ /19/ EE-1.90
94 /12/ /10/ /26/ /31/ /11/ /15/ /20/ /14/ /22/ /10/ /30/ /05/ /07/ /20/ /24/ /20/ /22/ /11/ /25/ /15/ /02/ /16/ /26/ /29/ /14/ /12/ /05/ /24/ /31/ /25/ /19/ /16/ /25/ /11/ /19/ /15/ /27/ /10/ /26/ /31/ /21/ /12/ Table 13 (Cont d) Thermal Cracking Data Section Survey Date Low Severity Transverse Cracking (ft) Medium Severity Transverse Cracking (ft) High Severity Transverse Cracking (ft) Weighted Average (ft) /22/ /20/ /28/ /13/ /17/ /11/ /25/ EE-1.91
95 /07/ /06/ /06/ /11/ /15/ /09/ /29/ /16/ /29/ /22/ /28/ /10/ /27/ /26/ /05/ /16/ /09/ /02/ /10/ /12/ /25/ /17/ /27/ /17/ /15/ /23/ /09/ /29/ /23/ /08/ /04/ /14/ /10/ /11/ /07/ /18/ /24/ /21/ /16/ Table 13 (Cont d) Thermal Cracking Data Section Survey Date Low Severity Transverse Cracking (ft) Medium Severity Transverse Cracking (ft) High Severity Transverse Cracking (ft) Weighted Average (ft) /05/ /22/ /31/ /27/ /13/ /12/ /09/ /16/ /19/ /19/ EE-1.92
96 /16/ /17/ /08/ /24/ /19/ /10/ /24/ /07/ /30/ /01/ EE-1.93
97 Section ID Rutting Alligator Cracking Table 14 Summary of Distress Data Available Longitudinal Cracking Thermal cracking X X X X X X X X X X X X X X EE-1.94
98 Table 14 (Cont d) Summary of Distress Data Available Section ID Rutting Alligator Cracking Longitudinal Cracking X X X X X X X X X X X X X X X Thermal cracking EE-1.95
99 ANNEX- B Groundwater Table Depth Information Provided by Harold Von Quintus as part of the Report Calibration and Validation of the Fatigue Cracking and Rutting Prediction Models for the 2002 Design Guide Submitted on March 20, 2001 EE-1.96
100 Table B-1. Summary of Subgrade Soil Profile and Depth to a Rigid Layer and Water Table for The LTPP Test Sections Used for the Calibration of HMA Pavements with Unbound Aggregate Base or Rubblized PCC Layers. State SHRP ID Alabama SPS A County Roadwa y Lee US 280 Silty & sandy clay Summary of Boring Log Depth to Water Table Depth to Rigid Layer Strata or Depth, Material inches From Boring Log, in. Soil Reports & Maps Sugges ted Value From Boring Log, in. Cal. from Deflectio n Basins Soil Reports & Maps >240 Deep >240 >240 NA >120, Weathered bedrock Sugg este d Valu e Alaska 1001 Kenai Peninsula SH 1 Poorly Graded 0-42 Gravel Silty Gravel >240 NA >240 >240 Infinite NA Infini te Arizona SPS-1 Mohave US 93 Silty, clayey sand & gravel Silty, sand, gravel cobbles Silty sand, gravel and boulders >240 Deep >240 > , Thick cemented pan soils 600 Arizona 1024 Yavapai I 40 Crushed 0-12 Gravel Clay with Sand Silty Sand >240 Deep >240 >240 Infinite 24-60; Lime hardpan, Sandstone Infini te Arkansa s SPS-1 Craighea d US 63 Sand & gravel 0-12 Silty sand to sandy clay Sandy clay Silty sand & sand > , Apparent Jan-April >240 NA Deep EE-1.97
101 Colorad o 1053 Delta US 50 Crushed 0-12 Gravel Soil Aggregate Clay 30+ Localized, subject to build up of water table >240 Infinite 18-40; Shale- Severely Weathered rock Infini te Connect icut 1803 New London SH 117 Silt with 0-48 Gravel Large Rock 48+ Deep > Infinite >24-72, Unweath. Schist, Hard Infini te Delawar e SPS-1 Sussex US 113 Silty sand 0-24 Clayey sand Silty sand, wet Sand, water NA Florida SPS-1 Palm Beach US 27 Limerock fill, wet , Apparent June-Feb 36 NA 20-60, Hard layer Florida 3997 Clay US 17 Clayey Sand 0-12 Sand Silty Sand , Apparent; Dec-April 120 NA Florida 4106 Palm Beach I 95 Sand 0-30 Sand, Moist , Apparent June-Feb 36 NA , Weakly cemented sand 236 Georgia 1031 Dawson SH 247C Silty Sand w/clay Sand w/stiff Seams Deep >240 NA 600 Deep 600 Idaho 1009 Cassia I 84 Silty Sand >240 Deep; Seepage >30, June-Sept >240 >240 Infinite >60; Cemented hardpan Infini te Idaho 1020 Jerome US 93 Silty Sand 0-60 Sandy Clay Silty sand Rock 120+ NA 66 & 120 Infinite NA 120 Idaho 1021 Jefferson US 20 Poorly graded ; 48 NA Infinite >60; Infini EE-1.98
102 gravel Apparent, July-Sept Localized Hardpan te Idaho 9034 Bonner US 95 Dense silty sand Very dense silty sand w/large rocks Perched, Feb-May NA Infinite >80 Infini te Iowa SPS-1 Lee US 61 NA 12-48, Perched, April-July NA >100 Kansas SPS-1 Kiowa US 54 Clay w/sand - clayey sand Sand Sandy clay Sandy clay - clay >240 Deep >240 >240 NA Deep, lime layers Louisian a SPS-1 Calcasieu US 171 Clayey silt 0-36 Silty clay Water 156 Silty caly , Perched Dec-April 148 >240 NA Deep Michiga n SPS-1 Clinton US 27 Fill 0-84 Sand-clay fill Sandy clay, Silt w/rock, sand/gravel, wet 156 Highly variable 156 >240 NA Deep Minneso ta 1018 Morrison US 10 Sand w/gravel 0-6 Sand, moist 6-15 Silty, clayey sand Water bearing , Apparent Oct.-May Deep 100 Montana SPS-1 Cascade IH 15 Sandy silt, silty sand & gravel Sand, sandy silt, silty clay Deep 204 >240 NA 20-40, Rippable, Indurated sandstone large rocks EE-1.99
103 Silt, sand, silty clay, wet Silt, silty sand Montana 8129 Golden Valley US 12 Soil-Aggr Mixture Sandy Clay Silty Sand NA Infinite NA Infini te Nebrask a SPS-1 Thayer US 81 NA Very Deep > Large amount of lime 600 Nevada SPS-1 Lander IH 80 Soil-aggr. Fill 0-36 Sandy, silty clay w/sand & gravel Clayey sand Sandy silt, slightly cemented 180 >60, Seasonal 180 >240 NA >40, Strongly cemented horizons New Mexico SPS-1 Dona Ana IH 25 Silty clay, sand, silt, damp Sandy silt, silty sand Sand, silty sand Sand, sandy silt, damp >240 Deep >240 NA >60, Calcareous New Mexico 1112 Lea US 62 Sand w/clay 0-78 Limestone Seams Clayey Silt to Sandy clay Limestone 192+ Gravel Deep >240 Infinite 12-24, Indurated caliche Infini te North Carolina 1006 Wake I 40 Sandy Silt w/gravel >240 >24, Seasonal 240 > EE-1.100
104 North Carolina 1024 Jackson SH 107 Sandy Silt 0-60 w/mica Rock 60+ Deep > Infinite, Highly variable deflectio n Bedrock varies greatly Infini te North Carolina 1802 Granville 1195 Clayey Silt Sandy Silt >240 Deep >240 >240 Infinite, Highly variable deflectio n Deep Infini te North Carolina 1992 Chatham US 421 Silt w/clay 0-96 Sandy Silt Silty sand >240 NA >240 >240 Infinite, Abrupt change in deflectio n NA Infini te Ohio SPS-1 Delaware US 23 Clay w/stone fragments Clay w/stone fragments 25 ft , Seasonal >240 >240 NA >60, Shale, sandstone Blocky structure Oklaho ma SPS-1 Comanch e US 62 Sand, siltyclayey sand Sandy clay, clay Silty/sandy clay to sand, varies >240 Deep >240 >240 NA Deep granite, 60-90, beds of gravel Pennsyl vania 1599 Elk SH 120 Silty clay Clayey silt Rock 90+ > , Perched, Nov.-Mar & > >72, Sandstone over shale 300 Tenness ee 3104 Union SH 370 Crushed stone 0-6 Clay 6-84 Rock 84+ NA > & , Highly variable deflectio n NA 300 EE-1.101
105 Texas SPS-1 Hidalgo US 281 Silty to cemented sand w/clay Sandy clay, variable Silty, cemented sand w/clay >240 Deep >240 >240 NA Deep loamy cal. deposits Texas 0001 Travis Loop 1 Clay w/gravel 0-36 Boulders & 36+ limestone Seasonal during wet weather Hard limestone 300 Texas 1060 Refugio US 77 Clay 0-6 Sandy clay 6-30 Clay Clay, wet Texas 1076 Terry US 62 Silty sand >240 Infinite, Consist. Change in deflectio n Infini te Texas 1077 Hall US 287 Silty sand Sand Sandy clay 180+ Deep >240 Infinite Deep Infini te Texas 1113 Rusk US 259 Sandy clay 0-24 Sandy clay, moist Sandy clay, 138+ moist 36-54, Perched, Dec.-April 84 Deep soft shale Texas 1116 Rusk US 259 Clay 0-18 Sandy clay Sandy clay, 48+ moist 36-54, Perched, Dec.-April 84 Deep soft shale Texas 1169 Rusk US 322 Clayey sand 0-12 Sandy clay Sand Clayey sand Perched, Jan.-April 96 > >72 Soft shale, sandstone 240 EE-1.102
106 Texas 1174 Nueces SH 44 Crushed stone 0-10 Clay, moist Sandy clay >240 Infinite, Consist. Change in deflectio n Infini te Texas 1178 Burleson SH 21 Crushed stone 0-12 Clay Clay, moist 108+ > Texas 3729 Cameron US 83 Clay Clayey sand Seasonal, Localized >240 > Weakly cemented calcium carbonate 600 Texas 3749 Duval US 59 Texas 3769 El Paso US 62 Gravel-soil 0-12 mixture Silty clay, moist Silt w/gravel Calichie Silty sand, dry 180+ Silty-sandy 0-90 gravel & sand Sandy clay Clay >240 Infinite Infini te Deep , cemented, Indurated caliche Texas 9005 Bexar 1560 Clay, moist w/gravel Limestone 168+ pieces Gravel w/clay 216+ >240 Deep >240 > , Abrupt change in deflectio n >48, hard limestone 300 Vermont 1002 Addison US 7 Gravelly silt Silty clay > , Seasonal >240 >240 Infinite >60, Hard layers Infini te Vermont 1004 Grand Isle US 2 Soil-aggr mixture Sandy clay >240 NA > NA 600 EE-1.103
107 Silty clay Virginia SPS-1 Pittsylvan ia SH 29 Sand, clay w/silt, varies Sandy clay, Clay, rocks, sandy silt, varies Silt w/gravel & stone >240 Deep >240 >240 NA >78, Hard rock fragments Virginia 1002 Floyd SH 8 HMA 0-5 Aggr. base 5-12 Rock NA > Infinite, Consist. Change in deflectio n NA Infini te Virginia 1023 Prince George I 95 Clayey sand Sandy silt, wet , Perched, Jan.-Mar. 120 > > Virginia 1464 York I 64 NA NA > , Consist. Change in deflectio n NA 300 Wiscons in SPS-1 Marathon SH 29 NA Deep, 36-60, localized areas with seasonal >240 NA Deep Wyomin g 1007 Park US 20 Soil-Aggr mixture Silty sand Siltstone >240 NA 132 Infinite NA Infini te EE-1.104
108 Table B-2. Summary of Subgrade Soil Profile and Depth to a Rigid Layer and Water Table for The LTPP Test Sections Used for the Calibration of Deep Strength or Full Depth HMA Pavements. Note: All of the SPS-1 projects and test sections are included in the previous table (Table B-1). State SHRP ID County Roadway Alabama 1019 Washington US 43 Alabama 4073 Jackson US 72 Summary of Boring Log Strata or Depth, Material inches Sand Gravel Sand Clayey sand Silty clay, 144+ wet Crushed 0-6 stone Sandy clay Silty clay Clay 132- w/fractured 180+ limestone Depth to Water Table From Boring Log, in. Soil Reports & Maps Suggested Value Depth to Rigid Layer From Boring Log, in. Calculated from Deflection Basins Soil Reports & Maps Sugg ested Value 144 NA NA 252 NA Infinite NA Infinit e Colorado 2008 Bent US 50 Clay >240 <40; Seasonal 240 >240 Infinite; Consist. Change in deflection None; Blocky w/ lime spots; strongly calcareous Infinit e Georgia 4119 Barrow I 401 Clayey 0-6 sand Clayey silt 6-48 Silty clay Silty clay, 180+ moist Very deep >240 Infinite Moderate depth to saprolite 200 Infinit e Oklahoma 4163 Blaine US 270 Sandy clay 0-96 Clayey sand 204 >36, Seepage 204 >240 Infinite Deep, Sandstone Infinit e EE-1.105
109 Sandy clay Oklahoma 4164 NA NA Oklahoma 4165 Major US 60 Clayey 0-12 sand Sandy clay Clayey sand Silty sand Deep 180 Infinite Deep, Shale, siltstone, gypsum Infinit e Texas 1109 Walker SH 19 Clay 0-6 Sandy clay, moist Clay, dry ; Perched, Oct.-May >240 >240 Infinite, Highly variable deflection 36-80; Soft sandstone, siltstone Infinit e Texas 3559 Walker SH 30 Clayey 0-48 sand Sandy clay Clayey 90- sand ; Perched, Oct.-May >240 Infinite Deep Infinit e Virginia 2021 Carroll US 58 Silt Rock 42+ >240 >48; Seasonal 42 & , Consist. Change in deflection >82; Weathered Mica, Schist 200 Prince Edward Island Prince Edward SH 2 NA A NA NA EE-1.106
110 Table B-3. Summary of Subgrade Soil Profile and Depth to a Rigid Layer and Water Table for The LTPP Test Sections Used for the Calibration of HMA Pavements with Cement Treated Layers. State SHRP ID County Roadway Arkansas 2042 Ashley US 82 Louisiana 3056 Rapides I 49 New Jersey 1638 Gloucester SH 55 Summary of Boring Log Depth to Water Table, inches Depth to Rigid Layer, inches Strata or Depth, Suggested Material inches Value Clayey sand 0-12 Silty clay Clayey silt Silty clay Sandy clay Sand 228+ Sandy clay 0-42 Watered sand Clay Sandy clay 192+ From Boring Log Soil Reports & Maps ; Seasonal, Dec-April , perched water table, Dec-April From Boring Log Calculated from Deflection Basins 24 >240 94, Highly variable deflection Soil Reports & Maps Sugge sted Value > Fragipan >240 NA NA 600 NA North Carolina North Carolina 1645 Columbus US 76 Silty sand > , Apparent, Dec-April 2824 Chatham US 421 Oklahoma 4154 Grady US 81 Texas 2176 Hale SH 445 Silty clay 0-54 Clayey silt 54+ w/rock strands Sandy clay 0-30 Clayey sand, moist Sandy clay, wet 84+ Sandy clay Silty clay Clayey sand Sand Sandy clay > Deep 600 NA > Infinite, Consist. Change in deflection NA Infinite 84 Deep Deep, 600 Areas w/hard layer but rippable >40 >240 Deep >240 > , Deep 600 Highly variable deflection EE-1.107
111 Texas 3669 Angelina SH 94 Sandy clay ; Clayey sand Perched, Jan.-April Texas 3679 Angelina SH 103 Clayey sand 0-60 Silty clay, moist Sand, dry 216+ > ; Apparent, Nov.-Feb. 84 > , Abrupt change in deflection >240 > , Highly variable deflection 40-60; 600 Soft siltstone, shale > Virginia 2004 Pittsylvania SH 265 NA Deep > , Highly variable deflection >78, Hard rock fragments 600 Wyoming 2015 Laramie I 25 CTB ; > , >84; 300 Silty sand Apparent, Abrupt Soft Sandstone 84+ Apr.-Nov. change in deflection sandstone Wyoming 2017 Campbell SH 387 CTB 0-18 NA Infinite, NA Infinite Clay 18+ Highly variable deflection Wyoming 2020 Sheridan I 90 Sandy-Silty clay 0-60 NA NA 600 Clayey silt Siltstone 132+ Wyoming 2037 Sweetwater SH 789 CTB ; > Infinite 20-40; Infinite Silty sand Perched, Soft shale Clay June- Claystone/Shale 120+ Aug. Wyoming 7773 Natrona SH 487 CTB 0-18 Clay Silty Sand w/gravel Silt w/sand Silty sand 204+ >240 Deep >240 >240 Infinite Deep Infinite EE-1.108
112 ANNEX- C GWT Depth and Depth to Bedrock Data Gathered from US Geological Survey, State DOTs, and LTPP Boring Logs
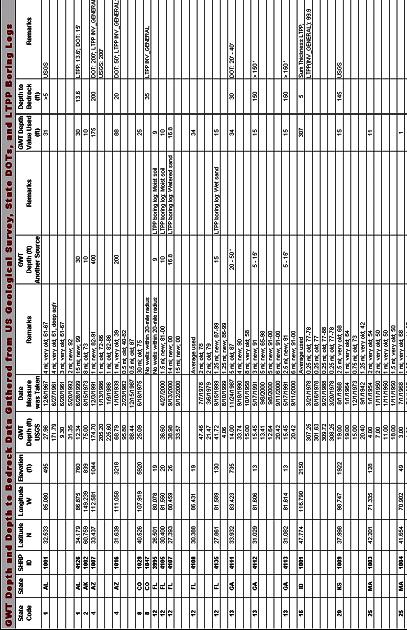
113 110
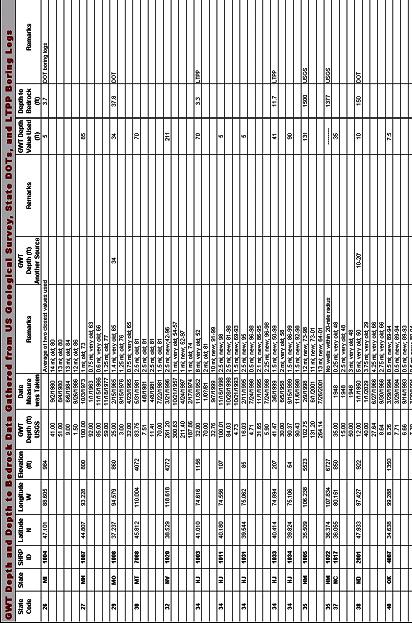
114 111

115 112
116 Depth to Bedrock Information for New Calibration Sections Provided by the US Geological Survey (USGS) Alabama Lee County Using the Smiths Ala.-Ga. 7.5-minute USGS topographic map the point you identified plots in the SE1/4 sec. 24, T. 18 N., R. 29 E. approximately 1 mi. SE of Smiths at an elevation of ~500 ft. The geology of this area as shown on Geological Survey of Alabama Special Map 220 "Geologic Map of Alabama," is Tuscaloosa Group undifferentiated (sand, gravel, clay of the Gulf Coastal Plain) which overlies the Phenix City Gneiss (high-grade metamorphic and igneous rocks) of the Uchee Complex, Southern Piedmont. The depth to bedrock is dependent on site-specific characteristics of the topography, rock types, soils, drainage, etc. The USDA "Soil Survey of Lee County," (1981) identifies the soil associations in this area as Marvyn loamy sand, 1 to 6 percent slopes and Uchee loamy sand, 6 to 10 percent slopes with a depth to bedrock greater than 60 in Alaska - Kenai Peninsula Regarding the type and depth of bedrock at 60 deg, 45'32", 149 deg, 14'21", which is located on the Kenai Peninsula S of the village of Hope. The only type of bedrock in this area is the late Cretaceous Valdez Group. This unit consists of slate and greywacke. As far as depth to bedrock at this particular location, I did not pull out a lat-long grid and figure out the precise location. There are various glacial and fluvial deposits that overlie bedrock in this region. They are generally not more than few hundred feet thick in this region. To answer the question more precisely, one would need to hire a Geotechnical engineer to go to the exact location and conduct an investigation Arizona Maricopa County Working with 1:250,000 depth to bedrock maps for the Phoenix and Nogales quadrangles and an engineer's ruler to calculate latitude and longitude, I've arrived at the following: Maricopa N, W This comes in just south of the White Tank Mountains. I calculated it to be between the 400 ft. contour and bedrock, probably around 200 ft. However, the 1:1,000,000 Arizona geologic map shows the road running over granitoid rock (Middle Proterozoic; 1400 Ma). We can probably say that the bedrock is granitoid, but the depth to it can run from 400 ft. to 0 ft. depending on the slop in mapping due to scale and the slop in my measuring the latitude and longitude of the spot. Depth to bedrock calculations come from Oppenheimer, J.M. and Sumner, J.S., 1980, Depth to bedrock mas (Phoenix and Nogales quadrangles) - unpublished bluelines, probably used to make the 1:1,000,000 depth to bedrock map for Arizona Arizona Santa Cruz County Santa Cruz N, W My measurement came out less than a mile west of the highway where I calculated the depth to be around 2000 ft. If the site is on the highway you are probably closer to 3000 ft in depth. Both sites are between the 1600 ft. and the 3200 ft contour, which are about 2 miles apart at that point. The Quaternary material at the site seems to overlie volcanic rocks (middle Miocene to Oligocene; Ma)--Silicic to mafic flows and pyroclastic rocks; includes some sub-volcanic 113
117 intrusions or by Sedimentary rocks (Pliocene to middle Miocene)--Units deposited during and after late Tertiary normal faulting, sedimentary parts of the Bidahochi Formation, and the Bouse Formation; commonly capped by patches of Quaternary surficial deposits Colorado Moffat County The bedrock at the requested point in Moffat County is the Browns Park Formation-a Tertiary (Miocene) fluvial siltstone, claystone, conglomerate, loosely consolidated eolian sandstone, and volcanic ash. I don't have any info on depth to bedrock in this area Kansas Stafford County Dan Suchy, from Kansas, reports that bedrock at the Stafford County site is shale with some redbeds, sand, or limestone - reports vary. There is an oil well within 300 feet of the site, and depth to bedrock there is 140 ft to 150 ft. 25 Massachusetts Sites I have checked with a couple of people in our office and no one has done any project work in that area. I can check out to see if we have any ground water wells in that area and check the drillers logs to see if there was refusal and if that does not work I might be able to get it from a surficial Geology map Missouri Jasper County The latitude and longitude plots to approximately the NE Corner, SE 1/4, NE 1/4, Sec. 24, T. 29 N., R. 34 W. on the Carl Junction 7.5 Minute Quadrangle. We have no drill hole information in the vicinity of this location that shows depth to bedrock. There may be approximately 6 feet of silty clay underlain by 4 feet of cherty clay residuum on top of limestone bedrock. Elevation of the top of bedrock is expected to vary in this area New Mexico - Location N W Depth to bedrock in this area is approximately 1300 ft. Data are from a well cited in Abbot, J.C., Cather, S.M., and Goodwin, L.B., 1995, Paleogene synorogenic sedimentation in the Galisteo Basin related to the Tijeras-Canoncito fault system: New Mexico Geological Society, Guidebook to 46th field conference, pp New Mexico - Location N W It will depend on what you mean by bedrock in this area. A well within one mile has depth to Kirtland Formation at 1377 ft and depth to Fruitland Formation at 1763 ft North Dakota Grand Forks County Based on the information readily available to me right now, I can only provide an approximate answer to your question. I don't have specific test-hole data for the precise location about which you asked. The depth to bedrock in the location you specified, within about a mile or so from that location, ranges between about 220 and 250 feet. That is, approximately 220 to 250 feet of alternating glacial and lake sediment overlie the bedrock in that area. The bedrock at that location is Cretaceous shale (Mowry-Skull Creek, undifferentiated). The easternmost limit of shale subcrop in this general area is approximately 3 to 5 miles to the east of this location. The shale on top of basal Cretaceous sand of the Inyan Kara Formation, which subcrops to the east of 114
118 the pinchout. It may be that one of our geologists will be able to find a test hole very near the exact location you specified, and if so it may be possible to provide more accurate information. Otherwise, the accuracy of the thickness is based on an interpolation between contours on an isopach map (100-foot contour interval). The identification of the bedrock formation should be correct. I am unsure how thick the shale interval is at the point you specified Texas Sites We won't have any information about depth to bedrock for these coordinates. The best information that we have for type of bedrock would be on our surface geology maps. The scale of these maps is 1:250,000. USGS 7.5 topos were used as the base maps and aerial photos and some field work were the typical data used to determine the surface geology features. At this scale, accuracy for specific coordinates could be in question. Here is a list of the counties of interest and the maps where they are located: Refugio - GA Beeville, Bay City map Guadalupe - GA 0029 and GA San Antonio and Seguin maps Burleson - GA Austin map Kenedy - GA 0010 and GA 0023 Corpus Christi and McAllen, Brownsville maps El Paso - GA Van Horn, El Paso map Virginia Floyd County Floyd site: +/- 70 ft. to the biotite gneiss of the Ache Formation Prince George site: around 150 ft. (<200 ft) through the Bacon Castle Formation to an unnamed Triassic basin of mudstone with sand, silts, and clays Virginia York County York site: around 850 ft. to granite gneiss. 115
119 ANNEX- D Estimating Original Air Voids of GPS-LTPP Sections. 116
120 Estimating Original Air Voids of GPS - LTPP Sections PROBLEM STATEMENT The air voids at the time of construction (original air voids) of the asphalt mixture placed on a pavement section is required for the calibration and validation of the distress models used in the 2002 Design Guide. This information is needed for all the asphalt layers within the pavement section. As of date, a total of 56 GPS sites have been identified that will be used for the calibration of the distress models in the 2002 Design Guide. These sections were selected from the LTPP database that conforms to some minimum data requirements. The data was extracted from LTPP database by Fugro-BRE and was transferred to ASU research team for calibration of distress models for the new flexible design sections. During the review of the data, it was observed that the information on the original air voids or the air voids at the time of construction might be in error. It was of paramount importance to make sure that the data used for calibration was error free. It was thus decided to carry out an investigation on the reliability of the original air voids obtained from the LTPP database. PRELIMINARY INVESTIGATION As a general criteria used in practice, Design Air Voids for dense graded mixes falls between 3-6% range while Construction Air Voids is generally 3-5% higher than the design air voids value. Information was obtained from the LTPP database both on the construction and design air voids. The results obtained are shown in Figure 1. It can be observed that in most instances the Design Air Voids are either equal or higher than the Construction Air Voids. This is unrealistic and in contrast from what it should be. As a consequence, the original air voids (construction air voids) data for the cited sections were considered unreliable given the magnitude of the values. Since the original air voids at the time of construction is the key information required for the calibration of the distress models, it was decided to look for information that can be used to estimate the initial air voids value for the selected sections. A study was carried out and the results are presented in this report. 117
121 Construction Air Voids (%) Design Air Voids (%) Figure 1. Design versus Construction Air Voids for 56 GPS Sections from LTPP Inventory Database 118
122 LITERATURE REVIEW Not much information and quantitative research is available to predict the change of in-situ mix air voids as a function of mix densification due to repeated loads under different environmental conditions for different mix types. However, it is well understood as to which factors contribute to the change in air voids in the real pavement. Among, several contributing factors, four major factors are logically felt to influence the rate of change of air voids as a function of time. These factors are: 1. Traffic. 2. Compaction/ Initial Air Voids. 3. Environmental Regime. 4. Mix and Bitumen Considerations. A brief description of each of the above factors is given below. Traffic Traffic is one of the most important factors that influence the change in air voids for a particular mix. In general, the overall traffic effect is a function of the vehicular loads, gear configurations, traffic volumes and speed of the vehicles operating on the asphalt pavement. As the number of repetitions increase, the density of the asphalt concrete increases which results in a decrease in the air voids. High volume roads are more susceptible to larger changes of air voids compared to low volume roads, if all of the other variables are kept constant. Compaction/Original Air Voids Compaction, at the time of construction, defines the initial mix density and the initial air voids (original air voids). The initial air void content of a mix will influence the rate of change in air voids due to traffic. The initial air void value is a function of both, the specific mix design and the field compaction. Higher initial air voids will result in greater change in air voids compared to lower initial air voids. It is known that an ultimate value of air voids is achieved after a certain period of time depending upon the mix, traffic and environmental conditions. This is commonly called the voids at refusal. Thus, it is important that any statistical model developed to capture this phenomenon approaches an asymptotic value. 119
123 Environmental Regime While the fundamental environmental factors that influence asphalt aging are not clearly understood; it is clear that temperature does play a major role in the behavioral response of any asphalt mix. As a general indicator, the mean annual air temperature (as a surrogate parameter for the environment) does directly influence the change in air voids. Since asphalt mixtures are viscous materials, they are greatly affected by changes in temperature. Higher temperatures will make the asphalt less viscous, the mix less stiff and more susceptible to compaction under traffic loads. Thus, higher mean annual air temperatures will generally result in a greater change of air voids if all other variables are kept constant. Mix and Bitumen Consideration Under the same environmental conditions and traffic, harder asphalt cements will result in stiffer mixes. Stiffer mixes, under the same environment and traffic, will have less change in air voids compared to softer mixes. Existing Predictive Approach Mirza at el. (AAPT 1995), at the University of Maryland has developed a regression model based upon the information obtained from the field to predict the change in air voids as a function of time. The model developed is given below: VA VA= t orig t - 2 Maat η + 2 t orig,77 (1) where: Va = aged air voids at time, t (%) Va orig = original air voids at the time of construction (%) Maat = mean annual air temperature, deg F η orig,77 = original viscosity at 77 deg F t = time (months) 120
124 In the above regression model a value of two percent was arbitrarily selected as a minimum air void for mathematical convenience. This value of 2% does have engineering justification in that sound or stable rut resisting mixtures will generally reach this threshold void level (2-3%) prior to excessive shear displacement caused by plastic flow. The selection was also influenced by the minimum standard error of estimate. The above model has a standard error of 1.65 and coefficient of multiple determination (R 2 ) of It should be observed that the model is not a function of the traffic. This variable was not included in the model since no information was available on the traffic level, for the sections used in the development of this regression model. Table 1 gives the summary of the field projects used in the analysis. ANNEX A gives the summary of the data. Table 1 Summary of Data Points Line No. Test RD/Source No. of Sections at each Test Road No of Data Points Michigan Delaware Texas (Dickens) Texas (Dumas) Texas (Lufkin) Florida Zaca Wigmore Minnesota BPR-Was, DC 6 28 TOTAL Revised Model with NCAT Data Revised coefficients were obtained for Mirza s model using additional data obtained from the National Center for Asphalt Testing (NCAT). A summary of the data obtained from NCAT is given in ANNEX B. ANNEX B-1 shows the raw data obtained from NCAT, whereas, ANNEX B-2 shows the reduced data used in the analysis. All sections that do not have aged air voids value but only initial construction air voids were excluded from the analysis. The model obtained including Mirza s and NCAT data is given below. 121
125 VAorig t - 2 VA= t t Maat η orig, (2) R 2 = 0.84; S e /S y = Figure 2 shows the goodness of fit plot along with the residuals. The total number of data points used for the analysis was 268. This includes 192 data points from Mirza s study, whereas remaining points were obtained from 22 additional projects provided by NCAT. The NCAT project location information is provided in Table 2. As mentioned earlier, the entire data is presented in Appendices A and B. The reduced data presented in ANNEX B-2 was obtained by averaging the value corresponding to each section, and also eliminating outliers. An observation was considered an outlier, if an increase in air voids value was observed as a function of time. The air voids should decrease with time due to traffic loading and thus an increase is considered to be an outlier. It can be observed in figure 2 that the model presented in Equation (2) is slightly bias. The predicted values for air voids less than 5% is slightly higher. That is the model has the tendency to predict higher values at longer periods of time, values that generally correspond to air voids for the aged condition. Furthermore, the model presents an asymptotic value of 2% that could be serios limitation in the back calculation of VA orig. In other words, the model is invalid for aged air voids that are less than 2%. FINAL MODEL In order to develop the final model for the prediction of air voids as a function of time numerical optimization techniques were used for curve fitting. Several different structural model forms were used in the analysis. These included: exponential, logarithmic and hyperbolic functional forms. The selection of the final model was made with the consideration that it should be statistically and theoretically sound. Equation (3) presents the chosen model: VAorig + exp VA= t t ( * t ) Maat t η orig,77 (3) R 2 = 0.89; S e /S y = The above model has a better R 2 compared to the model represented by Equation (2). The goodness of fit plot along with the residual analysis are shown in Figure 3. It is obvious that the bias observed by Equation (2) is no longer present for the predictions made with Equation (3). In addition, no asymptotic value was used in this case as in Equation (2); that uses a value of 2%. As stated before, a value of 2% was arbitrarily selected as a minimum air void for mathematical convenience and does have engineering justification in that sound or stable rut resisting mixtures will generally reach this threshold void level (2-3%) prior to excessive shear displacement caused by plastic flow. However, for the purpose of 122
126 this study, it imposes a serious limitation, as it will be seen later when the above equation will be used to predict or backcalculate the initial air voids (VA orig ), given the aged air voids value. A sensitivity analysis was carried out for all the independent variables in Equation (3). Figure 4a and Figure 4b show the relative importance of the original air voids at two different temperatures, at a constant low viscosity value and at a constant high viscosity value, respectively. It can be observed that the rate of change of air voids with time is dependent on the original air voids. Higher initial air voids show a greater change where compared to lower initial air voids. This is logical since higher air voids mixes have more compressibility potential under the given traffic and environmental conditions. Figures 5 shows the effect of Viscosity on the predicted VA at the same mean annual air temperature, Maat. Furthermore, Figure 6 shows the effect of Maat on the predicted VA at the same viscosity value. It can be observed that as the viscosity increases, or temperature decreases, the rate of change of air voids decreases. These results are quite rational. The predicted model indicates that harder asphalt and cold temperatures result in lower changes of air voids, and hence the sensitivity analysis shows that the model selected is rational and theoretically correct. 123
127 Predicted VA (%) Mirza's Data NCAT Data Actual VA (%) N = 268 SSE = 761 Se/Sy = 0.61 R 2 = Residual Predictive Value (%) Figure 2. Actual versus Predicted VA Equation 2 Mirza & NCAT Data 124
128 Table 2 Project Locations for NCHRP 9-9 (1) Field Projects Project ID State Location Binder Grade 1-1 AL Highway 157, south bound lane, app. 5 miles north of Moulton. PG AL Highway 168, east bound lane, app. 2 miles east of Boaz. PG AL Highway 80, west bound lane, near White Hall PG AL Highway 84, east bound lane, near Monroeville PG AL Highway 167, north bound lane, near Enterprise PG AL Andrews Road, city street located in Opelika PG FL Davis Highway, city street located in Pensacola, app. 2 miles south of I- 10. AC MI Highway 50, north bound lane, in Jackson PG MI Highway 52 near Owosso PG MI Interstate 75 north bound lane near Flint PG WI Highway 45 south bound lane near Wisconsin Avenue in Milwaukee PG CO Highway 9, south bound lane, in Frisco PG CO Highway 82, south bound lane, south of Glenwood Springs PG CO Pitkin Avenue at the intersection of 10 th street in Grand Junction PG CO Highway 13 north bound lane, just north of Meeker PG CO Highway 82, south bound lane, south of Glenwood Springs PG UT Highway 150, west of Kamas PG IN Highway 136 east bound lane near East Main Street in Brownsburg PG IN Interstate 69 southbound near Auburn PG KY Washington County Road 1786, near Lebanon PG KY Interstate 64, east bound, near Olive Hill PG KY Shelby County Road 1779, near Frankfurt PG
129 Predicted Va (%) Mirza's Data NCAT Data Actual Va (%) N = 268 SSE = 523 Se/Sy = 0.52 R 2 = Residual Predicted Value (%) Figure 3. Actual versus Predicted VA Equation 3 Mirza & NCAT Data 126
130 BACK-CALCULATION OF ORIGINAL AIR VOIDS FOR GPS SECTIONS As mentioned earlier, the objective of this study was to estimate the air voids at the time of construction. This was needed because reliable data for initial air voids could not be obtained from the LTPP database for the selected sections. The Equation (3) previously developed was used to back-calculate the original air voids (air voids at construction). For this purpose, the following information was needed: 1. Air voids at any time, t 2. Mean annual air temperature 3. Original viscosity at 77 deg F Item 1 and 2 were obtained directly from the LTTP database for the selected sections, but no information was available for viscosity at 77 o F. However, penetration at 77 o F was available in the LTTP database. The penetration values were converted to viscosity values by the model developed by Mirza et al. (AAPT 1995), at the University of Maryland. The regression model used is given below. logη = log(pen) log(pen ) (4) 2 The η value is expressed in Poises. Accurate viscosity predictions over a Pen range from 3 to 300 have been observed for the above-mentioned predictive model (Equation 4). Once the viscosity values were obtained, Equation (3) was then used to estimate the VA orig for all the 56 sections to be used for the calibration of distress models for the 2002 Design Guide. The needed data and the back-calculated original air voids are shown in Table 3. The following observations were made with the back-calculated values. 1. It was observed that the Design Air Voids values are less than the predicted Original or Construction Air Voids values and that is considered logically correct. This is in contradiction to the data obtained from the LTTP database. 2. In some situations, extremely high air voids were predicted by Equation (3). This is due to the fact, that relatively high air voids values are reported for the aged conditions as obtained from the LTPP database. That is, if the air voids at 252 months is reported to be 13%, then, the back-calculated value will be in excess of 30% in some instances. This is an unrealistic value and should not be used. 127
131 Viscosity = 0.1 MP; MAAT = 30F Air Voids (%) Time (months) Viscosity = 0.1 MP; MAAT = 80F Air Voids (%) Time (months) Figure 4a. Relative Importance of Initial Air Voids and the Effect of Mean Annual Air Temperature (η 77F = 0.1 MP) 128
132 Viscosity = 3.0 MP; MAAT = 30F Air Voids (%) Time (months) Viscosity = 3.0 MP; MAAT = 80F Air Voids (%) Time (months) Figure 4b. Relative Importance of Initial Air Voids and the Effect of Mean Annual Air Temperature (η 77F = 3.0 MP) 129
133 MP 1.0MP 3.0MP Air Voids (%) Time (months) Figure 5. Effect of Viscosity on Predicted Air Voids (Maat = 50F) F 50F 80F 6.00 Air Voids (%) Time (months) Figure 6. Effect of Mean Annual Air Temperature (Viscosity = 1.0 MP) 130
134 The model developed was based upon surface mixes data and therefore, should only be applicable for the top layer. However, in some situations, especially for the full depth asphalt sections, more than one layer of asphalt is used in the pavement structure. Prediction of air voids for layers other than the top layer should be used with caution. Because of these shortcomings and special situations, it was decided to come up with reasonable values in those instances where the values given by the model represented by Equation (3) were not considered reliable. For this purpose, the same data collected and used to develop Equation (3) was used to establish a band of reasonable predicted air voids. The mentioned band can be represented by an equation that involves the parameters found to significantly affect the air voids with time. Equation (5) represents the family of curves that better represent the collected data: VA = VA orig t t Maatη orig (5) R 2 = 0.85; S e /S y = 0.49 The goodness of fit plot and the residual analysis for Equation (5) are shown in Figure 7. Figures 8a and 8b show the relative importance of the original air voids at two different temperatures, at a constant low viscosity value and at a constant high viscosity value, respectively. In these figures it can be seen that the rate of change of air voids with time is irrespective or independent of the original air voids. It indicates that even though Equation (5) is statistically sound, it is not theoretically accurate, and therefore should not be considered as a predictive model, but rather as a representation of a band of reasonable air voids values. 131
135 Table 3. Back-calculated VA orig for the GPS-LTPP Sections SHRP LAYER VA Va orig Va design AGE Maat Viscosity Pred. VA orig ID (LTPP Inventory) (months) ( o F) (M-Poises) Eq. (2) Eq. (3) Eq. (5) STATE CODE Suggested Value for Calibration
136 Table 3. Back-calculated VA orig for the GPS-LTPP Sections (Contd) SHRP LAYER VA Va orig Va design AGE Maat Viscosity Pred. VA orig ID (LTPP Inventory) (months) ( o F) (M-Poises) Eq. (2) Eq. (3) Eq. (5) STATE CODE * Numbers in bold represent the criteria used to choose the suggested value Suggested Value for Calibration 133
137 Predicted VA (%) Mirza's Data NCAT Data Actual VA (%) N = 268 SSE = 844 Se/Sy = 0.49 R 2 = Residual Predicted Value (%) Figure 7. Actual versus Predicted VA values by Equation 5 134
138 Viscosity = 0.6 MP; Maat = 30 o F Air Voids (%) Time (months) Viscosity = 0.6 MP; Maat = 80 o F Air Voids (%) Time (months) Figure 8a. Relative Importance of Initial Air Voids and the Effect of Mean Annual Air Temperature (η 77F = 0.6 MP) 135
139 Viscosity = 3 MP; Maat = 30 o F Air Voids (%) Time (months) Viscosity = 3 MP; Maat = 80 o F Air Voids (%) Time (months) Figure 8b. Relative Importance of Initial Air Voids and the Effect of Mean Annual Air Temperature (η 77F = 3.0 MP) Suggested VA orig Values for the GPS-LTPP Sections 136
140 Given the limitations encountered with the model depicted with Equation (3), it was decided to come up with suggested values for the situations where the model could not predict a reliable value. Table 3 provides the suggested or recommended values that should be used for the calibration of the distress models for the 2002 Design Guide. The suggested values are generally the ones given by Equation (3), however, for those instances where the predictions were not considered reliable, values based on the band represented by Equation (5) were recommended. The guidelines used to choose the suggested VA orig values for the GPS sections are listed below. The design air voids value given by the LTPP database should always be smaller that the predicted VA orig. VA orig should be between 6% and 12%. The value given by the model represented by Equation (3) was suggested if it fulfilled the above criteria. For the sections where Equation (3) predicted unrealistic values, the suggested value was given by Equation (5). For those sections where information was not available to predict VA orig, a value between 8% and 10% was assumed. Exceptions to these guidelines are observed for section , where the design air voids was reported as 17%, values that was considered extremely high; and for section , where the design value was reported as 13.2%. The results obtained from this study are not perfect. However, the research team believes that the approach used above is the best to obtain the original air voids information needed for the calibration of the distress models. 137
141 ANNEX D1 Mirza s Data Set 138
142 Line Test_Road Mix_ID VA Vaorig t Viscosity Maat Predicted (%) (%) (months) (Mega-Poises) (F) VA 84 MICHIGAN MICHIGAN MICHIGAN MICHIGAN MICHIGAN MICHIGAN MICHIGAN MICHIGAN MICHIGAN MICHIGAN MICHIGAN MICHIGAN MICHIGAN MICHIGAN MICHIGAN MICHIGAN MICHIGAN MICHIGAN MICHIGAN MICHIGAN MICHIGAN MICHIGAN MICHIGAN MICHIGAN MICHIGAN MICHIGAN MICHIGAN MICHIGAN MICHIGAN MICHIGAN MICHIGAN MICHIGAN MICHIGAN MICHIGAN MICHIGAN MICHIGAN DELAWARE AF-DEL DELAWARE AF-DEL DELAWARE AF-DEL DELAWARE AF-BPR DELAWARE AF-BPR DELAWARE AF-BPR DELAWARE AR-BPR DELAWARE AR-BPR DELAWARE AR-BPR Line Test_Road Mix_ID VA (%) Vaorig (%) t (months) Viscosity (Mega-Poises) Maat (F) Predicted VA 139
143 367 DELAWARE AR-AI DELAWARE AR-AI DELAWARE AR-AI DELAWARE BF-BPR DELAWARE BF-BPR DELAWARE BF-BPR DELAWARE BR-DEL DELAWARE BR-DEL DELAWARE BR-DEL DELAWARE BR-BPR DELAWARE BR-BPR DELAWARE BR-BPR DELAWARE BR-AI DELAWARE BR-AI DELAWARE BR-AI TEXAS (Dickens) (A)AC TEXAS (Dickens) (A)AC TEXAS (Dickens) (A)AC TEXAS (Dickens) (A)AC TEXAS (Dickens) (A)AC TEXAS (Dickens) (A)AC TEXAS (Dickens) (A)AC TEXAS (Dickens) (B)AC TEXAS (Dickens) (B)AC TEXAS (Dickens) (B)AC TEXAS (Dickens) IAC TEXAS (Dickens) IAC TEXAS (Dickens) IAC TEXAS (Dickens) (E)AC TEXAS (Dickens) (E)AC TEXAS (Dickens) (E)AC TEXAS (Dumas) (A)AC TEXAS (Dumas) (A)AC TEXAS (Dumas) (A)AC TEXAS (Dumas) (A)AC TEXAS (Dumas) (B)AC TEXAS (Dumas) (B)AC TEXAS (Dumas) (B)AC TEXAS (Dumas) (D)AC TEXAS (Dumas) (D)AC TEXAS (Dumas) (D)AC TEXAS (Dumas) (E)AC TEXAS (Dumas) (E)AC TEXAS (Dumas) (E)AC TEXAS (Dumas) (E)AC TEXAS (Dumas) (E)AC Line Test_Road Mix_ID VA (%) Vaorig (%) t (months) Viscosity (Mega-Poises) Maat (F) Predicted VA 610 TEXAS (Dumas) (E)AC TEXAS (Dumas) (E)AC TEXAS (Lufkin) (A)AC TEXAS (Lufkin) (A)AC
144 617 TEXAS (Lufkin) (A)AC TEXAS (Lufkin) IAC TEXAS (Lufkin) IAC TEXAS (Lufkin) IAC TEXAS (Lufkin) (E)AC TEXAS (Lufkin) (E)AC TEXAS (Lufkin) (E)AC FLORIDA Lowlight FLORIDA Lowlight FLORIDA Lowlight ZACA WIGMORE A ZACA WIGMORE A ZACA WIGMORE A ZACA WIGMORE C ZACA WIGMORE C ZACA WIGMORE C ZACA WIGMORE C ZACA WIGMORE C ZACA WIGMORE D ZACA WIGMORE D ZACA WIGMORE D ZACA WIGMORE D ZACA WIGMORE E ZACA WIGMORE E ZACA WIGMORE E ZACA WIGMORE F ZACA WIGMORE F ZACA WIGMORE F ZACA WIGMORE G ZACA WIGMORE G ZACA WIGMORE G ZACA WIGMORE H ZACA WIGMORE H ZACA WIGMORE H ZACA WIGMORE H ZACA WIGMORE J ZACA WIGMORE J ZACA WIGMORE J ZACA WIGMORE J ZACA WIGMORE J ZACA WIGMORE B-1-1A ZACA WIGMORE B-1-1A ZACA WIGMORE B-1-1A Line Test_Road Mix_ID VA (%) Vaorig (%) t (months) Viscosity (Mega-Poises) Maat (F) Predicted VA 1173 ZACA WIGMORE B-1-1A ZACA WIGMORE D ZACA WIGMORE D ZACA WIGMORE D ZACA WIGMORE D ZACA WIGMORE E ZACA WIGMORE E
145 1217 ZACA WIGMORE E ZACA WIGMORE G ZACA WIGMORE G ZACA WIGMORE G ZACA WIGMORE H ZACA WIGMORE H ZACA WIGMORE H ZACA WIGMORE H ZACA WIGMORE I-2-2(5.8) ZACA WIGMORE I-2-2(5.8) ZACA WIGMORE I-2-2(5.8) ZACA WIGMORE I-2-2(5.8) ZACA WIGMORE I-2-2(6.3) ZACA WIGMORE I-2-2(6.3) ZACA WIGMORE I-2-2(6.3) ZACA WIGMORE I-2-2(6.3) MINNESOTA P200/ MINNESOTA P200/ MINNESOTA P200/ BPR-WAS,DC B BPR-WAS,DC B BPR-WAS,DC B BPR-WAS,DC B BPR-WAS,DC B BPR-WAS,DC B BPR-WAS,DC C BPR-WAS,DC C BPR-WAS,DC C BPR-WAS,DC C BPR-WAS,DC C BPR-WAS,DC C BPR-WAS,DC C BPR-WAS,DC C BPR-WAS,DC C BPR-WAS,DC C BPR-WAS,DC C BPR-WAS,DC C BPR-WAS,DC C BPR-WAS,DC C BPR-WAS,DC D Line Test_Road Mix_ID VA (%) Vaorig (%) t (months) Viscosity (Mega-Poises) Maat (F) Predicted VA 1929 BPR-WAS,DC D BPR-WAS,DC D BPR-WAS,DC D BPR-WAS,DC D BPR-WAS,DC D BPR-WAS,DC D BPR-WAS,DC D
146 ANNEX D2 NCAT Data Set 143
147 ANNEX D2-1 Raw Data as Received from NCAT 144
148 ALABAMA DATA Gmb VTM Gmb VTM PROJECT I.D. Gmm CONSTR. 3 MONTH 6 MONTH CONSTR. 3 MONTH 6 MONTH PROJECT I.D Gmm CONSTR. 3 MONTH 6 MONTH CONSTR. 3 MONTH 6 MONTH AL1 AL Gmb VTM Gmb VTM PROJECT I.D. Gmm CONSTR. 3 MONTH 6 MONTH CONSTR. 3 MONTH 6 MONTH PROJECT I.D Gmm CONSTR. 3 MONTH 6 MONTH CONSTR. 3 MONTH 6 MONTH AL3 AL Gmb VTM Gmb VTM PROJECT I.D. Gmm CONSTR. 3 MONTH 6 MONTH CONSTR. 3 MONTH 6 MONTH PROJECT I.D Gmm CONSTR. 3 MONTH 6 MONTH CONSTR. 3 MONTH 6 MONTH AL5 AL N/A N/A N/A N/A N/A N/A N/A N/A N/A N/A N/A N/A PROJ. I.D. JOB LOCATION MIX I.D. AL1 MOULTON 12.5mm NMS COARSE GRADED SUPRPAVE AL2 BOAZ 12.5mm NMS COARSE GRADED SUPRPAVE AL3 SELMA 12.5mm NMS COARSE GRADED SUPRPAVE AL4 MONROEVILLE 12.5mm NMS COARSE GRADED SUPRPAVE AL5 ENTERPRISE 12.5mm NMS COARSE GRADED SUPRPAVE AL6 OPELIKA 9.5mm NMS COARSE GRADED SUPRPAVE 145
149 FLORIDA, UTAH, WISCONSIN, AND INDIANA DATA Gmb VTM Gmb VTM PROJECT I.D Gmm CONSTR. 3 MONTH 6 MONTH CONSTR. 3 MONTH 6 MONTH PROJECT I.D Gmm CONSTR. 3 MONTH 6 MONTH CONSTR. 3 MONTH 6 MONTH FL1 IN N/A N/A 10.7 N/A N/A N/A N/A 9.4 N/A N/A N/A N/A 9.9 N/A N/A N/A N/A 8.5 N/A N/A N/A N/A 9.5 N/A N/A N/A N/A 8.2 N/A N/A N/A N/A 8.4 N/A N/A N/A N/A 6.1 N/A N/A N/A N/A 7.6 N/A N/A Gmb VTM Gmb VTM PROJECT I.D Gmm CONSTR. 3 MONTH 6 MONTH CONSTR. 3 MONTH 6 MONTH PROJECT I.D Gmm CONSTR. 3 MONTH 6 MONTH CONSTR. 3 MONTH 6 MONTH UT1 IN N/A N/A N/A N/A 7.9 N/A N/A N/A N/A N/A N/A 11.8 N/A N/A N/A N/A N/A N/A 10.8 N/A N/A N/A N/A N/A N/A 9.4 N/A N/A N/A N/A N/A N/A 7.4 N/A N/A N/A N/A N/A N/A 7.5 N/A N/A N/A N/A N/A N/A 7.5 N/A N/A N/A N/A N/A N/A 6.6 N/A N/A N/A N/A N/A N/A 8.5 N/A N/A Gmb VTM PROJECT I.D Gmm CONSTR. 3 MONTH 6 MONTH CONSTR. 3 MONTH 6 MONTH WI N/A N/A 10.2 N/A N/A N/A N/A 9.5 N/A N/A N/A N/A 8.8 N/A N/A N/A N/A 5.9 N/A N/A N/A N/A 6.5 N/A N/A N/A N/A 7.5 N/A N/A N/A N/A 7.7 N/A N/A N/A N/A 8.7 N/A N/A N/A N/A 8.1 N/A N/A PROJ. I.D. JOB LOCATION MIX I.D. FL1 PENSACOLA 9.5 NMS Coarse Graded Superpave UT1 SALT LAKE CITY 12.5 NMS Fine Graded Superpave IN1 BROWNSBURG IN2 FORT WAYNE WI1 MILWAUKEE 12.5 NMS Coarse Graded Superpave 146
150 COLORADO DATA Gmb VTM Gmb VTM PROJECT I.D Gmm CONSTR. 3 MONTH 6 MONTH CONSTR. 3 MONTH 6 MONTH PROJECT I.D Gmm CONSTR. 3 MONTH 6 MONTH CONSTR. 3 MONTH 6 MONTH CO1 CO N/A N/A N/A N/A N/A N/A N/A N/A N/A N/A N/A N/A N/A N/A N/A N/A N/A N/A N/A N/A N/A N/A N/A N/A N/A N/A N/A N/A N/A N/A N/A N/A N/A N/A N/A N/A Gmb VTM Gmb VTM PROJECT I.D Gmm CONSTR. 3 MONTH 6 MONTH CONSTR. 3 MONTH 6 MONTH PROJECT I.D Gmm CONSTR. 3 MONTH 6 MONTH CONSTR. 3 MONTH 6 MONTH CO3 CO N/A N/A N/A N/A N/A N/A N/A N/A N/A N/A N/A N/A N/A N/A N/A N/A N/A N/A N/A N/A N/A N/A N/A N/A N/A N/A N/A N/A N/A N/A Gmb VTM PROJECT I.D Gmm CONSTR. 3 MONTH 6 MONTH CONSTR. 3 MONTH 6 MONTH CO N/A N/A N/A N/A N/A N/A N/A N/A N/A N/A N/A N/A N/A N/A N/A N/A N/A N/A PROJ. I.D. JOB LOCATION MIX I.D. CO1 FRISCO 12.5mm NMS FINE GRADED SUPERPAVE CO2 GLENWOOD SPRINGS #1 12.5mm NMS FINE GRADED SUPERPAVE CO3 GRAND JUNCTION 12.5mm NMS FINE-COARSE GRADED SUPERPAVE CO4 MEEKER 12.5mm NMS COARSE GRADED SUPERPAVE CO5 GLENWOOD SPRINGS #2 12.5mm NMS FINE GRADED SUPERPAVE 147
151 KENTUCKY AND MICHIGAN DATA Gmb VTM Gmb VTM PROJECT I.D Gmm CONSTR. 3 MONTH 6 MONTH CONSTR. 3 MONTH 6 MONTH PROJECT I.D Gmm CONSTR. 3 MONTH 6 MONTH CONSTR. 3 MONTH 6 MONTH KY1 KY N/A N/A 14.3 N/A N/A N/A N/A 8.1 N/A N/A N/A N/A 13.0 N/A N/A N/A N/A 8.1 N/A N/A N/A N/A 12.7 N/A N/A N/A N/A 7.9 N/A N/A N/A N/A 17.4 N/A N/A N/A N/A 7.1 N/A N/A N/A N/A 13.4 N/A N/A N/A N/A 7.6 N/A N/A N/A N/A 16.1 N/A N/A N/A N/A 8.0 N/A N/A Gmb VTM Gmb VTM PROJECT I.D Gmm CONSTR. 3 MONTH 6 MONTH CONSTR. 3 MONTH 6 MONTH PROJECT I.D Gmm CONSTR. 3 MONTH 6 MONTH CONSTR. 3 MONTH 6 MONTH KY3 MI N/A N/A 8.0 N/A N/A N/A N/A 7.5 N/A N/A N/A N/A 9.5 N/A N/A N/A N/A 7.1 N/A N/A N/A N/A 6.3 N/A N/A N/A N/A 7.8 N/A N/A N/A N/A 8.3 N/A N/A N/A N/A 6.7 N/A N/A N/A N/A 6.6 N/A N/A N/A N/A 5.3 N/A N/A N/A N/A 9.8 N/A N/A N/A N/A 8.0 N/A N/A N/A N/A 6.3 N/A N/A N/A N/A 8.6 N/A N/A N/A N/A 5.8 N/A N/A N/A N/A 8.2 N/A N/A N/A N/A 6.2 N/A N/A N/A N/A 8.2 N/A N/A Gmb VTM Gmb VTM PROJECT I.D Gmm CONSTR. 3 MONTH 6 MONTH CONSTR. 3 MONTH 6 MONTH PROJECT I.D Gmm CONSTR. 3 MONTH 6 MONTH CONSTR. 3 MONTH 6 MONTH MI2 MI N/A N/A 7.3 N/A N/A N/A N/A 8.7 N/A N/A N/A N/A 5.4 N/A N/A N/A N/A 8.3 N/A N/A N/A N/A 7.5 N/A N/A N/A N/A 8.3 N/A N/A N/A N/A 7.1 N/A N/A N/A N/A 7.2 N/A N/A N/A N/A 6.9 N/A N/A N/A N/A 10.4 N/A N/A N/A N/A 7.6 N/A N/A N/A N/A 8.9 N/A N/A N/A N/A 9.7 N/A N/A N/A N/A 7.9 N/A N/A N/A N/A 8.6 N/A N/A PROJ. I.D. JOB LOCATION MIX I.D. KY1 LEBENON KY2 OLIVE HILL KY3 FRANKFORT MI1 BROOKLYN 9.5 NMS FINE GRADED SUPERPAVE MI2 LANSING 9.5 NMS FINE GRADED SUPERPAVE MI3 DETROIT 12.5 NMS COARSE GRADED SUPERPAVE 148
152 ANNEX D2-2 Reduced NCAT Data as Used in the Analysis 149
153 PROJECT I.D. Time VA MAAT Viscosity (months) (%) (F) (Mega-poises) AL AL AL AL AL AL AL AL AL AL AL AL AL PROJECT I.D. Time VA MAAT Viscosity (months) (%) (F) (Mega-poises) 150
154 AL CO CO CO CO CO CO CO CO CO CO CO CO FL FL UT UT UT ANNEX- E Correlation of CBR Values with Soil Index Properties 151
155 NCHRP 1-37 A Development of the 2002 Guide for the Design of New and Rehabilitated Pavement Structures Inter Team Technical Report Correlation of CBR Values With Soil Index Properties Developed by: Dr. M. W. Witczak, Professor Dr. W. N. Houston, Professor Dr. C. E. Zapata, Faculty Research Associate November 2001 College of Engineering and Applied Sciences Department of Civil and Environmental Engineering Tempe, AZ
156 Table of Contents Study Objective...2 Sources of Information...2 Methodology...3 Validation...4 Relationship between In-situ M R and M R at Optimum Conditions...4 Summary
157 CBR Correlations with Soil Index Properties Study Objective The objective of this study was to develop general correlations that describe the relationship between Soil Index Properties and the California Bearing Ratio (CBR) and Resilient Modulus (M R ) of unbound materials such as base, subbase, and subgrade layers in pavement systems. The correlations developed are intended for use in the 2002 Design Guide methodology. Once relationships were developed to predict CBR values, the use of M R = 2555 CBR 0.64 was used to correlate properties directly to estimates of M R. Sources of Information The sources of information used to correlate CBR with soil index properties are: 1. Typical CBR ranges for the Unified Soil Classification System (USCS) material classification (Table 1). 2. Grain Size Distribution ranges for materials defined with the USCS. Given the requirements of the USCS, each USCS symbol implies certain limits on the given size distribution. 3. Atterberg Limits for the USCS materials. Likewise, each USCS symbol implies certain limits on the Atterberg Limits, particularly when the fact that most soils plot near the Aline is employed. 4. Grain Size Distribution ranges for materials defined by AASHTO Classifications A-1-a, A-1- b, and A-3 materials. Typical CBR ranges for the USCS materials were extracted from Principles of Pavement Design, (Yoder & Witczak, 1975). The values are shown in the 12 th column of Table 1. Three additional CBR values for the AASHTO classification materials were extracted from a slightly modified version of the Guidelines for Use of HMA Overlays to Rehabilitate PCC Pavements (NAPA Information Series 117, 1994). This modified graphical correlation of CBR, R-values, USCS, and AASHTO classification is shown in Figure 1. In addition, Tables 2 and 3 summarize the typical CBR and M R ranges, and in-situ (typical) M R value for each USCS and AASHTO classification symbol. 154
158 The grain size distribution information was used to define typical ranges for D 60 values and the Percentage Passing #200 sieve (P 200 ) for the USCS materials. These properties were chosen to correlate with CBR for simplicity, as they will always be required as input parameters in the 2002 Design Guide. Typical ranges for the Atterberg Limits were estimated in order to get the Plasticity Index (PI). As with the D 60 and the P 200 properties, the PI of the soil is always required as an input parameter in the Design Guide. The values of D 60, P 200, and PI were the index properties chosen for correlation. In addition, for materials with a PI > 0, a weighted Plasticity Index, termed wpi was used: wpi = Passing #200 Plasticity Index = P 200 PI...(1) with P 200 used as a decimal and PI used in % form. Table 4 shows typical ranges of D 60, P 200, PI and wpi for the USCS and AASHTO materials. These values were obtained by checking the Plasticity chart and Grain Size distribution curves, based on the classification criteria, to obtain ranges. Methodology The materials were divided into two groups: a) Coarse materials, clean, typically non-plastic such as GW, GP, SW, and SP soils for which wpi = 0; and b) Soils which contain more than 12% fines and exhibit some plasticity, such as GM, GC, SM, SC, ML, MH, CL, and CH, for which wpi > 0. For coarse, clean soils (wpi = 0), it was decided to correlate the CBR value with the Diameter 60 (D 60 ) from the grain size distribution curves. Figure 2 shows the data obtained from Tables 1 155
159 and 4 for non-plastic soils. Three additional data points were used based on the AASHTO classification system corresponding to A-1-a, A-1-b, and A-3 soils. These data points were obtained from Figure 1 and are indicated by the legend for Figure 2. The best-fitted equation to the data shown in Figure 2 is the following: CBR = (D 60 ) (2) where: D 60 = Diameter at 60% passing from the Grain Size Distribution mm Equation (2) is limited to D 60 values greater than 0.01 mm and less than 30 mm. For D 60 less than 0.01 mm, the recommended value of CBR is 5. For D 60 greater than 30 mm, the recommended value of CBR is 95. This relationship is depicted in Figure 2, along with the goodness of the fit parameters. For the second group (plastic materials), for which wpi > 0, the index properties chosen to correlate with the CBR values are the Passing #200 sieve (P 200 ) and the Plasticity Index (PI). These properties are combined into a parameter called wpi, defined by Equation (1). Figure 3 shows the data obtained from Tables 1 and 4 for plastic materials (wpi > 0), along with the correlation and the goodness of fit. The correlation is represented by Equation (3), as follows: 75 CBR =...(3) ( wpi ) Table 5 shows the calculated CBR based on Equations (2) and (3) for the different materials. Table 5 can either be included as a pop-up screen in the 2002 Design Guide software or simply presented in the User s Manual for the software, as a reference for the user. Validation As a preliminary validation of the correlations developed and depicted in Figures 2 and 3, the CBR values resulting from these correlations were compared to the ranges of CBR values recommended for materials defined by the USCS classification system in Figure 1 and Table 2. It is important to note that the CBR ranges recommended in Figure 1 for the USCS materials 156
160 were not used as a data source to develop the CBR correlations in this report. Therefore, it is a valid source for validation of the results obtained. Table 6 shows the CBR values calculated by the correlations and the CBR ranges recommended in Figure 1 and Table 2. All of the CBR calculated values fall inside the range recommended, and therefore the correlations may be viewed as being quite reliable and consistent between all of the hierarchical sources of data used in the analysis. Relationship between In-situ M R and M R at Optimum Conditions The correlations developed above are based on typical CBR values measured at field (in-situ) conditions. For Level 3 analysis in the 2002 Design Guide, the user has the option to input either CBR values or estimated M R values at optimum conditions. Therefore, a relationship must be developed between the estimated in-situ properties and the properties at optimum conditions. The in-situ M R can be estimated by the following relationship: M R ( ) 0. CBR 64 = (4) In order to convert in-situ M R values to M R at optimum conditions (M Ropt ), a factor that accounts for the strength change by going from in-situ to optimum conditions is shown in Figure 4. The factor is the following: ( ) Factor = (5) 5 M R insitu therefore, M Ropt 5 [ ( M R insitu )] M R insitu =.....(6) Tables 7 and 8 show the M Ropt values calculated from equation (6) for USCS and AASHTO classification materials, respectively. As for the CBR values, Tables 7 and 8 can either be 157
161 included as pop-up screens in the 2002 Design Guide software or simply presented in the User s Manual for the software, as a reference for the user. Summary 1. The correlations shown above were derived primarily by selecting specific values (from recommended ranges of values) of CBR, wpi, and D These correlations were originally intended to get M Ropt for frozen materials, so that F env could be computed (within the EICM Module) for frozen materials. Given that M Rfrz has very little effect on deformation, not much precision in M R for frozen layers is needed. 3. Caution should be exercised when these correlations are used to obtain an estimate of M Ropt for materials other than frozen layers, because a very limited database was used to develop the correlations. 4. As the database relating D 60, wpi, and CBR grows, it may be possible to improve these correlations. It may also be possible eventually to derive even better correlations between D 60 and M Ropt and wpi and M Ropt as direct correlations. 158
162 Subgrade Soil Category Poor Medium Good Excellent M r (ksi) CBR (%) R- Value AASHTO Soil Classification A A A-1-b A-2-4 A-2-5 A-2-6 A-2-7 A-3 A-4 A-5 A-6 60 A-1-a Unified Soil Classification CH MH CL ML SW SP SW - SC SW - SM SP - SC SP - SM SC SM GW GP GW - GC GW - GM GP - GC GP - GM GC GM Figure 1. Typical In-situ Resilient Modulus Correlations to Empirical Soil Properties and Classification Categories. 159
163 (Modified from NAPA Information Series 117, "Guidelines for Use of HMA Overlays to Rehabilitate PCC Pavements", 1994) CBR Equation 2 CBR = (D 60 ) Se/Sy = 0.43; R 2 = 0.84 USCS AASHTO D 60 (mm) Figure 2. CBR Correlations for Coarse-Grained Materials 160
164 CBR Equation 3 CBR = 75 / ( (wPI )) Se/Sy = 0.64; R 2 = wpi Figure 3. CBR Correlation for Plastic Materials Factor Equation 5 Factor = E-05(M R in-situ ) M R in-situ (psi) Figure 4. Factor To Convert In-situ Resilient Modulus to Optimum Resilient Modulus Condition 161
165 Table 1. CBR Values for Soils by the Unified Soil Classification System (USCS) (Yoder & Witczak, Principles of Pavement Design, 1975) Major Division Letter Name Value as Foundation When Not Subject to Frost Action Value as Base Directly under Wearing Surface Potential Frost Action Compressibility and Expansion Drainage Characteristics Compaction Equipment GW Gravel or sandy gravel, well graded Excellent Good None to very slight Almost none Excellent Crawler-type tractor, rubber-tired equipment, steel-wheeled roller or more Coarsegrained soils Finegrained soils Gravel and gravelly soils Sand and sandy soils Low compressibility LL < 50 High Compressibility LL > 50 Peat and other fibrous organic soils GP GU GM GC SW SP SU SM SC ML CL OL MH Gravel or sandy gravel, poorly graded Gravel or sandy gravel, uniformly graded Silty gravel or silty sandy gravel Clayey gravel or clayey sandy gravel Sand or gravelly sand, well graded Sand or gravelly sand, poorly graded Sand or gravelly sand, uniformly graded Silty sand or silty gravelly sand Clayey sand or clayey gravelly sand Silts, sandy silts, gravelly silts, or diatomaceous soils Lean clays, sandy clays, or gravelly clays Organic silts or lean organic clays Micaceous clays or diatomaceous soils Good to excellent Poor to fair None to very slight Good Poor None to very slight Good to excellent Fair to good Slight to medium Good Poor Slight to medium Good Poor None to very slight Fair to good Fair to good Poor to not suitable Not suitable None to very slight None to very slight Good Poor Slight to high Fair to good Fair to poor Fair to poor Poor Poor CH Fat clays Poor to very poor OH Fat organic clays Poor to very poor P t Peat, humus, and Not other suitable Not suitable Not suitable Not suitable Not suitable Not suitable Not suitable Not suitable Not suitable Slight to high Medium to very high Medium to high Almost none Almost none Excellent Excellent Crawler-type tractor, rubber-tired equipment, steel-wheeled roller Crawler-type tractor, rubber-tired equipment Very slight Fair to poor Rubber-tired equipment, sheepsfoot roller, close control of moisture Slight Almost none Almost none Almost none Poor to practically impervious Excellent Excellent Excellent Rubber-tired equipment, sheepsfoot roller Crawler-type tractor, rubber-tired equipment Crawler-type tractor, rubber-tired equipment Crawler-type tractor, rubber-tired equipment Very slight Fair to poor Rubber-tired equipment, sheepsfoot roller, close control of moisture Slight to medium Slight to medium Medium Poor to practically impervious Fair to poor Practically impervious Rubber-tired equipment, sheepsfoot roller Rubber-tired equipment, sheepsfoot roller, close control of moisture Rubber-tired equipment, sheepsfoot roller Medium to high Medium to high Poor Rubber-tired equipment, sheepsfoot roller Medium High Fair to poor Rubber-tired equipment, to very sheepsfoot roller high Medium High Practically Rubber-tired equipment, impervious sheepsfoot roller Medium High Practically Rubber-tired equipment, impervious sheepsfoot roller Slight Very high Fair to poor Compaction not practical Unit Dry Weight (pcf ) Field CBR Subgrade Modulus k (pci) or more or more or more
166 Table 2. Typical CBR and In-situ M R Values for USCS Classification Materials from Figure 1 USCS Symbol Typical CBR Range In-situ M R Range Typical In-situ M R (ksi) (ksi) CH MH CL ML SW SP SW-SC SW-SM SP-SC SP-SM SC SM GW GP GW-GC GW-GM GP-GC GP-GM GC GM Table 3. Typical CBR and In-situ M R Values for AASHTO Classification Materials from Figure 1 AAHSTO Symbol Typical CBR Range M R Range Typical In-situ M R (ksi) (ksi) A A A A A A A A A A A-1-b
167 A-1-a Table 4. Index Properties for Materials Classified by USCS and AASHTO Classification Systems used to Develop Correlations Symbol D 60 range (mm) D 60 used (mm) PI range PI used P 200 range (%) P 200 used (%) Calc. wpi CBR range from Table 1 A-1-a > A-1-b A GW GP GM GC SW SP SM SC ML - - < CL MH CH CBR used Table 5. Calculated CBR values from Equations (2) and (3) USCS D 60 used PI used P 200 used Calculated Calculated CBR Symbol (mm) (%) wpi GW GP GM GC SW SP SM SC ML CL MH CH
168 Table 6. Calculated CBR values from Equations (2) and (3) Compared to the Recommended Ranges of CBR Values from Figure 1 USCS Symbol Calculated CBR from Correlations Recommended CBR Ranges from Figure 1 GW GP GM GC SW SP SM SC ML CL MH CH
169 Table 7. Estimated Resilient Modulus based on Unified Soil Classification (USCS) USCS Modulus at Optimum (ksi) Classification Range Default Value CH MH CL ML SW SP SW SC SW SM SP SC SP SM SC SM GW GP GW GC GW GM GP GC GP GM GC GM Table 8. Estimated Resilient Modulus based on AASHTO Soil Classification AASHTO Soil Modulus at Optimum ( ksi) Classification Range Default Value A A A A A A A A A A A-1-b A-1-a
170 Copy No. Guide for Mechanistic-Empirical Design OF NEW AND REHABILITATED PAVEMENT STRUCTURES FINAL DOCUMENT APPENDIX EE-2: INPUT DATA FOR THE CALIBRATION AND VALIDATION OF THE 2002 DESIGN GUIDE FOR REHABILITATED PAVEMENT SECTIONS WITH HMA OVERLAYS NCHRP Prepared for National Cooperative Highway Research Program Transportation Research Board National Research Council Submitted by ARA, Inc., ERES Division 505 West University Avenue Champaign, Illinois August 2003
171 Acknowledgment of Sponsorship This work was sponsored by the American Association of State Highway and Transportation Officials (AASHTO) in cooperation with the Federal Highway Administration and was conducted in the National Cooperative Highway Research Program which is administered by the Transportation Research Board of the National Research Council. Disclaimer This is the final draft as submitted by the research agency. The opinions and conclusions expressed or implied in this report are those of the research agency. They are not necessarily those of the Transportation Research Board, the National Research Council, the Federal Highway Administration, AASHTO, or the individual States participating in the National Cooperative Highway Research program. Acknowledgements The research team for NCHRP Project 1-37A: Development of the 2002 Guide for the Design of New and Rehabilitated Pavement Structures consisted of Applied Research Associates, Inc., ERES Consultants Division (ARA-ERES) as the prime contractor with Arizona State University (ASU) as the primary subcontractor. Fugro-BRE, Inc., the University of Maryland, and Advanced Asphalt Technologies, LLC served as subcontractors to either ARA-ERES or ASU along with several independent consultants. Research into the subject area covered in this Appendix was conducted at ASU and Fugro-BRE, Inc. The authors of this Appendix are Dr. M.W. Witczak, Dr. C.E. Zapata, and Mr. P. Konareddy. Mr. Harold Von Quintus provided assistance in assembling some of the inputs. Foreword The information provided in this appendix overviews and lists all the data required for calibration of performance models for pavements overlaid with HMA layers including pavement data, climatic information, material characterization data, and distress data. The traffic data is provided in an electronic format (attached with the Design Guide CDs). Also, in this appendix, the assumptions made for the missing variable and the basis on which these assumptions were made are explained. This appendix is the second in a series of two volumes on calibration sections for new constructed flexible pavements. The other volume is: Appendix EE-1: Input Data for the Calibration And Validation of the 2002 Design Guide for New Constructed Flexible Pavement Sections ii
172 General Table of Content Appendix EE-2 Input Data for the Calibration and Validation of the 2002 Design Guide for the Rehabilitated Pavement Sections with HMA Overlays Page Main Text 2 Annex A 32 Input Data for the Calibration and Validation of the 2002 Design Guide for HMA Overlays over AC Rehabilitated Pavement Sections Annex B 90 Input Data for the Calibration and Validation of the 2002 Design Guide for HMA Overlays over Fractured Slab Rehabilitated Pavement Sections. Annex C 97 Input Data for the Calibration and Validation of the 2002 Design Guide for HMA Overlays over JRCP Rehabilitated Pavement Sections. Annex D 107 Ground Water Table Depth Information Obtained From the U.S Geological Survey. iii
173 INTRODUCTION This appendix includes the pavement data, climatic information, material characterization data and distress values for overlaid flexible pavement sections used for the calibration of the design of rehabilitated flexible pavements. The data was extracted from the LTPP database. The information provided in this section covered all the input required to run the design guide software and simulate the same condition the pavement sections were exposed to. The actual traffic data was used for the simulation runs. However, the traffic data is provided in an electronic format (attached with the Design Guide CDs). Also, in this appendix the assumptions made for the missing variables and the basis on which these assumptions were made are explained. BACKGROUND The input data and sources of information needed for the calibration and validation of the Design Guide distress prediction models for rehabilitated pavements structures are presented in this report. The data shown corresponds to the input needed in order to calibrate the Level 3 analysis of the Design Guide. The information presented was divided into three different categories, depending on the type of rehabilitation pavement option to be considered, as follows: 1. HMA overlay over existing AC pavement data is presented in Appendix A. 2. HMA overlay over existing fractured slab data is presented in Appendix B. 3. HMA overlay over existing jointed plain concrete (JPCP) pavement data is reported in Appendix C. Sections from the Long Term Pavement Performance (LTPP) database were used for this purpose. The distribution of the sections is shown in Figure 1. HMA OVERLAY OVER EXISTING AC PAVEMENT DATA Data from forty-nine sections from the GPS-6B and SPS-5 projects of the LTPP program was gathered for the calibration and validation of the HMA overlay over existing AC structures. The following is a summary of the tables and their components provided in the Appendix A of this report. The tables contain a complete list of input data and distress data extracted from the LTPP database or, in some cases, from different sources when the information was not available. Table A-1 Analysis Conditions - State Code - SHRP Identification Number - State - Project Type - Base/Subgrade Construction Completion Date EE-2.1
174 - Asphalt Construction Completion Date - Traffic Opening Date - Rehab Date - Design Period Table A-2 Pavement Lane Properties - Lane Width - Pavement Slope - Initial IRI - Thermal Conductivity - Heat Capacity - Surface Short Wave Absorptivity Table A-3 Environmental/Climatic - Latitude (degrees and minutes) - Longitude (degrees and minutes) - Elevation - Groundwater Table Depth - Source of Information Table A-4a Original Pavement Structure - Number of Layers - Layer Number - Layer Type - Representative Thickness - Description - Comments Table A-4b Pavement Structure after Rehabilitation - Number of Layers - Layer Number - Layer Type - Representative Thickness - Description - Comments Table A-5 Aggregate Gradation for Asphalt Mix - Layer Number - Layer Type - Percentage Retained ¾" Sieve - Percentage Retained 3/8" Sieve - Percentage Retained #4 Sieve - Percentage Passing #200 Sieve - Source of Information EE-2.2
175 Table A-6 Effective Binder Content by Volume at Time of Construction - Layer Number - Binder Content by Weight, Pb - Estimated Original Air Voids - Specific Gravity of the Binder, Gb - Estimated Bulk Specific Gravity of the Mix, Gmb - Maximum Theoretical Specific Gravity of the Mix, Gmm - Bulk Specific Gravity of the Aggregate, Gsb - Effective Specific Gravity of the Aggregate, Gse - Estimated Effective Binder Content by Volume at Time of Construction, Vbe - Sources of Information Table A-7 Original Air Voids at Time of Construction and Total Unit Weight - Layer Number - Air Voids at Age = t - Date Test was Completed - Age t - Mean Annual Air Temperature, Maat - Original Air Voids - Source of Information of Original Air Voids - Estimated Original Air Voids - Total Unit Weight Table A-8 Binder Data - Layer Number - Viscosity Grade - Penetration Grade - Penetration at 77F - Viscosity at 140F - Comments Table A-9a - Unbound Materials Data - Layer Number - Layer Type - Liquid Limit, LL - Plastic Limit, PL - Plasticity Index, PI - Source of Atterberg Limits Information - Percent Passing #200 Sieve - Percent Passing #4 Sieve - Diameter D 60 Table A-9b - Unbound Materials Classification - Layer Number EE-2.3
176 - Layer Type - AASHTO Soil Classification - Unified Soil Classification System (USCS) Classification Table A-9c - Unbound Materials Gradation - Layer Number - Layer Type - Percent Passing 3" Sieve - Percent Passing 2" Sieve - Percent Passing 1 1/2" Sieve - Percent Passing 1" Sieve - Percent Passing 3/4" Sieve - Percent Passing 1/2" Sieve - Percent Passing 3/8" Sieve - Percent Passing #4 Sieve - Percent Passing #10 Sieve - Percent Passing #40 Sieve - Percent Passing #80 Sieve - Percent Passing #200 Sieve - Percent Passing 0.02 mm - Percent Passing mm - Percent Passing mm - Source of Information The following tables contain the measured distress information needed to calibrate the results obtained from the analysis: Table A-10 Distress Data Rutting - Survey Date - Rehab Date - Maximum displacement between reference wire line and pavement surface in left lane half, LLH Mean Depth, in inches - Maximum displacement between reference wire line and pavement surface in right lane half, RLH Mean Depth, in inches - Maximum value of LLH Mean Depth or RLH Mean Depth, in inches - Average displacement between reference wire line and pavement surface between left lane half and right lane half data (Average Rutting), in inches Table A-11 Distress Data Alligator Cracking - Survey Date - Rehab Date - Area of low severity alligator cracking, in ft 2 - Area of medium severity alligator cracking, in ft 2 - Area of high severity alligator cracking, in ft 2 - Total Sum of Cracking, in ft 2 EE-2.4
177 Table A-12 Distress Data - Longitudinal Cracking in the Wheel Path - Survey Date - Rehab Date - Length of low severity longitudinal cracking in the wheel path, in ft - Length of medium severity longitudinal cracking in the wheel path, in ft - Length of high severity longitudinal cracking in the wheel path, in ft - Total Sum of Cracking, in ft 2 Table A-13 Distress Data - Thermal Cracking - Survey Date - Rehab Date - Length of low severity transverse cracking in the wheel path, in ft - Length of medium severity transverse cracking in the wheel path, in ft - Length of high severity transverse cracking in the wheel path, in ft - Weighted average, in ft HMA OVERLAY OVER EXISTING FRACTURED SLAB DATA Data from three sections from the SPS-6 project of the LTPP program was gathered for the calibration and validation of the HMA overlay over existing fractured slab structures. The following is a summary of the tables and their components provided in the Appendix B of this report. The tables contain a complete list of input data and distress data extracted from the LTPP database or, in some cases, from different sources when the information was not available. Table B-1 Analysis Conditions - State Code - SHRP Identification Number - State - LTPP Project Type - Base/Subgrade Construction Completion Date - Asphalt Construction Completion Date - Traffic Opening Date - Rehab Date - Design Period Table B-2 Pavement Lane Properties - Lane Width - Pavement Slope - Thermal Conductivity - Heat Capacity - Surface Short Wave Absorptivity Table B-3 Environmental/Climatic - Latitude (degrees and minutes) - Longitude (degrees and minutes) EE-2.5
178 - Elevation - Groundwater Table Depth - Source of Information Table B-4 Original Pavement Structure - Construction Number - Number of Layers - Layer Number - Layer Type - Representative Thickness - Source of Information Table B-5 Pavement Structure after Rehabilitation - Construction Number - Number of Layers - Layer Number - Layer Type - Representative Thickness - Comments Table B-6a Aggregate Gradation for Overlays - Layer Number - Construction Number - Layer Type - Percentage Retained ¾" Sieve - Percentage Retained 3/8" Sieve - Percentage Retained #4 Sieve - Percentage Passing #200 Sieve Table B-6b Original Air Voids at Time of Construction and Total Unit Weight - Layer Number - Air Voids at Age = t - Date Test was Completed - Age t - Design Air Voids - Air Voids as Placed - Mean Annual Air Temperature, Maat - Original Viscosity at 77F - Original Air Voids from LTPP Database - Estimated Original Air Voids - Total Unit Weight - Table B-6c Binder Grade - Layer Number - Construction Number EE-2.6
179 - Viscosity Grade - Penetration Grade - Penetration at 77F - Viscosity at 77F - Estimated Viscosity at 77F - Viscosity at 140F Table B-7 Effective Binder Content by Volume at Time of Construction - Layer Number - Binder Content by Weight, Pb - Estimated Original Air Voids, Va - Specific Gravity of the Binder, Gb - Estimated Bulk Specific Gravity of the Mix, Gmb - Maximum Theoretical Specific Gravity of the Mix, Gmm - Bulk Specific Gravity of the Aggregate, Gsb - Effective Specific Gravity of the Aggregate, Gse - Estimated Effective Binder Content by Volume at Time of Construction, Vbe - Sources of Information Table B-8 PCC Data - Construction Number - Layer Number - Unit Weight - Date Test was Completed - PCC Breakage Width - PCC Breakage Length - Modulus of Fracture, E fs - Elastic Modulus - Modulus of Rupture Table B-9 - Unbound Materials Data - Layer Type - Layer Number - Liquid Limit, LL - Plastic Limit, PL - Plasticity Index, PI - Source of Atterberg Limits Information - Percent Passing #200 Sieve - Percent Passing #4 Sieve - Diameter D 60 - Percent Passing 3" Sieve - Percent Passing 2" Sieve - Percent Passing 1 1/2" Sieve - Percent Passing 1" Sieve - Percent Passing 3/4" Sieve EE-2.7
180 - Percent Passing 1/2" Sieve - Percent Passing 3/8" Sieve - Percent Passing #4 Sieve - Percent Passing #10 Sieve - Percent Passing #40 Sieve - Percent Passing #80 Sieve - Percent Passing #200 Sieve - AASHTO Soil Classification - Unified Soil Classification System (USCS) Classification The following tables contain the measured distress information needed to calibrate the results obtained from the analysis: Table B-10 Distress Data Rutting - Survey Date - Rehab Date - Maximum displacement between reference wire line and pavement surface in left lane half, LLH Mean Depth, in inches - Maximum displacement between reference wire line and pavement surface in right lane half, RLH Mean Depth, in inches - Maximum value of LLH Mean Depth or RLH Mean Depth, in inches - Average displacement between reference wire line and pavement surface between left lane half and right lane half data (Average Rutting), in inches Table B-11 Distress Data Alligator Cracking - Survey Date - Rehab Date - Area of low severity alligator cracking, in m 2 - Area of medium severity alligator cracking, in m 2 - Area of high severity alligator cracking, in m 2 - Total Sum of Cracking, in ft 2 Table B-12 Distress Data - Longitudinal Cracking in the Wheel Path - Survey Date - Rehab Date - Length of low severity longitudinal cracking in the wheel path, in ft - Length of medium severity longitudinal cracking in the wheel path, in ft - Length of high severity longitudinal cracking in the wheel path, in ft - Total Sum of Cracking, in ft Table B-13 Distress Data - Thermal Cracking (Transverse Cracking) - Survey Date - Rehab Date - Length of low severity transverse cracking in the wheel path, in ft - Length of medium severity transverse cracking in the wheel path, in ft - Length of high severity transverse cracking in the wheel path, in ft EE-2.8
181 HMA OVERLAY OVER EXISTING JOINTED PLAIN CONCRETE PAVEMENT (JPCP) SLAB DATA Data from seven sections from the GPS-7B and SPS-6 projects of the LTPP program was gathered for the calibration and validation of the HMA overlay over existing JPCP structures. The following is a summary of the tables and their components provided in the Appendix C of this report. The tables contain a complete list of input data and distress data extracted from the LTPP database or, in some cases, from different sources when the information was not available. Table C-1a Analysis Conditions - State - LTPP Project Type - Base/Subgrade Construction Completion Date - Original Asphalt Construction Completion Date - Traffic Opening Date - Rehab Date Table C-1b Rehabilitation Event - Construction Number - Event - Source of Information Table C-2 Asphalt Overlay Lane Properties - Lane Width - Pavement Slope - Initial IRI - Thermal Conductivity - Heat Capacity - Surface Short Wave Absorptivity Table C-3 Environmental/Climatic - Latitude (degrees and minutes) - Longitude (degrees and minutes) - Elevation - Groundwater Table Depth - Source of Information Table C-4 Pavement Structure - Construction Number - Layer Number - Layer Type - Representative Thickness - Description - Comments EE-2.9
182 Table C-5 Aggregate Gradation for Overlays - Layer Number - Construction Number - Layer Type - Percentage Retained ¾" Sieve - Percentage Retained 3/8" Sieve - Percentage Retained #4 Sieve - Percentage Passing #200 Sieve Table C-6 Original Air Voids at Time of Construction and Total Unit Weight - Layer Number - Air Voids at Age = t - Age t - Mean Annual Air Temperature, Maat - Penetration at 77F - Original Viscosity at 77F - Estimated Original Air Voids - Total Unit Weight - Table C-7 Binder Grade - Layer Number - Construction Number - Viscosity Grade - Penetration Grade - Penetration at 77F - Viscosity at 140F - Viscosity at 275F Table C-8 Effective Binder Content by Volume at Time of Construction - Layer Number - Binder Content by Weight, Pb - Estimated Original Air Voids, Va - Specific Gravity of the Binder, Gb - Estimated Bulk Specific Gravity of the Mix, Gmb - Maximum Theoretical Specific Gravity of the Mix, Gmm - Bulk Specific Gravity of the Aggregate, Gsb - Effective Specific Gravity of the Aggregate, Gse - Estimated Effective Binder Content by Volume at Time of Construction, Vbe Table C-8 General, Thermal, and Mix PCC Properties - Layer Number - Layer Type - Unit Weight EE-2.10
183 - Poisson's Ratio - Coefficient of Thermal Expansion - Thermal Conductivity - Heat Capacity - Cement Type - Cement Content - Water/Cement Ratio - Aggregate Type Table C-10 Strength PCC Properties - Layer Number - Layer Type - Modulus of Rupture - Compressive Strength - Elastic Modulus - Tensile Strength Table C-11 - Unbound Materials Data - Layer Type - Layer Number - Liquid Limit, LL - Plastic Limit, PL - Plasticity Index, PI - Percent Passing #200 Sieve - Percent Passing #4 Sieve - Diameter D 60 - AASHTO Soil Classification Table C-12 - Unbound Materials Gradation - Layer Number - Layer Type - Percent Passing 3" Sieve - Percent Passing 2" Sieve - Percent Passing 1 1/2" Sieve - Percent Passing 1" Sieve - Percent Passing 3/4" Sieve - Percent Passing 1/2" Sieve - Percent Passing 3/8" Sieve - Percent Passing #4 Sieve - Percent Passing #10 Sieve - Percent Passing #40 Sieve - Percent Passing #80 Sieve - Percent Passing #200 Sieve The following tables contain the measured distress information needed to calibrate the results obtained from the analysis: EE-2.11
184 Table C-13 Distress Data Rutting - Survey Date - Rehab Date - Construction Number - Maximum displacement between reference wire line and pavement surface in left lane half, LLH Mean Depth, in inches - Maximum displacement between reference wire line and pavement surface in right lane half, RLH Mean Depth, in inches - Maximum value of LLH Mean Depth or RLH Mean Depth, in inches Table C-14 Distress Data Alligator Cracking - Survey Date - Rehab Date - Construction Number - Area of low severity alligator cracking, in ft 2 - Area of medium severity alligator cracking, in ft 2 - Area of high severity alligator cracking, in ft 2 - Total sum of alligator cracking, in ft 2 Table C-15 Distress Data - Longitudinal Cracking in the Wheel Path - Survey Date - Rehab Date - Construction Number - Length of low severity longitudinal cracking in the wheel path, in ft - Length of medium severity longitudinal cracking in the wheel path, in ft - Length of high severity longitudinal cracking in the wheel path, in ft - Total sum of alligator cracking, in ft Table C-16 Distress Data - Thermal Cracking (Transverse Cracking) - Survey Date - Rehab Date - Construction Number - Length of low severity transverse cracking in the wheel path, in ft - Length of medium severity transverse cracking in the wheel path, in ft - Length of high severity transverse cracking in the wheel path, in ft - Weighted Average in ft EE-2.12
185 Figure 1. LTPP Sections Used for Calibration and Validation of the 2002 Design Guide Distress Models for Rehabilitated Pavement Structures EE-2.13
186 COMMENTS ON COLLECTED DATA TO INPUT INTO THE DESIGN GUIDE SOFTWARE Most of the information shown on the tables was extracted from the LTPP database and provided by Fugro-BRE. However, some of the elements needed as input data and presented in the aforementioned tables were not provided by Fugro-BRE. In these cases, the database was revisited. When no information was found after rechecking the database, the data was obtained from different sources such as the U.S. Geological Survey and Soil Conservation Service reports. Some of the values were reasonably assumed in order to complete the data set needed to run the Design Guide software for the Level 3 analysis. This section is intended to describe either the sources or the assumptions needed to complete the data set for those parameters for which it was not possible to get the complete information from the LTPP database. It also gives a short description or a brief explanation of the terms and parameters shown in the tables of the Appendices. The explanation that follows is linked to the parameters shown in Appendix A for the data used in the distress calibration of the HMA overlay over AC. However, most of the parameters are common for the HMA overlay over fractured slab and HMA overlay over JPCP pavements data shown in Appendices B and C, and no further explanation is needed. Further explanation can be also found for those parameters from Appendices B and C that are not common to the ones shown in Appendix A. Table A-1 Analysis Conditions State Code It is a numerical code for a state or province, usually arranged in alphabetic order. Codes are consistent with federal information processing standards. SHRP Identification Number Test section identification number assigned by the LTTP Program. This number must be combined with the State Code to be unique. State Name of the state represented by the State Code. LTPP Project Data was collected from either the General Pavement Studies (GPS), which comprises existing pavements as originally constructed or after the first overlay, or from the Specific Pavement Studies (SPS), which were designed to meet LTPP objectives that the GPS experiments could not completely meet. Base/Subbase Construction Completion Date This information was not found in the LTPP database in most of the cases. It was assumed to be 2 months prior to the Asphalt Construction Completion date. EE-2.14
187 Asphalt Construction Completion Date This is the date when traffic starts to move on the pavement. It also marks the completion of the construction. Traffic Opening Date Date when pavement was first opened to traffic. It was assumed to be the same as the asphalt construction completion date in cases where the data was not found. Rehab Date Date on which rehabilitation work is completed, and traffic is opened to the public. Design Period The design period was chosen based on the time the traffic data was available in the database. For the rehabilitation pavement analysis, the design period begins from the rehab date. In most of the cases, traffic data was available until Table A-2 Pavement Lane Properties Pavement Slope A value of 1.5% was assumed for all of the sections. Initial International Roughness Index (IRI) A value of 63 in/mile was assumed for all of the sections. Thermal Conductivity Reasonable values of HMA thermal conductivity range from 0.44 to 0.81 BTU/hr-ft- o F. A default value of 0.67 BTU/hr-ft- o F was assumed for all of the sections. Heat Capacity Reasonable values of HMA heat capacity range from 0.22 to 0.40 BTU/lb- o F. A default value of 0.22 BTU/hr-ft- o F was assumed for all of the sections. Surface Short Wave Absorptivity Reasonable values of surface short wave absorptivity for weathered asphalt (gray) range from 0.80 to A default value of 0.85 was assumed for all of the sections. Table A-3 - Environmental/Climatic Input Latitude and Longitude When inputting latitude and longitude into the 2002 Design Guide, the format needed is degrees.minutes. The latitude and longitude are used in conjunction with the elevation of the site to identify the location of the nearest weather station. Elevation This is the elevation of weather station above the mean sea level. EE-2.15
188 Groundwater Table Depth If the boring log did not show information on groundwater table depth, this value was set up at the bottom of the borehole, which was considered the most conservative assumption. Information not found on the LTPP database was mainly extracted from the U.S. Geological Survey website, from the report presented by Harold Von Quintus on March Tables B-1, B-2, and B-3 (Appendix B) 1, and from Soil Conservation Service reports and maps. Additional data was gathered from communication with the state DOTs and regional information. The source of information of the groundwater table data for the calibration and validation of the rehabilitated pavement sections is shown in the last column of Table A-3. A summary of the data collected from the U.S. Geological Survey is presented in Appendix D. Table A-4a Original Pavement Structure Number of Layers The number of layers data was obtained from the database. In several cases, the surface asphalt layer thickness was reported to be less than 1 inch. Furthermore, no information was generally found for these layers. Due to software limitations, the Design Guide cannot handle asphalt layers of less than 1 inch in thickness. For the aforementioned reasons, sections for which the surface layer was reported to be less than 1 inch, this layer was combined with the layer immediately beneath it. Generally the subgrade was reported to be an uncompacted layer. Therefore, the top 12 inches of the subgrade was assumed to be compacted material. This compacted "sublayer" is not included in the Number of Layers column shown in Table A-4a. The Number of Layers column does not include the bedrock or rigid layer, if such information was available. Depth to Bedrock or Depth to a Rigid Layer Table A-4a shows the source of information from which the bedrock depth was attained. In most of the cases, records of depth to bedrock were not found in the LTPP database. In order to complete this information, the following sources were used: Report presented by Harold Von Quintus on March 2001 with data from the Soil Conservation Service reports and maps 2. State DOTs records (Appendix C) LTPP boring log information and comments Table TST_SAMPLE_LOG 1 Witczak, M.W., & Zapata, C.E. (2002). Input Data for the Calibration and Validation of the 2002 Design Guide for New Constructed Flexible Pavement Sections. Development of the 2002 Guide for the Design of New and Rehabilitated Pavement Structures Technical Report. National Cooperative Highway Research Program (NCHRP). Project 1-37A. Appendix B 2 Witczak, M.W., & Zapata, C.E. (2002). Input Data for the Calibration and Validation of the 2002 Design Guide for New Constructed Flexible Pavement Sections. Development of the 2002 Guide for the Design of New and Rehabilitated Pavement Structures Technical Report. National Cooperative Highway Research Program (NCHRP). Project 1-37A. Appendix B EE-2.16
189 Table A-4b Pavement Structure after Rehabilitation Milling Information Milled out information is provided under Table A-4b. The Design Guide needs this data to run the program. Table A-5 - Aggregate Gradation for Asphalt Mix Data that was not provided by Fugro BRE was gathered from the LTPP database (Tables TST_AG04 and RHB_ACO_AGGR_PROP). If data was not available from the LTPP database, the ASU research team assumed suitable data. The Design Guide requires the following aggregate gradation for AC mixes: Percentage retained on ¾ sieve, 3/8 sieve, #4 sieve, and percentage passing #200 sieve. Table A-6 - Effective Binder Content by Volume at Time of Construction The effective binder content by volume at the time of construction is not available in the LTPP database. To obtain values of effective binder, the following information was gathered: Binder content by weight (Pb) from LTPP Table TST_AC04 An estimated value for the original air voids from Table A-7 of this report. Specific gravity of the binder (Gb) from LTPP Table TST_AC03 An estimated bulk specific gravity of the mix (Gmb) at time of construction Maximum theoretical specific gravity of the mix (Gmm) from either the LTPP Table TST_AC03 or the INVENTORY Combined bulk specific gravity of the aggregate (Gsb) from LTPP Table INV_PMA The Gmb value at the time of construction was not available in the LTPP database. Therefore, this value was calculated from the Maximum Theoretical Specific Gravity of the Mix (Gmm) and the Original Air Voids (VA orig ) as follows: Gmb = Gmm 1 VAorig...(1) 100 With this information, the Effective Specific Gravity of the Aggregate (Gse) was calculated as follows: 100 Pb Gse = 100 Pb Gmm Gb...(2) and the Effective Binder Content by Volume (Vbe): EE-2.17
190 ( Gse Gsb) Pb Vbe = Gmb ( 100 Pb) Gb Gse Gsb... (3) Table A-7 - Original Air Voids at Time of Construction and Total Unit Weight During the review of the data, it was observed that the information on the original air voids extracted from the INVENTORY tables for the GPS and the SPS sections might be in error. It was then decided to estimate the original air voids at the time of construction between 6 to 9% for the sections with suspicious data. Table A-8 - Binder Grade For Level 3 analysis, the Design Guide software requires as input either the viscosity grade or the penetration grade. In cases where the binder grade was missing, the Penetration at 77 o F and the Viscosity at 140 o F were used to infer the value. The viscosity and penetration data was obtained from INV_PMA_ASPHALT table from LTPP database. If no data was available, then a suitable penetration grade was assumed. Table A-9a - Unbound Materials Data The following data is summarized in Table A-9a: Layer Number Layer Type Liquid Limit, LL Plastic Limit, PL Plasticity Index, PI Percent Passing #200 Sieve Percent Passing #4 Sieve Diameter D 60, in mm Liquid Limit and Plastic Limit The Liquid and Plastic Limits (Atterberg Limits) are not needed as input parameters in the Design Guide software. However, they must be obtained in order to classify the granular unbound materials. For the SPS sections with missing information, the Atterberg Limits were assumed to be the same as the ones for the nearest SPS section with available data. Plasticity Index The Plasticity Index is the difference between the Liquid Limit and the Plastic Limit. EE-2.18
191 Percent Passing #200 and Percent Passing #4 For the SPS sections with missing information, the gradation was assumed to be the same as the one found for the nearest SPS section with available data. Diameter D 60 Information on diameter D 60 is not available in the LTPP Database. Values were obtained individually from the Grain Size Distribution information provided in Table A- 9c. The Design Guide software has a lower boundary for Diameter D 60 values of 0.07 mm. In cases where the D 60 of the material is lower than 0.07 mm, it will be approximated to the minimum required. Table A-9b - Unbound Materials Classification The following data is summarized in Table A-9b: AASHTO Soil Classification Unified Soil Classification System (USCS) Classification The unbound materials classification is needed for Level 3 analysis to estimate the resilient modulus at optimum conditions. The resilient modulus at optimum conditions was obtained by relationships developed between soil index properties and the California Bearing Ratio (CBR). Once the relationships were developed to predict CBR values, the following correlation was used to relate properties directly to estimates of modulus, M R : M R 0.64 = 2555 CBR...(4) Tables 1 and 2 present the estimated modulus based on the soil classification system. Detailed analysis and correlations are presented in Witczak et al., Table A-9c - Unbound Materials Gradation The entire grain size distribution or gradation of the unbound materials is not required directly by the software of the 2002 Design Guide. However, it is required to obtain the Diameter D 60 and the soil classification. 1 Witczak, M.W., Houston, W.N., & Zapata, C.E. (2001). Correlation of CBR Values with Soil Index Properties. Development of the 2002 Guide for the Design of New and Rehabilitated Pavement Structures Technical Report. National Cooperative Highway Research Program (NCHRP). Project 1-37A. EE-2.19
192 Table 1. Estimated Resilient Modulus based on Unified Soil Classification (USCS) USCS Modulus at Optimum (ksi) Classification Range Default Value CH MH CL ML SW SP SW SC SW SM SP SC SP SM SC SM GW GP GW GC GW GM GP GC GP GM GC GM Table 2. Estimated Resilient Modulus based on AASHTO Soil Classification AASHTO Soil Modulus at Optimum ( ksi) Classification Range Default Value A A A A A A A A A A A-1-b A-1-a EE-2.20
193 Distress Potential Prediction of distresses as a function of time is needed for the calculation of IRI values for the 2002 Design Guide. The distress values needed in the IRI predictive equation for rehabilitated pavement analysis includes: fatigue cracking, rutting, transverse cracking, longitudinal cracking, sealed longitudinal cracking outside the wheel path, patching, and potholes. Distresses such as fatigue cracking, rutting, longitudinal cracking in the wheel path, and transverse cracking are determined by use of transfer functions. However, distresses such as sealed longitudinal cracking outside the wheel path, patching, and potholes lack of transfer functions and therefore, predicting values are not available. In order to have an estimate of these distresses at different distress potential (DP) levels, the LTPP database was used to establish relationships as a function of time 1. The following tables show the distress values assumed and the standard deviation of the results. Sealed Longitudinal Cracks Outside of the Wheel Path, LC NWP Medium and high severity longitudinal cracks outside the wheel path area for HMA overlay: "DP" Level LC NWP Standard Error (m/km) (Se) High Med Low None Patches, P Area of medium and high severity patches as a percentage of the total lane area for HMA overlay: "DP" Level P Standard Error (%) (Se) High Med Low None Witczak, M.W., Mirza, M.W., & Zapata, C.E. (2002). Estimation of Distress Quantities for Smoothness Models for HMA-Surface Pavements. Development of the 2002 Guide for the Design of New and Rehabilitated Pavement Structures Technical Report. National Cooperative Highway Research Program (NCHRP). Project 1-37A. EE-2.21
194 Potholes, PH Potholes as a percentage of total lane area for HMA overlay: "DP" Level PH Standard Error (%) (Se) High Med Low None MEASURED DISTRESS DATA TO COMPARE WITH ESTIMATED RESULTS FROM THE DESIGN GUIDE SOFTWARE The following tables contain the measured distress information needed to calibrate the results obtained from the rehab analysis: Table A-10 Distress Data Rutting The following data is summarized in Table A-10: Survey Date Rehab Date Maximum displacement between reference wire line and pavement surface in left lane half, LLH Mean Depth, in inches Maximum displacement between reference wire line and pavement surface in right lane half, RLH Mean Depth, in inches Maximum Mean Depth which is the maximum value of LLH Mean Depth or RLH Mean Depth, in inches Average displacement between left lane half and right lane half data, in inches The average displacement between the left and the right lanes was used to calibrate the 2002 Design Guide rutting model. In those cases where no information was provided for both lanes, the maximum displacement between the left and right lanes was considered for the calibration. Table A-11 Distress Data Alligator Cracking The following data is summarized in Table A-11: Survey Date Rehab Date EE-2.22
195 Area of low severity alligator cracking, in ft 2 Area of medium severity alligator cracking, in ft 2 Area of high severity alligator cracking, in ft 2 Weighted average, in ft 2 The data shown in bold in Table A-11 corresponds to the distress information before rehabilitation was performed in the test section. Table A-12 Distress Data - Longitudinal Cracking in the Wheel Path The following data is summarized in Table A-12: Survey Date Rehab Date Length of low severity longitudinal cracking in the wheel path, in ft Length of medium severity longitudinal cracking in the wheel path, in ft Length of high severity longitudinal cracking in the wheel path, in ft Weighted average, in ft The data shown in bold in Table A-12 corresponds to the distress information before rehabilitation was performed in the test section. Table A-13 Distress Data - Thermal Cracking (Transverse Cracking) The following data is summarized in Table A-13: Survey Date Rehab Date Length of low severity transverse cracking in the wheel path, in ft Length of medium severity transverse cracking in the wheel path, in ft Length of high severity transverse cracking in the wheel path, in ft Weighted average, in ft Weighed Average The weighted average was calculated as follows: Weighted Low _ severity + 3Medium _ severity + 5High _ severity Average =...(5) 9 The data shown in bold in Table A-13 corresponds to the distress information before rehabilitation was performed in the test section. EE-2.23
196 COMMENTS ON COLLECTED DATA TO INPUT INTO THE DESIGN GUIDE SOFTWARE TO CALIBRATE HMA OVERLAY OVER FRACTURED SLAB DISTRESS MODELS The explanation that follows is linked to the parameters shown in Appendix B for the data used in the distress calibration of the HMA overlay over fractured slab pavements. However, most of the parameters are common with the HMA overlay over AC pavements data shown above and no further explanation is needed. Table B-4 Original Pavement Structure Construction Number The Construction number is the event number used in the LTPP database to relate changes in pavement structure with other time dependent data elements. This field is set to 1 when a test section is initially accepted into LTPP and is incremented with each change to the layer structure. Table B-6b - Original Air Voids at Time of Construction and Total Unit Weight The air voids at time of construction was extracted from the LTPP database by Fugro- BRE and was transferred to the ASU research team. During the review of the data, it was observed that the information on the original air voids extracted from the LTPP database might be in error (See columns Design Air Voids and Air Voids as Placed). It was then decided to carry out the computation of these values based on available information. The data collected to calculate the original air voids was the following: Air Voids at Age = t Date test was completed to determine the age of the pavement (Age = t) Mean Annual Air Temperature, Maat Original Viscosity at 77 o F For a detailed explanation of how the air voids at time of construction was estimated from the aforementioned data, refer to the Inter Team Technical report by Witczak et al. (2001) 1. Original Viscosity at 77 o F Information on the original viscosity at 77 o F was not available for the SPS sections in the LTPP database. In those cases, the viscosity value was inferred from the A and VTS values based on the binder grade provided for the layer. The following equation was used for this purpose: log logη = A + VTS log...(6) T R 1 Witczak, M.W., Zapata, C.E., & Mirza, M.W. (2001). Estimating Original Air Voids of GPS-LTPP Sections. Development of the 2002 Guide for the Design of New and Rehabilitated Pavement Structures Technical Report. National Cooperative Highway Research Program (NCHRP). Project 1-37A. EE-2.24
197 where: η = Viscosity, cpoises T R = Temperature in Rankine A, VTS = Regression parameters as function of binder grade Table B-8 PCC Data PCC Breakage Width and Length This is the slab fracture size needed to determine the modulus of fractured slab (E fs ) for Level 3 analysis. Modulus of Fractured Slab (E fs ) For Level 3 analysis, the E fs is a function of the fracture method used. The following values are recommended and used in the calibration of the HMA overlay over fractured slab: Type of Fracture Efs (ksi) Rubbilization 150 Crack and Seat 12 inch crack spacing 24 inch crack spacing 36 inch crack spacing Modulus of Rupture No data was available in the LTPP database for modulus of rupture. A value of 650 psi was assumed for all sections. COMMENTS ON COLLECTED DATA TO INPUT INTO THE DESIGN GUIDE SOFTWARE TO CALIBRATE HMA OVERLAY OVER JPCP DISTRESS MODELS The explanation that follows is linked to the parameters shown in Appendix C for the data used in the distress calibration of the HMA overlay over JPCP analysis. However, most of the parameters are common with the HMA overlay over AC pavements data shown above and no further explanation is needed. Table C-9 General, Thermal, and Mix PCC Properties Coefficient of Thermal Expansion A default value of 6E-6 mm/mm/ o F was assumed for sections with no data available in the LTPP database. EE-2.25
198 Thermal Conductivity Reasonable values of thermal conductivity range from 0.2 to 2.0 BTU/hr-ft- o F. A default value of 1.25 BTU/hr-ft- o F was assumed for all of the sections. Heat Capacity Reasonable values of heat capacity range from 0.1 to 0.5 BTU/lb- o F. A default value of 0.28 BTU/hr-ft- o F was assumed for all of the sections. Cement Type Type I cement was assumed for those sections with no information available in the LTPP database. Water/Cement Ratio A water/cement ratio of 0.42 was assumed for those sections with no information available in the LTPP database. Aggregate Type Limestone was assumed for those sections with no information available in the LTPP database. JPCP Design Features The following parameters are needed for the HMA overlay over JPCP pavement analysis but no data was found in the LTPP database. The brief explanation presented herein should help the user to make a decision of which values to use when dealing with this analysis. Joint Spacing The joint spacing is a critical JPCP design factor that affects structural and functional performance of JPCP, as well as construction and maintenance cost. The stresses in JPCP increase rapidly with increasing joint spacing. To a lesser degree, joint faulting also increases with increasing joint spacing. Joint spacing must be selected within the context of design features such as slab thickness, slab width, PCC materials properties, base type, and subgrade stiffness. A particular joint spacing may be adequate for a given set of design features, but inadequate for another. The interaction between slab thickness and joint spacing is shown in Figure 2. In general, a short joint spacing (e.g., 15 ft) is recommended; however, there is no need to make joint spacing less than 12 ft, since the lane width is 12 ft. If random joint spacing is used, the average joint spacing may be used for the evaluation of faulting performance, but for transverse cracking the long and short panels should be evaluated separately. For example, if ft joint spacing pattern is used, the 12- and 13-ft panels should grouped and analyzed using 13 ft joint spacing, and the 18- and 19-ft panels should be grouped and analyzed using 19 ft joint spacing. The average cracking from the two designs is the expected cracking in the random jointed section. The Design Guide EE-2.26
199 software uses the average joint spacing for faulting analysis and the maximum joint spacing for cracking analysis when random joint spacing is entered. Dowel Diameter and Dowel Spacing For doweled pavements, dowel diameter and dowel spacing are critical design inputs. The larger the dowel diameter, the lower the concrete bearing stress and joint faulting. JPCP joint faulting is highly sensitive to dowel diameter. The sensitivity of JPCP joint faulting to dowel diameter is shown in Figure 3. Dowel spacing is simply the spacing between dowels. Typical dowel spacing is 12 inches. Sealant Type Sealant type is an input to the empirical model used to predict spalling. Spalling is used in smoothness predictions, but it is not considered directly as a measure of performance in this Guide. The sealant options are Liquid, Silicone, and Preformed. Edge Support Tied PCC shoulders and widened slabs can significantly improve JPCP performance by reducing critical deflections and stresses. The shoulder type also affects the amount of moisture infiltration into the pavement structure. The effects of moisture infiltration are considered in the determination of seasonal moduli values of unbound layers. The structural effects of the edge support features are directly considered in the design process, as illustrated in Figure 4 for cracking and Figure 5 for faulting. The inputs for these design features are as follows: Tied PCC Shoulder for tied concrete shoulders the long-term load transfer efficiency (LTE) between the lane and shoulder must be provided. The LTE is defined as the ratio of deflections of the unloaded and loaded slabs. The higher the LTE, the greater the support provided by the shoulder to reduce critical responses of the mainline slabs. Typical long-term deflection LTE are: o 50 to 70 percent for monolithically constructed tied PCC shoulder. o 30 to 50 percent for separately constructed tied PCC shoulder. Untied shoulders do not provide significant support; therefore, a low LTE value should be used (e.g., 10 % due to the support from extended base course). Widened Slab widened slabs improve JPCP performance by effectively moving the mean wheelpath well away from the pavement edges where the critical loadings occur. The design input for widened slab is the slab width. EE-2.27
200 million trucks (TTC 2 [30 million ESALs]) Wet-freeze climate 8- to 11-in JPCP; 6-in aggregate base Percent slabs cracked in slab 9-in slab 10-in slab 11-in slab Joint spacing, ft Figure 2. Sensitivity of JPCP Transverse Cracking to Slab Thickness and Joint Spacing million trucks Wet-freeze climate 10-in JPCP; 6-in aggregate base EROD=4 AC shoulder 15-ft joint spacing Faulting, in no dowels d = 1 in d = 1.25 in d = in d = 1.5 in Age, months Figure 3. Sensitivity of JPCP Joint Faulting to Dowel Diameter. EE-2.28
201 Percent slabs cracked million trucks (TTC2 [30 million ESALs]) Wet-freeze climate 8.5-in slab; 15-ft joint spacing; 6-in agg. base 28-day MRpcc = 690 psi; Epcc = 4.4 Mpsi α = 5.5 x 10⁻⁶ / F AC shoulder Tied PCC shoulder LTE = 40% Tied PCC shoulder LTE = 70% Widened slab Age, years Figure 4. Effects of Edge Support on JPCP Transverse Cracking million trucks Wet-freeze climate 10-in JPCP; 6-in aggregate base No dowels EROD=4 15-ft joint spacing Faulting, in AC shoulder PCC shoulder Widened slab Age, months Figure 5. Effects of Edge Support on Non-Doweled JPCP Transverse Joint Faulting EE-2.29
202 Base Erodibility The potential for base or subbase erosion (layer directly beneath the PCC layer) has a significant impact on the initiation and propagation of pavement distress. Different base types are classified based on long-term erodibility behavior as follows: Class A Extremely erosion resistant materials. Class B Very erosion resistant materials. Class C Erosion resistant materials. Class D Fairly erodible materials. Class E Very erodible materials. PCC-Base Interface The interface between a stabilized base and PCC slab is modeled either completely bonded or unbonded for JPCP design. The structural contribution of a stabilized base is significant, if the base is fully bonded to the slab. Stabilized bases (especially asphaltstabilized bases) are often bonded to the slab, and the deflection testing conducted at slab interior typically shows a bonded response. However, the effects of environmental and traffic loading tend to weaken this bond over time around the edges, and the bondedinterface assumption over the entire design period may be unconservative. The JPCP design procedure includes the modeling of the changes in the interface bond condition over time. This is accomplished by specifying the pavement age at which the debonding occurs. Up to the debonding age, the slab-base interface is assumed fully bonded; after the debonding age, the interface is assumed fully unbonded. The design input is the pavement age at debonding, in months. In general, specifying the debonding age greater than 5 years (60 months) is not recommended and was not used in calibration. EE-2.30
203 APPENDIX A Input Data for the Calibration and Validation of the 2002 Design Guide for HMA Overlay over AC Rehabilitated Pavement Sections
204 Table A-1 Analysis Conditions Section State Code SHRP ID State LTPP Project Base/Subgrade Construction Completion Date 1 Asphalt Construction Completion Date Traffic Opening Date 2 Rehab Date Design Period (years) Alabama GPS-6B 06/01/74 08/01/74 08/01/74 04/03/ Alabama GPS-6B 04/01/76 06/01/76 06/01/76 06/01/ Florida GPS-6B 12/01/70 02/01/71 02/01/71 05/01/ Nebraska GPS-6B 10/01/75 01/01/76 01/01/76 10/22/ North Carolina GPS-6B 08/01/85 10/01/85 10/01/85 05/01/ Texas GPS-6B 04/01/80 06/01/80 06/01/80 09/15/ Texas GPS-6B 10/01/85 01/01/86 01/01/86 08/02/ Texas GPS-6B 05/01/87 07/01/87 07/01/87 10/18/ Washington GPS-6B 06/01/79 08/01/73 08/01/73 07/01/ Manitoba GPS-6B 07/01/71 09/01/71 09/01/71 09/13/ Manitoba GPS-6B 07/01/71 09/01/71 09/01/71 09/13/ Saskatchewan GPS-6B 05/01/68 07/01/68 07/01/68 10/01/ Saskatchewan GPS-6B 05/01/68 07/01/68 07/01/68 10/01/ Arizona SPS-5 06/01/68 08/01/68 08/01/68 05/08/ Arizona SPS-5 06/01/68 08/01/68 08/01/68 05/03/ Arizona SPS-5 06/01/68 08/01/68 08/01/68 05/24/ Arizona SPS-5 06/01/68 08/01/68 08/01/68 05/24/ Arizona SPS-5 06/01/68 08/01/68 08/01/68 05/24/ Arizona SPS-5 06/01/68 08/01/68 08/01/68 05/24/ Arizona SPS-5 06/01/68 08/01/68 08/01/68 05/08/ Arizona SPS-5 06/01/68 08/01/68 08/01/68 05/08/ Minnesota SPS-5 05/01/69 07/01/69 07/01/69 09/15/ Minnesota SPS-5 05/01/69 07/01/69 07/01/69 09/15/ Minnesota SPS-5 05/01/69 07/01/69 07/01/69 09/15/ Minnesota SPS-5 05/01/69 07/01/69 07/01/69 09/15/ Minnesota SPS-5 05/01/69 07/01/69 07/01/69 09/15/ Minnesota SPS-5 05/01/69 07/01/69 07/01/69 09/15/ Minnesota SPS-5 05/01/69 07/01/69 07/01/69 09/15/ Minnesota SPS-5 05/01/69 07/01/69 07/01/69 09/15/ Montana SPS-5 07/01/82 09/01/82 09/01/82 09/12/ Montana SPS-5 07/01/82 09/01/82 09/01/82 09/12/ Montana SPS-5 07/01/82 09/01/82 09/01/82 09/11/ Montana SPS-5 07/01/82 09/01/82 09/01/82 09/11/ Montana SPS-5 07/01/82 09/01/82 09/01/82 09/11/ Montana SPS-5 07/01/82 09/01/82 09/01/82 09/11/ Montana SPS-5 07/01/82 09/01/82 09/01/82 09/12/ Montana SPS-5 07/01/82 09/01/82 09/01/82 09/12/ Montana SPS-5 07/01/82 09/01/82 09/01/82 09/13/ New Jersey SPS-5 06/01/72 08/01/72 08/01/72 08/19/ New Jersey SPS-5 06/01/72 08/01/72 08/01/72 08/13/ New Jersey SPS-5 06/01/72 08/01/72 08/01/72 08/21/ New Jersey SPS-5 06/01/72 08/01/72 08/01/72 08/21/ New Jersey SPS-5 06/01/72 08/01/72 08/01/72 08/20/ New Jersey SPS-5 06/01/72 08/01/72 08/01/72 08/13/ New Jersey SPS-5 06/01/72 08/01/72 08/01/72 08/13/ New Jersey SPS-5 06/01/72 08/01/72 08/01/72 08/20/ Base/Subbase Completion Date = 2 months prior to Asphalt Construction Completion Date. 2 Traffic Opening Date = Asphalt Construction Completion Date. EE-2.32
205 Table A-2 Pavement Lane Properties Section Project Type Lane Width (ft) Pavement Slope (%) Initial IRI (in/mile) Thermal Conductivity (BTU/hr-ft-oF) Heat Capacity (BTU/lb-oF) Surface Short Wave Absorptivity GPS-6B GPS-6B GPS-6B GPS-6B GPS-6B GPS-6B GPS-6B GPS-6B GPS-6B GPS-6B GPS-6B GPS-6B GPS-6B SPS SPS SPS SPS SPS SPS SPS SPS SPS SPS SPS SPS SPS SPS SPS SPS SPS SPS SPS SPS SPS SPS SPS SPS SPS SPS SPS SPS SPS SPS SPS SPS SPS EE-2.33
206 Table A-3 Environmental / Climatic Properties Section Project Type Latitude N. (Deg) (min) Longitude W. (Deg) (min) Elevation (ft) GWT Depth 1 (ft) Source of Information GPS-6B USGS: water.usgs.gov/nwis/gwlevels GPS-6B USGS: water.usgs.gov/nwis/gwlevels SPS USGS: water.usgs.gov/nwis/gwlevels SPS USGS: water.usgs.gov/nwis/gwlevels SPS USGS: water.usgs.gov/nwis/gwlevels SPS USGS: water.usgs.gov/nwis/gwlevels SPS USGS: water.usgs.gov/nwis/gwlevels SPS USGS: water.usgs.gov/nwis/gwlevels SPS USGS: water.usgs.gov/nwis/gwlevels SPS USGS: water.usgs.gov/nwis/gwlevels GPS-6B TST_SAMPLE_LOG; DOT Communication SPS USGS: water.usgs.gov/nwis/gwlevels SPS USGS: water.usgs.gov/nwis/gwlevels SPS USGS: water.usgs.gov/nwis/gwlevels SPS USGS: water.usgs.gov/nwis/gwlevels SPS USGS: water.usgs.gov/nwis/gwlevels SPS USGS: water.usgs.gov/nwis/gwlevels SPS USGS: water.usgs.gov/nwis/gwlevels SPS USGS: water.usgs.gov/nwis/gwlevels SPS USGS: water.usgs.gov/nwis/gwlevels SPS USGS: water.usgs.gov/nwis/gwlevels SPS USGS: water.usgs.gov/nwis/gwlevels SPS USGS: water.usgs.gov/nwis/gwlevels SPS USGS: water.usgs.gov/nwis/gwlevels SPS USGS: water.usgs.gov/nwis/gwlevels SPS USGS: water.usgs.gov/nwis/gwlevels SPS USGS: water.usgs.gov/nwis/gwlevels SPS USGS: water.usgs.gov/nwis/gwlevels GPS-6B USGS: water.usgs.gov/nwis/gwlevels SPS USGS: water.usgs.gov/nwis/gwlevels SPS USGS: water.usgs.gov/nwis/gwlevels SPS USGS: water.usgs.gov/nwis/gwlevels SPS USGS: water.usgs.gov/nwis/gwlevels SPS USGS: water.usgs.gov/nwis/gwlevels SPS USGS: water.usgs.gov/nwis/gwlevels SPS USGS: water.usgs.gov/nwis/gwlevels SPS USGS: water.usgs.gov/nwis/gwlevels GPS-6B USGS; > 20 ft: Harold Von Quintus report GPS-6B TST_SAMPLE_LOG (Wet) GPS-6B > 84": Soil Conservation Service reports-h. Von Quintus GPS-6B > 84": Soil Conservation Service reports-h. Von Quintus GPS-6B USGS: water.usgs.gov/nwis/gwlevels GPS-6B TST_SAMPLE_LOG (Wet) GPS-6B TST_SAMPLE_LOG (Wet) GPS-6B Assumed from Regional Information GPS-6B Assumed from Regional Information 1 From pavemente surface EE-2.34
207 Table A-4a Original Pavement Structure Section Project Type No. of Layers Layer Number Layer 1 Type Thickness (in) Description Depth to Bedrock GPS-6B 5 1 SS Subgrade BR > 20 ft 2 GB 7.4 Base Layer (Soil Conservation Service report - HVQ) 3 AC 4.5 Binder Course 4 AC 2.8 Binder Course 5 AC 1 Original Surface Layer GPS-6B 5 1 SS Subgrade BR > 20 ft 2 GS 6 Subbase Layer (Soil Conservation Service report - HVQ) 3 GB 12.6 Base Layer 4 AC 2.2 Binder Course 5 AC 0.8 Original Surface Layer GPS-6B 4 1 SS Subgrade BR > 17 ft (TST_SAMPLE_LOG; rock refusal) 2 GS 12 Subbase Layer Infinite (Soil Conservation Service report - HVQ) 3 GB 3.3 Base Layer 4 AC 1.4 Original Surface Layer GPS-6B 3 1 SS Subgrade BR = Infinite 2 AC 3 Binder Course (Soil Conservation Service report - HVQ) 3 AC 2.4 Original Surface Layer GPS-6B 4 1 SS Subgrade BR = Infinite (Harold Von Quintus report) 2 GB 8.2 Base Layer BR = 2.5 ft (TST_SAMPLE_LOG - rock refusal) 3 AC 2.2 Binder Course 4 AC 2.2 Original Surface Layer GPS-6B 4 1 SS Subgrade BR = 20 ft 2 GB 17 Base Layer (Soil Conservation Service report - HVQ) 3 AC 2.4 Original Surface Layer 4 AC 0.5 Seal Coat GPS-6B 4 1 SS Subgrade BR = 50 ft ; soft shale 2 GB 11.5 Base Layer (Soil Conservation Service report - HVQ) 3 AC 0.7 Seal Coat 4 AC 0.8 Original Surface Layer GPS-6B 4 1 SS Subgrade BR = 50 ft ; soft shale 2 GB 10.9 Base Layer (Soil Conservation Service report - HVQ) 3 AC 0.5 Seal coat 4 AC 1 Original Surface Layer GPS-6B 5 1 SS Subgrade BR = 4 ft (TST_SAMPLE_LOG - refusal) 2 GS 6.5 Subbase Layer BR = 50 ft 3 GB 3 Base Layer (Soil Conservation Service report - HVQ) 4 AC 5.9 Binder Course 5 AC 3.6 Original Surface Layer GPS-6B 5 1 SS Subgrade BR= Infinite (Assumed) 2 GS 4.2 Subbase Layer 3 GB 4.5 Base Layer TST_LO5B 4 AC 2.2 Binder Course 5 AC 2 Original Surface Layer GPS-6B 6 1 SS Subgrade BR= Infinite (Assumed) 2 GS 3.7 Subbase Layer 3 GB 7.2 Base Layer 4 AC 2.1 Binder Course 5 AC 1.8 Original Surface Layer 6 AC 0.2 Seal Coat GPS-6B 5 1 SS Subgrade BR= Infinite (Assumed) 2 GS 4.2 Subbase Layer 3 GB 5.2 Base Layer 4 AC 3 Binder Course 5 AC 1.6 Original Surface Layer GPS-6B 5 1 SS Subgrade BR= Infinite (Assumed) 2 GS 4.8 Subbase Layer 3 GB 5 Base Layer 4 AC 2.9 Binder Course 5 AC 1.5 Original Surface Layer EE-2.35
208 Table A-4a (Cont d) Original Pavement Structure Section Project Type No. of Layers Layer Number Layer 1 Type Thickness (in) Description Depth to Bedrock SPS SS Subgrade BR > 50 ft 2 GB 14.7 Base Layer (Soil Conservation Service report - HVQ) 3 AC 4.2 Original Surface Layer 4 AC 0.9 Friction Course SPS SS Subgrade BR > 50 ft 2 GB 16.6 Base Layer (Soil Conservation Service report - HVQ) 3 AC 4.2 Original Surface Layer 4 AC 0.8 Friction Course SPS SS Subgrade BR > 50 ft 2 GB 17.6 Base Layer (Soil Conservation Service report - HVQ) 3 AC 4.2 Original Surface Layer 4 AC 0.7 Friction Course SPS SS Subgrade BR > 50 ft 2 GB 12.8 Base Layer (Soil Conservation Service report - HVQ) 3 AC 4.1 Original Surface Layer 4 AC 0.9 Friction Course SPS SS Subgrade BR > 50 ft 2 GB 12.8 Base Layer (Soil Conservation Service report - HVQ) 3 AC 4 Original Surface Layer 4 AC 0.9 Friction Course SPS SS Subgrade BR = 3 ft (TST_SAMPLE_LOG - rock refusal) 2 GB 20.7 Base Layer BR > 50 ft 3 AC 4.3 Original Surface Layer (Soil Conservation Service report - HVQ) 4 AC 0.7 Friction Course SPS SS Subgrade BR > 50 ft 2 GB 15 Base Layer (Soil Conservation Service report - HVQ) 3 AC 4.7 Original Surface Layer 4 AC 0.7 Friction Course SPS SS Subgrade BR > 50 ft 2 GB 14.8 Base Layer (Soil Conservation Service report - HVQ) 3 AC 4.7 Original Surface Layer 4 AC 0.7 Friction Course SPS SS Subgrade BR = 20 ft 2 GS 12.8 Subbase Layer (Soil Conservation Service report - HVQ) 3 GB 5 Base Layer 4 AC 5.4 Binder Course 5 AC 1.5 Original Surface Layer SPS SS Subgrade BR = 20 ft 2 GS 12.8 Subbase Layer (Soil Conservation Service report - HVQ) 3 GB 5 Base Layer 4 AC 5.4 Binder Course 5 AC 1.1 Original Surface Layer SPS SS Subgrade BR = 20 ft 2 GS 12 Subbase Layer (Soil Conservation Service report - HVQ) 3 GB 5.2 Base Layer 4 AC 5.2 Binder Course 5 AC 1.5 Original Surface Layer SPS SS Subgrade BR = 20 ft 2 GS 12.6 Subbase Layer (Soil Conservation Service report - HVQ) 3 GB 4.7 Base Layer 4 AC 5.6 Binder Course 5 AC 1.1 Original Surface Layer SPS SS Subgrade BR = 20 ft 2 GS 12.5 Subbase Layer (Soil Conservation Service report - HVQ) 3 GB 5 Base Layer 4 AC 5.9 Binder Course 5 AC 1.5 Original Surface Layer SPS SS Subgrade BR = 20 ft 2 GS 12.6 Subbase Layer (Soil Conservation Service report - HVQ) 3 GB 5.2 Base Layer 4 AC 5.8 Binder Course 5 AC 1.1 Original Surface Layer EE-2.36
209 Table A-4a (Cont d) Original Pavement Structure Section Project Type No. of Layers Layer Number Layer 1 Type Thickness (in) Description Depth to Bedrock SPS SS Subgrade BR = 20 ft 2 GS 12.4 Subbase Layer (Soil Conservation Service report - HVQ) 3 GB 5.1 Base Layer 4 AC 4.6 Binder Course 5 AC 1.5 Original Surface Layer SPS SS Subgrade BR = 20 ft 2 GS 12.6 Subbase Layer (Soil Conservation Service report - HVQ) 3 GB 5 Base Layer 4 AC 6 Binder Course 5 AC 1.5 Original Surface Layer SPS SS Subgrade BR = 20 ft 2 GS 14.4 Subbase Layer (Soil Conservation Service report - HVQ) 3 GB 2.8 Base Layer 4 AC 4.4 Original Surface Layer 5 AC 0.7 Friction Course SPS SS Subgrade BR = 20 ft 2 GS 14.5 Subbase Layer (Soil Conservation Service report - HVQ) 3 GB 4.3 Base Layer 4 AC 4.7 Original Surface Layer 5 AC 0.6 Friction Course SPS SS Subgrade BR = 20 ft 2 GS 15.6 Subbase Layer (Soil Conservation Service report - HVQ) 3 GB 3.5 Base Layer 4 AC 5.1 Original Surface Layer 5 AC 0.7 Friction Course SPS SS Subgrade BR = 20 ft 2 GS 15.3 Subbase Layer (Soil Conservation Service report - HVQ) 3 GB 2.8 Base Layer 4 AC 4.8 Original Surface Layer 5 AC 0.6 Friction Course SPS SS Subgrade BR = 20 ft 2 GS 15.3 Subbase Layer (Soil Conservation Service report - HVQ) 3 GB 2.8 Base Layer 4 AC 4.7 Original Surface Layer 5 AC 0.6 Friction Course SPS SS 234 Subgrade BR = 19.5 ft. (TST_HOLE_LOG - refusal) 2 GS 15.6 Subbase Layer BR = 21.9 ft 3 GB 3.5 Base Layer 4 AC 4.4 Original Surface Layer 5 AC 0.7 Friction Course SPS SS Subgrade BR = 20 ft 2 GS 14.8 Subbase Layer (Soil Conservation Service report - HVQ) 3 GB 4.3 Base Layer 4 AC 4.4 Original Surface Layer 5 AC 0.6 Friction Course SPS SS Subgrade BR = 20 ft 2 GS 15 Subbase Layer (Soil Conservation Service report - HVQ) 3 GB 3.8 Base Layer 4 AC 4.7 Original Surface Layer 5 AC 0.6 Friction Course GPS-6B 5 1 SS Subgrade BR = 20 ft 2 GS 15.9 Subbase Layer (Soil Conservation Service report - HVQ) 3 GB 3 Base Layer 4 AC 4.9 Original Surface Layer 5 AC 0.5 Friction course SPS SS Subgrade BR = 40 ft. to Infinite 2 GS 41 Subbase Layer (Soil Conservation Service report - HVQ) 3 GB 10.4 Base Layer 4 AC 6.2 Binder Course 5 AC 2.7 Original Surface Layer EE-2.37
210 Table A-4a (Cont d) Original Pavement Structure Section Project Type No. of Layers Layer Number Layer 1 Type Thickness (in) Description Depth to Bedrock SPS SS Subgrade BR = 40 ft. to Infinite 2 GS 15 Subbase Layer (Soil Conservation Service report - HVQ) 3 GS 4 Subbase Layer 4 GB 11.3 Base Layer 5 AC 6 Binder Course 6 AC 3 Original Surface Layer SPS SS Subgrade BR = 40 ft. to Infinite 2 GS 17 Subbase Layer (Soil Conservation Service report - HVQ) 3 GS 4 Subbase Layer 4 GB 10.7 Base Layer 5 AC 5.5 Binder Course 6 AC 3 Original Surface Layer SPS SS Subgrade BR = 40 ft. to Infinite 2 GS 16 Subbase Layer (Soil Conservation Service report - HVQ) 3 GS 4 Subbase Layer 4 GB 10 Base Layer 5 AC 6 Binder Course 6 AC 3 Original Surface Layer SPS SS Subgrade BR = 40 ft. to Infinite 2 GB 10 Base Layer (Soil Conservation Service report - HVQ) 3 AC 6.5 Binder Course 4 AC 3 Original Surface Layer SPS SS Subgrade BR = 40 ft. to Infinite 2 GS 54 Subbase Layer (Soil Conservation Service report - HVQ) 3 GB 10 Base Layer 4 AC 5.4 Binder Course 5 AC 3 Original Surface Layer SPS SS Subgrade BR = 40 ft. to Infinite 2 GS 18 Subbase Layer (Soil Conservation Service report - HVQ) 3 GS 4 Subbase Layer 4 GB 11.3 Base Layer 5 AC 6.1 Binder Course 6 AC 3 Original Surface Layer SPS SS Subgrade BR = 40 ft. to Infinite 2 GS 18 Subbase Layer (Soil Conservation Service report - HVQ) 3 GS 4 Subbase Layer 4 GB 11.3 Base Layer 5 AC 6.3 Binder Course 6 AC 3.2 Original Surface Layer 1 SS = Subgrade; GS = Granular Subbase; GB = Granular Base Course; AC = Asphalt Concrete EE-2.38
211 Table A-4b Pavement Structure after Rehabilitation Section Project Type No. of Layers Layer Number Layer Type Representative Thickness (in) Description Milling Information GPS-6B 7 1 SS Subgrade 2 GB 7.4 Base Layer 3 AC 4.5 Binder Course No milled out 4 AC 2.8 Binder Course 5 AC 1 Original Surface Layer 6 AC 0.4 Seal Coat Combine with Layer 7 7 AC 1.3 Overlay GPS-6B 6 1 SS Subgrade 2 GS 6 Subbase Layer 3 GB 12.6 Base Layer No milled out 4 AC 2.2 Binder Course 5 AC 0.8 Original Surface Layer 6 AC 1.5 Overlay GPS-6B 7 1 SS Subgrade 2 GS 12 Subbase Layer 3 GB 3.3 Base Layer No milled out 4 AC 1.4 Original Surface Layer 5 AC 1.5 Binder Course 6 AC 3.4 Overlay 7 AC 0.4 Overlay GPS-6B 4 1 SS Subgrade 2 AC 3 Binder Course 3 AC 2.4 Original Surface Layer No milled out 4 AC 3.9 Overlay GPS-6B 5 1 SS Subgrade 2 GB 8.2 Base Layer 3 AC 2.3 Binder Course No milled out 4 AC 2.2 Original Surface Layer 5 AC 0.9 Overlay GPS-6B 6 1 SS Subgrade 2 GB 17 Base Layer 3 AC 2.4 Original Surface Layer No milled out 4 AC 0.5 Seal Coat 5 AC 0.6 Seal Coat 6 AC 1.9 Overlay GPS-6B 7 1 SS Subgrade 2 GB 11.5 Base Layer 3 AC 0.7 Seal Coat No milled out 4 AC 0.8 Original Surface Layer 5 AC 0.5 Seal Coat 6 AC 2.2 Binder Course 7 AC 1.2 Overlay GPS-6B 5 1 SS Subgrade 2 GB 10.9 Base Layer 3 AC 0.5 Interlayer No milled out 4 AC 1 Original Surface Layer 5 AC 1.7 Overlay 6 AC 2 Overlay GPS-6B 6 1 SS Subgrade 2 GS 6.5 Subbase Layer 3 GB 3 Base Layer 4 AC 5.9 Binder Course No milled out 5 AC 3.6 Original Surface Layer 6 AC 2.3 Overlay GPS-6B 7 1 SS Subgrade 2 GS 4.2 Subbase Layer No milled out 3 GB 4.5 Base Layer 4 AC 2.2 Binder Course 5 AC 2 Original Surface Layer 6 AC 0.2 Seal Coat 7 AC 5.9 Overlay EE-2.39
212 Table A-4b (Cont d) Pavement Structure after Rehabilitation Section Project Type No. of Layers Layer Number Layer Type Representative Thickness (in) Description Milling Information GPS-6B 7 1 SS Subgrade 2 GS 3.7 Subbase Layer No milled out 3 GB 7.2 Base Layer 4 AC 2.1 Binder Course 5 AC 1.8 Original Surface Layer 6 AC 0.2 Seal Coat 7 AC 2.6 Overlay GPS-6B 6 1 SS Subgrade 2 GS 4.2 Subbase Layer No milled out 3 GB 5.2 Base Layer 4 AC 3 Binder Course 5 AC 1.6 Original Surface Layer 6 AC 2.2 Overlay GPS-6B 6 1 SS Subgrade 2 GS 4.8 Subbase Layer No milled out 3 GB 5 Base Layer 4 AC 2.9 Binder Course 5 AC 1.5 Original Surface Layer 6 AC 4 Overlay SPS SS Subgrade 2 GB 14.7 Base Layer 3 AC 4.2 Original Surface Layer 0.9 in.milled out 4 AC 0 Friction Course 5 AC 2.7 Overlay SPS SS Subgrade 2 GB 16.6 Base Layer 3 AC 4.2 Original Surface Layer 0.8 in. milled out 4 AC 0 Friction Course 5 AC 4.7 Overlay SPS SS Subgrade 2 GB 17.6 Base Layer 3 AC 4.2 Original Surface Layer 0.7 in. Milled out 4 AC 0 Friction Course 5 AC 4.8 Overlay SPS SS Subgrade 2 GB 12.8 Base Layer 3 AC 4.1 Original Surface Layer 0.9 in. milledout 4 AC 0 Friction Course 5 AC 2.8 Overlay SPS SS Subgrade 2 GB 12.8 Base Layer 3 AC 3 Original Surface Layer 0.9 in.milled out 4 AC 0 Friction Course 5 AC 2.8 Binder Course 6 AC 2.4 Overlay SPS SS Subgrade 2 GB 20.7 Base Layer 3 AC 2.4 Original Surface Layer 4 AC 0 Friction Course 2.6 in. milled out 5 AC 2.7 Binder Course 6 AC 4.1 Overlay SPS SS Subgrade 2 GB 15 Base Layer 3 AC 2.7 Original Surface Layer 2.7 in. milled out 4 AC 0 Friction Course 5 AC 2.4 Binder Course 6 AC 4.1 Overlay SPS SS Subgrade 2 GB 14.8 Base Layer 3 AC 2.6 Original Surface Layer 2.8 in. milled out 4 AC 0 Friction Course 5 AC 2.6 Binder Course 6 AC 1.3 Overlay EE-2.40
213 Table A-4b (Cont d) Pavement Structure after Rehabilitation Section Project Type No. of Layers Layer Number Layer Type Representative Thickness (in) SPS SS Subgrade Description 2 GS 12.8 Subbase Layer Milling Information 3 GB 5 Base Layer No milled out 4 AC 5.4 Binder Course 5 AC 1.5 Original Surface Layer 6 AC 2.4 Overlay SPS SS Subgrade 2 GS 12.8 Subbase Layer 3 GB 5 Base Layer No milled out 4 AC 5.4 Binder Course 5 AC 1.1 Original Surface Layer 6 AC 3.1 Binder Course 7 AC 1.5 Overlay SPS SS Subgrade 2 GS 12 Subbase Layer 3 GB 5.2 Base Layer No milled out 4 AC 5.2 Binder Course 5 AC 1.5 Original Surface Layer 6 AC 3.1 Binder Course 7 AC 1.5 Overlay SPS SS Subgrade 2 GS 12.6 Subbase Layer 3 GB 4.7 Base Layer No milled out 4 AC 5.6 Binder Course 5 AC 1.1 Original Surface Layer 6 AC 1.9 Overlay SPS SS Subgrade 2 GS 12.5 Subbase Layer 3 GB 5 Base Layer 0.5 in. milled out 4 AC 5.4 Binder Course 5 AC 0 Original Surface Layer 6 AC 1.8 Overlay SPS SS Subgrade 2 GS 12.6 Subbase Layer 3 GB 5.2 Base Layer 0.7 in. milled out 4 AC 5.1 Binder Course 5 AC 0 Original Surface Layer 6 AC 4.1 Binder Course 7 AC 1.5 Overlay SPS SS Subgrade 2 GS 12.4 Subbase Layer 3 GB 5.1 Base Layer 0.5 in. milled out 4 AC 4.1 Binder Course 5 AC 0 Original Surface Layer 6 AC 2.7 Binder Course 7 AC 1.5 Overlay SPS SS Subgrade 2 GS 12.6 Subbase Layer 3 GB 5 Base Layer 2 in. milled out 4 AC 5.5 Binder Course 5 AC 0 Original Surface Layer 6 AC 1.5 Overlay SPS SS Subgrade 2 GS 14.4 Subbase Layer 3 GB 2.8 Base Layer 0.8 in. milled out 4 AC 4.3 Original Surface Layer 5 AC 0 Friction Course 6 AC 2.6 Overlay EE-2.41
214 Table A-4b (Cont d) Pavement Structure after Rehabilitation Section Project Type No. of Layers Layer Number Layer Type Representative Thickness (in) Description Milling Information SPS SS Subgrade 2 GS 14.5 Subbase Layer 3 GB 4.2 Base Layer 1.1 in. milled out 4 AC 4.2 Original Surface Layer 5 AC 0 Friction Course 6 AC 4.6 Overlay SPS SS Subgrade 2 GS 15.6 Subbase Layer 3 GB 3.5 Base Layer 1.4 in. milled out 4 AC 4.4 Original Surface Layer 5 AC 0 Friction Course 6 AC 5.6 Overlay SPS SS Subgrade 2 GS 15.3 Subbase Layer 3 GB 2.8 Base Layer 0.6 in. milled out 4 AC 4.8 Original Surface Layer 5 AC 0 Friction Course 6 AC 2 Overlay SPS SS Subgrade 2 GS 15.3 Subbase Layer 3 GB 2.8 Base Layer 2.7 in. milled out 4 AC 2.6 Original Surface Layer 5 AC 0 Friction Course 6 AC 2.1 Binder Course 7 AC 2.1 Overlay SPS SS 234 Subgrade 2 GS 15.6 Subbase Layer 3 GB 3.5 Base Layer 2.8 in. milled out 4 AC 2.3 Original Surface Layer 5 AC 0 Friction Course 6 AC 2.3 Binder Course 7 AC 4.9 Overlay SPS SS Subgrade 2 GS 14.7 Subbase Layer 3 GB 4.2 Base Layer 2.8 in. milled out 4 AC 2.2 Original Surface Layer 5 AC 0 Friction Course 6 AC 2.1 Binder Course 7 AC 5 Overlay SPS SS Subgrade 2 GS 15 Subbase Layer 3 GB 3.8 Base Layer 2.6 in. milled out 4 AC 2.7 Original Surface Layer 5 AC 0 Friction Course 6 AC 2.1 Binder Course 7 AC 2.4 Overlay GPS-6B 6 1 SS Subgrade 2 GS 15.9 Subbase Layer 3 GB 3 Base Layer 0.5 in. milled out 4 AC 4.9 Original Surface Layer 5 AC 0 Friction Course 6 AC 1.7 Overlay SPS SS Subgrade 2 GS 41 Subbase Layer 3 GB 10.4 Base Layer No milled out 4 AC 6.2 Binder Course 5 AC 2.7 Original Surface Layer 6 AC 1.9 Overlay EE-2.42
215 Table A-4b (Cont d) Pavement Structure after Rehabilitation Section Project Type No. of Layers Layer Number Layer Type Representative Thickness (in) Description Milling Information SPS SS Subgrade 2 GS 18 Subbase Layer 3 GS 4 Subbase Layer No milled out 4 GB 11.3 Base Layer 5 AC 6 Binder Course 6 AC 3 Original Surface Layer 7 AC 3 Binder Course 8 AC 1.7 Overlay SPS SS Subgrade 2 GS 17 Subbase Layer 3 GS 4 Subbase Layer No milled out 4 GB 10.7 Base Layer 5 AC 5.5 Binder Course 6 AC 3 Original Surface Layer 7 AC 2.9 Binder Course 8 AC 1.8 Overlay SPS SS Subgrade 2 GS 16 Subbase Layer 3 GS 4 Subbase Layer No milled out 4 GB 10 Base Layer 5 AC 6 Binder Course 6 AC 3 Original Surface Layer 7 AC 1.8 Overlay SPS SS Subgrade 2 GB 10 Base Layer 3 AC 6.5 Binder Course 2 in. milled out 4 AC 1 Original Surface Layer 5 AC 2.2 Binder Course 6 AC 2 Overlay SPS SS Subgrade 2 GS 54 Subbase Layer 3 GB 10 Base Layer 2 in. milled out 4 AC 5.4 Binder Course 5 AC 1 Original Surface Layer 6 AC 3 Binder Course 7 AC 2.9 Binder Course 8 AC 1.9 Overlay SPS SS Subgrade 2 GS 18 Subbase Layer 3 GS 4 Subbase Layer 2 in. milled out 4 GB 11.3 Base Layer 5 AC 6.1 Binder Course 6 AC 1 Original Surface Layer 7 AC 2.7 Binder Course 8 AC 3.3 Binder Course 9 AC 1.8 Overlay SPS SS Subgrade 2 GS 18 Subbase Layer 3 GS 4 Subbase Layer 2 in. milled out 4 GB 11.3 Base Layer 5 AC 6.3 Binder Course 6 AC 1.2 Original Surface Layer 7 AC 2.5 Binder Course 8 AC 1.8 Overlay EE-2.43
216 Table A-5 Aggregate Gradation for Asphalt Mixtures Section Project Type Layer Number Layer Type % Retained 3/4" Sieve % Retained 3/8" Sieve %Retained #4 Sieve % Passing #200 Sieve GPS-6B 3 AC AC AC TST_AG04 6 AC Assumed Source of Information 7 AC Harold VonQuintus GPS-6B 4 AC AC TST_AG04 6 AC GPS-6B 4 AC TST_AG04 5 AC RHB_ACO_AGGR_PROP 6 AC RHB_ACO_AGGR_PROP 7 AC Assumed GPS-6B 2 AC AC AC GPS-6B 3 AC AC AC GPS-6B 3 AC AC Assumed 5 AC Assumed 6 AC GPS-6B 3 AC Assumed 4 AC AC Assumed 6 AC AC GPS-6B 3 AC Assumed 4 AC AC AC GPS-6B 4 AC AC AC GPS-6B 4 AC AC AC AC GPS-6B 4 AC AC AC Assumed 7 AC GPS-6B 4 AC AC AC GPS-6B 4 AC % retained 3/8" estimated 5 AC % retained 3/8" estimated 6 AC % retained 3/8" estimated SPS-5 3 AC TST_AG04 4 AC Assumed 5 AC SPS-5 3 AC % retained #4 estimated 4 AC Assumed 5 AC SPS-5 3 AC % retained #4 estimated 4 AC Assumed 5 AC RHB_ACO_AGGR_PROP SPS-5 3 AC AC Assumed 5 AC EE-2.44
217 Table A-5 (Cont d) Aggregate Gradation for Asphalt Mixtures Section Project Type Layer Number Layer Type % Retained 3/4" Sieve % Retained 3/8" Sieve %Retained #4 Sieve % Passing #200 Sieve Source of Information SPS-5 3 AC AC Assumed 5 AC AC SPS-5 3 AC AC Assumed 5 AC AC SPS-5 3 AC AC Assumed 5 AC AC SPS-5 3 AC AC Assumed 5 AC AC SPS-5 4 AC Harold Von Quintus 5 AC Harold Von Quintus 6 AC % retained #4 estimated SPS-5 4 AC Harold Von Quintus 5 AC Harold Von Quintus 6 AC Assumed 7 AC % retained #4 estimated SPS-5 4 AC Harold Von Quintus 5 AC Harold Von Quintus 6 AC Assumed 7 AC % retained #4 estimated SPS-5 4 AC Harold Von Quintus 5 AC Harold Von Quintus 6 AC % retained #4 estimated SPS-5 4 AC Harold Von Quintus 5 AC Harold Von Quintus 6 AC % retained #4 estimated SPS-5 4 AC Harold Von Quintus 5 AC Harold Von Quintus 6 AC Assumed 7 AC % retained #4 estimated SPS-5 4 AC Harold Von Quintus 5 AC Harold Von Quintus 6 AC Assumed 7 AC % retained #4 estimated SPS-5 4 AC Harold Von Quintus 5 AC Harold Von Quintus 6 AC % retained #4 estimated SPS-5 4 AC AC INV_GRADATION 6 AC SPS-5 4 AC AC AC SPS-5 4 AC AC AC SPS-5 4 AC AC AC SPS-5 4 AC AC AC AC EE-2.45
218 Table A-5 (Cont d) Aggregate Gradation for Asphalt Mixtures Section Project Type Layer Number Layer Type % Retained 3/4" Sieve % Retained 3/8" Sieve %Retained #4 Sieve % Passing #200 Sieve Source of Information SPS-5 4 AC AC AC AC SPS-5 4 AC TST_AG04 5 AC AC AC SPS-5 4 AC TST_AG04 5 AC AC AC SPS-5 4 AC AC Assumed 6 AC SPS-5 4 AC AC AC SPS-5 5 AC AC AC AC SPS-5 5 AC AC AC AC SPS-5 5 AC AC AC SPS-5 3 AC AC AC AC SPS-5 4 AC AC AC Assumed 7 AC AC SPS-5 5 AC AC AC Assumed 8 AC AC SPS-5 5 AC AC AC AC EE-2.46
219 Table A-6 Effective Binder Content Section Layer Number Pb (%) Est. Va Original (%) 1 Gb Est. Gmb Gmm Gsb Gse INV_PMA_ASPHALT Est. Vbe Vbe Sources of Information TST_AC04; INV_PMA_ASPHALT Assumed; INV_PMA_ASPHALT Pb, Gsb assumed INV_PMA_ORIG_MIX; INV_PMA INV_PMA_ORIG_MIX;INV_PMA Gsb assumed INV_PMA_ORIG_MIX; TST_AC04; INV_PMA TST_AC03; TST_AC04;RHB_ACO_AGGR_PROP TST_AC03; TST_AC04; Gsb assumed Pb, Gmm, Gsb assumed TST_AC04;INV_PMA Gsb assumed RHB_ACO_MIX_PROP; TST_AC04; Gsb assumed INV_PMA_ORIG_MIX; TST_AC04; INV_PMA INV_PMA_ORIG_MIX; TST_AC04; INV_PMA RHB_ACO_MIX_PROP; RHB_ACO_AGGR_PROP INV_PMA_ORIG_MIX; Gsb assumed RHB_ACO_MIX_PROP; RHB_ACO_AGGR_PMA INV_PMA Gmm assumed RHB_ACO_AGGR_PROP; Gmm assumed RHB_ACO_AGGR_PROP; Gmm assumed INV_PMA; Gmm assumed RHB_ACO_MIX_PROP; RHB_ACO_AGGR_PROP RHB_ACO_MIX_PROP; RHB_ACO_PROP; RHB_ACO_AGGR_P TST_AC04; Gsb assumed TST_AC04; Gsb assumed RHB_ACO_AGGR_PROP INV_PMA_ORIG_MIX; TST_AC04;INV_PMA RHB_ACO_MIX_PROP; TST_AC04; RHB_ACO_AGGR_PROP TST_AC04; Gmm assumed INV_PMA_ORIG_MIX; INV_PMA RHB_ACO_MIX_PROP;RHB_ACO_AGGR_PROP INV_PMA_ORIG_MIX INV_PMA RHB_ACO_MIX_PROP; Gsb assumed INV_PMA_ORIG_MIX INV_PMA RHB_ACO_MIX_PROP; Gsb assumed TST_AC04; Gsb assumed RHB_HMRAP_NEW_AC_PROP RHB_HMRAP_LAB_MIX RHB_ACO_AGGR_PROP TST_AC RHB_ACO_AGGR_PROP EE-2.47
220 Table A-6 (Cont d) Effective Binder Content Section Layer Number Pb (%) Est. Va Original (%) 1 Gb Est. Gmb Gmm Gsb Gse Est. Vbe Vbe Sources of Information RHB_ACO-LAB-MIX; RHB_ACO_AGGR_PROP RHB_ACO_AGGR_PROP TST_AC RHB_ACO-LAB-MIX; RHB_ACO_AGGR_PROP RHB_ACO_AGGR_PROP RHB_HMRAP_LAB_MIX RHB_HMRAP_LAB_MIX RHB_HMRAP_LAB_MIX RHB_HMRAP_LAB_MIX Vbe assumed Vbe assumed Vbe assumed Vbe assumed Vbe assumed TST_AC03; Pb, Gsb assumed Vbe assumed Vbe assumed TST_AC03; Pb, Gsb assumed Vbe assumed Vbe assumed TST_AC03; Pb, Gsb assumed Vbe assumed Vbe assumed Vbe assumed Gsb assumed TST_AC04; G sb CALCULATED RHB_HMRAP_LAB_MIX; Gsb CALCULATED RHB_ACO_LAB_MIX TST_AC03; TST_AC RHB_ACO_LAB_MIX RHB_ACO_LAB_MIX RHB_ACO_LAB_MIX EE-2.48
221 Table A-6 (Cont d) Effective Binder Content Section Layer Number Pb (%) Est. Va Original (%) 1 Gb Est. Gmb Gmm Gsb Gse Est. Vbe Vbe Sources of Information TST_AC RHB_HMRAP_LAB_MIX; G sb CALCULATED RHB_HMRAP_LAB_MIX; Gsb CALCULATED TST_AC03: TST_AC INV_PMA_ORIG_MIX; Gmm assumed; Gsb assumed INV_PMA_ORIG_MIX; Gmm assumed; Gsb assumed INV_PMA_ORIG_MIX INV_PMA_ORIG_MIX INV_PMA_ORIG_MIX INV_PMA_ORIG_MIX INV_PMA_ORIG_MIX INV_PMA_ORIG_MIX INV_PMA_ORIG_MIX INV_PMA_ORIG_MIX INV_PMA_ORIG_MIX INV_PMA_ORIG_MIX INV_PMA_ORIG_MIX INV_PMA_ORIG_MIX INV_PMA_ORIG_MIX INV_PMA_ORIG_MIX From Table A-7 EE-2.49
222 Table A-7 Air Voids Section Layer Num Air Voids at Age = t (%) Date Completed Age t (months) Maat ( o F) Original Air Voids (%) 1 Source of Information Est. Original Air Voids (%) Total Unit Weight (pcf) Layer < 1". Join with Layer INV_PMA_ORIG_MIX /16/ /16/ /16/ Layer < 1". Join with Layer RHB_ACO_MIX_PROP INV_PMA_ORIG_MIX RHB_ACO_MIX_PROP Layer < 1". Join with Layer Layer < 1". Join with Layer RHB_ACO_MIX_PROP Layer < 1". Join with Layer Layer < 1". Join with Layer RHB_ACO_MIX_PROP RHB_ACO_MIX_PROP Layer < 1". Join with Layer Layer < 1". Join with Layer INV_PMA_ORIG_MIX INV_PMA_ORIG_MIX RHB_ACO_MIX_PROP Layer < 1". Join with Layer /8/ RHB_HMRAP_LAB_MIX Layer < 1". Join with Layer /3/ RHB_HMRAP_LAB_MIX Layer < 1". Join with Layer /24/ RHB_ACO_LAB_MIX Layer < 1". Join with Layer /24/ RHB_ACO_LAB_MIX 6.10 EE-2.50
223 Table A-7 (Cont d) Air Voids Section Layer Num Air Voids at Age = t (%) Date Completed Age t (months) Maat ( o F) Original Air Voids (%) 1 Source of Information Est. Original Air Voids (%) Total Unit Weight (pcf) Layer < 1". Join with Layer /24/ RHB_ACO_LAB_MIX Layer < 1". Join with Layer /24/ RHB_ACO_LAB_MIX /24/ RHB_ACO_LAB_MIX Layer < 1". Join with Layer /24/ RHB_HMRAP_LAB_MIX /24/ RHB_HMRAP_LAB_MIX Layer < 1". Join with Layer /2/ RHB_HMRAP_LAB_MIX /8/ RHB_HMRAP_LAB_MIX INV_PMA_ORIG_MIX Assumed Layer < 1". Join with Layer /1/ RHB_ACO_LAB_MIX /1/ RHB_ACO_LAB_MIX INV_PMA_ORIG_MIX Assumed Layer < 1". Join with Layer /1/ RHB_ACO_LAB_MIX INV_PMA_ORIG_MIX Assumed Layer < 1". Join with Layer /1/ RHB_ACO_LAB_MIX Layer < 1". Join with Layer /1/ RHB_ACO_LAB_MIX /1/ RHB_ACO_LAB_MIX Layer < 1". Join with Layer /3/ EE-2.51
224 Table A-7 (Cont d) Air Voids Section Layer Num Air Voids at Age = t (%) Date Completed Age t (months) Maat ( o F) Original Air Voids (%) 1 Source of Information Est. Original Air Voids (%) INV_PMA_ORIG_MIX Layer < 1". Join with Layer INV_PMA_ORIG_MIX Layer < 1". Join with Layer INV_PMA_ORIG_MIX Layer < 1". Join with Layer INV_PMA_ORIG_MIX Layer < 1". Join with Layer Layer < 1". Join with Layer INV_PMA_ORIG_MIX Layer < 1". Join with Layer Layer < 1". Join with Layer INV_PMA_ORIG_MIX Layer < 1". Join with Layer Layer < 1". Join with Layer INV_PMA_ORIG_MIX INV_PMA_ORIG_MIX Assumed INV_PMA_ORIG_MIX INV_PMA_ORIG_MIX Assumed INV_PMA_ORIG_MIX INV_PMA_ORIG_MIX Assumed INV_PMA_ORIG_MIX INV_PMA_ORIG_MIX Assumed INV_PMA_ORIG_MIX INV_PMA_ORIG_MIX Assumed Assumed INV_PMA_ORIG_MIX INV_PMA_ORIG_MIX Assumed Assumed INV_PMA_ORIG_MIX INV_PMA_ORIG_MIX Assumed Assumed 7.00 Total Unit Weight (pcf) EE-2.52
225 Table A-7 (Cont d) Air Voids Section Layer Num Air Voids at Age = t (%) Date Completed Age t (months) Maat ( o F) Original Air Voids (%) 1 Source of Information Est. Original Air Voids (%) Total Unit Weight (pcf) INV_PMA_ORIG_MIX INV_PMA_ORIG_MIX Assumed Assumed From LTPP database EE-2.53
226 Table A-8 Asphalt Binder Grade Section Layer Number Viscosity Grade Penetration Grade Pen 77 o F Visc 140 o F (Poises) Comments AC-20 From INV_PMA_ASPHALT 4 AC-20 From INV_PMA_ASPHALT 5 AC-20 From INV_PMA_ASPHALT 6 AC-20 Assumed 7 AC-20 Assumed AC From INV_PMA_ASPHALT 5 AC From INV_PMA_ASPHALT 6 AC-20 Assumed Pen From INV_PMA_ASPHALT 5 Pen Assumed 6 Pen Assumed 7 Pen Assumed Pen From penetration data 3 Pen Assumed 4 Pen From penetration data AC From INV_PMA_ASPHALT 4 AC From INV_PMA_ASPHALT 5 AC-20 Assumed Pen From penetration data 4 Pen Pen AC From INV_PMA_ASPHALT AC-20 4 AC From INV_PMA_ASPHALT 5 AC-20 6 AC-20 Assumed 7 AC-20 Assumed AC-20 4 AC From INV_PMA_ASPHALT 5 AC From viscosity data Pen From INV_PMA_ASPHALT 5 Pen From INV_PMA_ASPHALT 6 Pen Assumed Cutback Asphalt 3000 From INV_PMA_ASPHALT 5 AC Assumed 6 AC-10 Assumed 7 AC-10 Assumed Cutback Asphalt 3000 From INV_PMA_ASPHALT 5 AC From viscosity data 6 AC-10 Assumed 7 AC-10 Assumed AC-6 Assumed 5 AC-6 From INV_PMA_ASPHALT 6 AC-6 Assumed AC-6 Assumed 5 AC-6 From INV_PMA_ASPHALT 6 AC-6 Assumed Pen Pen AC Pen Pen AC Pen Pen AC Pen Pen AC Pen Pen AC-40 6 AC-40 EE-2.54
227 Table A-8 (Cont d) Asphalt Binder Grade Section Layer Number Viscosity Grade Penetration Grade Pen 77 o F Visc 140 o F (Poises) Comments Pen Pen AC-40 6 AC Pen Pen AC-20 6 AC Pen Pen AC-20 6 AC Pen Assumed 5 Pen Assumed 6 Pen Assumed Pen Assumed 5 Pen Assumed 6 Pen Assumed 7 Pen Assumed Pen Assumed 5 Pen Assumed 6 Pen Assumed 7 Pen Assumed Pen Assumed 5 Pen Assumed 6 Pen Assumed Pen Assumed 5 Pen Assumed 6 Pen Assumed Pen Assumed 5 Pen Assumed 6 Pen Assumed 7 Pen Assumed Pen Assumed 5 Pen Assumed 6 Pen Assumed 7 Pen Assumed Pen Assumed 5 Pen Assumed 6 Pen Assumed Pen Pen AC Pen Pen AC Pen Pen Pen Pen Pen Pen Pen Pen Pen AC Pen Pen Pen Pen Pen Pen Pen Pen EE-2.55
228 Table A-8 (Cont d) Asphalt Binder Grade Section Layer Number Viscosity Grade Penetration Grade Pen 77 o F Visc 140 o F (Poises) Comments Pen Pen Pen Pen Pen Pen Pen Pen Pen Pen Assumed Pen Pen Pen Assumed 8 Pen Pen Pen Pen Pen Pen Pen Pen Pen Pen Pen Pen Pen Pen Pen Assumed 7 Pen Pen Pen Pen Pen Pen Pen Pen Pen Pen Pen EE-2.56
229 Table A-9a Unbound Materials Data Section Layer Number Layer Type Liquid Limit (LL) Plastic Limit (PL) Plasticity Index (PI) % Passing #200 Sieve % Passing #4 Sieve Diameter D 60 (mm) AASHTO CLASS USCS CLASS SS A-4 CL 2 GB 0 0 NP A-1-a GP-GM SS A-2-4 SM 2 GS 0 0 NP A-1-b SP-SM 3 GB A-2-4 SM SS A-2-4 SW 2 GS NP A-2-4 SM 3 GB NP A-4 SM SS A-4 ML SS A-7-5 ML 2 GB NP A-1-a GP-GM SS A-2-4 SM 2 GB NP A-1-b GP-GM TST_UG04_SS SS A-6 CL TST_UG04_SS03 2 GB A-2-5 SM SS A-6 CL TST_UG04_SS03 2 GB A-2-4 CL-ML SS 0 0 NP A-2-4 GM 2 GS 0 0 NP A-1-a GW 3 GB 0 0 NP A-1-a GP-GM SS 0 0 NP A-2-4 SP-SM 2 GS 0 0 NP A-1-a SM 3 GB 0 0 NP A-1-a SW-SM SS 0 0 NP A-2-4 SP-SM 2 GS 0 0 NP A-1-a SW-SM 3 GB 0 0 NP A-1-a SW-SM SS 0 0 NP A-4 SM 2 GS 0 0 NP A-2-4 ML 3 GB 0 0 NP A-1-b SW-SM SS 0 0 NP A-4 SM 2 GS 0 0 NP A-2-4 SM 3 GB 0 0 NP A-1-b SW-SM SS A-2-4 SC 2 GB 0 0 NP A-1-b SW-SM Source SS A-2-4 SC Assumed same as Section GB NP A-1-a SW Assumed same as Section SS A-2-4 SC 2 GB NP A-1-b SW SS A-4 SC Assumed same as Section GB NP A-1-b SW-SM Assumed same as Section SS A-4 SC 2 GB NP A-1-b SW-SM SS A-2-4 SC 2 GB NP A-1-b SW-SM SS A-1-b SC Assumed same as Section GB NP A-1-b SP-SM Assumed same as Section SS A-1-b SC 2 GB NP A-1-b SP-SM SS A-2-4 SC Assumed same as Section GS NP A-1-b SP-SM Assumed same as Section GB NP A-1-b SW-SM Assumed same as Section SS A-2-4 SC Assumed same as Section GS NP A-1-b SP-SM Assumed same as Section GB NP A-1-b SW-SM Assumed same as Section SS A-6 SC Assumed same as Section GS 0 0 NP A-1-b SW-SM Assumed same as Section GB 0 0 NP A-1-b SW-SM Assumed same as Section SS A-6 SC 2 GS 0 0 NP A-1-b SW-SM 3 GB 0 0 NP A-1-b SW-SM SS A-6 SC Assumed same as Section GS 0 0 NP A-1-b SW-SM Assumed same as Section GB 0 0 NP A-1-b SW-SM Assumed same as Section EE-2.57
230 Table A-9a (Cont d) Unbound Materials Data Section Layer Number Layer Type Liquid Limit (LL) Plastic Limit (PL) Plasticity Index (PI) % Passing #200 Sieve % Passing #4 Sieve Diameter D 60 (mm) AASHTO CLASS USCS CLASS SS A-6 SC 2 GS 0 0 NP A-1-b SW-SM 3 GB A-1-b SW-SM SS A-2-4 SC 2 GS 16 0 NP A-1-b SW-SM 3 GB 0 0 NP A-1-b SW-SM Source SS A-2-4 SC Assumed same as Section GS 16 0 NP A-1-b SW-SM Assumed same as Section GB 0 0 NP A-1-b SW-SM Assumed same as Section SS A-2-6 GC Assumed same as Section GS 21 0 NP A-1-a GP-GM Assumed same as Section GB NP A-1-a GP-GM Assumed same as Section SS A-2-6 GC Assumed same as Section GS 21 0 NP A-1-a GP-GM Assumed same as Section GB NP A-1-a GP-GM Assumed same as Section SS A-2-6 GC Assumed same as Section GS 21 0 NP A-1-a GP-GM Assumed same as Section GB NP A-1-a GP-GM Assumed same as Section SS A-2-6 GC 2 GS 21 0 NP A-1-a GP-GM 3 GB NP A-1-a GP-GM SS A-2-6 GC 2 GS 21 0 NP A-1-a GP-GM 3 GB NP A-1-a GP-GM SS A-6 GC Assumed same as Section GS 21 0 NP A-1-a GW-GM Assumed same as Section GB 20 0 NP A-1-a SM Assumed same as Section SS A-6 GC 2 GS 21 0 NP A-1-a GW-GM 3 GB 20 0 NP A-1-a SM SS A-6 GC Assumed same as Section GS 21 0 NP A-1-a GW-GM Assumed same as Section GB 20 0 NP A-1-a SM Assumed same as Section SS A-6 CL 2 GS 0 0 NP A-1-a GP-GM 3 GB 0 0 NP A-1-a SP-SM SS NP A-2-4 SM 2 GS NP A-1-b SW-SM 3 GB NP A-1-a SP-SM SS NP A-2-4 SM 2 GS NP A-1-b SP-SM 3 GS NP A-1-b SW-SM Assumed same as Section GB NP A-1-a SP-SM SS NP A-2-4 SM Assumed same as Section GS NP A-1-b SP-SM Assumed same as Section GS NP A-1-b SW-SM Assumed same as Section GB NP A-1-a SP-SM Assumed same as Section SS NP A-2-4 SM 2 GS NP A-1-b SW-SM 3 GS NP A-1-b SW-SM Assumed same as Section GB NP A-1-a SW-SM SS NP A-2-4 SM Assumed same as Section GB NP A-1-a SW-SM Assumed same as Section SS NP A-2-4 SM Assumed same as Section GS NP A-1-b SW-SM Assumed same as Section GB NP A-1-a SW-SM Assumed same as Section SS NP A-2-4 SM Assumed same as Section GS NP A-1-b SW-SM Assumed same as Section GS NP A-1-b SW-SM Assumed same as Section GB NP A-1-a SW-SM Assumed same as Section SS NP A-2-4 SM Assumed same as Section GS NP A-1-b SW-SM Assumed same as Section GS NP A-1-b SW-SM Assumed same as Section GB NP A-1-a SW-SM Assumed same as Section EE-2.58

231 Table A-9b Unbound Materials Gradation Data EE-2.59

232 Table A-9b (Cont d) Unbound Materials Gradation Data EE-2.60

233 Table A-9b (Cont d) Unbound Materials Gradation Data EE-2.61

234 Table A-9b (Cont d) Unbound Materials Gradation Data EE-2.62

235 Table A-9b (Cont d) Unbound Materials Gradation Data EE-2.63
Guide for Mechanistic-Empirical Design
 Copy No. Guide for Mechanistic-Empirical Design OF NEW AND REHABILITATED PAVEMENT STRUCTURES FINAL DOCUMENT APPENDIX BB: DESIGN RELIABILITY NCHRP Prepared for National Cooperative Highway Research Program
Flexible Pavement Design
 Flexible Pavement Design The Mechanistic-Empirical Way Presented by: Keith D. Herbold, P.E. 1 Presentation Outline What s new in flexible design Example of new design Differences Capabilities Tests and
Mechanistic-Empirical Pavement Design Guide Distress Models
 Mechanistic-Empirical Pavement Design Guide Distress Models By: Mohamed El-Basyouny Arizona State University Pavement Performance Models Symposium Laramie - Wyoming June 23, 2006 Outline Analysis Methodology
2008 SEAUPG CONFERENCE-BIRMINGHAM, ALABAMA
 Introduction Overview M E E Design Inputs MEPDG Where are we now MEPDG Inputs, Outputs, and Sensitivity Southeast Asphalt User Producer Group Bill Vavrik 19 November 2008 2 Implementation Timeframe DARWin
2002 Design Guide Preparing for Implementation
 2002 Preparing for Implementation By Monte Symons 2003 NCUAPG Annual Meeting Excerpts from the 2002 Guide Implementation Package 2002 Presentation Overview Need for NCHRP 1-37A - Status Guide Basics Asphalt
ACKNOWLEDGMENT OF SPONSORSHIP
 ACKNOWLEDGMENT OF SPONSORSHIP This work was sponsored by the American Association of State Highway and Transportation Officials, in cooperation with the Federal Highway Administration, and was conducted
Impact of Existing Pavement on Jointed Plain Concrete Overlay Design and Performance
 Impact of Existing Pavement on Jointed Plain Concrete Overlay Design and Performance Michael I. Darter, Jag Mallela, and Leslie Titus-Glover 1 ABSTRACT Concrete overlays are increasingly being constructed
Implementation of M-E PDG in Kansas
 Implementation of M-E PDG in Kansas Mustaque Hossain, Ph.D.,P.E. Kansas State University 1 Projects related to the M-E Guide Implementation and Calibration Kansas HMA Fatigue and Stiffness Study Pool Fund
ACKNOWLEDGMENT OF SPONSORSHIP
 ACKNOWLEDGMENT OF SPONSORSHIP This work was sponsored by the American Association of State Highway and Transportation Officials, in cooperation with the Federal Highway Administration, and was conducted
Hourly Precipitation Data Documentation (text and csv version) February 2016
 February 2016") I. Description Hourly Precipitation Data Documentation (text and csv version) February 2016 Hourly Precipitation Data (labeled Precipitation Hourly in Climate Data Online system) is a database that gives
I. Description Hourly Precipitation Data Documentation (text and csv version) February 2016 Hourly Precipitation Data (labeled Precipitation Hourly in Climate Data Online system) is a database that gives
Mechanistic-Empirical Pavement Design Guide: A User s Perspective. Brian D. Prowell, Ph.D., P.E.
 Mechanistic-Empirical Pavement Design Guide: A User s Perspective Brian D. Prowell, Ph.D., P.E. Empirical Approach Based on results of experiments or experience Scientific basis not established AASHTO
Guide for Mechanistic-Empirical Design
 Copy No. Guide for Mechanistic-Empirical Design OF NEW AND REHABILITATED PAVEMENT STRUCTURES FINAL DOCUMENT APPENDIX DD-1: RESILIENT MODULUS AS FUNCTION OF SOIL MOISTURE-SUMMARY OF PREDICTIVE MODELS NCHRP
LTPP InfoPave TM Extracting Information out of LTPP Data
 LTPP InfoPave TM Extracting Information out of LTPP Data Jane Jiang PE, LTPP Database Manager, FHWA Riaz Ahmad, President, iengineering Jerome Daleiden PE, Director Pavement Engineering, Fugro Jonathan
GeoShanghai 2010 International Conference Paving Materials and Pavement Analysis
 Particle Shape, Type and Amount of Fines, and Moisture Affecting Resilient Modulus Behavior of Unbound Aggregates Debakanta Mishra 1, Erol Tutumluer 2, M. ASCE, Yuanjie Xiao 3 1 Graduate Research Assistant,
APPENDIX A PROGRAM FLOW CHARTS
 APPENDIX A PROGRAM FLOW CHARTS LIST OF FIGURES Figure Page A-1 Structure of the MEPDG software... A-1 A-2 Relationship of the reflection cracking design program of this project to the MEPDG design software...
Mn/DOT Flexible Pavement Design Mechanistic-Empirical Method
 Mn/DOT Flexible Pavement Design Mechanistic-Empirical Method Pavement Design Systems and Pavement Performance Models March 22-23, 2007 - Reykjavik, Iceland Bruce Chadbourn Assistant Pavement Design Engineer
Comparison of Ontario Pavement Designs Using the AASHTO 1993 Empirical Method and the Mechanistic-Empirical Pavement Design Guide Method
 Comparison of Ontario Pavement Designs Using the AASHTO 1993 Empirical Method and the Mechanistic-Empirical Pavement Design Guide Method by Jonathan Nathan Boone A thesis presented to the University of
Sensitivity Analysis Of Aashto's 2002 Flexible And Rigid Pavement Design Methods
 University of Central Florida Electronic Theses and Dissertations Masters Thesis (Open Access) Sensitivity Analysis Of Aashto's 2002 Flexible And Rigid Pavement Design Methods 2006 Sanjay Shahji University
Impact of Water on the Structural Performance of Pavements
 Impact of Water on the Structural Performance of Pavements S. Erlingsson Highway Engineering, VTI The Swedish National Road and Transport Research Institute, Linköping, Sweden & Faculty of Civil and Environmental
ME PDG Rigid Pavement Design Reliability Update. Further Calibration of the Distress Prediction Models & Reliability Effects
 ME PDG Rigid Pavement Design Reliability Update Further Calibration of the Distress Prediction Models & Reliability Effects NCHRP 1-40B 1 & 1-40D 1 Team Applied Research Associates Michael Darter Jagannath
research report Virginia Transportation Research Council Final Report VTRC 09-R4 M. SHABBIR HOSSAIN, Ph.D., P.E. Research Scientist
 Final Report VTRC 09-R4 Virginia Transportation Research Council research report Characterization of Subgrade Resilient Modulus for Virginia Soils and Its Correlation with the Results of Other Soil Tests
An evaluation of Pavement ME Design dynamic modulus prediction model for asphalt mixes containing RAP
 An evaluation of Pavement ME Design dynamic modulus prediction model for asphalt mixes containing RAP Saman (Sam) Esfandiarpour Ph.D candidate, Department of Civil Engineering University of Manitoba E-mail:
Dynamic Resilient Modulus and the Fatigue Properties of Superpave HMA Mixes used in the Base Layer of Kansas Flexible Pavements
 06-1012 Dynamic Resilient Modulus and the Fatigue Properties of Superpave HMA Mixes used in the Base Layer of Kansas Flexible Pavements by Stefan A. Romanoschi, Nicoleta Dumitru, Octavian Dumitru and Glenn
What is on the Horizon in HMA. John D AngeloD Federal Highway Administration
 What is on the Horizon in HMA John D AngeloD Federal Highway Administration Are they all the same? Internal Angle of Gyration Internal Angle of Gyration Development of the Dynamic Angle Validator (DAV)
IDAHO TRANSPORTATION DEPARTMENT
 RESEARCH REPORT RP 193 IDAHO TRANSPORTATION DEPARTMENT Implementation of the MEPDG for Flexible Pavements in Idaho By Fouad Bayomy Professor of Civil Engineering Sherif El-Badawy Research Fellow Ahmed
Status Update: NCHRP Project 9-48
 Status Update: NCHRP Project 9-48 Field versus Laboratory Volumetrics and Mechanical Properties Louay N. Mohammad Mostafa Elseifi Sam Cooper, III Department of Civil and Environmental Engineering LA Transportation
APPENDIX B DISTRESSES
 144 APPENDIX B DISTRESSES 145 INTRODUCTION The purpose of this appendix is not to provide a detailed discussion of the various descriptions and causes of distresses that may occur in any given pavement
Evaluating Structural Performance of Base/Subbase Materials at the Louisiana Accelerated Pavement Research Facility
 Evaluating Structural Performance of Base/Subbase Materials at the Louisiana Accelerated Pavement Research Facility Zhong Wu, Ph.D., P.E. Zhongjie Zhang, Bill King Louay Mohammad Outline Background Objectives
Jakarta International School 6 th Grade Formative Assessment Graphing and Statistics -Black
 Jakarta International School 6 th Grade Formative Assessment Graphing and Statistics -Black Name: Date: Score : 42 Data collection, presentation and application Frequency tables. (Answer question 1 on
Beta Testing and. Validation of HMA PRS 1
 Beta Testing and NCHRP 9-22 WEBINAR April 27, 2009 NCHRP 9-22 Beta Testing and 1 Introduction to Project Project Team Specification Developments Materials and Method Specifications Performance Based Specifications
NJDOT RESEARCH PROJECT MANAGER: Mr. Anthony Chmiel
 Project Title: RFP NUMBER: CAIT NJDOT Bureau of Research QUARTERLY PROGRESS REPORT Evaluation of Poisson s Ratio NJDOT RESEARCH PROJECT MANAGER: Mr. Anthony Chmiel TASK ORDER NUMBER/Study Number: Task
Intercity Bus Stop Analysis
 by Karalyn Clouser, Research Associate and David Kack, Director of the Small Urban and Rural Livability Center Western Transportation Institute College of Engineering Montana State University Report prepared
research report Characterization of Unbound Pavement Materials From New Mechanistic-Empirical Pavement Design Procedure
 Final Report VTRC 11-R6 Virginia Transportation Research Council research report Characterization of Unbound Pavement Materials From Virginia Sources for Use in the New Mechanistic-Empirical Pavement Design
Club Convergence and Clustering of U.S. State-Level CO 2 Emissions
 Methodological Club Convergence and Clustering of U.S. State-Level CO 2 Emissions J. Wesley Burnett Division of Resource Management West Virginia University Wednesday, August 31, 2013 Outline Motivation
UPDATES TO THE HOURLY CLIMATE DATA FOR USE IN PAVEMENT-ME. Word count: 4480 words text + 9 tables/figures x 250 words (each) = 6730 words
 = 6730 words") 0 0 0 UPDATES TO THE HOURLY CLIMATE DATA FOR USE IN PAVEMENT-ME Wouter Brink, Corresponding Author Applied Research Associates 00 Trade Center Dr. Suite 00, Champaign, IL, 0 Tel: --00 Fax: --0; Email:
0 0 0 UPDATES TO THE HOURLY CLIMATE DATA FOR USE IN PAVEMENT-ME Wouter Brink, Corresponding Author Applied Research Associates 00 Trade Center Dr. Suite 00, Champaign, IL, 0 Tel: --00 Fax: --0; Email:
Arizona Pavements and Materials Conference Phoenix, Arizona. November 15-16, John Siekmeier P.E. M.ASCE
 Arizona Pavements and Materials Conference Phoenix, Arizona November 15-16, 2017 John Siekmeier P.E. M.ASCE Minnesota DOT Districts and Local Agencies Other State DOTs, FHWA and NCHRP Contractors and Manufacturers
Mechanistic Investigation of Granular Base and Subbase Materials A Saskatchewan Case Study
 Mechanistic Investigation of Granular Base and Subbase Materials A Saskatchewan Case Study Curtis Berthelot, P. Eng. Department of Civil and Geological Engineering University of Saskatchewan 57 Campus
Seasonal Resilient Modulus Inputs for Tennessee Soils and Their Effects on Asphalt Pavement Performance
 Seasonal Resilient Modulus Inputs for Tennessee Soils and Their Effects on Asphalt Pavement Performance 0 0 0 Changjun Zhou E-mail: czhou@utk.edu Baoshan Huang (Corresponding author) E-mail: bhuang@utk.edu
Analysis of pavement structural performance for future climate
 P2R2C2 Analysis of pavement structural performance for future climate Report No. 7 July 2010 Project Coordinator University of Nottingham, UK ZAG, Slovenia VTT, Finland SINTEF, Norway This project was
Evaluation of Rutting Depth in Flexible Pavements by Using Finite Element Analysis and Local Empirical Model
 American Journal of Engineering and Applied Sciences, 2012, 5 (2), 163-169 ISSN: 1941-7020 2014 Abed and Al-Azzawi, This open access article is distributed under a Creative Commons Attribution (CC-BY)
Standard Indicator That s the Latitude! Students will use latitude and longitude to locate places in Indiana and other parts of the world.
 Standard Indicator 4.3.1 That s the Latitude! Purpose Students will use latitude and longitude to locate places in Indiana and other parts of the world. Materials For the teacher: graph paper, globe showing
New Educators Campaign Weekly Report
 Campaign Weekly Report Conversations and 9/24/2017 Leader Forms Emails Collected Text Opt-ins Digital Journey 14,661 5,289 4,458 7,124 317 13,699 1,871 2,124 Pro 13,924 5,175 4,345 6,726 294 13,086 1,767
Local Calibration Studies on DARWin-ME / Mechanistic- Empirical Pavement Design Guide Jointed Plain Concrete Pavement Performance Prediction Models
 TRB Paper 13-2667 Local Calibration Studies on DARWin-ME / Mechanistic- Empirical Pavement Design Guide Jointed Plain Concrete Pavement Performance Prediction Models by Sunghwan Kim, Ph.D., P.E. (corresponding
Abortion Facilities Target College Students
 Target College Students By Kristan Hawkins Executive Director, Students for Life America Ashleigh Weaver Researcher Abstract In the Fall 2011, Life Dynamics released a study entitled, Racial Targeting
Pavement Design Where are We? By Dr. Mofreh F. Saleh
 Pavement Design Where are We? By Dr. Mofreh F. Saleh Pavement Design Where are We?? State-of-Practice State-of-the-Art Empirical Mechanistic- Empirical Mechanistic Actual Current Practice?? Inputs Structure
ABSTRACT. The new pavement design methodology is based on mechanistic-empirical
 ABSTRACT Title of Document: CATALOG OF MATERIAL PROPERTIES FOR MECHANISTIC-EMPIRICAL PAVEMENT DESIGN Rui Li, Master of Science, 2011 Directed By: Dr. Charles W. Schwartz Department of Civil and Environmental
SENSITIVITY EVALUATION OF THE MEPDG FOR FLEXIBLE PAVEMENTS TRB Webinar July 25, 2012
 SENSITIVITY EVALUATION OF THE MEPDG FOR FLEXIBLE PAVEMENTS TRB Webinar July 25, 2012 Moderator: Trenton Clark Virginia Asphalt Association Presenter: Charles W. Schwartz University of Maryland 2 University
Evaluating Structural Performance of Base/Subbase Materials at the Louisiana Accelerated Pavement Research Facility
 Evaluating Structural Performance of Base/Subbase Materials at the Louisiana Accelerated Pavement Research Facility Zhong Wu, Ph.D., P.E. Louisiana Transportation Research Center 2007 Transportation Engineering
METHODS FOR EVALUATING RESILIENT MODULI OF PAVING MATERIALS
 Project Number ST 2019-7 Summary Report METHODS FOR EVALUATING RESILIENT MODULI OF PAVING MATERIALS sponsored by The State of Alabama Highway Department Montgomery, Alabama Frazier Parker, Jr. David J.
The Development of a Performance Specification for Granular Base and Subbase Material
 FHWA-NJ-2005-003 The Development of a Performance Specification for Granular Base and Subbase Material FINAL REPORT Mr. Thomas Bennert* Research Engineer Submitted by Dr. Ali Maher* Professor and Chairman
Falling Weight Deflectometer vs Laboratory Determined Resilient Modulus (Slab Curling Study)
") FWD-RU6701 Falling Weight Deflectometer vs Laboratory Determined Resilient Modulus (Slab Curling Study) FINAL REPORT December 2005 Submitted by Dr. Sameh Zaghloul, P.E., P.Eng.* Managing Senior Principal
FWD-RU6701 Falling Weight Deflectometer vs Laboratory Determined Resilient Modulus (Slab Curling Study) FINAL REPORT December 2005 Submitted by Dr. Sameh Zaghloul, P.E., P.Eng.* Managing Senior Principal
Technical Report Documentation Page 2. Government Accession No. 3. Recipient's Catalog No. 1. Report No. FHWA/TX-02/1863-1
 1. Report No. FHWA/TX-02/1863-1 4. Title and Subtitle DEVELOPMENT OF A PROCEDURE FOR TEMPERATURE CORRECTION OF BACKCALCULATED AC MODULUS Technical Report Documentation Page 2. Government Accession No.
Malaysian Journal of Civil Engineering 29(3): (2017)
: (2017)") Malaysian Journal of Civil Engineering 29(3):307-319 (2017) VARIATION OF PAVEMENT DESIGN WITH ENVIRONMENTAL TEMPERATURE VARIATION Swapan Kumar Bagui 1 *, Atasi Das 1,2, Kaushlendra Kumar Verma 1 & Soumadeep
Malaysian Journal of Civil Engineering 29(3):307-319 (2017) VARIATION OF PAVEMENT DESIGN WITH ENVIRONMENTAL TEMPERATURE VARIATION Swapan Kumar Bagui 1 *, Atasi Das 1,2, Kaushlendra Kumar Verma 1 & Soumadeep
AF2903 Road Construction and Maintenance. Volumetric Analysis of Asphalt Mixtures
 AF2903 Road Construction and Maintenance Volumetric Analysis of Asphalt Mixtures Royal Institute of Technology Stockholm, April 8 th 2014 Dr. Alvaro Guarin Highway and Railway Engineering Department of
Sensitivity Analysis of 2002 Design Guide Rigid Pavement Distress Prediction Models
 Research Report UCD-ITS-RR-06-31 Sensitivity Analysis of 2002 Design Guide Rigid Pavement Distress Prediction Models June 2006 Venkata Kannekanti John Harvey Institute of Transportation Studies University
EVALUATION OF VACUUM DRYING FOR DETERMINATION OF BULK SPECIFIC GRAVITY OF HMA SAMPLES
 Cross and Pokhrel 1 EVALUATION OF VACUUM DRYING FOR DETERMINATION OF BULK SPECIFIC GRAVITY OF HMA SAMPLES 6784 Equivalent Words by: Stephen A. Cross, Ph.D., P.E. Professor School of Civil and Environmental
Nevels, et al 1 KAY COUNTY SHALE SUBGRADE STABILIZATION REVISITED
 Nevels, et al 1 Title: KAY COUNTY SHALE SUBGRADE STABILIZATION REVISITED Submitted: 15 November 2012 (revised) Word Count: 3581 + 7 figures = 5331 Name: Affiliation: Email: Joakim G. Laguros, Ph.D., P.E.
MECHANISTIC-EMPIRICAL PAVEMENT ANALYSIS AND DESIGN. University of Wisconsin Milwaukee Paper No. 13-2
 MECHANISTIC-EMPIRICAL PAVEMENT ANALYSIS AND DESIGN University of Wisconsin Milwaukee Paper No. 13-2 National Center for Freight & Infrastructure Research & Education College of Engineering Department of
Development and Implementation of the Reflective Cracking Model in the Mechanistic-Empirical Pavement Design Guide
 Development and Implementation of the Reflective Cracking Model in the Mechanistic-Empirical Pavement Design Guide Organizer: TRB Standing Committee on Pavement Rehabilitation August 17, 2016 Today s Presenters
Unbound Pavement Applications of Excess Foundry System Sands: Subbase/Base Material
 Unbound Pavement Applications of Excess Foundry System Sands: Subbase/Base Material Tuncer B. Edil University of Wisconsin-Madison Recycled Materials Resource Center RMRC Participant Job Description Which
Characterizing Horizontal Response Pulse at the Bottom of Asphalt Layer Based on Viscoelastic Analysis
 Technical Paper ISSN 1996-6814 Int. J. Pavement Res. Technol. 6(4):379-385 Copyright @ Chinese Society of Pavement Engineering Characterizing Horizontal Response Pulse at the Bottom of Asphalt Layer Based
Determination of Resilient Modulus Model for Road-Base Material
 JOURNAL OF APPLIED SCIENCES RESEARCH ISSN: 1819-544X Published BY AENSI Publication EISSN: 1816-157X http://www.aensiweb.com/jasr 2017 January; 13(1): pages 10-16 Open Access Journal Determination of Resilient
 Project: ITHACA-TOMPKINS REGIONAL AIRPORT EXPANSION Project Location: ITHACA, NY Project Number: 218-34 Key to Soil Symbols and Terms TERMS DESCRIBING CONSISTENCY OR CONDITION COARSE-GRAINED SOILS (major
Mechanistic Pavement Design
 Seminar on Pavement Design System and Pavement Performance Models Reykjavik, 22. 23. March, 2007 Mechanistic Pavement Design A Road to Enhanced Understanding of Pavement Performance Sigurdur Erlingsson
Task 3. EICM Validation and Analysis
 Task 3. EICM Validation and Analysis Lev Khazanovich Associate Professor Presentation Outline 1. Minimum AC thickness 2. Time of traffic opening 3. Comparisons of AC overlay and semi-rigid MEPDG models
Accelerated Loading Evaluation of Base & Sub-base Layers
 Accelerated Loading Evaluation of Base & Sub-base Layers Zhong Wu, Ph.D., P.E. Louisiana Transportation Research Center (LTRC) April 2006 What is Accelerated Loading? Accelerated loading refers to Accelerated
JAN/FEB MAR/APR MAY/JUN
 QF 1.100 (Build 1010) Widget Publishing, Inc Page: 1 Circulation Breakdown by Issue Qualified Non-Paid Qualified Paid Previous This Previous This Total Total issue Removals Additions issue issue Removals
Commonwealth of Pennsylvania PA Test Method No. 709 Department of Transportation October Pages LABORATORY TESTING SECTION. Method of Test for
 Commonwealth of Pennsylvania PA Test Method No. 709 Department of Transportation 15 Pages LABORATORY TESTING SECTION Method of Test for EFFECTIVE ASPHALT CONTENT OF BITUMINOUS PAVING MIXTURES 1. SCOPE
SUITABILITY OF USING CALIFORNIA BEARING RATIO TEST TO PREDICT RESILIENT MODULUS
 SUITABILITY OF USING CALIFORNIA BEARING RATIO TEST TO PREDICT RESILIENT MODULUS By: Beena Sukumaran, Associate Professor, Civil & Environmental Engineering Rowan University 201 Mullica Hill Road, Glassboro,
Adaptation of the 2002 Guide for the Design of Minnesota Low-Volume Portland Cement Concrete Pavements
 27-23 Adaptation of the 22 Guide for the Design of Minnesota Low-Volume Portland Cement Concrete Pavements Take the steps... Research...Knowledge...Innovative Solutions! Transportation Research Technical
Study on How to Determine Repair Thickness of Damaged Layers for Porous Asphalt
 Study on How to Determine Repair Thickness of Damaged Layers for Porous Asphalt K. Kamiya & T. Kazato Nippon Expressway Research Institute Company Limited, Tokyo, Japan ABSTRACT: Porous asphalt has been
Professional Agreement Invoice and Progress Report
 ITD 0771 (Rev. 10-06) itd.idaho.gov Professional Agreement Invoice and Progress Report Idaho Transportation Department This page must be filled out monthly by the Consultant and forwarded to the Agreement
Determination of AASHTO Layer Coefficients for Granular Materials by Use of Resilient Modulus
 Missouri University of Science and Technology Scholars' Mine Civil, Architectural and Environmental Engineering Faculty Research & Creative Works Civil, Architectural and Environmental Engineering 1-1-1994
Asphalt Mix Designer. Module 2 Physical Properties of Aggregate. Specification Year: July Release 4, July
 Specification Year: July 2005 Release 4, July 2005 2-1 The first step in the development of an HMA mix design is to identify the materials that will be used in the pavement. In Florida the asphalt binder
Standard Title Page - Report on Federally Funded Project 1. Report No. 2. Government Accession No. 3. Recipient s Catalog No.
 Standard Title Page - Report on Federally Funded Project 1. Report No. 2. Government Accession No. 3. Recipient s Catalog No. FHWA/VTRC 07-CR1 4. Title and Subtitle 5. Report Date Determination of the
A. Geography Students know the location of places, geographic features, and patterns of the environment.
 Learning Targets Elementary Social Studies Grade 5 2014-2015 A. Geography Students know the location of places, geographic features, and patterns of the environment. A.5.1. A.5.2. A.5.3. A.5.4. Label North
QF (Build 1010) Widget Publishing, Inc Page: 1 Batch: 98 Test Mode VAC Publisher's Statement 03/15/16, 10:20:02 Circulation by Issue
 Widget Publishing, Inc Page: 1 Batch: 98 Test Mode VAC Publisher's Statement 03/15/16, 10:20:02 Circulation by Issue") QF 1.100 (Build 1010) Widget Publishing, Inc Page: 1 Circulation by Issue Qualified Non-Paid Circulation Qualified Paid Circulation Individual Assoc. Total Assoc. Total Total Requester Group Qualified
QF 1.100 (Build 1010) Widget Publishing, Inc Page: 1 Circulation by Issue Qualified Non-Paid Circulation Qualified Paid Circulation Individual Assoc. Total Assoc. Total Total Requester Group Qualified
AN INVESTIGATION OF DYNAMIC MODULUS AND FLOW NUMBER PROPERTIES OF ASPHALT MIXTURES IN WASHINGTON STATE
 Final Report (Draft) TNW2012-02 Research Project Agreement No. 709867 AN INVESTIGATION OF DYNAMIC MODULUS AND FLOW NUMBER PROPERTIES OF ASPHALT MIXTURES IN WASHINGTON STATE Huanan Yu Graduate Research
P.E. Civil Exam Review: GEOMECHANICS. Jerry Vandevelde, P.E.
 P.E. Civil Exam Review: GEOMECHANICS Jerry Vandevelde, P.E. gtv@gemeng.com GEOMECHANICS National Council of Examiners for Engineering and Surveying http://www.ncees.org/ 3 STUDY REFERENCES Foundation Engineering;
Cooperative Program Allocation Budget Receipts Southern Baptist Convention Executive Committee May 2018
 Cooperative Program Allocation Budget Receipts May 2018 Cooperative Program Allocation Budget Current Current $ Change % Change Month Month from from Contribution Sources 2017-2018 2016-2017 Prior Year
Cooperative Program Allocation Budget Receipts Southern Baptist Convention Executive Committee October 2017
 Cooperative Program Allocation Budget Receipts October 2017 Cooperative Program Allocation Budget Current Current $ Change % Change Month Month from from Contribution Sources 2017-2018 2016-2017 Prior
Cooperative Program Allocation Budget Receipts Southern Baptist Convention Executive Committee October 2018
 Cooperative Program Allocation Budget Receipts October 2018 Cooperative Program Allocation Budget Current Current $ Change % Change Month Month from from Contribution Sources 2018-2019 2017-2018 Prior
GEOSYNTHETICS ENGINEERING: IN THEORY AND PRACTICE
 GEOSYNTHETICS ENGINEERING: IN THEORY AND PRACTICE Prof. J. N. Mandal Department of civil engineering, IIT Bombay, Powai, Mumbai 400076, India. Tel.022-25767328 email: cejnm@civil.iitb.ac.in Module-5 LECTURE-
IMPROVEMENTS TO STRAIN COMPUTATION AND RELIABILTY ANALYSIS OF FLEXIBLE PAVEMENTS IN THE MECHANISTIC-EMPIRICAL PAVEMENT DESIGN GUIDE
 IMPROVEMENTS TO STRAIN COMPUTATION AND RELIABILTY ANALYSIS OF FLEXIBLE PAVEMENTS IN THE MECHANISTIC-EMPIRICAL PAVEMENT DESIGN GUIDE By SENTHILMURUGAN THYAGARAJAN A dissertation submitted in partial fulfillment
NCHRP. Project No. NCHRP 9-44 A. Validating an Endurance Limit for Hot-Mix Asphalt (HMA) Pavements: Laboratory Experiment and Algorithm Development
 Pavements: Laboratory Experiment and Algorithm Development") NCHRP Project No. NCHRP 9-44 A Validating an Endurance Limit for Hot-Mix Asphalt (HMA) Pavements: Laboratory Experiment and Algorithm Development Appendix 1 Integrated Predictive Model for Healing and
NCHRP Project No. NCHRP 9-44 A Validating an Endurance Limit for Hot-Mix Asphalt (HMA) Pavements: Laboratory Experiment and Algorithm Development Appendix 1 Integrated Predictive Model for Healing and
MECHANISTIC-EMPIRICAL LOAD EQUIVALENCIES USING WEIGH IN MOTION
 MECHANISTIC-EMPIRICAL LOAD EQUIVALENCIES USING WEIGH IN MOTION Prepared By: Curtis Berthelot Ph.D., P.Eng. Dept. of Civil Engineering University of Saskatchewan Tanya Loewen Dept. of Civil Engineering
PREDICTIONS OF MAXIMUM DRY DENSITY AND OPTIMUM MOISTURE CONTENT FROM SIMPLE MATERIAL PROPERTIES
 PREDICTIONS OF MAXIMUM DRY DENSITY AND OPTIMUM MOISTURE CONTENT FROM SIMPLE MATERIAL PROPERTIES John B METCALF and Stefan A ROMANOSCHI jb_jmetcalf@bigpond.com ABSTRACT A set of results of basic soil classification
SUPPLEMENTAL NUTRITION ASSISTANCE PROGRAM QUALITY CONTROL ANNUAL REPORT FISCAL YEAR 2008
 SUPPLEMENTAL NUTRITION ASSISTANCE PROGRAM QUALITY CONTROL ANNUAL REPORT FISCAL YEAR 2008 U.S. DEPARTMENT OF AGRICULTURE FOOD AND NUTRITION SERVICE PROGRAM ACCOUNTABILITY AND ADMINISTRATION DIVISION QUALITY
Correction to Spatial and temporal distributions of U.S. winds and wind power at 80 m derived from measurements
 JOURNAL OF GEOPHYSICAL RESEARCH, VOL. 109,, doi:10.1029/2004jd005099, 2004 Correction to Spatial and temporal distributions of U.S. winds and wind power at 80 m derived from measurements Cristina L. Archer
Developing Subgrade Inputs for Mechanistic- Empirical Pavement Design
 University of Arkansas, Fayetteville ScholarWorks@UARK Computer Science and Computer Engineering Undergraduate Honors Theses Computer Science and Computer Engineering 5-2008 Developing Subgrade Inputs
EVALUATION OF FATIGUE LIFE OF ASPHALT MIXTURES THROUGH THE DISSIPATED ENERGY APPROACH
 Vargas-Nordcbeck, Aguiar-Moya, Leiva-Villacorta and Loría-Salazar 0 0 0 EVALUATION OF FATIGUE LIFE OF ASPHALT MIXTURES THROUGH THE DISSIPATED ENERGY APPROACH Submitted to the th Annual Meeting of the Transportation
DYNAMIC MODULUS MASTER CURVE AND CHARACTERIZATION OF SUPERPAVE HMA CONTAINING VARIOUS POLYMER TYPES
 DYNAMIC MODULUS MASTER CURVE AND CHARACTERIZATION OF SUPERPAVE HMA CONTAINING VARIOUS POLYMER TYPES Al-Hosain M. Ali 1, Mohamed S. Aazam 2, and Mohamed A. Alomran 3 1 Assistant Professor, Civil Engineering.
Analysis of Non-Linear Dynamic Behaviours in Asphalt Concrete Pavements Under Temperature Variations
 ENOC 2017, June 25 30, 2017, Budapest, Hungary Analysis of Non-Linear Dynamic Behaviours in Asphalt Concrete Pavements Under Temperature Variations Amal Abdelaziz *, Chun-Hsing Ho *, and Junyi Shan * *
Alpine Funds 2016 Tax Guide
 Alpine s 2016 Guide Alpine Dynamic Dividend ADVDX 01/28/2016 01/29/2016 01/29/2016 0.020000000 0.017621842 0.000000000 0.00000000 0.017621842 0.013359130 0.000000000 0.000000000 0.002378158 0.000000000
CE 240 Soil Mechanics & Foundations Lecture 3.2. Engineering Classification of Soil (AASHTO and USCS) (Das, Ch. 4)
 (Das, Ch. 4)") CE 240 Soil Mechanics & Foundations Lecture 3.2 Engineering Classification of Soil (AASHTO and USCS) (Das, Ch. 4) Outline of this Lecture 1. Particle distribution and Atterberg Limits 2. Soil classification
CE 240 Soil Mechanics & Foundations Lecture 3.2 Engineering Classification of Soil (AASHTO and USCS) (Das, Ch. 4) Outline of this Lecture 1. Particle distribution and Atterberg Limits 2. Soil classification
Of course the importance of these three problematics is affected by the local environmental conditions.
 SHRP METHOD/SUPERPAVE SYSTEM The Strategic Highway Research Program (SHRP) of the U.S. National Research Centre deals with, amongst other things, road construction and between 1987 and 1993 new classification
TECHNICAL PAPER INVESTIGATION INTO THE VALIDATION OF THE SHELL FATIGUE TRANSFER FUNCTION
 Authors: TECHNICAL PAPER INVESTIGATION INTO THE VALIDATION OF THE SHELL FATIGUE TRANSFER FUNCTION Anthony Stubbs (Presenter), BE(Hons), Masters student, University of Canterbury. aps49@student.canterbury.ac.nz.
Flexible Pavement Analysis Considering Temperature Profile and Anisotropy Behavior in Hot Mix Ashalt Layer
 Open Journal of Civil ngineering, 2011, 1, 7-12 doi:10.4236/ojce.2011.12002 Published Online December 2011 (http://www.scirp.org/journal/ojce) Flexible Pavement Analysis Considering Temperature Profile
Guide for Mechanistic-Empirical Design
 Copy No. Guide for Mechanistic-Empirical Design OF NEW AND REHABILITATED PAVEMENT STRUCTURES FINAL DOCUMENT APPENDIX JJ: TRANSVERSE JOINT FAULTING MODEL NCHRP Prepared for National Cooperative Highway
Printable Activity book
 Printable Activity book 16 Pages of Activities Printable Activity Book Print it Take it Keep them busy Print them out Laminate them or Put them in page protectors Put them in a binder Bring along a dry