Developing Subgrade Inputs for Mechanistic- Empirical Pavement Design
|
|
|
- Barrie Wade
- 5 years ago
- Views:
Transcription

1 University of Arkansas, Fayetteville Computer Science and Computer Engineering Undergraduate Honors Theses Computer Science and Computer Engineering Developing Subgrade Inputs for Mechanistic- Empirical Pavement Design Meagan Berlau University of Arkansas, Fayetteville Follow this and additional works at: Part of the Civil and Environmental Engineering Commons, and the Computer Sciences Commons Recommended Citation Berlau, Meagan, "Developing Subgrade Inputs for Mechanistic-Empirical Pavement Design" (2008). Computer Science and Computer Engineering Undergraduate Honors Theses This Thesis is brought to you for free and open access by the Computer Science and Computer Engineering at It has been accepted for inclusion in Computer Science and Computer Engineering Undergraduate Honors Theses by an authorized administrator of For more information, please contact
2
3 DEVELOPING SUBGRADE INPUTS FOR MECHANISTIC-EMPIRICAL PAVEMENT DESIGN
4 DEVELOPING SUBGRADE INPUTS FOR MECHANISTIC-EMPIRICAL PAVEMENT DESIGN An Honors Thesis submitted in partial fulfillment of the requirements for Honors Studies in Civil Engineering By Meagan Berlau May 2008 University of Arkansas
5 This thesis is approved for recommendation to the Honors College Thesis Advisor: Dr. Kevin Hall Thesis Committee: Dr. Robert Elliot Dr. Norman Dennis
6 Thesis Duplication Release I hereby authorize the University of Arkansas Libraries to duplicate and distribute this honors paper in any format (including electronic based distribution) when needed for research and/or scholarship. Agreed: Refused:
7 Acknowledgements First, I would like to thank my thesis director Dr. Kevin Hall for his support and advice throughout this project. Without his guidance, this project would not be possible. Thanks are also extended to the members of my thesis committee, Dr. Robert Elliott and Dr. Norman Dennis. In addition, I could not have completed this project without the help that I have received from Trent Ellis. His support this past year has been invaluable. I would also like to thank my father, Chuck Berlau, for his constant encouragement and moral support.
8 Table of Contents 1. Introduction Literature Review Resilient Modulus Index Property Correlations R-Value Test R-Value Correlations Experimental Design Results Correlations Involving R-Value Analyzing Correlations MEPDG Tests Current MEPDG Correlation Thicker Cross Section Thinner Cross Section Pavement Failures with New Correlation Thicker Cross Section Thinner Cross Section Discussion and Conclusions References Appendix A Appendix B Appendix C v
9 List of Figures Figure 1. Resilient Strain Example... 5 Figure 2. Stabiliometer Diagram Figure 3. California Kneading Compactor Figure 4. Thinner Pavement Cross Section Figure 5. Thicker Pavement Cross Section Figure 6. Relationship Between the (Resilient Modulus to R-Value) ratio and the R-value of Arkansas Soils Figure 7. Mr 2 /R Plot Figure 8. Resilient Modulus over R-value vs. R-value Sorted by R-value Figure 9. Comparrison of Predicted Mr/R and Actual Mr/R Figure 10. Comparison of Correlations Figure 11. Total Rutting vs. Time, Thicker Cross Section, Current Correlation Figure 12. Bottom-Up Cracking vs. Time, Thicker Cross Section, Current Correlation. 29 Figure 13. IRI vs. Time, Thicker Cross Section, Current MEPDG Correlation Figure 14. Total Rutting vs. Time, Thinner Cross Section, Current Correlation Figure15. Bottom-Up Fatigue vs. Time, Thinner Cross Section, Current Correlation Figure 16. IRI vs. Time, Thinner Cross Section, Current Correlation Figure 17. Total Rutting vs. Time, Thicker Cross Section, New Correlation Figure 18. Bottom Up Cracking vs. Time, Thicker Cross Section, New Correlation Figure 19. IRI vs. Time, Thicker Cross Section, New Correlation Figure 20. Total Rutting vs. Time, Thinner Cross Section, New Correlation Figure 21. Bottom Up Cracking vs. Time, Thinner Cross Section, New Correlation Figure 22. IRI vs. Time, Thinner Cross Section, New Correlation Figure 23. Resilient Modulus vs. R-value Figure 24. Resilient Modulus vs. R-value Squared Figure 25. Resilient Modulus vs. R-value Cubed Figure 26. Resilient Modulus Squared vs. R-value Cubed Figure 27. Square Root of Resilient Modulus vs. R-value Figure 28. Resilient Modulus vs. Square Root R-value Figure 29. Resilient Modulus vs. Log(R-value) Figure 30. Log(Resilient Modulus) vs. R-value Figure 31. Resilient Modulus vs. Ln(R-value) Figure 32. Ln(Resilient Modulus) vs. R-value Figure 33. (Resilient Modulus/R-value) vs. R-value Figure 34. (Resilient Modulus Squared/R-value) vs. R-value vi
10 1. INTRODUCTION The Resilient Modulus (M R ) of a subgrade soil is an essential input into the flexible pavement design models contained in the American Association of State Highway and Transportation Official s new pavement design guide, the Mechanistic- Empirical Pavement Design Guide (MEPDG). For most inputs required for pavement design, there are three levels of input that can be used within the MEPDG system. Level One requires the engineer to enter a value for subgrade Resilient Modulus based on the results of Resilient Modulus tests conducted in the laboratory. Level Two allows the user to input values for other soil property tests including California Bearing Ratio (CBR), and resistance value (R-Value). The program then converts these numbers to Resilient Modulus values using empirical correlations. When a pavement designer does not have access to detailed data about the subgrade soil, Level Three inputs can be used. These inputs are educated guesses for the Resilient Modulus of the subgrade soil based on the AASHTO soil type entered. While Level Three inputs may not provide accurate data to allow an engineer to design pavements with a high reliability, the tests required to use Level One inputs are costly, time consuming, and are rarely run for a variety of reasons. Because soil environmental conditions can affect the results of a resilient modulus test; it is imperative that laboratory tests be performed on soil samples that replicate the moisture content, density, stress state, and degree of saturation of soil in the field. The expense and difficulty of mimicking in situ soil conditions for a subgrade soil makes running laboratory resilient modulus tests an uncommon practice. 1
11 This leaves Level Two as the likely method of determining resilient modulus for use in the MEPDG system. The correlations used in the MEPDG procedure, however, are based upon test data run on soil samples from across the country. Since soil properties vary greatly across the country, the default correlation equations contained in Level 2 models of the MEPDG are most likely a poor representation of soils commonly found throughout the state of Arkansas. The sheer volume of soils all over the country and the extreme variance in the properties between different soil types leads to a rather poor R- value correlation in the design guide for soils specifically found in the state of Arkansas. If the Arkansas State Highway and Transportation Department continues favoring R-value correlations as the Level 2 soil property input in MEPDG, correlations that apply specifically to the soils found in the state of Arkansas should be developed. If no acceptable correlation can be developed, it may be in the best interest of the AHTD to abandon using R-value correlations and, either: (a) adopt a new method of determining resilient modulus, perhaps through backcalculation of Falling Weight Deflectometer data; or (b) expand the current resilient modulus testing program 2
12 2. LITERATURE REVIEW 2.1 Resilient Modulus In 1986, the American Association of State Highway and Transportation Officials (AASHTO) updated its original design guide to begin using Resilient Modulus as a measure of subgrade soil strength instead of the soil support value that had previously been used. The subgrade support value was the first attempt to include subgrade soil properties in pavement design and ranged from 1 to 10. The 1986 AASHTO guide introduced the following relationship between resilient modulus and the subgrade support value: S i 6.24 log10 M = R....(1) Where: S i = Subgrade Support Value M R =Resilient Modulus (psi) The 1986 design guide also proposed that correlations should be developed between resilient modulus and either California Bearing Ratio values or R-value since, at that time, many state transportation agencies did not have the equipment necessary to run resilient modulus tests. The original correlations proposed in the design guide are extremely basic and are based on the bulk stress of the soil sample, but they represent the first step taken by the American Association of State Highway and Transportation Officials to incorporate resilient modulus into the pavement design equation. The resilient modulus of subgrade soils has evolved from its less-than-perfect inclusion in the 1986 design guide into the required subgrade input to the MEPDG design system for flexible pavement. The resilient modulus estimates the elastic modulus of a subgrade soil; it is a measure of the stress to strain ratio for quickly applied loads. This 3
13 loading is similar to the loading conditions that a subgrade soil will experience in the field. When a load is quickly applied and released, the strain is divided into resilient, or recoverable, strain and permanent, or plastic, strain (Woodbridge). The most common way to measure the resilient modulus of a subgrade soil is using a repeated load triaxial test in which vertical load pulses are applied for 0.1 second durations with 0.9 second rest periods (NAPA). There is a marked difference in the stiffness exhibited by a subgrade soil in the conventional triaxial test compared the stiffness from the repeated load test. In the repeated load test, the soil sample is exposed to a cyclic vertical loading cycle and constant horizontal pressure (Farrar, et al.). From the test, the recoverable, or resilient, strain in the soil specimen is measured as the rebound deformation resulting from removal of the the deviator stress divided by the original height of the sample (Woodbridge). The Resilient Modulus is then calculated as M R σ d = ε.(2) where: M R = Resilient Modulus σ D =repeatedly applied deviator stress ε R =recoverable axial strain (NAPA) The resilient modulus can also be described as the slope of the hysteresis loop developed in the stress vs. strain plot once there is no further significant increase in permanent strain due to cyclic loadings and elastic strain is the only type the specimen undergoes (Farrar, et al.). The importance of determining the resilient modulus of a subgrade soil lies in its ability to predict the rutting potential of a subgrade soil; the resilient modulus test most R 4
14 closely replicates the traffic loading conditions experienced by subgrade soils once used in highway construction. Figure 1. Resilient Strain Example (Huang) The results of the resilient modulus test is dependent on a large number of factors including stress duration, frequency, grain size, void ratio, saturation, confining pressure, and stress level (Thornton). There is no significant correlation between any single soil property (grain size, plasticity, clay and silt content) and resilient modulus. However, according to research done by Su, et al., as moisture content increases, resilient modulus decreases. The degree of saturation, a property that combines the density and moisture content of a soil, exhibits the same effect on resilient modulus as moisture content. The deviator stress also affects the resilient modulus of a soil in both cohesive and cohesionless soils; as deviator stress increases, resilient modulus decreases (Su, et al.), particularly in cohesive soils. It is imperative that deviator stress levels used during the resilient modulus test are determined based on the traffic loading anticipated (Su, et al.). It is also noted in the 5
15 research, however, that once a confining pressure of approximately 6 psi is reached, the curve of the plot relating deviator stress to resilient modulus becomes flatter, so a confining stress of 6 psi is appropriate for almost all tests. Even though there is no true correlation between any single soil index property and resilient modulus, the effect that index properties can have on the results of a resilient modulus test needs to be considered. 2.2 Index Property Correlations Since the Resilient Modulus test is not often run due to the cost and time necessary to get accurate results for soil samples that mimic the properties of the subgrade soil encountered in road construction, much research has been done on finding new ways to correlate various soil properties that are simple to obtain to the Resilient Modulus value of a soil. Carmichael and Stuart attempted to derive a correlation for resilient modulus using soil index properties and measurements taken during a triaxial test. Their results, however, showed that a general equation could not be written for all soil types. Fine grained and coarse grained soils were separated and distinct correlations were developed for each soil type. The equations for both coarse (Equation 3) and fine grained soils (Equation 4) are based on the plasticity index, water content, percent passing the No. 200 sieve, confining stress, deviator stress, and bulk stress used during the triaxial test, and a correction for soil type (Carmichael, et al.). M R = ( PI ) (% W ) ( s200) ( CS) (3) ( DS) ( CH ) ( MH ) log( M ) R = (% W ) (logT ) ( SM ) ( GR)...(4) 6
16 where: MR= Resilient Modulus (ksi) PI= Plasticity Index %W= Water Content (%) CS= Confining Stress (psi) DS= Deviator Stress (psi) T= Bulk Stress (psi) (DS+3CS) DD= Dry Density (pcf) S200=Percentage Passing No. 200 Sieve SS= Soil Suction CH=1 for CH Soil, 0 otherwise (MH, ML, or CL soil) MH=1 for MH soil, 0 otherwise (CH, ML, or CL soil) SM = 1 for SM Soil, 0 otherwise GR = 1 for GR Soil, 0 otherwise A study performed by Woodbridge found that plasticity index, clay content, and optimum moisture content contributed most to determining resilient modulus of cohesive soils. From her study, Woodbridge developed various correlations between soil index properties resilient modulus for cohesive soils throughout Arkansas. Her equations using only the inputs deemed significant, include: For deviator stresses of 4 psi: M R = PI CL W.(5) 7
17 For deviator stresses of 8 psi M R = PI CL W..(6) where: MR= Resilient Modulus (psi) PI = Plasticity Index (percent) CL = Clay Content (percent) W = Optimum Moisture Content (percent) Woodbridge also developed additional equations that include various other soil properties, but proposed that including these additional properties in the correlations did not greatly improve the correlation. According to Farrar, et al., the San Diego Road test provided the majority of data used in determining resilient modulus correlations for fine grained soils, specifically an A-7-6 clay. From the San Diego Road Test data, Jones and Witczak developed the following correlation: log =.111( w%) ( S%) M R.(7) where: M R = Resilient Modulus (ksi) S%=Degree of Saturation w%= Water Content According to Thompson and Robnett, degree of saturation was determined to be the most important soil property predictor of resilient modulus. They determined resilient modulus as a function of degree of saturation for fine grained soils based upon the following equations: 8
18 For soils at 95% AASHTO T99 maximum dry density: M R = ( S%).(8) For soils at 100% AASHTO T99 maximum dry density: M R = ( S%) (9) where: M R = Resilient Modulus (ksi) S% = Degree of Saturation Farrar and Turner studied various methods for determining resilient modulus from both R-value of Wyoming soils and index properties of the soils. However, their research included running modified R-value tests in addition to the standard Hveem test. The modified tests were run on samples that were not prepared in accordance with AASHTO T190. Instead, the samples were prepared from material passing the ¾ sieve and a given amount of water to create a certain moisture content (Farrar, et al). From their research, Farrar and Turner recommend the following equation for use with typical Wyoming subgrade soils: M = *( S%) 325( σ ) + 236( σ 3) + 86PI 107( S200).(10) R d + where: M R = Resilient Modulus (psi) S%= Degree of Saturation σ d =deviator stress (psi) σ 3 =confining stress (psi) PI= plasticity index 9
19 S 200 = percent passing No. 200 sieve by weight In addition to the recommended equation using soil index properties, Farrar and Turner also developed Equation 11 using R-value data: LN ( M R ) = R VM σ + d 0.04 σ X (11) C where: LN(M R )= natural logarithm resilient modulus (psi) R VM =modified R-value X C = 1 for clay soils and 0 otherwise σ d =deviator stress (psi) σ 3 =confining stress (psi) The equation including the R-value did not provide as tight of a correlation as the correlation corresponding to index properties. However, Farrar and Turner s analysis showed that the results of their prediction equation fit with previous attempts at correlating soil properties with resilient modulus; any difference was noted as the equations being written for Wyoming subgrade soils specifically. The California Bearing Ratio test is a common test used for correlations. The CBR test measures the percentage of the soil load required to produce a.1 inch deflection compared to a standard crushed stone (Thornton 6). The test is run with a standard piston with an area of 3 in 2 penetrating the soil at a rate of.05 inches/minute. At each 0.1 inch interval up to 0.5 inches, pressure is measured. To determine the CBR value, the ratio of the recorded pressure to the pressure necessary to produce the same 10
20 penetration in a high-quality crushed stone is calculated. The CBR value is most often calculated at 0.1 inch penetration is used unless the ratio at 0.2 inches is greater. The CBR Test is run in accordance with AASHTO T-193. Currently, MEPDG models Resilient Modulus as (NCHRP): M R = 2555( CBR).64 (12) Where: M R = Resilient Modulus (psi) CBR= California Bearing Ratio (percent) as determined by AASHTO T-193 According to Woodbridge, Resilient Modulus has also been predicted as: M R = B * CBR..(13) Where: MR= Resilient Modulus (psi) B= 1500 for CBR< although value may vary from 750 to 3000 CBR= California Bearing Ratio (percent) However, Woodbridge warns that the CBR test cannot accurately mimic the repeated load effects with which Resilient Modulus is associated. Additionally, she states that sometimes CBR can be so unreliable as to exhibit an inverse relationship with Resilient Modulus. 2.3 R-Value Test Using the R-value test and subsequent correlations to estimate the Resilient Modulus is a source of contention amongst academics. In the early 1930s, F.N. Hveem used a modified triaxial test to attempt to develop a relationship between the vertical load applied to a soil specimen and the horizontal stresses that are induced if the material is horizontally confined. The device he constructed based on a triaxial test setup was 11
21 originally used as a way to measure stability of bituminous paving specimens, thus his machine became known as the Stabiliometer. Hveem s original experiments involved subjecting a paving specimen to loads representing typical traffic loads that are frequently repeated over a period of time. In the stability test, horizontal stress is measured at every 1000 pounds of vertical load up to 6000 pounds (400 psi), which Hveem believed to be the ultimate stress developed from truck traffic (Farrar, et al.). Figure 2. Stabiliometer Diagram The stabiliometer was then used to measure the same properties in subgrade soils, a value Hveem coined as the R-value. The R-value test measures the resistance a soil offers to transmitting vertical load in the horizontal direction (Thornton) and is specified by ASTM D2884 and AASHTO T190. When a passing wheel load exerts a downward vertical force on a subgrade soil, the soil resists the force through friction between soil particles. However, if the vertical force is greater than the frictional force offered by 12
22 supporting soil particles, the soil moves in the only path available for movement, the lateral direction (Doyle). During the test, when the vertical stress on the soil specimen reaches 160 psi, horizontal stress is measured. The value of 160 psi holds significance as the average value of vertical stress developed in a typical pavement subgrade (Farrar, et al. 8). But, according to studies performed by Hveem, the number holds no influence on the output of the equation. Similar R-values were calculated with vertical pressure values ranging from 100 to 400 psi. Data from the test is converted to an R-value with the relationship: R = PV ( 1) + 1 D P H (14) where: R= Resistance Value P H =Horizontal Stress at P V =160 psi P V = Vertical Stress (160 psi) D= lateral displacement due to horizontal pressure measured as the displacement of the stabilometer fluid necessary to increase horizontal pressure from 5 to 100 psi measured as number of turns of stabiliomter pump handle This relationship presents a soil s resistance to plastic flow as a ratio of vertical pressure to horizontal pressure on a scale of 0 to 100. A value of 0 indicates that the soil has no shear resistance, much like a liquid, and all applied vertical load is converted to a lateral pressure. A value of 100 indicates that the soil is able to resist all applied vertical loads without transmitting the loads to horizontal pressure (Doyle). This relationship, 13
23 however, includes slight modification to account for the roughness of the soil specimen. If the correction for this roughness factor was ignored, the equation would simplify to: P R = (1 P )*100.(15) where: R= Resistance Value P H =Horizontal Stress at P V =160 psi P V = Vertical Stress (160 psi) which truly is a direct representation of R-value as simply applied vertical pressure and the horizontal pressure that results (Farrar, et al.). Some stipulations must be followed before running the test, however. The test is only to be used on materials that pass the #4 sieve and is not valid for materials that possess high resistance to lateral deformation (Thornton). Additionally, soil specimens are compacted at moisture contents that will cause them to be nearly saturated at exudation pressures of approximately 300 psi. In order to make the test best mimic subgrade soil conditions, it is imperative that the soil be compacted with an apparatus that mimics the loading conditions and the kneading motion of rollers and tires. The compactor invented by Hveem to accomplish this condition is now known as the California kneading compactor. H V 14

24 Figure 3. California Kneading Compactor The tamping foot of the compactor has an area of approximately 3 square inches and provides stresses similar to those a steel drum or rubber-tired pneumatic roller would exert on a subgrade soil (Farrar, et al.), however pressure can be adjusted to achieve the correct soil unit weight. During testing, the exudation pressure in the sample must mimic the state of density and water content that the material may be subject to in the field (Thornton). This exudation pressure is defined as the pressure when moisture exudes from the soil sample with any additional increase in load, or when the soil specimen is loaded to saturation and any additional load is carried by pore water instead of soil particles (Farrar, et al.). An exudation pressure of 300 psi is seen as presenting the worst case moisture content and density that is experienced in the field (Farrar, et al.); however this exudation pressure causes moisture contents that are higher than are found in Colorado highways (Hines). Some studies show that A-7-6 soils compacted at 300 psi exudation pressure were 9.1% over optimum. When performing R-value tests to be used for correlations with Resilient 15
25 Modulus, it is important to consider what moisture content is used. Different highway departments use R-values that correspond to different moisture contents and densities. 2.4 R-Value Correlations The relationship between R-value and resilient modulus is not as well studied as the relationship between Resilient Modulus and California Bearing Ratio (CBR). As a result, the correlation between R-value and Resilient Modulus has been adjusted to fit with the better known test (Woodbridge). The original correlation determined from data from the San Diego Road Test, was altered to..(16) M R = R...(17) to better correlate with data from the CBR test (Farrar, et al.). Other states have developed correlations based upon the soils found locally. For instance, Idaho developed two correlations (Su, et al.): M R = R M R = R for fine grained soils...(18) M R = R for coarse grained soils (19) For fine-grained soils in Idaho, mainly low plasticity silts, the following correlation was developed for a deviator stress of 6 psi, bulk stress of 3 psi, and an R-value over 20 (Farrar, et al.): M R = * R.(20) 16
26 According to tests run by the Colorado Department of Transportation, plotting resilient modulus against the average R-value from tests run on a sample both before and after the resilient modulus test presented a correlation of (Su, et al.): M R = R.(21) According to the report, this correlation is very similar to the current correlation used in design for fine grained soils when the R-value is less than 50. However, when the R- value is higher than 50, the modulus calculated from the equation is significantly lower than what is predicted with the current design standard. 17
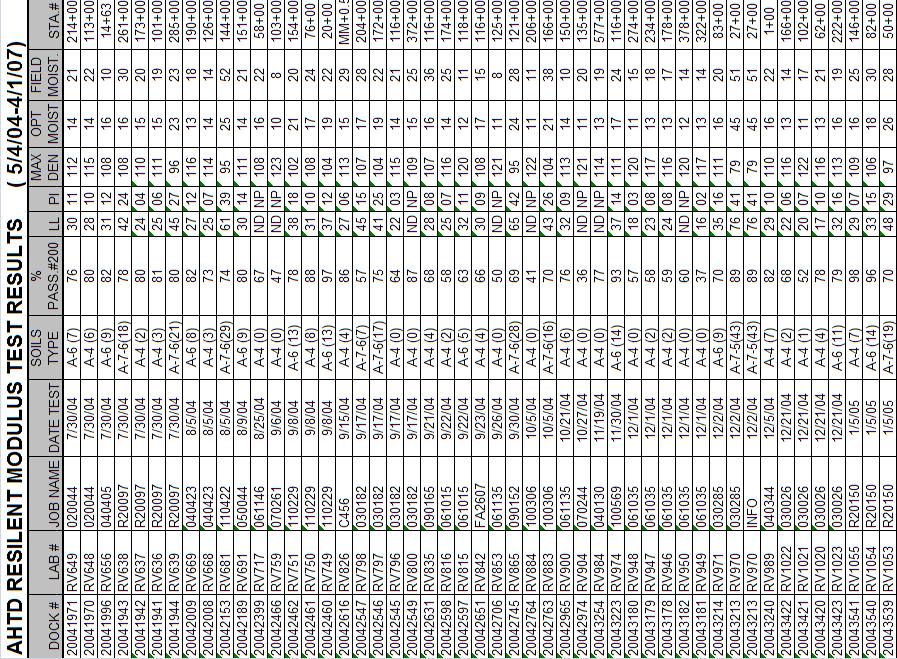
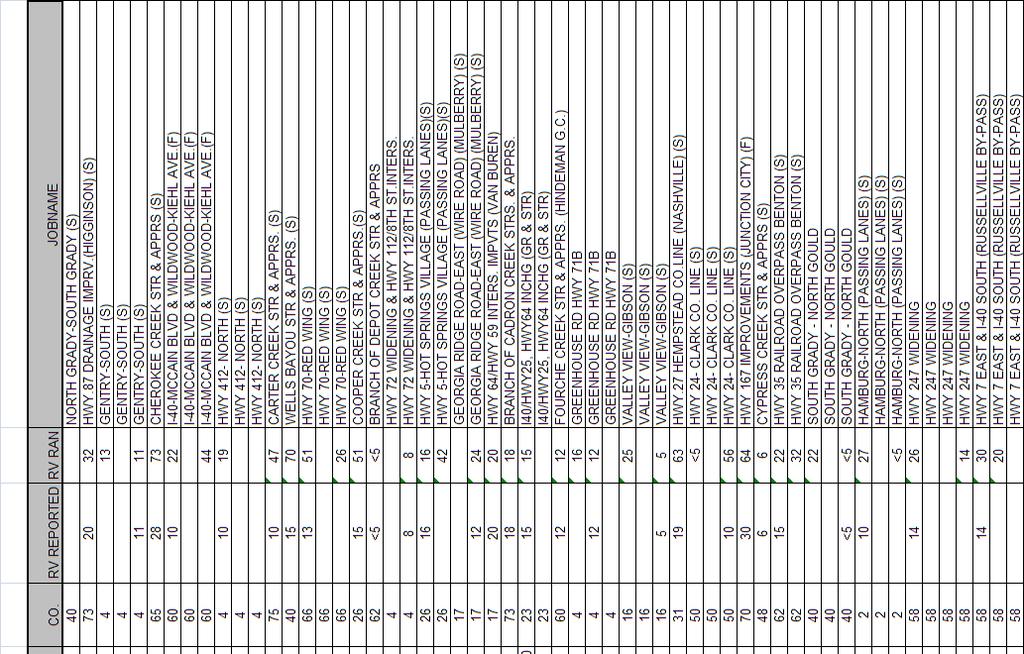
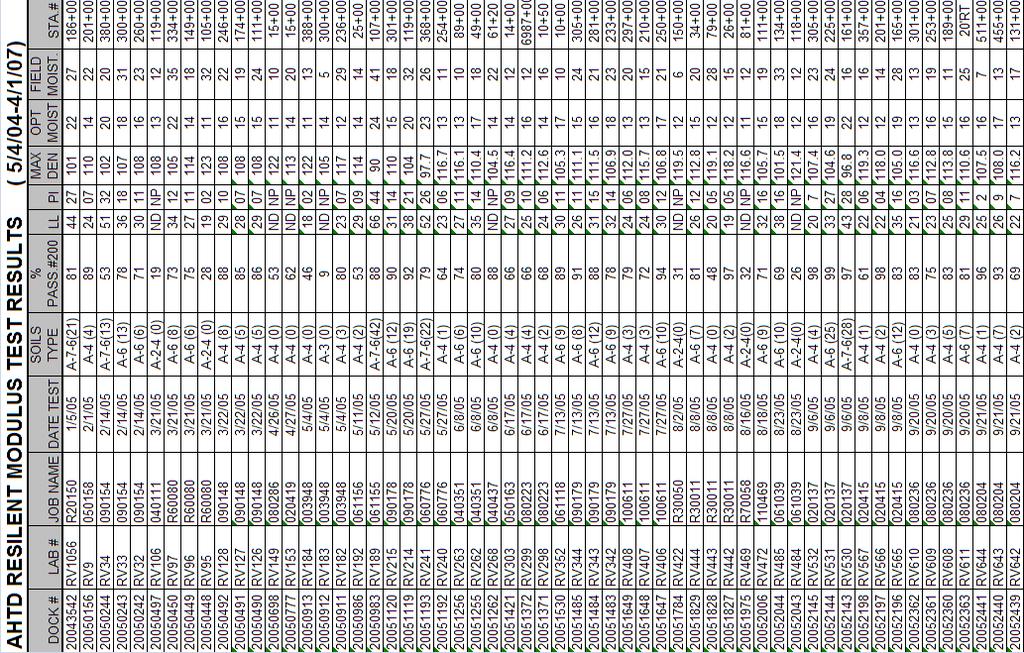
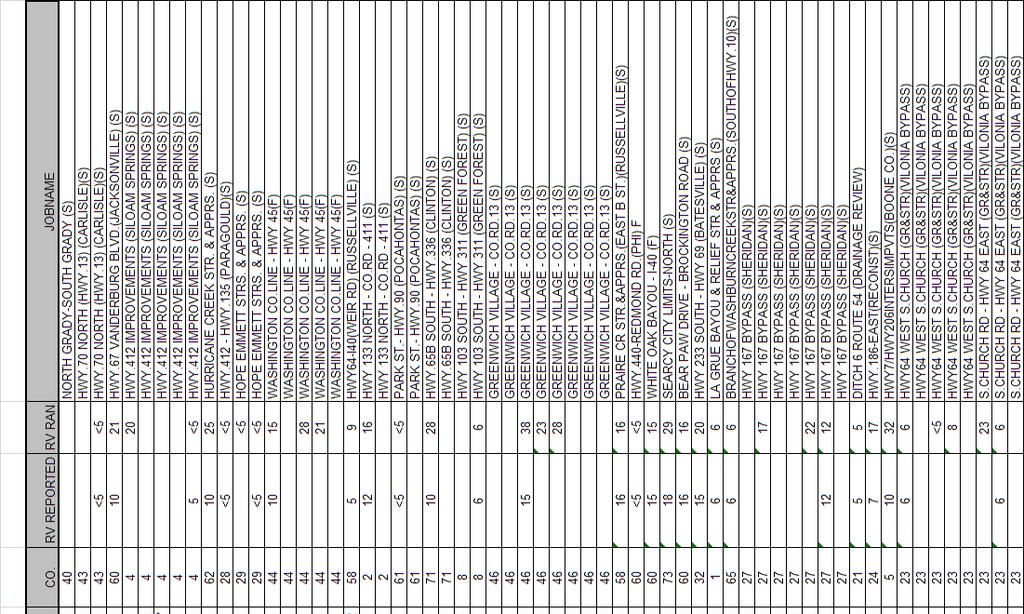
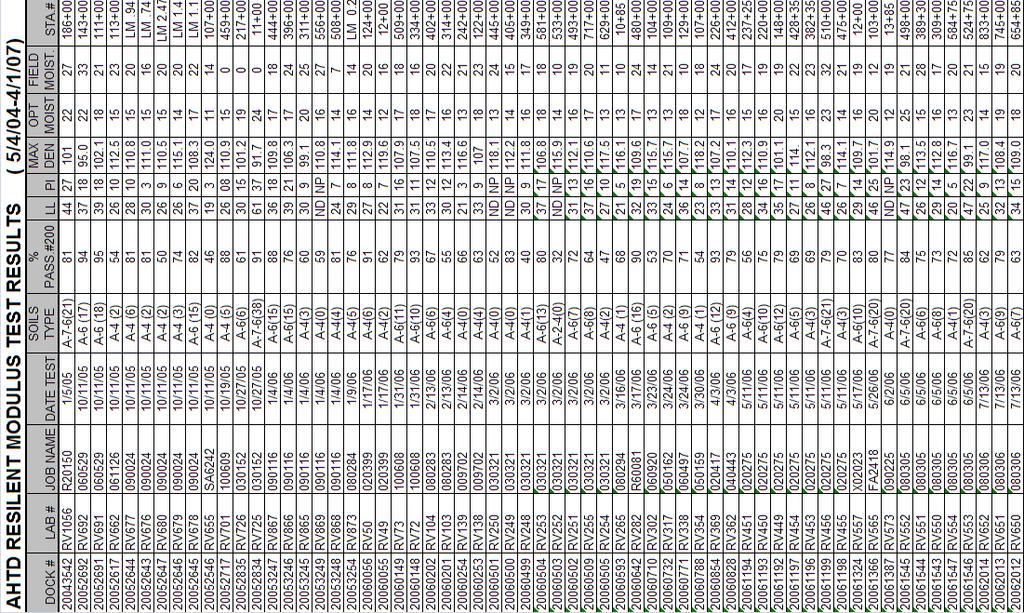
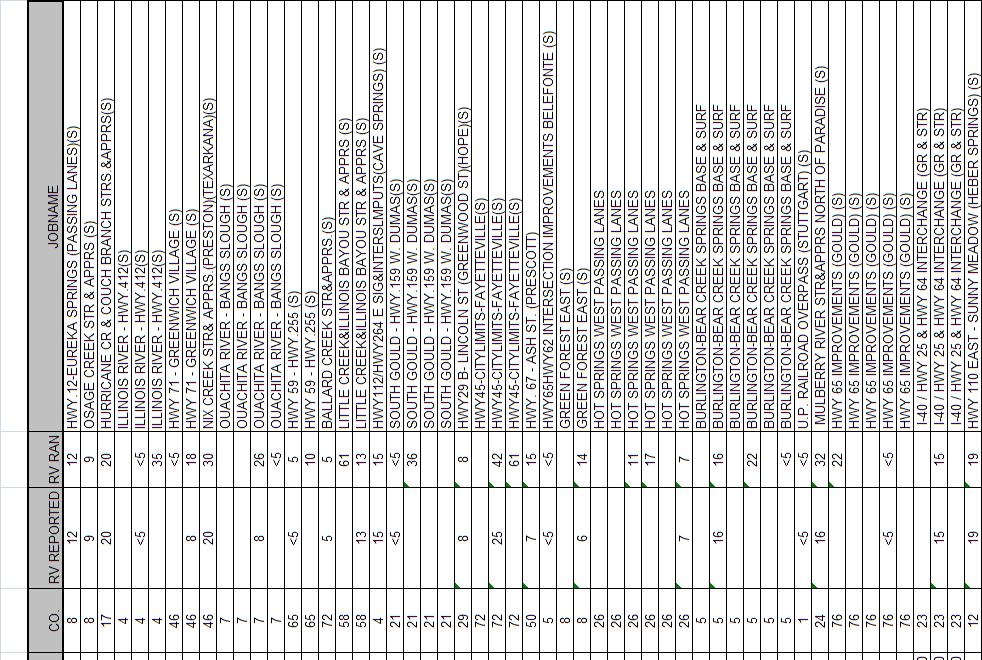
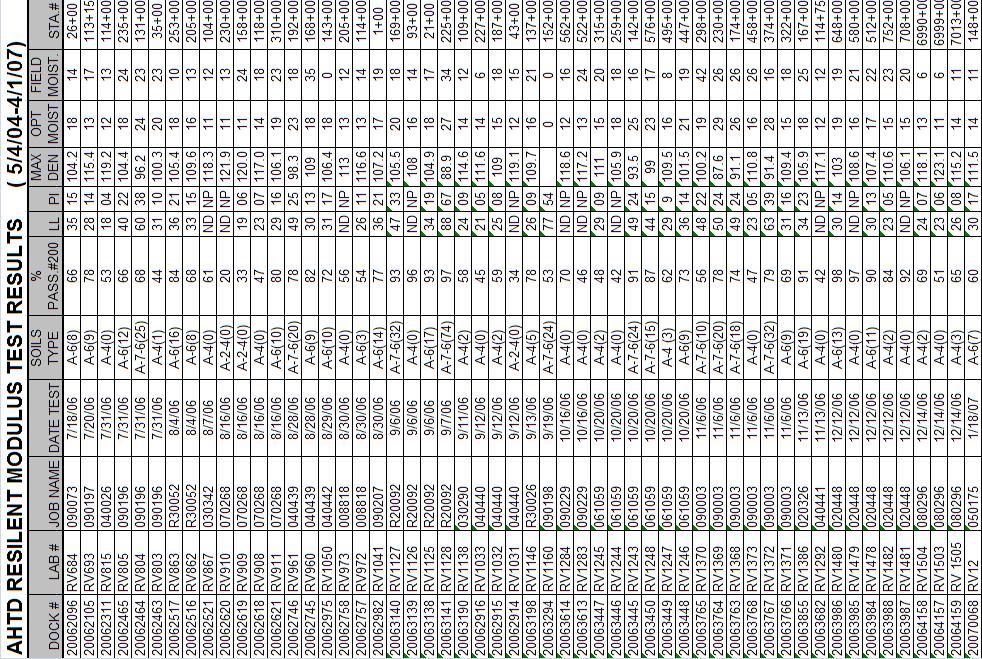
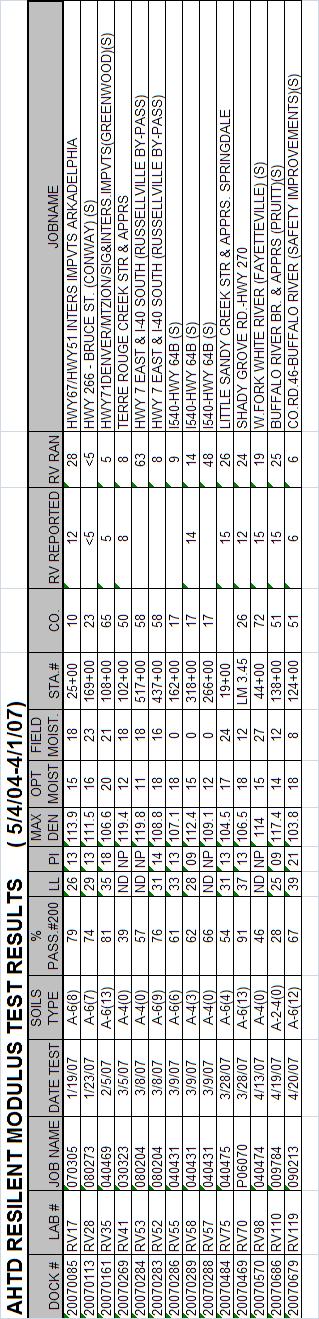
27 3. EXPERIMENTAL DESIGN Data was gathered from the Arkansas State Highway and Transportation Department representing various soils throughout the state of Arkansas. AHTD ran both R-value and resilient modulus tests on soil samples from various locations across the state. Soil types contained in the data are: A-2-Silty or Clayey Gravel A-4-Silt A-6-Clay A-7-6-Clay Ran and Reported values for both R-value and Resilient Modulus tests were both provided reported. The Reported value for a test is the lowest Resilient Modulus value given (and therefore not appropriate for developing a correlation), so for determining a correlation, Resilient Modulus Ran and R-value Ran values were used. A new correlation between R-value and resilient modulus will be attempted by plotting resilient modulus against R-value. This approach was attempted for all soils, as well as splitting the data by soil type (fine grained vs. coarse grained). Additionally, the data was to be plotted against various combinations of the R-values and resilient modulus values as follows (plots can be found in Appendix A): 1. R-value 2 2. R-value 3 3. R-value 4 4. Mr 2 5. Square Root R-value 18
28 6. Square Root Resilient Modulus 7. log R-value 8. log Mr 9. ln R-value 10. ln Mr 11. Mr/R-Value 12. Mr 2 /R-value in an attempt to determine the most accurate correlation. Resilient modulus values calculated from any new correlations were compared to the reported values from the AHTD data and the correlation currently used by the MEPDG software (NCHRP), M R = R.(22) Further analysis of the sensitivity of MEPDG to changes in R-value was also evaluated using two pavement designs as shown in Figures 4 and 5. 2 Hot Mix Asphalt (Surface) 3 Hot Mix Asphalt (Binder) 12 Crushed Stone Base Figure 4. Thinner Pavement Cross Section 19
29 3 Hot Mix Asphalt (Surface) 4 Hot Mix Asphalt (Binder) 5 Hot Mix Asphalt (Base) 12 Crushed Stone Base Figure 5. Thicker Pavement Cross Section Additional information on inputs into MEPDG can be found in Appendix B. R-values of 5, 10, 15, 20, 25, 30, 35, 40, and 45 were input into the program as Level 2 correlations for resilient modulus. The pavement distresses of bottom-up fatigue cracking, IRI, and total rutting that result from the varying R-values were plotted versus time for both the thicker and thinner pavement sections. Then, the same pavement sections were used, but Resilient Modulus was input as a Level 3 correlation calculated from R-values of 5, 10, 15, 20, 25, 30, 35, 40, and 45 using the correlation developed from the AHTD data. Bottom-up fatigue cracking, IRI, and total rutting were plotted vs. time. Using these plots, the sensitivity of MEPDG to variance in Level 2 R-value inputs were analyzed. Furthermore, the variance in fatigues using the correlation developed from the AHTD data to calculate Level 3 resilient modulus inputs were studied. 20
30 4. RESULTS 4.1 Correlations Involving R-Value Plotting Resilient Modulus against R-value does not lead to very promising results. Even separating the data by soil type does not lead to any significant correlation. Furthermore, the various geometric combinations of R-value and Resilient Modulus also seem to move towards a dead end in terms of developing a usable correlation. However, once the ratio (Resilient Modulus to R)-value versus R-value for all soil types is plotted, a more significant relationship begins to develop, illustrated in Figure 6. Figure 6. Relationship Between the (Resilient Modulus to R-Value) ratio and the R-value of Arkansas Soils A power-function regression equation can be developed from this plot as follows: 21
31 R 2 =.8973 Where: M R =Resilient Modulus (psi) R=R-value (23) The R-squared value of this correlation seems to suggest that plotting the ratio of Resilient Modulus to R-value vs. R-value could lead to a usable correlation for Arkansas soils. In an attempt to further refine the correlation, the ratio of the square of Resilient Modulus to R-value vs. R-value is plotted (Figure 7). Contrary to what is expected, the tightness of this of this correlation seems to diminish as evidenced by the lower R- squared value. M R R = * R
32 Figure 7. Mr 2 /R Plot A power-function regression was developed as follows: 2 M R = R R 2 R = (24) Where: M R =Resilient Modulus (psi) R=R-value Subdividing the data by soil type did not result in a more refined correlation, as shown in Figures in Appendix B. 23
33 To try to further refine the correlation, the data was split into soils with R-values below 25 and those with R-values above 25. Different plots were developed for each soil group. Figure 8 shows the plots of Resilient Modulus/R-value vs. R-value split by soil group. Figure 8. Resilient Modulus over R-value vs. R-value Sorted by R-value The correlations developed from these plots include: For R<25: M R = R R 2 R =.7536 For R> 25: (25) 24
34 M R = 30522R R 2 R = (26) Contrary to what is expected, splitting up the data does not further refine the correlation. In fact, the attempt at refinement seemed to make the correlation worse. 4.2 Analyzing Correlations The Mr/R correlation seems to have the tightest fit of the data. A regression line fit through the origin yields a slope of.9298, which is relatively close to a unity equation that would be expected in the predicted and actual M R /R values were equivalent. However, when the predicted (M R /R) is plotted against actual (M R /R) depending on R- value, the correlation appears to become less robust when the ratio exceeds 1000 (Figure 9). 25
35 Figure 9. Comparrison of Predicted Mr/R and Actual Mr/R The Resilient Modulus generated from the correlation currently in use in MEPDG (Equation 22) was compared to the Mr /R correlation developed using Arkansas data (Equation 23). Figure 10 shows how incorrectly the MEPDG correlation predicts Resilient Modulus using R-value for soils commonly seen in Arkansas. The Mr/R correlation is a much tighter fit for soils in Arkansas. 26
36 Figure 10. Comparison of Correlations 4.3 MEPDG Tests The potential importance of the new subgrade soil correlation is highlighted by running MEPDG trials. The sections which follow describe the results of an MEPDG-based study. 27
37 4.3.1 Current MEPDG Correlation Thicker Cross Section Figure 11 shows the MEPDG estimate of total rutting with varying levels of R-value for the subgrade soil (Level 2 input). Inspection of the curves shown in Figure 11 leads to the following observations: Total rutting is significantly affected by the R-value Total rutting decreases with an increase in R-value As R-value increases, the difference in total rutting (the effect of varying R-value) decreases. Figure 11. Total Rutting vs. Time, Thicker Cross Section, Current Correlation 28
38 Figure 12 shows the MEPDG estimate of bottom up cracking with varying levels of R- value for the subgrade soil (Level 2 input). Inspection of the curves shown in Figure 12 leads to the following observations: Bottom up cracking is significantly affected by the R-value Bottom up cracking decreases with an increase in R-value As R-value increases, the difference in bottom up cracking (the effect of varying R-value) decreases. Figure 12. Bottom-Up Cracking vs. Time, Thicker Cross Section, Current Correlation 29
39 Figure 13 shows the MEPDG estimate of IRI with varying levels of R-value for the subgrade soil (Level 2 input). Inspection of the curves shown in Figure 13 leads to the following observations: IRI is affected by the R-value IRI decreases with an increase in R-value As R-value increases, the difference in IRI (the effect of varying R- value) decreases. Figure 13. IRI vs. Time, Thicker Cross Section, Current MEPDG Correlation 30
40 Thinner Cross Section Figure 14 shows the MEPDG estimate of Total Rutting with varying levels of R-value for the subgrade soil (Level 2 input). Inspection of the curves shown in Figure 14 leads to the following observations: Total rutting is significantly affected by the R-value Total rutting decreases with an increase in R-value As R-value increases, the difference in total rutting (the effect of varying R-value) decreases. Figure 14. Total Rutting vs. Time, Thinner Cross Section, Current Correlation 31
41 Figure 15 shows the MEPDG estimate of Bottom Up Cracking with varying levels of R- value for the subgrade soil (Level 2 input). Inspection of the curves shown in Figure 15 leads to the following observations: Bottom Up Cracking is affected by the R-value Bottom Up Cracking decreases with an increase in R-value As R-value increases, the difference in Bottom Up Cracking (the effect of varying R-value) decreases. Figure15. Bottom-Up Fatigue vs. Time, Thinner Cross Section, Current Correlation 32
42 Figure 16 shows the MEPDG estimate of IRI with varying levels of R-value for the subgrade soil (Level 2 input). Inspection of the curves shown in Figure 16 leads to the following observations: IRI is affected by the R-value in the long run IRI decreases with an increase in R-value As R-value increases, the difference in IRI (the effect of varying R- value) decreases. Figure 16. IRI vs. Time, Thinner Cross Section, Current Correlation 33
43 4.3.2 Pavement Failures with New Correlation Thicker Cross Section Figure 17 shows the estimate of Total Rutting with varying levels of R-value for the subgrade soil using the Arkansas-specific correlation (Level 3 input). Inspection of the curves shown in Figure 17 leads to the following observations: Total rutting is slightly affected by the R-value Total rutting increases with an increase in R-value As R-value increases, the difference in total rutting (the effect of varying R-value) decreases. Figure 17. Total Rutting vs. Time, Thicker Cross Section, New Correlation 34
44 Figure 18 shows the estimate of Bottom-up Cracking with varying levels of R-value for the subgrade soil using the Arkansas-specific correlation (Level 3 input). Inspection of the curves shown in Figure 18 leads to the following observations: Bottom-up Cracking is affected by the R-value Bottom-up Cracking increases with an increase in R-value As R-value increases, the difference in Bottom-up Cracking (the effect of varying R-value) decreases. Figure 18. Bottom Up Cracking vs. Time, Thicker Cross Section, New Correlation 35
45 Figure 19 shows the estimate of IRI with varying levels of R-value for the subgrade soil using the Arkansas-specific correlation (Level 3 input). Inspection of the curves shown in Figure 19 leads to the following observations: IRI is not significantly affected by the R-value As R-value increases, the difference in IRI (the effect of varying R- value) shows no significant change. Figure 19. IRI vs. Time, Thicker Cross Section, New Correlation 36
46 Thinner Cross Section Figure 20 shows the estimate of Total Rutting with varying levels of R-value for the subgrade soil using the Arkansas-specific correlation (Level 3 input). Inspection of the curves shown in Figure 20 leads to the following observations: Total rutting is slightly affected by the R-value Total rutting increases with an increase in R-value As R-value increases, the difference in total rutting (the effect of varying R-value) decreases. Figure 20. Total Rutting vs. Time, Thinner Cross Section, New Correlation 37
47 Figure 21 shows the estimate of Bottom Up Cracking with varying levels of R-value for the subgrade soil using the Arkansas-specific correlation (Level 3 input). Inspection of the curves shown in Figure 21 leads to the following observations: Bottom Up Cracking is slightly affected by the R-value Bottom Up Cracking increases with an increase in R-value As R-value increases, the difference in Bottom Up Cracking (the effect of varying R-value) remains constant. Figure 21. Bottom Up Cracking vs. Time, Thinner Cross Section, New Correlation 38
48 Figure 22 shows the estimate of IRI with varying levels of R-value for the subgrade soil using the Arkansas-specific correlation (Level 3 input). Inspection of the curves shown in Figure 22 leads to the following observations: IRI is slightly affected by the R-value IRI increases with an increase in R-value As R-value increases, the difference in IRI (the effect of varying R- value) remains constant. Figure 22. IRI vs. Time, Thinner Cross Section, New Correlation 39
49 5. DISCUSSION AND CONCLUSIONS It is clear that the current R-value to Resilient Modulus MEPDG correlation may lead to significantly under-designed pavements when R-value for Arkansas soils is beyond approximately 25, especially in thinner pavements and over-designed pavements when R-value is 10 or below. There seems to be little true correlation between R-value and Resilient Modulus at all; even the newly developed correlation begins to break down at higher R-values due to a lack of data and the mathematical manipulations performed on the data when developing the correlation. When using the current MEPDG correlation, there is a significant difference in pavement failures over the course of 20 years for both the thin and thick pavement sections for varying R-values. When a soil has a low R- value, the effect of R-value on predicted pavement performance is pronounced. The thinner pavement does not have the same capacity to diminish the applied traffic loads and the loading effects are increased. Any slight variance in the lower R-values can lead to very different failures than what is expected from the MEPDG output. This means that a pavement that is even slightly underdesigned with regards to R-value with the current MEPDG correlation can experience extreme rutting failures more quickly. Interestingly, the Arkansas-specific correlation exhibits an inverse trend: Resilient Modulus decreases with increasing R-value. Even though the new R-value correlation drastically improves using R-value as a predictor of Resilient Modulus, it is important to keep in mind that the R-value test is a static test measuring how a soil reacts to a vertical load in a lateral direction while Resilient Modulus measures how a soil reacts to a cyclic loading pattern much like what a soil would experience under a pavement. Using a static test to predict a dynamic soil property will not provide the most accurate results, but it 40
50 seems that the two soil properties should exhibit a direct correlation. Additionally, the correlations was developed using a limited amount of data. In order to develop the best possible correlation, additional data should be gathered. Because of this discontinuity in the data and the lack of data, the testing procedures used to obtain both Resilient Modulus and R-value should be reviewed to make sure the measured values are correct and more R-value and Resilient Modulus tests should be run. If the data is deemed correct and if AHTD chooses to continue using R-value correlations as their way to determine Resilient Modulus in MEPDG, consideration must be given to abandoning the default MEPDG correlation and using a more Arkansas soil specific correlation. While the new correlation is not a perfect solution and certainly does not match the accuracy of using Resilient Modulus test data as a Level 3 input in MEPDG, it is a much closer match for soils commonly found throughout the state of Arkansas. Since the new correlation more closely follows the pattern of data and does not show much variance in Resilient Modulus with changes in R-value, the variances in R- value do not cause the dramatic separation in data that the current MEPDG correlation causes for both thin and thick pavement cross sections. If the R-value of a soil is measured slightly higher than the actual R-value of the soil, the effect on pavement failures will not be as dramatic as what could happen if the incorrect R-value was input to MEPDG using the current correlation. 41
51 6. REFERENCES American Association of State Highway and Transportation Officials AAHSTO Guide for Design of Pavement Structures, Washington D.C., (1986). Carmichael, R.F. and Stuart, E. Prediction Resilient Modulus: A Study to Determine the Mechanical Properties of Subgrade Soils. Transportation Research Record 1043, TRB, Washington D.C (1985). Doyle, Lynn Curtis. A Further Correlation Study of the AASHO Coefficients of Relative Strength of Flexible Pavement Components with California R-Test Values Using Unstabilized Base and Subbase Materials from Arkansas. Master s Thesis, University of Arkansas. (1967). Farrar, Michael J., and Turner, John P. Resilient Modulus of Wyoming Subgrade Soils. Mountain Plains Consortium No University of Wyoming. Laramie, Wyoming. (1991). Hines, Charles R. (1978) Correlation of Subgrade Modulus and Stabilometer R Values. Federal Highway Administration RD-78-S0841. Colorado Division of Highways, Denver, Colorado (1978). Huang, Y.H. Pavement Analysis and Design, Prentice Hall, pp , (1993). Interim Mechanistic-Empirical Pavement Design Guide Manual of Practice. National Cooperative Highway Research Program, Transportation Research Board, National Academies, Washington DC. (2007). National Asphalt Pavement Associaton. NAPA Guide for Hot Mix Asphalt Pavements. (CDROM), Lanham, Maryland. (2002). Su, Cheng-Kuang, and Yeh, Shan-Tai. Resilient Properties of Colorado Soils. Staff Materials Branch Report Colorado Department of Highways Denver, Colorado. (1989). Thornton, Sam I. Correlation of Subgrade Reaction with CBR, Hveem Stabilometer, or Resilient Modulus. Arkansas State Highway and Transportation Department. Little Rock, Arkansas. (1983). Woodbridge, Ronota Ann. Predicting Subgrade Resilient Modulus From Other Soil Properties. Master s Thesis, Civil Engineering Department, University of Arkansas. (1989). 42
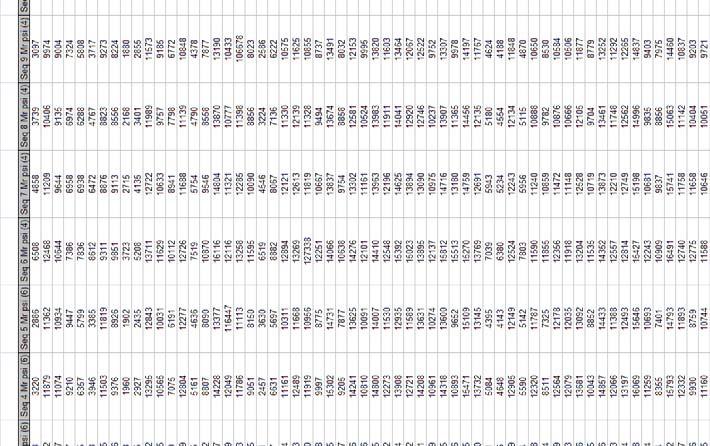
52 APPENDIX A AHTD DATA 43

53 Table A1. AHTD Soil Properties 44

54 45
55 46
56 47
57 48
58 49


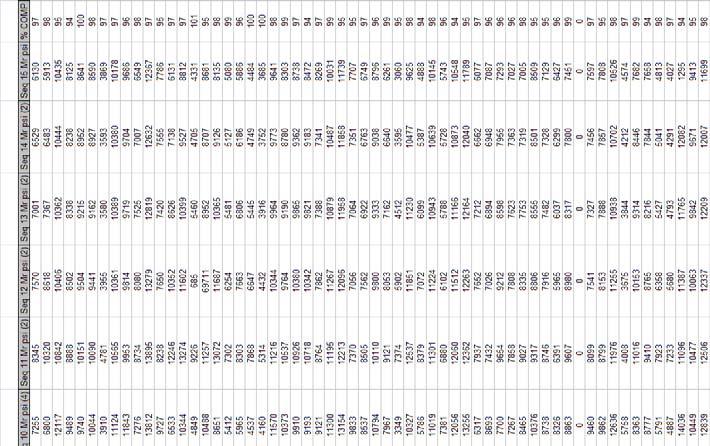
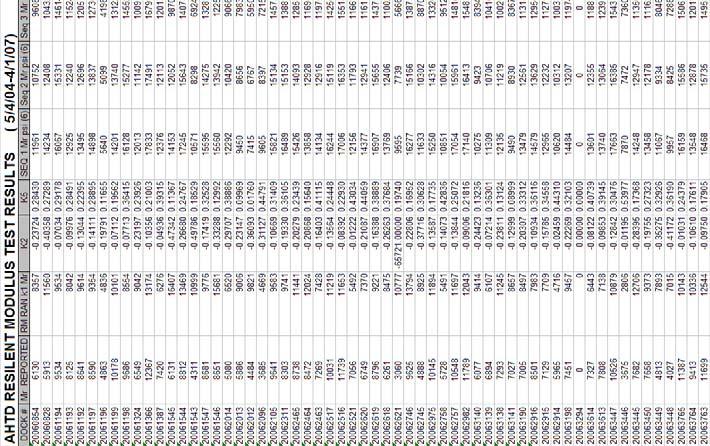
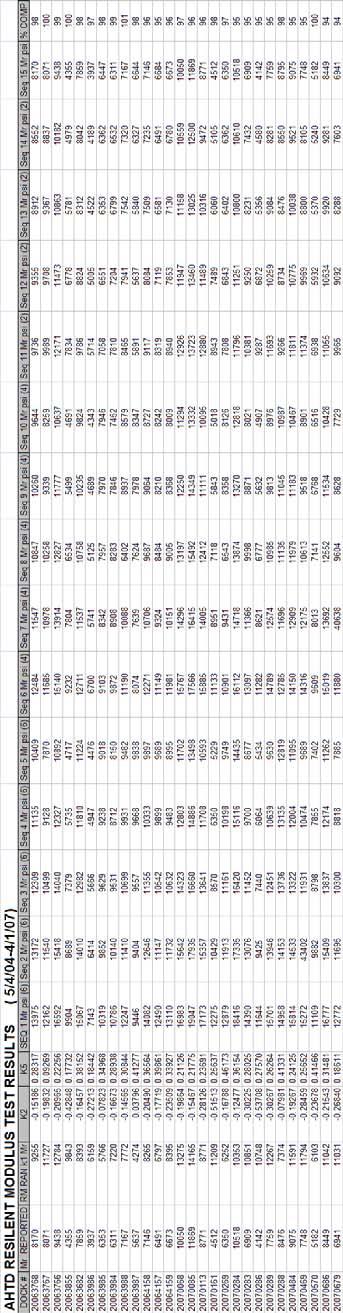
59 Table A2. AHTD Resilient Moduli 50
60 51
61 52
62 53
63 54
64 APPENDIX B RESILIENT MODULUS RAN VS. R-VALUE RAN CORRELATIONS 55
65 Mr vs. R r M A-2-4 A-4 A-6 A R Figure 23. Resilient Modulus vs. R-value R Squared r M A-2-4 A-4 A-6 A R Squared Figure 24. Resilient Modulus vs. R-value Squared 56
66 R Cubed r M A-2-4 A-4 A-6 A R Cubed Figure 25. Resilient Modulus vs. R-value Cubed Mr Squared d re a u q S r M A-2-4 A-4 A-6 A R Figure 26. Resilient Modulus Squared vs. R-value 57
67 Square Root R r M A-2-4 A-4 A-6 A Sq Root R Figure 27. Resilient Modulus vs. Square Root R-value Square Root Mr r M10000 t o R q S 8000 A-2-4 A-4 A-6 A R Figure 28. Square Root of Resilient Modulus vs. R-value 58
68 log R r M A-2-4 A-4 A-6 A log R Figure 29. Resilient Modulus vs. Log(R-value) log Mr r M g3.9 lo A-2-4 A-4 A-6 A R-value Figure 30. Log(Resilient Modulus) vs. R-value 59
69 ln R r M A-2-4 A-4 A-6 A ln R Figure 31. Resilient Modulus vs. Ln(R-value) ln Mr r M ln 8.8 A-2-4 A-4 A-6 A R-value Figure 32. Ln(Resilient Modulus) vs. R-value 60
70 Mr/R r/r 1500 M A-2-4 A-4 A-6 A R Figure 33. (Resilient Modulus/R-value) vs. R-value Mr^2/R ) / R 2 r^ (M A 2 4 A 4 A 6 A R Value Figure 34. (Resilient Modulus Squared/R-value) vs. R-value 61
71 APPENDIX C SAMPLE MEPDG INPUT FILES 62
72 Project: Thicker R=5 Level 3.dgp General Information Design Life 20 years Base/Subgrade construction: August, 2006 Pavement construction: September, 2006 Traffic open: October, 2006 Type of design Flexible Description: Analysis Parameters Performance Criteria Initial IRI (in/mi) Terminal IRI (in/mi) AC Surface Down Cracking (Long. Cracking) (ft/mile): AC Bottom Up Cracking (Alligator Cracking) (%): AC Thermal Fracture (Transverse Cracking) (ft/mi): Chemically Stabilized Layer (Fatigue Fracture) Permanent Deformation (AC Only) (in): Permanent Deformation (Total Pavement) (in): Reflective cracking (%): Limit Reliability Location: Fayetteville Project ID: Thinner Section R=5 Section ID: Date: 2/22/2008 Station/milepost format: Station/milepost begin: Station/milepost end: Traffic direction: Default Input Level Default input level East bound Level 3, Default and historical agency values. Traffic Initial two-way AADTT: Number of lanes in design direction: Percent of trucks in design direction (%): Percent of trucks in design lane (%): Operational speed (mph): Traffic -- Volume Adjustment Factors Monthly Adjustment Factors Month January February March April May June July August September October November December (Level 3, Default MAF) Vehicle Class Class 4 Class 5 Class 6 Class 7 Class 8 Class 9 Class 10 Class 11 Class 12 Class
73 Vehicle Class Distribution Hourly truck traffic distribution (Level 3, Default Distribution) by period beginning: AADTT distribution by vehicle class Midnight 2.3% Noon 5.9% Class 4 1.8% 1:00 am 2.3% 1:00 pm 5.9% Class % 2:00 am 2.3% 2:00 pm 5.9% Class 6 7.6% 3:00 am 2.3% 3:00 pm 5.9% Class 7 0.5% 4:00 am 2.3% 4:00 pm 4.6% Class 8 5.0% 5:00 am 2.3% 5:00 pm 4.6% Class % 6:00 am 5.0% 6:00 pm 4.6% Class % 7:00 am 5.0% 7:00 pm 4.6% Class % 8:00 am 5.0% 8:00 pm 3.1% Class % 9:00 am 5.0% 9:00 pm 3.1% Class % 10:00 am 5.9% 10:00 pm 3.1% 11:00 am 5.9% 11:00 pm 3.1% Traffic Growth Factor Vehicle Class Class 4 Class 5 Class 6 Class 7 Class 8 Class 9 Class 10 Class 11 Class 12 Class 13 Growth Rate 4.0% 4.0% 4.0% 4.0% 4.0% 4.0% 4.0% 4.0% 4.0% 4.0% Growth Function Compound Compound Compound Compound Compound Compound Compound Compound Compound Compound Traffic -- Axle Load Distribution Factors Level 3: Default Traffic -- General Traffic Inputs Mean wheel location (inches from the lane marking): Traffic wander standard deviation (in): Design lane width (ft): Number of Axles per Truck Vehicle Class Class 4 Class 5 Class 6 Class 7 Class 8 Class 9 Class 10 Class 11 Class 12 Class 13 Single Tandem Tridem Quad Axle Axle Axle Axle
Flexible Pavement Design
 Flexible Pavement Design The Mechanistic-Empirical Way Presented by: Keith D. Herbold, P.E. 1 Presentation Outline What s new in flexible design Example of new design Differences Capabilities Tests and
SELECTION OF SUBGRADE MODULUS FOR PAVEMENT OVERLAY DESIGN PROCEDURES
 SELECTION OF SUBGRADE MODULUS FOR PAVEMENT OVERLAY DESIGN PROCEDURES by Khaled Ksaibati, Michael L. Whelan, and James M. Burczyk Department of Civil and Architectural Engineering The University of Wyoming
2002 Design Guide Preparing for Implementation
 2002 Preparing for Implementation By Monte Symons 2003 NCUAPG Annual Meeting Excerpts from the 2002 Guide Implementation Package 2002 Presentation Overview Need for NCHRP 1-37A - Status Guide Basics Asphalt
Mechanistic-Empirical Pavement Design Guide: A User s Perspective. Brian D. Prowell, Ph.D., P.E.
 Mechanistic-Empirical Pavement Design Guide: A User s Perspective Brian D. Prowell, Ph.D., P.E. Empirical Approach Based on results of experiments or experience Scientific basis not established AASHTO
ACKNOWLEDGMENT OF SPONSORSHIP
 ACKNOWLEDGMENT OF SPONSORSHIP This work was sponsored by the American Association of State Highway and Transportation Officials, in cooperation with the Federal Highway Administration, and was conducted
GeoShanghai 2010 International Conference Paving Materials and Pavement Analysis
 Particle Shape, Type and Amount of Fines, and Moisture Affecting Resilient Modulus Behavior of Unbound Aggregates Debakanta Mishra 1, Erol Tutumluer 2, M. ASCE, Yuanjie Xiao 3 1 Graduate Research Assistant,
Impact of Existing Pavement on Jointed Plain Concrete Overlay Design and Performance
 Impact of Existing Pavement on Jointed Plain Concrete Overlay Design and Performance Michael I. Darter, Jag Mallela, and Leslie Titus-Glover 1 ABSTRACT Concrete overlays are increasingly being constructed
MECHANISTIC-EMPIRICAL LOAD EQUIVALENCIES USING WEIGH IN MOTION
 MECHANISTIC-EMPIRICAL LOAD EQUIVALENCIES USING WEIGH IN MOTION Prepared By: Curtis Berthelot Ph.D., P.Eng. Dept. of Civil Engineering University of Saskatchewan Tanya Loewen Dept. of Civil Engineering
SUITABILITY OF USING CALIFORNIA BEARING RATIO TEST TO PREDICT RESILIENT MODULUS
 SUITABILITY OF USING CALIFORNIA BEARING RATIO TEST TO PREDICT RESILIENT MODULUS By: Beena Sukumaran, Associate Professor, Civil & Environmental Engineering Rowan University 201 Mullica Hill Road, Glassboro,
METHODS FOR EVALUATING RESILIENT MODULI OF PAVING MATERIALS
 Project Number ST 2019-7 Summary Report METHODS FOR EVALUATING RESILIENT MODULI OF PAVING MATERIALS sponsored by The State of Alabama Highway Department Montgomery, Alabama Frazier Parker, Jr. David J.
2008 SEAUPG CONFERENCE-BIRMINGHAM, ALABAMA
 Introduction Overview M E E Design Inputs MEPDG Where are we now MEPDG Inputs, Outputs, and Sensitivity Southeast Asphalt User Producer Group Bill Vavrik 19 November 2008 2 Implementation Timeframe DARWin
Determination of Resilient Modulus Model for Road-Base Material
 JOURNAL OF APPLIED SCIENCES RESEARCH ISSN: 1819-544X Published BY AENSI Publication EISSN: 1816-157X http://www.aensiweb.com/jasr 2017 January; 13(1): pages 10-16 Open Access Journal Determination of Resilient
Evaluation of Rutting Depth in Flexible Pavements by Using Finite Element Analysis and Local Empirical Model
 American Journal of Engineering and Applied Sciences, 2012, 5 (2), 163-169 ISSN: 1941-7020 2014 Abed and Al-Azzawi, This open access article is distributed under a Creative Commons Attribution (CC-BY)
Mechanistic-Empirical Pavement Design Guide Distress Models
 Mechanistic-Empirical Pavement Design Guide Distress Models By: Mohamed El-Basyouny Arizona State University Pavement Performance Models Symposium Laramie - Wyoming June 23, 2006 Outline Analysis Methodology
Mechanistic Pavement Design
 Seminar on Pavement Design System and Pavement Performance Models Reykjavik, 22. 23. March, 2007 Mechanistic Pavement Design A Road to Enhanced Understanding of Pavement Performance Sigurdur Erlingsson
NJDOT RESEARCH PROJECT MANAGER: Mr. Anthony Chmiel
 Project Title: RFP NUMBER: CAIT NJDOT Bureau of Research QUARTERLY PROGRESS REPORT Evaluation of Poisson s Ratio NJDOT RESEARCH PROJECT MANAGER: Mr. Anthony Chmiel TASK ORDER NUMBER/Study Number: Task
Mn/DOT Flexible Pavement Design Mechanistic-Empirical Method
 Mn/DOT Flexible Pavement Design Mechanistic-Empirical Method Pavement Design Systems and Pavement Performance Models March 22-23, 2007 - Reykjavik, Iceland Bruce Chadbourn Assistant Pavement Design Engineer
Sensitivity Analysis Of Aashto's 2002 Flexible And Rigid Pavement Design Methods
 University of Central Florida Electronic Theses and Dissertations Masters Thesis (Open Access) Sensitivity Analysis Of Aashto's 2002 Flexible And Rigid Pavement Design Methods 2006 Sanjay Shahji University
Determination of AASHTO Layer Coefficients for Granular Materials by Use of Resilient Modulus
 Missouri University of Science and Technology Scholars' Mine Civil, Architectural and Environmental Engineering Faculty Research & Creative Works Civil, Architectural and Environmental Engineering 1-1-1994
Resilient modulus and segregation potential estimation from simplified laboratory procedure
 Resilient modulus and segregation potential estimation from simplified laboratory procedure Jean-Pascal Bilodeau, ing., Ph.D. Research engineer, department of civil engineering, Laval University Guy Doré,
Impact of Water on the Structural Performance of Pavements
 Impact of Water on the Structural Performance of Pavements S. Erlingsson Highway Engineering, VTI The Swedish National Road and Transport Research Institute, Linköping, Sweden & Faculty of Civil and Environmental
GEOSYNTHETICS ENGINEERING: IN THEORY AND PRACTICE
 GEOSYNTHETICS ENGINEERING: IN THEORY AND PRACTICE Prof. J. N. Mandal Department of civil engineering, IIT Bombay, Powai, Mumbai 400076, India. Tel.022-25767328 email: cejnm@civil.iitb.ac.in Module-5 LECTURE-
Comparison of Ontario Pavement Designs Using the AASHTO 1993 Empirical Method and the Mechanistic-Empirical Pavement Design Guide Method
 Comparison of Ontario Pavement Designs Using the AASHTO 1993 Empirical Method and the Mechanistic-Empirical Pavement Design Guide Method by Jonathan Nathan Boone A thesis presented to the University of
INTRODUCTION TO PAVEMENT STRUCTURES
 INTRODUCTION TO PAVEMENT STRUCTURES A pavement is a structure composed of structural elements, whose function is to protect the natural subgrade and to carry the traffic safety and economically. As a wheel
research report Virginia Transportation Research Council Final Report VTRC 09-R4 M. SHABBIR HOSSAIN, Ph.D., P.E. Research Scientist
 Final Report VTRC 09-R4 Virginia Transportation Research Council research report Characterization of Subgrade Resilient Modulus for Virginia Soils and Its Correlation with the Results of Other Soil Tests
Seasonal Resilient Modulus Inputs for Tennessee Soils and Their Effects on Asphalt Pavement Performance
 Seasonal Resilient Modulus Inputs for Tennessee Soils and Their Effects on Asphalt Pavement Performance 0 0 0 Changjun Zhou E-mail: czhou@utk.edu Baoshan Huang (Corresponding author) E-mail: bhuang@utk.edu
Dynamic Resilient Modulus and the Fatigue Properties of Superpave HMA Mixes used in the Base Layer of Kansas Flexible Pavements
 06-1012 Dynamic Resilient Modulus and the Fatigue Properties of Superpave HMA Mixes used in the Base Layer of Kansas Flexible Pavements by Stefan A. Romanoschi, Nicoleta Dumitru, Octavian Dumitru and Glenn
ALACPA-ICAO Seminar on PMS. Lima Peru, November 2003
 ALACPA-ICAO Seminar on PMS Lima Peru, 19-22 November 2003 Airport Pavements FWD/HWD Testing and Evaluation By: Frank B. Holt Vice President Dynatest International A/S Dynamic Testing The method of FWD/HWD
Application of DCP in Prediction of Resilient Modulus of Subgrade Soils
 Application of DCP in Prediction of Resilient Modulus of Subgrade Soils Louay Mohammad, Ph.D. Louisiana Transportation Research Center Louisiana State University 2006 Pavement Performance Seminar April
Guide for Mechanistic-Empirical Design
 Copy No. Guide for Mechanistic-Empirical Design OF NEW AND REHABILITATED PAVEMENT STRUCTURES FINAL DOCUMENT APPENDIX EE-1: INPUT DATA FOR THE CALIBRATION AND VALIDATION OF THE DESIGN GUIDE FOR NEW CONSTRUCTED
TECHNICAL PAPER INVESTIGATION INTO THE VALIDATION OF THE SHELL FATIGUE TRANSFER FUNCTION
 Authors: TECHNICAL PAPER INVESTIGATION INTO THE VALIDATION OF THE SHELL FATIGUE TRANSFER FUNCTION Anthony Stubbs (Presenter), BE(Hons), Masters student, University of Canterbury. aps49@student.canterbury.ac.nz.
Canadian Geotechnical Journal SUBGRADE RESILIENT MODULUS PREDICTION FROM LIGHT WEIGHT DEFLECTOMETER
 SUBGRADE RESILIENT MODULUS PREDICTION FROM LIGHT WEIGHT DEFLECTOMETER Journal: Manuscript ID cgj-2016-0062.r1 Manuscript Type: Article Date Submitted by the Author: 12-Jul-2016 Complete List of Authors:
SENSITIVITY ANALYSIS OF THE VESYS PROGRAM TO PREDICT CRITICAL PAVEMENT RESPONSES FOR RUTTING AND FATIGUE PERFORMANCES OF PAVEMENT INFRASTRUCTURES
 SENSITIVITY ANALYSIS OF THE VESYS PROGRAM TO PREDICT CRITICAL PAVEMENT RESPONSES FOR RUTTING AND FATIGUE PERFORMANCES OF PAVEMENT INFRASTRUCTURES Ghazi G. Al-Khateeb 1, Raghu Satyanarayana 2, and Katherine
What is on the Horizon in HMA. John D AngeloD Federal Highway Administration
 What is on the Horizon in HMA John D AngeloD Federal Highway Administration Are they all the same? Internal Angle of Gyration Internal Angle of Gyration Development of the Dynamic Angle Validator (DAV)
Rheological Properties and Fatigue Resistance of Crumb Rubber Modified Bitumen
 Rheological Properties and Fatigue Resistance of Crumb Rubber Modified Bitumen F. Khodary Department of Civil Engineering, Institute of traffic and transport, section of road and pavement engineering,
Pavement Design Where are We? By Dr. Mofreh F. Saleh
 Pavement Design Where are We? By Dr. Mofreh F. Saleh Pavement Design Where are We?? State-of-Practice State-of-the-Art Empirical Mechanistic- Empirical Mechanistic Actual Current Practice?? Inputs Structure
The Development of a Performance Specification for Granular Base and Subbase Material
 FHWA-NJ-2005-003 The Development of a Performance Specification for Granular Base and Subbase Material FINAL REPORT Mr. Thomas Bennert* Research Engineer Submitted by Dr. Ali Maher* Professor and Chairman
Accelerated Loading Evaluation of Base & Sub-base Layers
 Accelerated Loading Evaluation of Base & Sub-base Layers Zhong Wu, Ph.D., P.E. Louisiana Transportation Research Center (LTRC) April 2006 What is Accelerated Loading? Accelerated loading refers to Accelerated
research report Characterization of Unbound Pavement Materials From New Mechanistic-Empirical Pavement Design Procedure
 Final Report VTRC 11-R6 Virginia Transportation Research Council research report Characterization of Unbound Pavement Materials From Virginia Sources for Use in the New Mechanistic-Empirical Pavement Design
Mechanistic Investigation of Granular Base and Subbase Materials A Saskatchewan Case Study
 Mechanistic Investigation of Granular Base and Subbase Materials A Saskatchewan Case Study Curtis Berthelot, P. Eng. Department of Civil and Geological Engineering University of Saskatchewan 57 Campus
ILLI-PAVE-Based Response Algorithms for Design of Conventional Flexible Pavements
 5 Transportation Research Record 143 ILLI-PAVE-Based Response Algorithms for Design of Conventional Flexible Pavements MARSHALL R. THOMPSON and ROBERT P. ELLIOTT ABSTRACT In a mechanistic design procedure
Characterizing Horizontal Response Pulse at the Bottom of Asphalt Layer Based on Viscoelastic Analysis
 Technical Paper ISSN 1996-6814 Int. J. Pavement Res. Technol. 6(4):379-385 Copyright @ Chinese Society of Pavement Engineering Characterizing Horizontal Response Pulse at the Bottom of Asphalt Layer Based
Guide for Mechanistic-Empirical Design
 Copy No. Guide for Mechanistic-Empirical Design OF NEW AND REHABILITATED PAVEMENT STRUCTURES FINAL DOCUMENT APPENDIX BB: DESIGN RELIABILITY NCHRP Prepared for National Cooperative Highway Research Program
Evaluating Structural Performance of Base/Subbase Materials at the Louisiana Accelerated Pavement Research Facility
 Evaluating Structural Performance of Base/Subbase Materials at the Louisiana Accelerated Pavement Research Facility Zhong Wu, Ph.D., P.E. Zhongjie Zhang, Bill King Louay Mohammad Outline Background Objectives
Workshop 4PBB First Steps for the perpetual pavement design: through the analysis of the fatigue life
 Workshop 4PBB First Steps for the perpetual pavement design: through the analysis of the fatigue life N. Hernández & D. Suarez Introduction In Mexico, asphalt pavements often exhibit premature failures
APPENDIX A PROGRAM FLOW CHARTS
 APPENDIX A PROGRAM FLOW CHARTS LIST OF FIGURES Figure Page A-1 Structure of the MEPDG software... A-1 A-2 Relationship of the reflection cracking design program of this project to the MEPDG design software...
Stress Rotations Due to Moving Wheel Loads and Their Effects on Pavement Materials Characterization
 Stress Rotations Due to Moving Wheel Loads and Their Effects on Pavement Materials Characterization Erol Tutumluer June 9, 2005 OMP Brown Bag Seminar Presentation FAA Center of Excellence for Airport Technology
Flexible Pavement Analysis
 Reliability in Mechanistic-Empirical Pavement Design Guide Flexible Pavement Analysis Presented By: Manuel Ayres Jr., Ph.D. At: TRB Workshop 152 Date: Jan 21, 2007 S1SP ARA0127-1 Summary 1. MEPDG Performance
ASPHALTIC CONCRETE EVALUATION FOR MECHANISTIC PAVEMENT DESIGN
 International Journal of Civil Engineering and Technology (IJCIET) Volume 9, Issue 8, August 2018, pp. 513 521, Article ID: IJCIET_09_08_049 Available online at http://www.iaeme.com/ijciet/issues.asp?jtype=ijciet&vtype=9&itype=8
Implementation of M-E PDG in Kansas
 Implementation of M-E PDG in Kansas Mustaque Hossain, Ph.D.,P.E. Kansas State University 1 Projects related to the M-E Guide Implementation and Calibration Kansas HMA Fatigue and Stiffness Study Pool Fund
Updating Bituminous Stabilized Materials Guidelines: Mix Design Report, Phase II
 APPENDIX C Technical Memorandum Updating Bituminous Stabilized Materials Guidelines: Mix Design Report, Phase II Task 3 Correlation of BSM Stiffness Part I AUTHORS: KJ Jenkins LJ Ebels 1. BACKGROUND AND
2007 Joseph K. Anochie-Boateng
 2007 Joseph K. Anochie-Boateng ADVANCED TESTING AND CHARACTERIZATION OF TRANSPORTATION SOILS AND BITUMINOUS SANDS BY JOSEPH K. ANOCHIE-BOATENG B.S., University of Science & Technology, 1994 M.S., North
Nevels, et al 1 KAY COUNTY SHALE SUBGRADE STABILIZATION REVISITED
 Nevels, et al 1 Title: KAY COUNTY SHALE SUBGRADE STABILIZATION REVISITED Submitted: 15 November 2012 (revised) Word Count: 3581 + 7 figures = 5331 Name: Affiliation: Email: Joakim G. Laguros, Ph.D., P.E.
APPENDIX B DISTRESSES
 144 APPENDIX B DISTRESSES 145 INTRODUCTION The purpose of this appendix is not to provide a detailed discussion of the various descriptions and causes of distresses that may occur in any given pavement
MECHANISTIC CHARACTERIZATION OF RESILIENT MODULI FOR UNBOUND PAVEMENT LAYER MATERIALS
 MECHANISTIC CHARACTERIZATION OF RESILIENT MODULI FOR UNBOUND PAVEMENT LAYER MATERIALS Except where reference is made to the work of others, the work described in this thesis is my own or was done in collaboration
Unbound Pavement Applications of Excess Foundry System Sands: Subbase/Base Material
 Unbound Pavement Applications of Excess Foundry System Sands: Subbase/Base Material Tuncer B. Edil University of Wisconsin-Madison Recycled Materials Resource Center RMRC Participant Job Description Which
Evaluating Structural Performance of Base/Subbase Materials at the Louisiana Accelerated Pavement Research Facility
 Evaluating Structural Performance of Base/Subbase Materials at the Louisiana Accelerated Pavement Research Facility Zhong Wu, Ph.D., P.E. Louisiana Transportation Research Center 2007 Transportation Engineering
Arizona Pavements and Materials Conference Phoenix, Arizona. November 15-16, John Siekmeier P.E. M.ASCE
 Arizona Pavements and Materials Conference Phoenix, Arizona November 15-16, 2017 John Siekmeier P.E. M.ASCE Minnesota DOT Districts and Local Agencies Other State DOTs, FHWA and NCHRP Contractors and Manufacturers
MECHANISTIC-EMPIRICAL PAVEMENT ANALYSIS AND DESIGN. University of Wisconsin Milwaukee Paper No. 13-2
 MECHANISTIC-EMPIRICAL PAVEMENT ANALYSIS AND DESIGN University of Wisconsin Milwaukee Paper No. 13-2 National Center for Freight & Infrastructure Research & Education College of Engineering Department of
2002 Pavement Design
 2002 Pavement Design Federal Highway Administration June 2001 Thomas P. Harman Asphalt Team Leader Predicting Pavement Performance Pavements are designed to fail But how do they perform? Defining Performance
Development and Validation of Mechanistic-Empirical Design Method for Permeable Interlocking Concrete Pavement
 Development and Validation of Mechanistic-Empirical Design Method for Permeable Interlocking Concrete Pavement Hui Li, David Jones, Rongzong Wu, and John Harvey University of California Pavement Research
Comparison of Rigid Pavement Thickness Design Systems
 Transportation Kentucky Transportation Center Research Report University of Kentucky Year 1988 Comparison of Rigid Pavement Thickness Design Systems Herbert F. Southgate University of Kentucky This paper
Analysis of Non-Linear Dynamic Behaviours in Asphalt Concrete Pavements Under Temperature Variations
 ENOC 2017, June 25 30, 2017, Budapest, Hungary Analysis of Non-Linear Dynamic Behaviours in Asphalt Concrete Pavements Under Temperature Variations Amal Abdelaziz *, Chun-Hsing Ho *, and Junyi Shan * *
HPMS Rule on Collecting Pavement Condition Data. Roger Smith Sui Tan
 HPMS Rule on Collecting Pavement Condition Data Roger Smith Sui Tan Final Rule Issued January Affects Local agencies that have non-state NHS roads/ street For which you report HPMS data to Caltrans 2 Final
Of course the importance of these three problematics is affected by the local environmental conditions.
 SHRP METHOD/SUPERPAVE SYSTEM The Strategic Highway Research Program (SHRP) of the U.S. National Research Centre deals with, amongst other things, road construction and between 1987 and 1993 new classification
Effect of Suction on the Resilient Modulus of Compacted Fine- Grained Subgrade Soils
 THE UNIVERSITY OF WISCONSIN-MADISON Effect of Suction on the Resilient Modulus of Compacted Fine- Grained Subgrade Soils by Auckpath Sawangsuriya, Ph.D. Tuncer B. Edil, Ph.D., P.E. Craig H. Benson, Ph.D.,
NEW DOWN-HOLE PENETROMETER (DHP-CIGMAT) FOR CONSTRUCTION APPLICATIONS
 FOR CONSTRUCTION APPLICATIONS") NEW DOWN-HOLE PENETROMETER (DHP-CIGMAT) FOR CONSTRUCTION APPLICATIONS 1 2 C. Vipulanandan 1, Ph.D., M. ASCE and Omer F. Usluogullari 2 Chairman, Professor, Director of Center for Innovative Grouting Materials
NEW DOWN-HOLE PENETROMETER (DHP-CIGMAT) FOR CONSTRUCTION APPLICATIONS 1 2 C. Vipulanandan 1, Ph.D., M. ASCE and Omer F. Usluogullari 2 Chairman, Professor, Director of Center for Innovative Grouting Materials
AASHTO Rigid Pavement Design
 AASHTO Rigid Pavement Design Dr. Antonis Michael Frederick University Notes Courtesy of Dr. Christos Drakos University of Florida 1. Introduction Empirical design based on the AASHO road test: Over 200
ACET 406 Mid-Term Exam B
 ACET 406 Mid-Term Exam B SUBJECT: ACET 406, INSTRUCTOR: Dr Antonis Michael, DATE: 24/11/09 INSTRUCTIONS You are required to answer all of the following questions within the specified time (90 minutes).you
Development of a Quick Reliability Method for Mechanistic-Empirical Asphalt Pavement Design
 Tanquist 1 Development of a Quick Reliability Method for Mechanistic-Empirical Asphalt Pavement Design Submission date: August 1, 2001 Word Count: 4654 Bruce A. Tanquist Research Project Engineer Minnesota
Analysis of pavement structural performance for future climate
 P2R2C2 Analysis of pavement structural performance for future climate Report No. 7 July 2010 Project Coordinator University of Nottingham, UK ZAG, Slovenia VTT, Finland SINTEF, Norway This project was
A Thesis Proposal. Agrawal, Ravi. Submitted to the Office of Graduate Studies of Texas A&M University
 Using Finite Element Structural Analysis of Retroreflective Raised Pavement Markers (RRPMs) to Recommend Testing Procedures for Simulating Field Performance of RRPMs A Thesis Proposal By Agrawal, Ravi
Sensitivity Analysis of 2002 Design Guide Rigid Pavement Distress Prediction Models
 Research Report UCD-ITS-RR-06-31 Sensitivity Analysis of 2002 Design Guide Rigid Pavement Distress Prediction Models June 2006 Venkata Kannekanti John Harvey Institute of Transportation Studies University
Geotechnical Properties of Soil
 Geotechnical Properties of Soil 1 Soil Texture Particle size, shape and size distribution Coarse-textured (Gravel, Sand) Fine-textured (Silt, Clay) Visibility by the naked eye (0.05 mm is the approximate
COARSE VERSUS FINE-GRADED SUPERPAVE MIXTURES: COMPARATIVE EVALUATION OF RESISTANCE TO RUTTING
 NCAT Report 02-02 COARSE VERSUS FINE-GRADED SUPERPAVE MIXTURES: COMPARATIVE EVALUATION OF RESISTANCE TO RUTTING By Prithvi S. Kandhal L. Allen Cooley, Jr. February 2002 277 Technology Parkway Auburn, AL
2015 North Dakota Asphalt Conference
 2015 North Dakota Asphalt Conference NDDOT Implementation of AASHTO Flexible Pavement Design Part I ADT & ESALs Nickie Reis, P&AM Part II Structural Numbers Tom Bold, M&R March 31 - April 1, 2015 Part
NOTTINGHAM DESIGN METHOD
 NOTTINGHAM DESIGN METHOD Dr Andrew Collop Reader in Civil Engineering University of Nottingham CONTENTS Introduction Traffic Design temperatures Material properties Allowable strains Asphalt thickness
Comparison of Axial and Diametral Resilient Stiffness of Asphalt-Aggregate Mixes
 TRANSPORTATION RESEARCH RECORD 1492 135 Comparison of Axial and Diametral Resilient Stiffness of Asphalt-Aggregate Mixes AKHTARHUSEIN A. TAYEBALI, JOHN A. DEACON, AND CARLL. MONISMITH The stiffness of
Estimation of Standard Deviation of Predicted Performance of Flexible Pavements Using AASHTO Model
 46 TRANSPORT~TION RESEARCH RECORD 1449 Estimation of Standard Deviation of Predicted Performance of Flexible Pavements Using AASHTO Model A. SAMY NOURELDIN, ESSAM SHARAF, ABDULRAHIM ARAFAH, AND FAISAL
Calibration of Mechanistic-Empirical Fatigue Models Using the PaveLab Heavy Vehicle Simulator
 1 1 1 1 1 1 1 0 1 0 1 0 1 Calibration of Mechanistic-Empirical Fatigue Models Using the PaveLab Heavy Vehicle Simulator Eliecer Arias-Barrantes 1, José Pablo Aguiar-Moya, Luis Guillermo Loría-Salazar,
Lecture 7 Constitutive Behavior of Asphalt Concrete
 Lecture 7 Constitutive Behavior of Asphalt Concrete What is a Constitutive Model? A constitutive model or constitutive equation is a relation between two physical quantities that is specific to a material
THEORETICAL DESIGN OF A NAILED OR BOLTED JOINT UNDER LATERAL LOAD 1. Summary
 THEORETICAL DESIGN OF A NAILED OR BOLTED JOINT UNDER LATERAL LOAD 1 BY EDWARD W. KUENZI, 2 Engineer Forest Products Laboratory,3 Forest Service U. S. Department of Agriculture Summary This report presents
TECHNICAL REPORT STANDARD PAGE
 TECHNICAL REPORT STANDARD PAGE 1. Report No. FHWA/LA.11/499 2. Government Accession No. 3. Recipient's Catalog No. 4. Title and Subtitle Characterization of Louisiana Asphalt Mixtures Using Simple Performance
IDAHO TRANSPORTATION DEPARTMENT
 RESEARCH REPORT RP 193 IDAHO TRANSPORTATION DEPARTMENT Implementation of the MEPDG for Flexible Pavements in Idaho By Fouad Bayomy Professor of Civil Engineering Sherif El-Badawy Research Fellow Ahmed
LRRB INV 828 Local Road Material Properties and Calibration for MnPAVE
 LRRB INV 828 Local Road Material Properties and Calibration for MnPAVE Task 4 Report Calibration Bruce Tanquist, Assistant Pavement Design Engineer Minnesota Department of Transportation May 23, 2008 Introduction
Prediction of the complex modulus of asphalt mixture containing RAP materials from the rheological properties of mortars
 1 1 1 1 1 1 1 1 0 1 0 1 0 1 Prediction of the complex modulus of asphalt mixture containing RAP materials from the rheological properties of mortars Chiara Riccardi 1, Augusto Cannone Falchetto *, and
Calibration of CalME models using WesTrack Performance Data
 Research Report Calibration of CalME models using WesTrack Performance Data November 2006 Per Ullidtz John Harvey Bor-Wen Tsai Carl Monismith Institute of Transportation Studies University of California,
DYNAMIC MODULUS MASTER CURVE AND CHARACTERIZATION OF SUPERPAVE HMA CONTAINING VARIOUS POLYMER TYPES
 DYNAMIC MODULUS MASTER CURVE AND CHARACTERIZATION OF SUPERPAVE HMA CONTAINING VARIOUS POLYMER TYPES Al-Hosain M. Ali 1, Mohamed S. Aazam 2, and Mohamed A. Alomran 3 1 Assistant Professor, Civil Engineering.
8.1. What is meant by the shear strength of soils? Solution 8.1 Shear strength of a soil is its internal resistance to shearing stresses.
 8.1. What is meant by the shear strength of soils? Solution 8.1 Shear strength of a soil is its internal resistance to shearing stresses. 8.2. Some soils show a peak shear strength. Why and what type(s)
COMPARISON BETWEEN LABORATORY AND FIELD MEASURED RESILIENT MODULUS FOR FLEXIBLE PAVEMENT
 International Journal of Civil Engineering and Technology (IJCIET) Volume 9, Issue 10, October 2018, pp. 558 568, Article ID: IJCIET_09_10_057 Available online at http://www.iaeme.com/ijciet/issues.asp?jtype=ijciet&vtype=9&itype=10
Superpave Implementation Phase II: Comparison of Performance-Related Test Results
 July 2014 UCPRC-RR-2015-01 Superpave Implementation Phase II: Comparison of Performance-Related Test Results Authors: J. Harvey, A. Liu, J. Zhou, J. M. Signore, E. Coleri, and Y. He Part of Partnered Pavement
NCHRP. Project No. NCHRP 9-44 A. Validating an Endurance Limit for Hot-Mix Asphalt (HMA) Pavements: Laboratory Experiment and Algorithm Development
 Pavements: Laboratory Experiment and Algorithm Development") NCHRP Project No. NCHRP 9-44 A Validating an Endurance Limit for Hot-Mix Asphalt (HMA) Pavements: Laboratory Experiment and Algorithm Development Appendix 1 Integrated Predictive Model for Healing and
NCHRP Project No. NCHRP 9-44 A Validating an Endurance Limit for Hot-Mix Asphalt (HMA) Pavements: Laboratory Experiment and Algorithm Development Appendix 1 Integrated Predictive Model for Healing and
Advanced Numerical Study of the Effects of Road Foundations on Pavement Performance
 Advanced Numerical Study of the Effects of Road Foundations on Pavement Performance X. Liu Section of Structural Mechanics, Faculty of Civil Engineering and Geosciences, Delft University of Technology,
MPC T. Kasperick and K. Ksaibati
 MPC 15-294 T. Kasperick and K. Ksaibati Calibration of the Mechanistic-Empirical Pavement Design Guide for Local Paved Roads in Wyoming A University Transportation Center sponsored by the U.S. Department
EVALUATION OF FATIGUE LIFE OF ASPHALT MIXTURES THROUGH THE DISSIPATED ENERGY APPROACH
 Vargas-Nordcbeck, Aguiar-Moya, Leiva-Villacorta and Loría-Salazar 0 0 0 EVALUATION OF FATIGUE LIFE OF ASPHALT MIXTURES THROUGH THE DISSIPATED ENERGY APPROACH Submitted to the th Annual Meeting of the Transportation
Study on How to Determine Repair Thickness of Damaged Layers for Porous Asphalt
 Study on How to Determine Repair Thickness of Damaged Layers for Porous Asphalt K. Kamiya & T. Kazato Nippon Expressway Research Institute Company Limited, Tokyo, Japan ABSTRACT: Porous asphalt has been
Role of Binders in Pavement Performance
 Role of Binders in Pavement Performance Presented by H. Bahia Research conducted by The University of Wisconsin-Asphalt Group The Pavement Performance Prediction Symposium Western Research Institute, Laramie,
Performance Characteristics of Asphalt Mixtures Incorporating Treated Ground Tire Rubber Added During the Mixing Process
 Innovative Research in Asphalt Pavements Performance Characteristics of Asphalt Mixtures Incorporating Treated Ground Tire Rubber Added During the Mixing Process Dr. Walaa S. Mogawer, PE, F.ASCE Director
FULL-DEPTH HMA PAVEMENT DESIGN
 FULL-DEPTH HMA PAVEMENT DESIGN Marshall R. Thompson Department of Civil Engineering University of Illinois @ U-C FULL-DEPTH HMA FULL QUALITY HMA IDOT & FULL-DEPTH HMA PAVEMENT (FD-HMA) BEFORE 1989 *AASHTO
2012 Road School Light Weight Deflectometer (LWD)
") 2012 Road School Light Weight Deflectometer (LWD) Nayyar Siddiki, M.S., P.E. Office of Geotechnical Services Outline Testing for Compaction NO 53 and chemically modified soils (Special Prov.) Changing
2012 Road School Light Weight Deflectometer (LWD) Nayyar Siddiki, M.S., P.E. Office of Geotechnical Services Outline Testing for Compaction NO 53 and chemically modified soils (Special Prov.) Changing