SELECTION OF SUBGRADE MODULUS FOR PAVEMENT OVERLAY DESIGN PROCEDURES
|
|
|
- Alexandrina Ball
- 6 years ago
- Views:
Transcription
1 SELECTION OF SUBGRADE MODULUS FOR PAVEMENT OVERLAY DESIGN PROCEDURES by Khaled Ksaibati, Michael L. Whelan, and James M. Burczyk Department of Civil and Architectural Engineering The University of Wyoming P.O. Box 3295 Laramie, Wyoming Michael J. Farrar Wyoming Department of Transportation P.O. Box 1708 Cheyenne, Wyoming August 1994
2 Acknowledgment This report has been prepared with funds provided by the United States Department of Transportation to the Mountain-Plains Consortium (MPC). The MPC member universities include North Dakota State University, Colorado State University, University of Wyoming, and Utah State University. The authors would like to express their appreciation to Mr. Benjamin Adkinson, Wyoming DOT Laboratory Technician for completing the laboratory tests and to Dr. Richard Anderson- Sprecher for technical assistance in the statistical analyses. Disclaimer The contents of this report reflect the views and ideas of the authors, who are responsible for the facts and the accuracy of the information presented herein. This document is disseminated under the sponsorship of the Department of Transportation, University Transportation Centers Program, in the interest of information exchange. The U.S. Government assumes no liability for the contents or use thereof. i
3 Preface This report describes a study jointly conducted by the University of Wyoming and the Wyoming Department of Transportation to better understand how selecting a M R value influences the thickness of an asphalt overlay pavement. The objectives of this study were to: 1) investigate the importance of several fundamental soil properties (water content, plasticity index, liquid limit, group index) on selecting a design subgrade resilient modulus value for cohesive soils; 2) define the actual relationship (correction factor) between back calculated and laboratory based M R values for typical cohesive subgrade soils in Wyoming; 3) compare actual subgrade field deviator stresses to the deviator stress assumed in determining a design M R value from laboratory testing; and 4) determine the effect of selecting a M R value on the design overlay thicknesses for typical pavement sections in Wyoming. The data analysis resulted in several important conclusions about factors that influence the determination of the subgrade resilient modulus value and how this value affects the final design overlay thickness for a given pavement section. Khaled Ksaibati, Michael L. Whelan, and James M. Burczyk The University of Wyoming Laramie, Wyoming Michael J. Farrar Wyoming Department of Transportation Cheyenne, Wyoming ii
4 iii
5 TABLE OF CONTENTS Page CHAPTER 1: INTRODUCTION...1 BACKGROUND...1 PROBLEM STATEMENT...2 OBJECTIVES...2 ORGANIZATION OF STUDY...3 CHAPTER 2: LITERATURE REVIEW...5 INTRODUCTION...5 TRADITIONAL SUBGRADE TESTING PROCEDURES...6 California Bearing Ratio (CBR)...6 Resistance Value (R-Value)...8 DEVELOPMENT OF THE RESILIENT MODULUS TEST...10 RESILIENT MODULUS LABORATORY TESTING...12 BACK CALCULATION OF RESILIENT MODULUS...13 Non-Destructive Testing Equipment...15 Back Calculation Computer Programs...17 M R DETERMINATION FROM CORRELATION STUDIES...20 SELECTION OF A DESIGN M R VALUE...22 UTILIZATION OF SOIL M R IN THE AASHTO OVERLAY DESIGN PROCEDURES...24 i
6 The 1993 AASHTO Overlay Design Procedure...24 Determining the Need for an Overlay...26 CHAPTER SUMMARY...29 CHAPTER 3: DESIGN OF EXPERIMENT...32 INTRODUCTION...32 SITE SELECTION...32 DATA COLLECTION...32 LABORATORY TESTING AND RESILIENT MODULUS DETERMINATION...35 Laboratory Testing for Resilient Modulus...36 Back Calculation of M R...39 DATA BASE PREPARATION AND DATA ANALYSIS...40 EVALUATING THE EFFECT OF M R SELECTION ON OVERLAY THICKNESSES...40 CHAPTER SUMMARY...41 CHAPTER 4: RESULTS FROM LABORATORY AND FIELD EVALUATIONS...43 INTRODUCTION...43 SITE CHARACTERISTICS...43 RESULTS FROM SOIL PROPERTY TESTS...44 LABORATORY RESILIENT MODULUS VALUES BASED ON 41.4-kPa (6-psi) DEVIATOR STRESS...47 BACK CALCULATED RESILIENT MODULUS VALUES...49 ii
7 RESULTS FROM R-VALUE TESTS...52 STATISTICAL ANALYSIS...52 Relationship Between Resilient Modulus and R-Value...56 The Effect of Sensor Locations on M R Measurements...58 The Effect of Sample Locations on M R Values...59 Relationship Between Back Calculated and Laboratory M R Values...59 Relationship Between M R Values and Soil Properties...60 CHAPTER SUMMARY...62 CHAPTER 5: EFFECT OF M R SELECTION ON OVERLAY THICKNESSES...65 INTRODUCTION...65 LABORATORY RESILIENT MODULUS VALUES BASED ON ACTUAL FIELD STRESSES...65 Comparison of Laboratory M R Values...67 OVERLAY THICKNESS RESULTS...69 STATISTICAL ANALYSIS...73 CHAPTER SUMMARY...78 CHAPTER 6: CONCLUSIONS AND RECOMMENDATIONS...79 SUMMARY...79 RECOMMENDATIONS FOR NEEDED FUTURE RESEARCH...80 REFERENCES...83 APPENDIX A: Specifications for Laboratory M R Testing...87 iii
8 APPENDIX B: M R Calculation Spreadsheet Example APPENDIX C: Summary Sheets for Actuator LVDT M R Values (Summer of 1992 & Spring of 1993) APPENDIX D: Overlay Spreadsheet Example iv
9 LIST OF TABLES Page TABLE 2.1 Testing Sequence for Type II Soils...13 TABLE 3.1 Location of Test Sections...34 TABLE 3.2 AASHTO Specification Summary...35 TABLE 3.3 Summary of Typical Material Properties in Wyoming...39 TABLE 4.1 Thicknesses of Test Sections...44 TABLE 4.2 Fundamental Soil Properties for Samples Collected in the Summer of TABLE 4.3 Fundamental Soil Properties for Samples Collected in the Spring of TABLE 4.4 M R Values for Samples Collected in the Summer of TABLE 4.5 M R Values for Samples Collected in the Spring of TABLE 4.6 Back Calculated Resilient Modulus Values (Summer of 1992)...53 TABLE 4.7 Back Calculated Resilient Modulus Values (Spring of 1993)...53 TABLE 4.8 R-Values for Samples Collected in the Summer of TABLE 4.9 R-Values for Samples Collected in the Spring of TABLE 4.10 Summary of Test Sites Included in Each Period...56 TABLE 4.11 Correlations Between LMR and R-Value...57 TABLE 4.12 Relations Between LMRR and LMRA...58 TABLE 4.13 Back Calculation Correlations (N = 13)...61 TABLE 4.14 Back Calculation Relationships (N = 13)...61 TABLE 4.15 Coefficients of Determination for Soil-M R Relations...63 v
10 TABLE 4.16 Parameter Estimates + Standard Error for Model with GI...63 TABLE 5.1 M R Values Based on 41.4-kPa (6-psi) and Actual Field Deviator Stresses for Summer of 1992 Data...67 TABLE 5.2 M R Values Based on 41.4-kPa (6-psi) and Actual Field Deviator Stresses for Spring of 1993 Data...68 TABLE 5.3 Testing Significance of Differences for Granular Base Sites (Summer of 1992 & Spring of 1993)...69 TABLE 5.4 Testing Significance of Differences for Treated Base Sites (Summer of 1992 & Spring of 1993)...69 TABLE 5.5 Summary of M R Values from 3 Methods (Summer of 1992)...71 TABLE 5.6 Summary of M R Values from 3 Methods (Spring of 1993)...72 TABLE 5.7 SN f Values for the Summer of 1992 Data...74 TABLE 5.8 SN f Values for the Spring of 1993 Data...74 TABLE 5.9 Summary of SN eff Values for the Summer of 1992 Data...75 TABLE 5.10 Summary of SN eff Values for the Spring of 1993 Data...75 TABLE 5.11 Summary of D ol Values for the Summer of 1992 Data...76 TABLE 5.12 Summary of D ol Values for the Spring of 1993 Data...76 vi
11 LIST OF FIGURES Page Figure 2.1 Schematic Diagram of Stabilometer...8 Figure 2.2 Strains Under Repeated Loads...11 Figure 2.3 LVDT Locations on Testing Equipment...14 Figure 2.4 Benkelman Beam...16 Figure 2.5 KUAB 2m-FWD...18 Figure 2.6 Sensors from KUAB 2m-FWD...18 Figure 2.7 Correlation Chart for Common Soil Tests...21 Figure 2.8 Structural Capacity Loss Over Time and with Traffic...26 Figure 3.1 Data Collection and Evaluation Strategies...32 Figure 3.2 Geographic Locations of Test Sections...33 Figure 3.3 Layout of FWD Sensors...34 Figure 3.4 Interlaken Resilient Modulus Testing Equipment...37 Figure 3.5 Resilient Modulus Testing Chamber...37 Figure 4.1 M R Summary Spreadsheet...48 Figure 5.1 Assumptions Made in Calculating Actual Field Stresses...66 vii
12 CHAPTER 1 INTRODUCTION by Khaled Ksaibati, Michael L. Whelan, James M. Burczyk, and Michael J. Farrar BACKGROUND Material characterization plays a vital role in the design, construction, and maintenance of roadways. Because the loads generated on these facilities are distributed through the pavement structure to the underlying soil layer (the subgrade), engineers need to determine how this soil will perform. Over the years, several testing procedures have been developed to analyze and predict the subgrade's response to highway loading. Some of these tests frequently used by state highway agencies include the Resistance Value (R-value), the California Bearing Ratio (CBR), and the Texas Triaxial Classification. The latest method for evaluating the subgrade's behavior is called Resilient Modulus (M R ). By definition, resilient modulus is a material property that measures the elastic (load-unload) response of a soil under repeated loading (Claros et al., 1990). Numerically, it is the ratio of the deviator stress to the resilient or recoverable strain (M R = σ d /ε r ). This subgrade property is used in the design of new pavement sections as well as in the rehabilitation of existing roadways. Without adequate information on the roadbed soil, a pavement structure will be improperly designed and as a result, it may fail prematurely. 1
13 PROBLEM STATEMENT The American Association of State Highway and Transportation Officials (AASHTO) Guide for Design of Pavement Structures (1993) requires selecting a value for the design subgrade resilient modulus. This value may be based on laboratory testing, back calculation programs using deflection measurements, resilient modulus correlation studies, or the equation presented in the AASHTO overlay design procedures based on deflection measurements. Each of these methods of determining M R present a variety of decisions and assumptions. First, laboratory tests may be completed on soil samples obtained from the field under undisturbed or disturbed conditions. After completing testing, one must choose a design M R value. This design value can be based on an assumed deviator stress of 41.4-kPa (6-psi), suggested in the literature, or based on actual field stresses. Second, M R can be determined from back calculation programs. This method uses an indirect approach and the resilient modulus values tend to be higher than the actual values. As a result, the back calculated M R value should be multiplied by a correction factor. This provides a conservative M R value that is consistent with the assumptions made in the AASHTO pavement design procedures. Third, correlation studies require a reliable relationship between the test used for material characterization and the resilient modulus value. OBJECTIVES Because the above procedures for determining the subgrade resilient modulus may give variable results, one would want to know how these variations may influence the resulting overlay thicknesses for a construction project. Therefore, the University of Wyoming and the Wyoming Department of 2
14 Transportation (DOT) conducted a joint research project to address this problem. The principal objectives of this study were to: 1. investigate the importance of several fundamental soil properties (water content, plasticity index, liquid limit, group index) on selecting a design subgrade resilient modulus value for cohesive soils, 2. define the actual relationship (correction factor) between back calculated and laboratory based M R values for typical cohesive subgrade soils in Wyoming, 3. compare actual subgrade field deviator stresses to the deviator stress assumed in determining a design M R value from laboratory testing, and 4. determine the effect of selecting a M R value on the design overlay thicknesses for typical pavement sections in Wyoming. ORGANIZATION OF STUDY This study examined the characteristics of cohesive subgrade soils at nine sites representing typical primary highways in the State of Wyoming. The roadbed soils included in the experiment had the following AASHTO classifications: A-4, A-6, and A-7-6. Samples for laboratory testing, deflection data, and pavement condition surveys were collected in the summer of 1992 and the spring of Next, an extensive laboratory testing program, several back calculation analyses, and overlay thickness designs were completed. Finally, the results were summarized in a computerized data base and a comprehensive statistical analysis was performed on the data. 3
15 Chapter 2 of this report reviews the traditional methods used to characterize subgrade soils, methods to determine resilient modulus for subgrade soils, and the AASHTO overlay design procedure. Chapter 3 describes the data collection process and overall evaluation strategies followed in this research. Chapter 4 discusses the laboratory testing, back calculation testing, and several important results on the factors that influence the selection of a design subgrade resilient modulus value. Chapter 5 discusses the impacts of selecting a particular method for determining a design resilient modulus value on the resulting overlay thickness. Chapter 6 summarizes the study, presents the conclusions, and makes recommendations for needed future research. 4
16 CHAPTER 2 LITERATURE REVIEW INTRODUCTION Pavement engineers continuously look for ways to improve pavement service life and performance. Historically, pavement design procedures were empirical. In many cases, relationships were based on factors such as traffic loading and volumes, materials, layer configurations and the environment (Mahoney et al., 1991). During the last decade, however, traditional pavement design procedures have been changed to incorporate elastic and/or viscoelastic theories as well as experience and various empirical tests. These new mechanistic-empirical procedures address two different aspects of pavement design. The mechanistic element allows engineers to examine the stresses, strains, and deflections in the pavement structure. The empirical element, on the other hand, tries to establish a relationship between these mechanistic responses and the performance of the pavement structure. Most newly developed pavement and overlay design procedures also require the characterization of materials. This requirement resulted in the development of several laboratory tests to simulate actual field conditions in the laboratory. One of these tests is the resilient modulus test for subgrade soils. It is believed that the adoption of this new testing procedure will result in more reliable and cost-effective designs of pavement structures. This chapter presents a background of the tests traditionally used for roadbed soil characterization and the latest test, resilient modulus. This discussion includes three different procedures for determining the resilient modulus value: laboratory testing, back 5
17 calculation, and correlation studies. Finally, the chapter describes how the methods used for material characterization fit into the latest AASHTO overlay design procedure. TRADITIONAL SUBGRADE TESTING PROCEDURES Over the years, several testing procedures have been developed by state highway agencies to characterize roadbed soils. Two of the most common tests include the California Bearing Ratio (CBR) and Resistance Value (R-value). Both of these tests estimate the "strength" of the subgrade for use in the pavement design procedures. California Bearing Ratio (CBR) The CBR test was first developed by the California Division of Highways around 1930 (Asphalt Institute, 1978). During World War II, the U.S. Army Corps of Engineers modified the original procedure in order to incorporate the test into their flexible pavement design method for airport runways. Later, this test was adopted by the American Society of Testing Materials (ASTM) in 1961 and by the American Association of State Highway and Transportation Officials (AASHTO) in Both organizations, however, adopted procedures with minor modifications to the test used by the Corps (Asphalt Institute, 1978). The CBR is a shear strength test based on penetration that can be completed on the soil in the field (ASTM D 4429) or on "undisturbed" or disturbed samples in the laboratory (ASTM D 1883, AASHTO T 193). In order to properly design a pavement structure based on the CBR value, the test is completed using samples at or near saturated soil conditions to represent the worst subgrade strength. 6
18 Therefore, the field testing procedure is primarily used for evaluating the properties on existing pavement sections while laboratory testing is completed on saturated soil samples. Laboratory testing for the CBR value, using disturbed samples, involves several steps. First, the subgrade soil is compacted in molds 152-mm (6-in.) in diameter and 152 to 178-mm (6 to 7-in.) in height. In order to simulate field conditions, samples should be prepared using the expected moisture content, density, and method of compaction. After preparing the samples, a dead weight is applied to the sample to simulate the loading of the overlying pavement structure (base and pavement layers). Next, the assembly (soil, mold, and dead weight) is submerged in water for 4 days. This step allows the sample to become saturated and, therefore, allows the test to be completed on the worst subgrade strength. After removing the sample and draining it for 15 minutes, loading is applied to the assembly with a piston having an area of 1,935-mm 2 (3-in. 2 ). This rod penetrates through the soil at a rate of 1.3-mm (0.05-in.) per minute and the load is recorded at the following penetrations: 2.5, 5.0, 7.5, 10.0, and 12.5-mm (0.1, 0.2, 0.3, 0.4, 0.5-in., respectively). A graph of load versus penetration is then constructed using the above results. The resulting plot is often not linear because of surface irregularities and consolidation during testing and must be corrected by re-zeroing the load-penetration curve. Finally, the following equation is used to determine the CBR value by substituting the corrected value of the unit load at 2.5-mm (0.1-in.) penetration: unitload at2.5 mm(0.1 in.) penetration CBR = ( 100) (2.1) 1000 The value in the denominator corresponds to the pressure required to reach the amount of penetration in 7
19 a standard crushed rock. For example, it takes 6.9-MPa (1000-psi) to obtain 2.5-mm (0.1-in.) penetration in crushed rock. Each level of penetration has a corresponding pressure. Typically, the CBR value decreases as penetration increases. As a result, the ratio at 2.5-mm (0.1-in.) of penetration is frequently used to determine the CBR value for pavement design (Wright & Paquette, 1987). The CBR values range from 0 to 100, characterizing a roadbed soil as bad to excellent, respectively. Resistance Value (R-Value) The R-value is also used to evaluate roadbed soil for highways. This test was originally developed at the California Division of Highways by F. N. Hveem and R. M. Carmany in It is a closed-system triaxial test that measures the internal friction or "resistance" of the soil in a stabilometer. Figure 2.1 presents a basic schematic diagram of the stabilometer test. This test is Figure 2.1 Schematic Diagram of Stabilometer SOURCE: Huang (1993) 8
20 usually completed on disturbed samples in the laboratory (ASTM D 2844, AASHTO T 190). First, a sample, 102-mm (4-in.) in diameter and 62 to 65-mm (2.45 to 2.55-in.) in height, is prepared using a mechanical kneading compactor which simulates field compaction techniques. Next, this sample is placed into the stabilometer between a testing head and a bottom plunger. A vertical pressure of 1.1- MPa (160-psi) is then applied to the testing head, creating a horizontal pressure on the fluid within the rubber membrane that surrounds the sample (refer to Figure 2.1). This horizontal pressure is measured and recorded as p h. Next, the applied vertical pressure is reduced to 0.55-MPa (80-psi) and the horizontal pressure reduced to 35-kPa (5-psi) with the stabilometer pump handle. After zeroing the displacement dial indicator on the stabilometer, the calibrated pump handle is turned to increase the horizontal pressure to 690-kPa (100-psi). The number of revolutions is recorded as D 2. The following formula is then used to determine the R-value: 100 R = 100 ( 2. 5/ D )( p / p 1) v h (2.2) where: R = Resistance Value (R-value) p v = applied vertical pressure of 1.1-MPa (160-psi) p h = transmitted horizontal pressure at p v of 1.1-MPa (160-psi) D 2 = displacement of stabilometer fluid necessary to increase horizontal pressure from 35 to 690-kPa (5 to 100-psi) measured in revolutions of a calibrated pump handle. Hveem (1949) explained that the applied vertical pressure of 1.1-MPa (160-psi) was chosen arbitrarily and this value is not a critical matter in the R-value test. He supports this statement from laboratory testing that showed no effect on the ratio of p v /p h where the applied vertical 9
21 pressure varied from 0.7 to 2.8-MPa (100 to 400-psi). Because of this observation, some states use a different vertical pressure in their R-value testing to ensure that the sample is saturated. California uses an exudation pressure of 1.7-MPa (240-psi) while Washington uses 2.1-MPa (300-psi) (Huang, 1993). The R-values also range from 0 to 100, but characterize a roadbed soil as a liquid (p h = p v ) to a rigid sample (p h = 0), respectively. DEVELOPMENT OF THE RESILIENT MODULUS TEST Overall, the traditional soil tests listed above do not fully simulate actual loading conditions in the field. Instead, they measure different soil properties related to the strength of the soil. As a result, the resilient modulus test was developed by Seed et al. (1963) to reflect several observations in the field and from research projects. One important idea came from the American Association of State Highway Officials (AASHO) Road Test which was conducted from October 15, 1958 to November 30, 1960 in Ottawa, Illinois. Researchers concluded that when a load is applied to the pavement surface the resulting deflection is a strong indicator of pavement performance (HRB, 1962). A majority of the surface deflection can be accounted for by the load-induced strain within the subgrade. Approximately 60 to 80 percent of the measured surface deflection was found to develop in the subgrade at the AASHO Road Test (HRB, 1962). Therefore, the resilient modulus test for subgrade soils models an important part of flexible pavement performance. Another important observation contributing to the development of the M R test is the stress in the pavement structure resulting from loading. The stress at a given point in the pavement structure is zero when the wheel load is at a considerable distance away. However, when this load is directly above the 10
22 point, the stress is at its maximum value. In many cases, it is reasonable to assume the stress pulse to be a haversine or triangular loading even though the duration of the pulse depends on the vehicle speed and the depth of the point below the pavement surface (Huang, 1993). Because the vehicle speed varies a great deal and the depth of the material may not be known during design, the AASHTO specifications recommend a haversine load wave with a duration of 0.1 second and a rest period of 0.9 second (AASHTO, 1992). As a result, the M R test accounts for the type and duration of loading expected in the field. A third important observation is the fact that most paving materials experience some permanent deformation after each load application (Huang, 1993). Figure 2.2 shows how the amount of strain under repeated loading in a material changes over time. In the beginning, the material shows a considerable increase in the amount of permanent deformation (accumulated plastic strain). However, as the number of loads increases, the accumulated plastic strain levels off and the material is essentially elastic (recoverable strain). This phenomenon usually occurs Figure 2.2 Strains Under Repeated Loads SOURCE: Huang (1993) 11
23 after 100 to 200 load applications. Because the applied load is smaller than the material's strength, the M R test can be completed on the same sample for several different loadings and environmental conditions (Huang, 1993). In 1986, the resilient modulus test became the basis for the AASHTO Guide for Design of Pavement Structures. According to AASHTO (1993), the M R value has three important advantages over the soil support value used in the previous editions: 1. It indicates a basic material property which can be used in mechanistic analysis of multilayered systems for predicting distresses such as roughness, cracking, rutting, and faulting. 2. It has been recognized internationally as a method for characterizing materials for use in pavement design and evaluation. 3. Techniques are available for estimating the M R properties of various materials in-place from non-destructive tests. With the above observations and advantages, it is clear that resilient modulus testing can directly measure the strength of the subgrade soil and provide information which reflect field conditions. RESILIENT MODULUS LABORATORY TESTING The Interim Method of Test for Resilient Modulus of Unbound Granular Base/Subbase Materials and Subgrade Soils - SHRP Protocol P46 (AASHTO: T I) outlines the latest testing procedure (refer to Appendix A). This specification separates subgrade material into two different categories: Type I (granular) and Type II (cohesive). Each type of soil has a different conditioning cycle and fifteen loading sequences, varying in confining and deviator stresses. Overall, Type I soils 12
24 undergo higher stresses, both confining and deviator, because of their higher resistance to deformation. The loading sequence for Type II soils is presented in Table 2.1. The amount of deformation in the soil sample is recorded using two linear variable differential transducers (LVDT s) outside of the testing chamber. However, the original AASHTO T-274 TABLE 2.1 Testing Sequence for Type II Soils (AASHTO, 1992) Sequence Confining Pressure Deviator Pressure Number of Load No. S 3, psi S d, psi Repetitions 0* * preconditioning specifications required 2 LVDT s on rings within the test chamber. These LVDT s are normally placed at a specified gage length depending on the size of the sample. Figure 2.3 shows both of these LVDT locations. BACK CALCULATION OF RESILIENT MODULUS 13
25 The laboratory resilient modulus test is relatively complex and it requires obtaining field samples. As a result, several agencies have looked into non-destructive back calculation 14
26 LVDT's on Loading Piston (Actuator) Soil Sample LVDT's on Rings Figure 2.3 LVDT Locations on Testing Equipment 15
27 procedures to estimate the strength of the soils in-place. The back calculation procedures involve collecting surface deflection data in the field on existing pavement sections through non-destructive testing and then plugging these values into a computer program to obtain the M R values. Surface deflection measurements provide pavement engineers with a rapid, relatively inexpensive, and nondestructive method of examining the basic response of the pavement structure to applied loads (Ali & Khosla, 1987). Because this analysis is normally performed on existing highway sections, the back calculation of resilient modulus values is primarily used in designing pavement overlays. Non-Destructive Testing Equipment Several different types of testing equipment were developed to examine the in-situ characteristics of a pavement structure. Non-destructive testing (NDT) equipment can be divided into four general categories: static deflection, steady-state deflection, impulse load deflection, and wave propagation. However, only the first three categories provide deflection measurements. Static deflection devices measure the pavement s response to loads applied with a slow moving vehicle or a stationary loading frame (Stoffels & Lytton, 1987). Three common NDT devices in this category include: Benkelman beam, California traveling deflectometer, and LaCroix deflectometer. Figure 2.4 shows a picture of the Benkelman beam which was widely used by highway agencies. The measurement probe on the beam is placed between the rear dual tires of a 80-kN (18-kip) single-axle load truck. As the truck slowly moves away from the support (reference) beam, the rebound deflection of the probe is measured at specific distances, creating a deflection basin. Overall, this measuring device is easy to use, but it is a slow process and has several other disadvantages. Because the support beam must be an immovable reference 16
28 Figure 2.4 Benkelman Beam SOURCE: Huang (1993) point, the use of this device is limited to flexible pavements. In addition, the loads used to measure the surface deflection do not represent actual field conditions, impulse loads. Therefore, empirical correlations must be developed in order to use the results in any mechanistic pavement design procedure (Huang, 1993). Steady state deflection systems, on the other hand, measure the pavement s response to loads applied by a vibratory device. Research has shown that the deflection at any specific driving frequency is approximately proportional to the amplitude of the load. However, at low frequencies, this factor approaches the value of the static pavement stiffness (Stoffels & Lytton, 1987). Therefore, the 17
29 vibratory device must apply a compressive force of varying magnitude, a dynamic force superimposed over a static force, in order to account for these effects. Two of the most common systems in this category include the Dynaflect and the Road Rater. Both devices use inertial motion sensors (geophones), placed at specific distances away from the point of loading, to record the surface deflection. This type of NDT device does not require a reference point like the static equipment. It is also a rapid method of analyzing a section s structural adequacy. Some of the disadvantages of this testing procedure include the inability to apply the actual loads in the form of steady-state vibration and the effect some large static loads may have on stress sensitive materials (Huang, 1993). The third system, impulse load deflection, applies a transient force impulse to the pavement surface and records its response. This impulse is created by selecting a weight and dropping it a certain height. This type of NDT equipment is commonly called a Falling Weight Deflectometer (FWD). Three commonly used FWDs include: Dynatest, KUAB, and Phoenix. Figures 2.5 and 2.6 show pictures of the Wyoming DOT KUAB deflectometer. These testing devices allow another method of rapidly analyzing a section s structural adequacy for use in a mechanistic pavement design procedure. Overall, most pavement engineers agree that the FWD provides an accurate method of modeling actual moving loads in both magnitude and duration (Huang, 1993). This device also uses a relatively small static load compared to the impulse loading. However, these devices have some disadvantages. In many cases, it is difficult to obtain reliable results from the inertial motion sensors in the low frequency range. It is also difficult to produce force impulses that have a short duration to reliably measure the deflections in the significant frequency range of the pavement section (Stoffels & Lytton, 1987). Back Calculation Computer Programs 18
30 There are several computer programs that can use deflection data to back calculate the strength of the different layers in a pavement structure. Some of the most widely used back calculation programs include: MODULUS, EVERCALC, and BOUSDEF. All of these programs compare the deflection basins from field data to theoretical basins to determine back calculated M R values. However, each program computes these moduli by using different methodologies and 19


31 Figure 2.5 KUAB 2m-FWD Figure 2.6 Sensors from KUAB 2m-FWD 20
32 assumptions. The first program, MODULUS, was developed at Texas A & M University. MODULUS determines M R values based upon a layered elastic code called WES5. This code creates a large database of theoretical deflection basins and matches, through interpolation, the best basin to the field data. The second program, EVERCALC, was developed at the University of Washington. In this program, theoretical deflections are based on CHEVRON, another layered elastic code. The third program, BOUSDEF, was developed at Oregon State University. This program uses the method of equivalent thicknesses, assuming one thick, uniform layer of material, and the Boussinesq theory to determine theoretical basins. Overall, by matching the deflection basin measured in the field, a M R value is calculated for the surface, base, and subgrade layer. Even though these computer programs provide pavement engineers with a quick method of obtaining M R values, the following problems associated with back calculation procedures must be taken into consideration (Uddin, 1984): 1. The nonuniqueness of the resilient modulus back calculated from the measured deflection basin. 2. Errors due to possible variation in thickness of pavement layers. 3. Errors involved in assuming a semi-infinite subgrade. 4. Time involved in the iterative process. 5. Errors in back calculated moduli because of the nonlinear behavior of granular layers and subgrade. 6. Errors involved in using input values out of the range for which the model was calibrated. In addition, three factors can influence the deflection measurements used in these computer programs: loading, climate and pavement condition. Loading should simulate the conditions used in the design process, typically, a 40-kN (9000-lbs.) wheel load. Climate factors such as temperature and moisture can also affect pavement deflections. These conditions should be recorded so that corrections can be 21
33 made to the deflection measurements before using them in a computer program. Finally, pavement conditions influence the deflection measurements. During testing, careful selection of test sections should be made in order to avoid testing over a distress such as cracking or rutting (Huang, 1993). M R DETERMINATION FROM CORRELATION STUDIES In many cases, agencies lack the large capital required for the laboratory M R equipment and/or their pavement engineers are unfamiliar with this new subgrade soil property. As a result, correlation charts and equations have been created to convert values from some of the commonly used soil tests to resilient modulus values. Figure 2.7 presents a correlation chart for most common soil tests. This chart was developed using data from the AASHO Road Test and several design curves from California, Washington, and Kentucky (Van Til et al., 1972). The soil support scale, on the far left, has values ranging from 1 to 10 and was developed using AASHO Road Test data. A 3.0 on the scale represents the silty clay roadbed soil while a 10.0 represents the crushed rock base material. In order to use this scale, highway agencies developed relationships between their commonly used material characterization test and the soil support scale. As a result, each state usually adopted a different test which caused variations in selecting subgrade strength. This problem contributed to the adoption of the M R value as the material property used to design pavement structures. Through several research projects on the AASHO roadbed soil, it was shown that the soil support value (S) of 3.0 had a M R value of 20,684-kPa (3000-psi). The rest of the correlations for converting soil support values to M R values were based on this relationship. 22
34 Figure 2.7 Correlation Chart for Common Soil Tests SOURCE: Van Til et al. (1972) 23
35 Besides these correlations, two well known equations have also been developed through research to convert values from the strength tests to resilient modulus values. Heukelom and Klomp (1972) developed the following equation to convert CBR values to M R values: M R = 1500 (CBR) (2.3) On the other hand, the Asphalt Institute (1982) developed the following equation to calculate resilient modulus from R-values: M R = (R-value) (2.4) Other equations have also been developed by state highway agencies. One example is Nebraska. Woolstrum (1990) reported a method to reliably determine the resilient modulus value based on the Nebraska Group Index (NGI). This index is similar to the group index developed by AASHTO because it uses the percent retained on the No. 200 sieve, the liquid limit, and the plasticity index. However, the NGI allows negative values for granular materials. Through a regression analysis, fourthorder equations were developed under three moisture conditions: optimum, wet, and dry. These equations correlated well with M R values obtained in the laboratory. Even though the use of the correlation charts and equations to obtain resilient modulus values is acceptable, AASHTO (1993) recommends that "user agencies acquire the necessary equipment to measure M R." SELECTION OF A DESIGN M R VALUE Because of the importance of material characterization, several factors must be taken into consideration when selecting a M R value for pavement design. According to Darter et al. (1992), 24
36 regardless of the method used, the design subgrade M R value must be consistent with the value used in the design performance equation for the AASHO Road Test subgrade. The 1993 AASHTO guide uses a value of 20,684-kPa (3000-psi), but does not justify its selection. This value is one of the underlying assumptions of the flexible pavement performance model. Based on a study by Thompson and Robnett (1976), this value is appropriate when the AASHO soil is about 1% wet of optimum and subjected to a deviator stress of about 41.4-kPa (6-psi) or more. In addition, these results were based on laboratory tests using zero confining pressure, and they reported little effect when testing the samples using a confining pressure of 20.7 to 34.5-kPa (3 to 5-psi). Therefore, when selecting a M R value from laboratory testing, a zero confining pressure and a 41.4-kPa (6-psi) deviator stress is suggested (Elliott, 1992). Besides the above considerations, other factors such as water content, soil type, and sample condition must be accounted for when selecting an M R value from the laboratory testing. First, water content is important because of its effects on M R values obtained either above or below the optimum value. In 1989, Elfino and Davidson reported variations in the resilient modulus value of 7-41% from soils at different water contents. Second, whether the sample is undisturbed or disturbed will influence the M R. Third, soil type may influence the M R because of the differences in quality and soil strength. Overall, by considering these variations, an appropriate M R value will be selected to represent the design field conditions. The above observations also play an important part when determining a back calculated M R value. In order to make a non-destructive testing value consistent with the 20,684-kPa (3000-psi) value, the calculated M R value is multiplied by a correction factor. The need for a correction factor 25
37 resulted from the fact that most NDT programs assume the measure deflection, at a certain distance away from the loading plate is attributable solely to the subgrade. In many cases, the amount of stress at this point is less than 41.4-kPa (6-psi), giving a higher resilient modulus value. Therefore, by reducing the back calculated resilient modulus value, one of the underlying assumptions in the flexible pavement performance model is satisfied. UTILIZATION OF SOIL M R IN THE AASHTO OVERLAY DESIGN PROCEDURES Over the years, several highway agencies developed their own overlay design procedures. In addition, AASHTO recently released the 1993 AASHTO Guide for Design of Pavement Structures. In the AASHTO guide, the determination of the subgrade resilient modulus value is essential for designing both new pavements and overlay thicknesses. If the design resilient modulus value is too high, the thickness of the pavement layer will be insufficient. If the design resilient modulus value is too low, the thickness will be conservative and not cost-effective. The implications of selecting resilient modulus values in designing new pavements will not be discussed here since the objective of this research project is to evaluate the new AASHTO overlay design procedure for asphalt pavements. The 1993 AASHTO Overlay Design Procedure The 1993 AASHTO Guide for Design of Pavement Structures outlines an eight step procedure for determining the overlay thickness. These steps include evaluating the existing pavement design and construction, traffic analysis, condition surveys, deflection testing, coring and materials testing, determination of required structural number for future traffic (SN f ), determination of effective structural 26
38 number (SN eff ) of the existing pavement, and determination of the overlay thickness (D ol ). Each of these steps provides valuable information to determine an appropriate overlay design. In the first step, evaluating the existing pavement design and construction, thicknesses of each layer and material types and characterization should be determined. Next, in the traffic analysis, the past cumulative 80-kN (18-kip) equivalent single-axle loads (ESALs) (N p ) and the future 80-kN (18-kip) ESALs (N f ) should be estimated. This traffic information is important in determining the SN f value and overlay thickness. Third, pavement condition surveys provide information needed to determine the structural coefficients for each pavement layer. Fourth, deflection testing provides the basic information needed in the AASHTO overlay design procedures. Some type of NDT device, usually a FWD, provides this type of data. The AASHTO guide recommends using the following formula for determining the resilient modulus value of the subgrade soil based on the deflection measurements: M R P = (2.5) d r r where: M R = subgrade resilient modulus, psi P = applied load, pounds d r = deflection at a distance r from the center of the load, inches r = distance from center of load (sensor location), inches Fifth, coring and materials testing provides additional information to confirm the values obtained from reviewing construction records. Laboratory testing of the subgrade soil is recommended if deflection testing is not completed on a pavement section. In addition, the thicknesses of all the layers in the pavement structure can be confirmed by coring. Sixth, the SN f value is determined by using several pieces of information. These items include: the effective design subgrade resilient modulus, design 27
39 present serviceability index (PSI) loss, overlay design reliability (R), and the overall standard deviation (S o ) for flexible pavement. Seventh, the SN eff value is determined using one or more of the following three methods: non-destructive testing (NDT), pavement condition surveys (PCS), and remaining life (RL). Finally, the overlay thickness (D ol ) is determined by taking the difference between the SN f and SN eff values and dividing this quantity by the layer coefficient for new asphalt pavement (D ol = (SN f - Sn eff )/a ol ). Determining the Need for an Overlay Structural deterioration is any condition that reduces the load-carrying capacity of the pavement (Darter et al., 1992). As time and the number of loads applied (traffic) to a pavement section increase, the structural capacity (SC) of the section decreases from its initial state, SC o, as shown in Figure 2.8. When an evaluation for an overlay is conducted, the section s structural 28
40 Figure 2.8 Structural Capacity Loss Over Time and with Traffic SOURCE: Darter et al. (1992) capacity is evaluated and denoted by SC eff. In order to repair the section and return it to its original or higher capacity, SC f, an overlay is placed with a value of SC ol (Note: SC f = SC eff + SC ol ). This method of evaluation is known as the structural deficiency approach. In order to obtain the correct thickness of the overlay, the evaluation of the effective structural capacity must be accurate by examining the existing pavement conditions and determining how the pavement materials will behave in the future. However, this is very difficult since the declining relationship is not well defined. It is often assumed by many agencies that a section s structural capacity is linear in order to simplify calculations and provide a conservative measurement. As a result, the 29
41 AASHTO guide uses three different methods to determine a section s asphalt overlay thickness: nondestructive testing (NDT), pavement condition surveys (PCS), and remaining life (RL). The first method, NDT, involves determining the effective structural capacity, expressed as the effective structural number (SN eff ) for flexible pavements, based on non-destructive deflection measurements. This data is often obtained using a Falling Weight Deflectometer (FWD). The SN eff is determined with the following formula as a function of the total thickness and overall stiffness of a section: SN = D 3 E (2.6) eff p where: SN eff = effective structural number D = total thickness of all pavement layers above the subgrade, inches E p = effective modulus of pavement layers above the subgrade, psi The E p value is based on a back calculation procedure for resilient modulus described in the AASHTO guide. The second method involves using pavement condition surveys. This type of visual survey determines the SN eff value based on the distress conditions observed in the field, drainage surveys, and maintenance history. For flexible pavements, the following distress types should be examined: alligator cracking, rutting, transverse and longitudinal cracks, and localized failing areas. Each distress type is converted to a layer coefficient based on the percentage of the surface condition. The following formula is then used to determine the SN eff value: SN a D a D m a D m eff = (2.7) 30
42 where: SN eff = effective structural number a 1, a 2, a 3 = corresponding structural layer coefficients D 1, D 2, D 3 = thicknesses of existing pavement surface, base, and subbase layers m 2, m 3 = drainage coefficients for granular base and subbase Remaining life is the third procedure to determine the effective structural capacity. This method determines the SN eff value based on fatigue damage from traffic. As the name implies, the amount of load-carrying capacity remaining in the pavement section is determined. This procedure requires the knowledge of past traffic (N p ) and estimates the total traffic the pavement could be expected to carry to failure (N 1.5 ). This failure is often assumed to be 1.5 on the Present Serviceability Index (PSI). In general, a new pavement has a PSI between 4 and 5, and repair is usually needed when the PSI is between 1.5 and 2.5. The following formula determines the remaining life: N RL= N p 1.5 (2.8) where: RL = remaining life, percent N p = total traffic to date, 18-kip ESAL N 1.5 = total traffic to pavement failure, 18-kip ESAL The RL value is then converted to a condition factor (CF) ranging from 0.5 to 1.0 using a graph of CF versus RL. The SN eff value is then computed with the following formula: SN eff = CF* SN (2.9) o 31
43 where: SN eff = effective structural number CF = condition factor SN o = structural number of the pavement if it were newly constructed Darter et al. (1992) cites the following four major sources of error in this procedure: the predictive capability of the AASHO Road Test equations, the large variations in performance typically observed even among pavements of seemingly identical designs, estimation of the past 18-kip ESALs, and the inability to account for the amount of preoverlay repair to the pavement. Overall, this evaluation procedure should only be used for pavement sections which have very little visible deterioration and no previous overlays. CHAPTER SUMMARY Material characterization is important in designing pavement sections. The traditional methods for examining the characteristics of the subgrade, CBR and R-value, do not provide information that directly represent field conditions. However, the resilient modulus test measures a subgrade s ability to recover after loading. Therefore, this value is expected to improve the modeling of actual field conditions and to provide a better basis for pavement designs. A soil s M R value may be measured by using the following three techniques: laboratory testing, back calculation, and correlation charts/equations. Once a M R value is determined for a section, this value can be used to calculate an overlay design thickness. 32
44 CHAPTER 3 DESIGN OF EXPERIMENT INTRODUCTION In this research project, extensive data were collected in the field and laboratory to fulfill the objectives of the study presented in Chapter 1. Figure 3.1 shows the seven basic steps performed in this research. These steps were: site selection, data collection, resilient modulus determinations, data base preparation, data analysis, effect of M R on overlay thicknesses, and conclusions. In this chapter, each one of the above evaluation strategies will be discussed. SITE SELECTION Nine pavement test sections were selected in the State of Wyoming. These sections represent typical cohesive subgrade soil conditions throughout the state (refer to Figure 3.2). Overall, a typical cross-section of the pavement structure included an asphalt concrete layer, a granular or treated base (asphalt or cement), and the underlying subgrade soil. Because of the relatively low traffic volumes in Wyoming, pavement structures do not normally have a subbase layer. DATA COLLECTION In the summer of 1992 and spring of 1993, extensive field data were collected on all test sections included in the experiment. This field evaluation included pavement and subgrade coring, 33
45 deflection measurements, and condition surveys. At each site, three pavement cores and three Shelby tubes of subgrade soil were obtained. Table 3.1 summarizes the locations of the nine test sections. The Wyoming DOT s KUAB 2m-Falling Weight Deflectometer was used to take TABLE 3.1 Location of Test Sections Number Test Site on State Map Route Roadway Milepost 1 P-12 US P-12 US P-23 US P-30 US P-34 US-20/ P-34 US P-44 US P-44 US F-25 US deflection measurements at each site using three different levels of loading: 26.7, 40.0, 53.4-kN (6000, 9000, and lbs.). Figure 3.3 shows the locations of the sensors used to take the deflection measurements in this research. Other important data, such as pavement and air temperatures, were recorded for later use in correcting the temperature to the standard value of Figure 3.3 Layout of FWD Sensors 34
46 21 o Celsius (70 o Fahrenheit). Pavement condition surveys were completed on each test section to examine pavement surface conditions. LABORATORY TESTING AND RESILIENT MODULUS DETERMINATION After obtaining the soil samples from the field, several laboratory tests were initially conducted to determine the soil classification of the subgrade at each test section. These preliminary tests included: sieve analysis, Atterburg Limits, water content determinations, and R-values. The AASHTO Soil Classification system was later used to determine the soil type at each test section. The equation below, occasionally used by the Wyoming DOT, was used in estimating the optimum water content for each sample: where: ω = optimum water content (%), LL = liquid limit ω = 0.477(LL) + 2 (3.1) All laboratory tests were conducted in accordance with their respective AASHTO specification. Table 3.2 summarizes these testing specifications. TABLE 3.2 AASHTO Specification Summary Property Specification Standard R-value AASHTO T 190 Liquid Limit (LL) AASHTO T 89 (WYO MOD) Plastic Limit (PL) AASHTO T 90 (WYO MOD) Sieve Analysis AASHTO T 88 35
47 Resilient modulus values were then determined for each test section from: laboratory testing based on 41.4-kPa (6-psi) deviator stress, laboratory testing based on actual field stress conditions, and from deflection measurements. Laboratory Testing for Resilient Modulus Laboratory soil resilient modulus tests were performed on the Wyoming DOT machine manufactured by the Interlaken Technology Corporation. The system has a Series kN (22- kip) capacity test frame, a Series 3230, 16 channel data acquisition system, and a Series 3200 controller. This device is located in the Materials Branch at the Wyoming Department of Transportation. Figures 3.4 and 3.5 show the resilient modulus testing device. All samples tested were 71-mm (2.8-in.) in diameter and 152-mm (6-in.) in height. These measurements were selected in accordance with the specifications, a height not less than two times the diameter and a minimum diameter of 71-mm (2.8-in.) or five times the nominal particle size (AASHTO, 1992). In this research project, deformation readings were recorded at two different locations during laboratory testing. First, from 2 LVDT s located outside of the triaxial cell on the loading piston (referred to as the actuator in this report) and second, from three LVDT's located on the rings inside of the testing chamber. Even though some testing programs available for M R testing automatically average the signals from the LVDT's, individual measurements were saved in a computer file in this research project. This procedure was used to identify and eliminate inconsistent deformation measurements coming from the LVDT's. All applied load and deformation readings were also stored in a computer file for later analysis. 36


48 Figure 3.4 Interlaken Resilient Modulus Testing Equipment 37
49 Figure 3.5 Resilient Modulus Testing Chamber 38
50 Subgrade cores obtained from the summer of 1992 were tested in two conditions, undisturbed and disturbed. Due to the fact that the soils were left in the Shelby tubes for several months prior to testing, normal extraction could not be performed without disturbing the samples. The solution to this problem was to freeze the tubes, extract the soil samples, and let the cores thaw for twenty-four hours prior to testing. Overall, this procedure was successful and allowed soil samples to be removed from the tubes with minimal disturbance. Resilient modulus testing was performed on some of the frozen samples, but reasonable M R values were difficult to obtain because of the low stresses applied to the samples and the high stiffness of the frozen cores. As a result, the frozen condition was not considered in the analysis. After testing was completed for the undisturbed samples, the disturbed (remolded) samples were prepared by crumbling the sample and re-compacting it to 152-mm (6-in.) using five lifts and static compaction. This procedure is fully described in the specifications (refer to Appendix A). Subgrade cores from the spring of 1993 were tested for resilient modulus shortly after obtaining them from the field. Again, two conditions were considered, undisturbed and disturbed (remolded). Unlike the first set of subgrade cores, samples were easily removed from the Shelby tubes and, therefore, they did not require freezing prior to extraction. LVDT measurements during M R testing were also taken outside and inside the testing chamber. After the laboratory M R testing was completed, deformation and applied load readings from the last five cycles of loading condition were retrieved from the data files created during the tests. Several spreadsheets were developed to accept these data as well as the length and diameter of each sample. By entering this information, the resilient modulus values for all nine test sections were calculated automatically for each testing condition. Plots were then constructed by using the log 10 (resilient 39
51 modulus) versus the deviator stress. Simple regression analysis was then performed to estimate resilient modulus based on deviator stresses. As suggested in the literature, a design M R value was determined by substituting a deviator stress of 41.4-kPa (6-psi) into this resulting equation. Besides using this suggested deviator stress, the actual stresses in the subgrade were computed by using the computer program BISAR. This computer program, developed by De Jong et al. (1973), computes the stresses in a n-layer pavement structure by considering the vertical and horizontal loads. Information obtained in the field evaluation, specifically the thicknesses of each pavement layer, and certain material properties were entered into this program. Table 3.3 summarizes the values for the material properties commonly used by the Wyoming DOT. These computed deviator stresses were then substituted into the linear equations developed in the laboratory testing to determine another design resilient modulus value based on actual field stress conditions. TABLE 3.3 Summary of Typical Material Properties in Wyoming Layer in Pavement Structure Young's Modulus (MPa) Unit Weight (kn/m 3 ) Poisson's Ratio Asphalt Cement Mix Granular Base Cement Treated Base Asphalt Treated Base Back Calculation of M R In addition to the laboratory analysis, the deflection data collected were used to determine subgrade M R values with the following three back calculation programs: MODULUS, EVERCALC, and BOUSDEF. All of these programs compare the deflection basins based on field data to theoretical 40
52 basins in order to determine the back calculated resilient modulus values. Deflection measurements used in these three computer programs were corrected to a standard temperature of 21 o Celsius (70 o Fahrenheit) with a computer program called TAFFY. This program was developed by the Colorado Department of Transportation (1988) to determine temperature adjustment factors. The average air temperature, the surface temperature, and the mean pavement temperature all affect this adjustment factor. DATA BASE PREPARATION AND DATA ANALYSIS All field and laboratory data were summarized in a computerized data base. Statistical analyses were then performed to determine how fundamental soil properties, linear variable differential transducer (LVDT) placement during M R testing, and sample condition influence resilient modulus values. Further analyses were completed to examine the relationship between laboratory and back calculated M R values. These results and analyses will be presented in Chapter 4. EVALUATING THE EFFECT OF M R SELECTION ON OVERLAY THICKNESSES Three different sets of M R values were used to complete this analysis. In addition to the values calculated using a 41.4-kPa (6-psi) deviator stress and the actual field deviator stress, the AASHTO equation based on deflection measurements was used to determine the third set of M R values. Overlay thicknesses were then determined by using the 1993 AASHTO NDT overlay design procedure for asphalt overlay on asphalt pavements. Finally, several analyses were performed to determine the effects of selected M R values on the resulting overlay thicknesses. These results and analyses will be presented 41
53 and discussed further in Chapter 5. CHAPTER SUMMARY This chapter presented the data collection and overall evaluation strategies followed in this research project. Site selection, data collection, resilient modulus calculations, data base preparation, data analysis, effect of M R on overlay thickness, and conclusions were the seven steps. Overall, each step provided a way to thoroughly satisfy the objectives of this research project. 42
54 CHAPTER 4 RESULTS FROM LABORATORY AND FIELD EVALUATIONS INTRODUCTION As described earlier, laboratory and back calculation tests were performed on subgrade soils gathered from primary roads in the State of Wyoming. Laboratory testing consisted of determining the soil's resilient modulus, R-value, water content, optimum water content, plasticity index, soil classification, and group index. Back calculation tests consisted of substituting values obtained from the field deflection tests into three computer programs to obtain a second set of resilient modulus values. This chapter presents the results from the above tests and provides a comprehensive discussion and analysis of the data gathered. SITE CHARACTERISTICS The pavement structure for each of the nine sites included in this research consisted of an asphalt concrete (AC) layer, a granular or treated base, and the underlying subgrade soil. Four of the nine sites had a treated base, three with an asphalt treated base (ATB) and one with a cement treated base (CTB). Table 4.1 summarizes the thicknesses of the AC and base layers for all test sections. All of these thicknesses were determined from the pavement cores at each test section. In addition, approximately 610 to 762-mm (24 to 30-in.) of the underlying subgrade soil was removed in each Shelby tube for laboratory testing. 43
55 44
56 TABLE 4.1 Thicknesses of Test Sections Pavement Thicknesses Route Mile Post Surface Base (mm) (mm) P P P P P P * P * P * F ** * Asphalt Treated Base (ATB) ** Cement Treated Base (CTB) RESULTS FROM SOIL PROPERTY TESTS Several fundamental soil property tests were conducted after performing the resilient modulus test on the soil samples. These tests included: sieve analysis, liquid and plastic limits (LL and PL, respectively), and water content determination. Tables 4.2 and 4.3 summarize the values for these soil property tests from the summer of 1992 and spring of 1993, respectively. A high percentage of the sites had water contents below the optimum water content. All of the soils were classified as A-4, A-6, or A-7-6 based on the AASHTO soil classification system. However, one sample from the summer of 1992 and two samples from the spring of 1993 had different soil classifications, A-1-B, A-2-4, and A- 2-6, respectively. In addition, several of the sites had large group index (GI) values, indicating poor quality soils. Finally, the plasticity index (PI) values were moderate to high as shown in the tables. 45
57 46
58 TABLE 4.2 Fundamental Soil Properties for Samples Collected in the Summer of 1992 Actual Optimum AASHTO Mile Tube Layer Water Water Soil Route Post # # Content Content LL PL PI Class. (%) (%) P A-6(3) P A-6(2) P A-6(2) P A-4(1) P NP NP A-4(0) P NP NP A-4(0) P A-4(0) P A-4(0) P A-4(0) P A-6(9) P A-6(4) P A-6(11) P A-6(11) P A-6(6) P A-6(8) P A-6(10) P A-6(7) P A-7-6(29) P A-6(16) P A-1-B(0) P A-7-6(23) P A-7-6(25) P A-7-6(32) P A-6(4) P A-6(5) P A-4(3) P A-4(3) P A-6(11) P A-6(7) P A-6(14) P A-6(10) P A-6(9) P A-6(14) 47
59 TABLE 4.3 Fundamental Soil Properties for Samples Collected in the Spring of 1993 Actual Optimum AASHTO Mile Tube Layer Water Water Soil Route Post # # Content Content LL PL PI Class. (%) (%) P A-4(1) P A-6(13) P A-6(1) P A-4(0) P A-4(0) P A-4(0) P A-4(0) P A-4(0) P A-2-4(0) P A-6(9) P A-4(3) P A-6(6) P A-6(13) P A-7-6(26) P A-7-6(30) P A-7-6(29) P A-7-6(16) P A-7-6(23) P A-7-6(15) P A-2-6(2) P A-6(7) P A-6(7) P A-7-6(21) P A-6(3) P A-7-6(26) P A-7-6(23) P A-7-6(27) P A-6(16) P A-7-6(20) P A-7-6(17) P A-7-6(17) P A-6(16) P A-7-6(16) F A-7-6(21) F A-4(5) F A-7-6(25) F A-4(4) 48
60 49
61 LABORATORY RESILIENT MODULUS VALUES BASED ON 41.4-kPa (6-psi) DEVIATOR STRESS Samples for laboratory M R testing were primarily selected from the middle portion of each Shelby tube because of the visible disturbance on both ends. This selection process provided samples that were rigid and undisturbed. After extracting each sample from the tube, diameter and height measurements were taken and recorded on laboratory data sheets. Next, a rubber membrane was placed over the soil sample and two porous stones which were on both ends of the sample. After aligning the sample in the testing device, the resilient modulus tests were conducted by following the AASHTO specifications. During each of the fifteen loading conditions, the last five cycles were saved on disk for future retrieval to determine the resilient modulus value. After completing the first set of tests on undisturbed samples, another set of tests were conducted on disturbed samples using a zero confining pressure and deviator stresses ranging from 13.8 to 69.0-kPa (2 to 10-psi) in 13.8-kPa (2- psi) increments. The disturbed samples were prepared by destroying the original undisturbed samples and re-compacting them in five, equal lifts under a static load. For each of the testing conditions described earlier, the peak deformation and applied load readings were retrieved from the files created during testing. By entering these values into a special spreadsheet, resilient modulus values were calculated from each of the different confining and deviator stress conditions. Figure 4.1 shows an example of the M R summary spreadsheet used in this research (Note: values in metric units). The upper half of the spreadsheet shows the measured values under different testing conditions. These values include: mean deviator load, mean applied deviator stress, mean recoverable deformation from each LVDT, mean resilient strain, and mean M R value. A logarithmic plot of resilient modulus versus deviator stress was 50
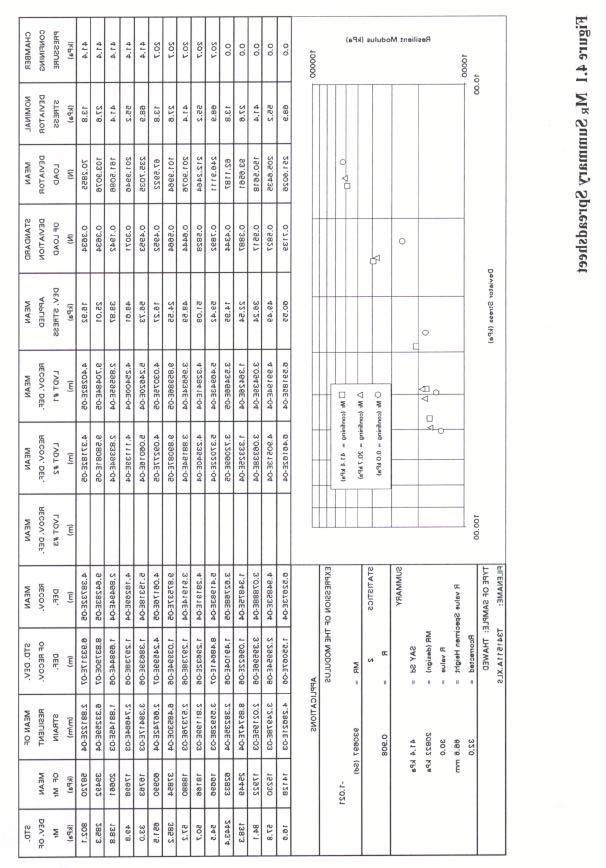
62 51
63 created using these values as shown in the lower left hand corner. In addition, a simple linear regression analysis was performed to develop a general equation for determining the resilient modulus value as a function of the deviator stress (M R = f(σ d )). After obtaining the equation, a deviator stress of 41.4-kPa (6-psi), suggested in the literature, was substituted into the equation to determine a design resilient modulus value. The lower right hand portion of the spreadsheet summarizes other important laboratory information, such as the R-value specimen height, the linear regression equation for M R, the coefficient of determination (R 2 ), and the condition of the sample. Similar spreadsheets were created for each test site and sample condition (undisturbed ring, undisturbed actuator, disturbed ring, and disturbed actuator). An example of the M R calculation sheet used to create the summary sheet is presented in Appendix B. Tables 4.4 and 4.5 summarize all the laboratory subgrade soil resilient modulus values. Some of the tests were not completed, shown by a blank space, because testing could not be performed on an undisturbed sample or the values obtained from the test were significantly beyond the range of realistic subgrade M R values. BACK CALCULATED RESILIENT MODULUS VALUES Information obtained from pavement coring and deflection testing were used in this part of the research. First, the deflection measurements were corrected to a standard temperature of 21 o Celsius (70 o Fahrenheit) using a computer program called TAFFY (1988). This computer program produces temperature adjustment factors for the deflection readings based on an algorithm recommended by the Asphalt Institute. This program requires the following information: thicknesses of asphalt cement and untreated base layers, surface temperature, and previous 5-day air temperature history. Since the 52
64 previous 5-day air temperature history was not 53
65 TABLE 4.4 M R values for Samples Collected in the Summer of 1992 Undisturbed Undisturbed Disturbed Disturbed M R M R M R M R Mile Tube Layer Ring Actuator Ring Actuator Route Post # # LVDT s LVDT s LVDT s LVDT s (kpa) (kpa) (kpa) (kpa) P P P P P P P P P P P P P P P P P P P P P P P P P P P P P P P P P
66 TABLE 4.5 M R values for Samples Collected in the Spring of 1993 Undisturbed Undisturbed Disturbed Disturbed M R M R M R M R Mile Tube Layer Ring Actuator Ring Actuator Route Post # # LVDT s LVDT s LVDT s LVDT s (kpa) (kpa) (kpa) (kpa) P P P P P P P P P P P P P P P P P P P P P P P P P P P P P P P P P F F F F
67 known in this research, an average high and low temperature were entered into the program. These values were obtained by taking the recorded air temperature during the deflection testing and adding or subtracting 8.33 degrees to obtain Celsius temperatures (15 degrees to obtain Fahrenheit temperatures), respectively. The computer programs, MODULUS, EVERCALC, and BOUSDEF were used in this analysis. All three programs require the following input parameters: magnitude of the load creating the deflection basin, the FWD load plate radius, distance of the sensors from center of the load plate, corrected deflection measurements, layer thicknesses, and the estimated Poisson s ratio values for all layers. Tables 4.6 and 4.7 summarize the back calculated resilient modulus values obtained with these three programs. RESULTS FROM R-VALUE TESTS After completing all resilient modulus tests, the soil samples were re-compacted and prepared for the R-value test. Each soil sample was compacted in a 102-mm (4-in.) diameter and 64-mm (2.5- in.) high mold by using static load compaction. The specifications for Resistance R-Value and Expansion Pressure of Compacted Soils AASHTO T 190 (ASTM D 2844) outline these testing procedures. In addition, the final R-values were corrected for variations in specimen height. Tables 4.8 and 4.9 summarize the results of the R-value tests for both sampling periods. STATISTICAL ANALYSIS As mentioned earlier, data were obtained from nine different sites during two different time periods, the summer of 1992 and the spring of Five of these sites were common to 56
68 TABLE 4.6 Back Calculated Resilient Modulus Values (Summer of 1992) M R from M R from M R from Mile Project MODULUS EVERCALC BOUSDEF Route Post Number Program (kpa) Program (kpa) Program (kpa) P P P P P P TABLE 4.7 Back Calculated Resilient Modulus Values (Spring 1993) M R from M R from M R from Mile Project MODULUS EVERCALC BOUSDEF Route Post Number Program (kpa) Program (kpa) Program (kpa) P P P P P P P F
69 TABLE 4.8 R-Values for Samples Collected in the Summer of 1992 Mile Tube Layer R Route Post # # value P P P P P P P P P P P P P P P P P P P P P P P P P P NA P P P P P P P
70 TABLE 4.9 R-Values for Samples Collected in the Spring of 1993 Mile Tube Layer R Route Post # # value P P P P P P P P P P P P P P P P P P P P P P P P P P P P P P P P P F F F F
71 both time periods, one was specific to the summer of 1992, and three were specific to the spring of Table 4.10 summarizes the sites analyzed in each time period. TABLE 4.10 Summary of Test Sites Included in Each Period Route Mile Post Summer of 1992 Spring of 1993 P X P X P X X P X X P X X P X X P X P X X F X As a result of the laboratory and back calculation tests, several measured variables were available for analysis. These variables included: the resilient modulus (measured under four conditions), R-value, and certain soil characteristics (actual and optimum water contents, plasticity index, soil classification, and group index). Because the nine sites had a variety of soil classifications, statistical analyses were completed by taking into account these differences as necessary. In addition, all analyses were based upon log 10 (M R ), abbreviated as LMR, instead of M R itself because this minimized the differences between high and low resilient modulus values obtained at each test site. Relationship Between Resilient Modulus and R-Value Because the resilient modulus and the R-value provide similar information on a section s subgrade, one would assume that a relationship exists between these two laboratory tests. As a result, 60
72 correlations were obtained between the measured R-values and the four measured resilient modulus conditions for both time periods. These four conditions were the undisturbed M R from the ring, the undisturbed M R from the actuator, the disturbed M R from the ring, and the disturbed M R from the actuator. Recall, the ring refers to the LVDT s placed inside of the testing chamber and the actuator refers to the LVDT s placed on the loading piston. Table 4.11 presents the correlations obtained from these laboratory measurements. Comparisons can be made within the TABLE 4.11 Correlations Between LMR 1 and R-Value Undisturbed Disturbed Sample Ring Actuator Ring Actuator Size Summer of Spring of Pooled Log 10 (Resilient Modulus Values) 2 Pooled (1992 & 1993) rows of this table because they are based on the same soil samples. However, differences in the soil classifications between Periods A and B may distort comparisons between rows. Overall, this table shows that the disturbed soil LMR s were not significantly correlated with the R-value, but that the undisturbed soil LMR s were correlated with the R-value. Correlations between undisturbed and disturbed LMR s (not shown) were modest to nonexistent. Therefore, samples should remain undisturbed if the resilient modulus is to be a meaningful measure for pavement design. Only undisturbed LMR s were used in remaining analyses, unless noted otherwise. 61
73 The Effect of Sensor Locations on M R Measurements The correlations shown in Table 4.11 also favor the placement of the LVDT s outside the testing chamber on the loading piston (actuator) instead of on the rings inside the chamber. However, observed differences in the correlations with the R-values were not extreme, and placements were also compared on the basis of measurement precision. In order to ensure that all variability measured was attributable to differences in measurement methods, values were adjusted for site, period, and sample tube. The test for differences in variances for paired data (Snedecor & Cochran, 1989) showed the ring variance to be greater than the actuator variance (t = 2.238, df = 20, p = ). The greater variation in ring measurements can be explained by the fact that it is difficult to obtain good contact between the LVDT s on the ring and the soil sample. Therefore, the remaining analyses were completed using actuator measurements only. Although measurements at the actuator appear to be preferable, the possible relationship between actuator and ring measures was examined. Table 4.12 shows a high correlation between actuator and ring measurements of LMR. In addition, a t-test of paired differences indicates that ring measurements were on average higher than actuator measurements. For undisturbed 62
74 TABLE 4.12 Relations Between LMRR 1 and LMRA 2 Correlation Mean Diff. t df p-value Summer of Spring of < Pooled < Log 10 (Resilient Modulus Value for Ring Measurement) 2 Log 10 (Resilient Modulus Value for Actuator Measurement) samples, a repeated measures analysis indicates a similarity in differences between ring and actuator measurements (p = 0.206). The Effect of Sample Locations on M R Values Sample selection from the Shelby tubes is an important issue when determining the resilient modulus value. If the layers within a tube systematically differ from each other, with the upper portion consistently having higher or lower values than the lower portion, one would expect a noticeable difference in the values obtained from the selected samples. However, available data do not yield evidence of such differences (repeated measures analysis F 2,13 = 1.27, p = ). On the other hand, if one assumes the layers are similar to each other, averaging the LMR values will give more reliable results than using the value from a single layer. Overall, it is not possible with the available data in this research to select one layer over another without an additional reference criterion. 63
75 Relationship Between Back Calculated and Laboratory M R Values Besides laboratory testing, M R values can also be determined by back calculations using information from non-destructive tests. As mentioned earlier, the following three back calculation computer programs were utilized in the research: MODULUS (MP), EVERCALC (EP), and BOUSDEF (BP). In order to consider the quality of these programs, logs of back calculated values (designated as LMR-MP, LMR-EP, and LMR-BP, respectively) were compared to laboratory LMR values. The site-by-period mean LMR from undisturbed samples measured on the actuator was used as the best available value for the true resilient modulus, the one exception being a single site for which only ring measurements were available in Period A. Because means were calculated from a different number of observations, a weighted analysis was used (weight = sample size). Table 4.13 presents the results of this analysis. Note that the EVERCALC program appears to be slightly superior to the other two back calculation programs. In general, all back calculated values match better with each other than they do with the laboratory measurements. Assuming constant differences between logs of back calculated and laboratory values, the best estimated differences appear in Table 4.14, along with implied relationships between laboratory and back calculated values of M R. A 95% confidence interval for the appropriate correction factor (C) for subgrade soils in Wyoming, based on the EVERCALC program, is [0.20, 0.32], where M R = C * [back calculated M R value]. 64
76 Relationship Between M R Values and Soil Properties Another important question to consider when selecting a M R value is the relationship with common soil properties. The possible relationship between LMR and four factors, moisture = (actual % water content - optimum % water content), plasticity index, soil classification, and group index were analyzed. Because the group and plasticity indices were highly correlated, only one was ultimately considered for describing soil-m R relationships, group index (GI). Moisture and LMR were related, and their relationship depended on soil type. Similar strengths of the relationship between soil factors and responses were found for both undisturbed and disturbed (remolded) samples, and also for R-values (refer to Table 4.15). All of the test sections had one or more of the following types of AASHTO subgrade soil: A-4, A-6, and A-7-6. For each of these classifications correlations were developed to determine the effect of moisture on the measured values. Overall, values for undisturbed and remolded M R values and R-values from A-4 and A-6 soils decreased as water content increased. The A-7-6 subgrade soils, however, showed very little change in the measured values (refer to Table 4.16). 65
77 66
78 CHAPTER SUMMARY In this chapter, the results from the laboratory tests and back calculation computer programs were presented. Several statistical analyses were also conducted and summarized to evaluate the factors influencing the determination of the M R value used in designing new pavements or overlays. In general, these analyses indicated that the design resilient modulus value should be chosen based on laboratory tests using undisturbed soil samples and the actuator LVDT s. Multiple M R values obtained from the same Shelby tube should also be averaged to give a better representation of the subgrade soil. The M R values calculated from the equations based on the actuator LVDT deformation readings will be used to determine overlay thicknesses at each test site. This analysis will be presented and analyzed in the following chapter. 67
79 68
80 CHAPTER 5 EFFECT OF M R SELECTION ON OVERLAY THICKNESSES INTRODUCTION In order to design overlays for existing pavement sections using the AASHTO design guide, a M R value must be selected to represent the characteristics of the subgrade soil, specifically, the stress conditions. When laboratory testing is completed to determine this value, a single deviator stress is often chosen to represent the design conditions. The deviator stress suggested in the literature is kpa (6-psi). However, the actual deviator stress may be determined by using data from the field. If the actual field deviator stress is less than 41.4-kPa (6-psi), then the selected M R value is conservative which may result in a thick overlay. On the other hand, if the field deviator stress is higher than kpa (6-psi), then the selected M R value is higher than the actual one which can result in a thin overlay. This chapter presents an evaluation of how three different procedures for determining resilient modulus (laboratory with a 41.4-kPa [6-psi] deviator stress, laboratory with actual deviator stress, and the AASHTO equation with field deflection measurements) affect the resulting overlay thicknesses. LABORATORY RESILIENT MODULUS VALUES BASED ON ACTUAL FIELD STRESSES The design resilient modulus values computed from the laboratory analysis in Chapter IV were based on a deviator stress of 41.4-kPa (6-psi). Since the thicknesses of each pavement 69
81 section were available from the field evaluation, this information was used to compute the actual deviator stresses in the subgrades. The computer program, BISAR, was used in this analysis, assuming a 40-kN (9000-lbs.) wheel load, a 689-kPa (100-psi) tire pressure, and a three layer pavement structure (refer to Figure 5.1). The thicknesses of the AC and base layers along 40-kN (9000-lbs.) 36-mm (5.35-in.) 689-kPa (100-psi) Asphalt Concrete Base Subgrade Figure 5.1 Assumptions Made in Calculating Actual Field Stresses with typical Young s Modulus values used by the Wyoming DOT (refer to Table 3.3) were used in this analysis. In addition, the undisturbed actuator M R value, calculated by using a 41.4-kPa (6-psi) deviator stress, was entered into this program as the first seed moduli. Several iterations were then completed by taking the resulting deviator stress and substituting this value into the regression equation developed from the laboratory tests using undisturbed samples and the actuator LVDT s. The M R value computed from the previous trial was inputted each time as the seed moduli until the resulting deviator stress changed by less than 3.5-kPa (0.5-psi). Tables 5.1 and 5.2 summarize the undisturbed actuator M R values based on 41.4-kPa (6-psi) and actual field deviator stresses. M R values for undisturbed samples, based on actuator LVDT measurements, 70
82 TABLE 5.1 M R Values Based on 41.4-kPa (6-psi) and Actual Field Deviator Stresses for Summer of 1992 Data Field Deviator M R (kpa) M R (kpa) Route Mile Post Stress (kpa) field 41.4-kPa P P P P P P P P P P P P P P P P P P P P P were used in this part of the analysis simply because it was found in Chapter 4 that they best represent the characteristics of subgrade soil samples. Comparison of Laboratory M R Values Because laboratory M R values were calculated using two different stress conditions, one would want to know if there is any statistical difference between using the actual deviator stress and the 71
83 assumed value of 41.4-kPa (6-psi). Therefore, the test for differences for paired data was performed. The data were placed in two groups, granular and treated, because four of the nine TABLE 5.2 M R Values Based on 41.4-kPa (6-psi) and Actual Field Deviator Stresses for Spring of 1993 Data Field Deviator M R (kpa) M R (kpa) Route Mile Post Stress (kpa) field 41.4-kPa P P P P P P P P P P P P P P P P P P P P F F sites had some type of treated base, either ATB or CTB. After completing this separation, comparisons were completed on all the sites within each group and then by each site individually. Tables 5.3 and 5.4 summarize the tests for the granular and treated sites, respectively. 72
84 Both tables show that there is not a statistical difference between the two data sets. However, by examining the variances, one would favor using the computed field deviator stresses over the assumed 41.4-kPa (6-psi) value because of the reduction in the amount of variance or 73
85 TABLE 5.3 Testing Significance of Differences for Granular Base Sites (Summer of 1992 & Spring of 1993) Mile M R (41.4-kPa) M R (field) Route Post Variance Variance t df p-value P E E P E E P E E P E E P E E Pooled 3.50E E TABLE 5.4 Testing Significance of Differences for Treated Base Sites (Summer of 1992 & Spring of 1993) Mile M R (41.4-kPa) M R (field) Route Post Variance Variance t df p-value P E E P E E P E E F E E Pooled 5.31E E variability. By determining actual deviator stresses, the resulting M R values were more consistent within each test site. OVERLAY THICKNESS RESULTS Several spreadsheets were developed to determine the overlay thicknesses for each test site. An example of this spreadsheet is shown in Appendix D. After entering the applied loads and corrected deflection measurements from the field FWD tests into the spreadsheet, several equations were solved in order to determine the SN eff value of each test site. The first set of equations determined the M R value based on the AASHTO equation (refer to Section 2.8.1). These M R values were calculated by 74
86 using the corrected deflection measurements taken at the following sensor locations: 305, 457, 609, 914, 1219, and 1524-mm (12, 18, 24, 36, 48, and 60-in., respectively). The underlying assumption for the AASHTO equation is that at a certain distance away from the loading plate, the measured deflection is attributable solely to the subgrade. In order to determine this distance and the resulting M R value which will be used for design purposes, several checks must be completed. The minimum distance from the loading plate is determined with the following formula: r 0. 7a e (5.1) where: r = distance from center of load, inches a e = radius of the stress bulb at the subgrade-pavement interface, inches Two additional equations provide values related to this condition. First, the value of a e is determined from the following formula: a a D E e = M p R 2 (5.2) where: a e = radius of the stress bulb at the subgrade-pavement interface, inches a = NDT load plate radius (5.91-in.) D = total thickness of pavement layers above the subgrade, inches E p = effective modulus of all pavement layers above the subgrade, psi Second, the value of E p is determined from the following formula: 75
87 d o 1 1 D = pa + a 15. (5.3) 2 E E p D p M R a M R where: d o = deflection measured at the center of the load plate, inches p = NDT load plate pressure, psi a = NDT load plate radius (5.91-in.) D = total thickness of pavement layers above the subgrade, inches M R = subgrade resilient modulus, psi E p = effective modulus of all pavement layers above the subgrade, psi These three constraints must be satisfied in order to determine the minimum distance. Once this distance is determined, the M R value can then be adjusted with a correction factor before it is used to determine the SN f value. In this research study, a correction factor of 0.33 was used. For each test site, nine M R and E p values were calculated because nine different loads were applied to each section. Final design values for both of these parameters were determined by taking a logarithmic average. Tables 5.5 and 5.6 summarize the M R values from the three different methods: 41.4-kPa TABLE 5.5 Summary of M R Values from 3 Methods (Summer of 1992) Route Mile Post M R AASHTO (kpa) M R LAB (kpa) M R FIELD (kpa) P P P P P P
88 TABLE 5.6 Summary of M R Values from 3 Methods (Spring of 1993) Route Mile Post M R AASHTO (kpa) M R LAB (kpa) M R FIELD (kpa) P P P P P P F (6-psi) deviator stress, field deviator stress, and deflection measurements (referred to as LAB, FIELD, and AASHTO, respectively). The three sets of M R values were then used to compute the effective structural number (SN f ) using the flexible pavement design equation developed by AASHTO shown below: log PSI log 10 W18 = zr * So *log 10 (SN f + 1) (SN + 1) f *log M R (5.4) where: W 18 = estimated future traffic, 18-kip ESALs z R = standard normal deviate (based on reliability factor) S o = overall standard deviation SN f = future design structural number PSI = design present serviceability index (PSI) loss M R = design resilient modulus value, psi In this research project, the following three different estimated future levels of traffic (W 18 ) were used in the above equation: 800,000, 3,000,000, and 5,000,000 ESALs corresponding to low, medium, and high traffic levels, respectively. The following values were assumed for the rest of 77
89 the variables in the above equation: 85% reliability factor, 0.45 standard deviation, and 2.5 as the change in PSI ( PSI). The SN f values were determined for all test sections based on the three calculated M R values and three different traffic levels. This analysis resulted in a total of nine SN f values for each test site. Tables 5.7 and 5.8 summarize all SN f results. Next, the SN eff values were determined using the NDT overlay procedure and the averaged M R (based on deflection measurements) and E p values calculated earlier for each site. Tables 5.9 and 5.10 present the SN eff values. Recall from Chapter 2, the SN eff for the NDT procedure is calculated with the following formula: SN eff = D 3 E (5.5) p Finally, the overlay design equation was used to determine the resulting overlay thicknesses (D ol ) for each section. These values were obtained by taking the difference between the SN f and SN eff values (SN ol = SN f - SN eff ) and dividing this quantity by 0.44, the layer coefficient (a ol ) for new asphalt pavement. Tables 5.11 and 5.12 summarize the D ol values obtained in this analysis. STATISTICAL ANALYSIS With three different methods for determining M R (AASHTO, LAB, and FIELD), it would be of interest to know if there are any statistical differences in the calculated overlay thicknesses due to the method used. The negative thicknesses were left in the analysis in order to provide a better indication of the differences among methods. A repeated measures analysis showed no evidence of differences (null hypothesis) among the methods at low, medium, or high traffic levels (F 2,24 = 2.16, p-value = , F 2,24 = 2.18, p-value = , and F 2,24 = 2.18, p-value = 78
90 0.1349, 79
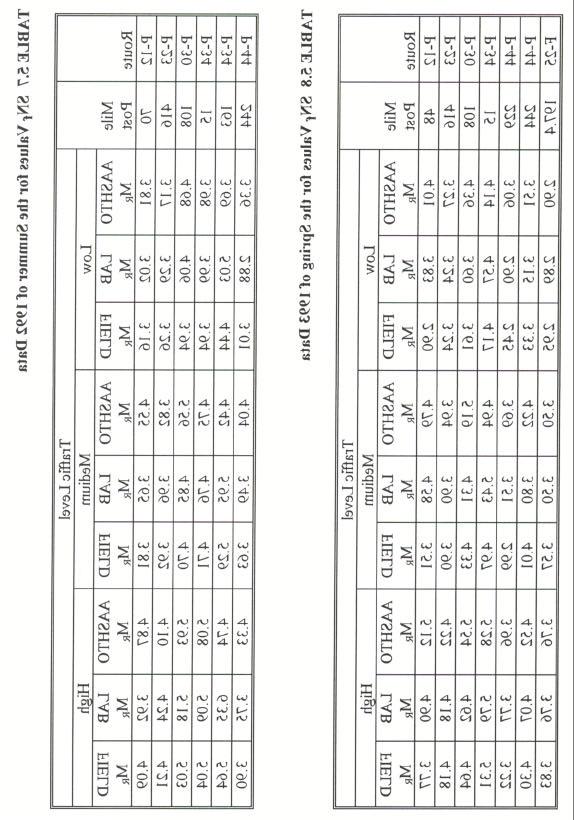
91 80
92 TABLE 5.9 Summary of SN eff Values for the Summer of 1992 Data Route Mile Post SN eff P P P P P P TABLE 5.10 Summary of SN eff Values for the Spring of 1993 Data Route Mile Post SN eff P P P P P P F
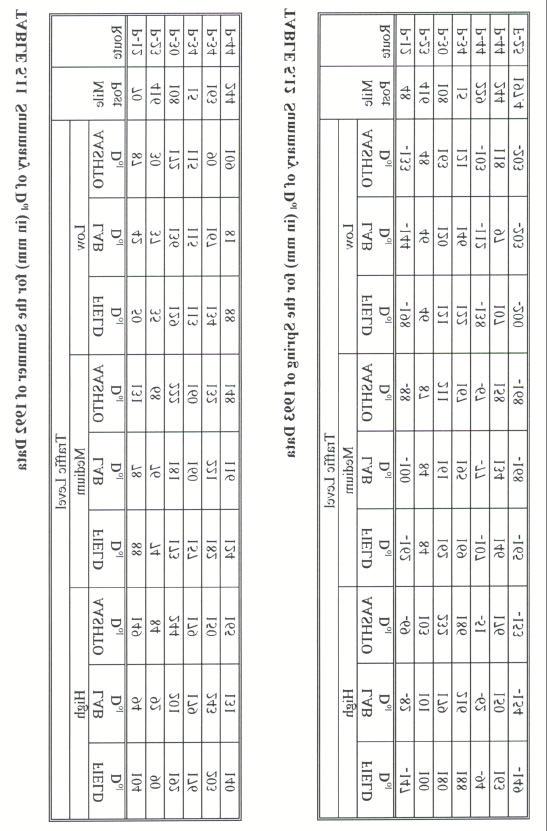
93 82
Stress Rotations Due to Moving Wheel Loads and Their Effects on Pavement Materials Characterization
 Stress Rotations Due to Moving Wheel Loads and Their Effects on Pavement Materials Characterization Erol Tutumluer June 9, 2005 OMP Brown Bag Seminar Presentation FAA Center of Excellence for Airport Technology
INTRODUCTION TO PAVEMENT STRUCTURES
 INTRODUCTION TO PAVEMENT STRUCTURES A pavement is a structure composed of structural elements, whose function is to protect the natural subgrade and to carry the traffic safety and economically. As a wheel
Impact of Water on the Structural Performance of Pavements
 Impact of Water on the Structural Performance of Pavements S. Erlingsson Highway Engineering, VTI The Swedish National Road and Transport Research Institute, Linköping, Sweden & Faculty of Civil and Environmental
Mechanistic Pavement Design
 Seminar on Pavement Design System and Pavement Performance Models Reykjavik, 22. 23. March, 2007 Mechanistic Pavement Design A Road to Enhanced Understanding of Pavement Performance Sigurdur Erlingsson
MECHANISTIC-EMPIRICAL LOAD EQUIVALENCIES USING WEIGH IN MOTION
 MECHANISTIC-EMPIRICAL LOAD EQUIVALENCIES USING WEIGH IN MOTION Prepared By: Curtis Berthelot Ph.D., P.Eng. Dept. of Civil Engineering University of Saskatchewan Tanya Loewen Dept. of Civil Engineering
Flexible Pavement Design
 Flexible Pavement Design The Mechanistic-Empirical Way Presented by: Keith D. Herbold, P.E. 1 Presentation Outline What s new in flexible design Example of new design Differences Capabilities Tests and
METHODS FOR EVALUATING RESILIENT MODULI OF PAVING MATERIALS
 Project Number ST 2019-7 Summary Report METHODS FOR EVALUATING RESILIENT MODULI OF PAVING MATERIALS sponsored by The State of Alabama Highway Department Montgomery, Alabama Frazier Parker, Jr. David J.
Application of DCP in Prediction of Resilient Modulus of Subgrade Soils
 Application of DCP in Prediction of Resilient Modulus of Subgrade Soils Louay Mohammad, Ph.D. Louisiana Transportation Research Center Louisiana State University 2006 Pavement Performance Seminar April
Mechanistic-Empirical Pavement Design Guide: A User s Perspective. Brian D. Prowell, Ph.D., P.E.
 Mechanistic-Empirical Pavement Design Guide: A User s Perspective Brian D. Prowell, Ph.D., P.E. Empirical Approach Based on results of experiments or experience Scientific basis not established AASHTO
Subject Index. STP1026-EB/Nov. 1989
 STP1026-EB/Nov. 1989 Subject Index A AASHTO and Unified Soil Classification System, 686, 687 (table) 1986 AASHTO Guide for Design of Pavement Structures, 64, 683-690 AASHTO Test Method T 274-82,640-643,
GEOSYNTHETICS ENGINEERING: IN THEORY AND PRACTICE
 GEOSYNTHETICS ENGINEERING: IN THEORY AND PRACTICE Prof. J. N. Mandal Department of civil engineering, IIT Bombay, Powai, Mumbai 400076, India. Tel.022-25767328 email: cejnm@civil.iitb.ac.in Module-5 LECTURE-
ACKNOWLEDGMENT OF SPONSORSHIP
 ACKNOWLEDGMENT OF SPONSORSHIP This work was sponsored by the American Association of State Highway and Transportation Officials, in cooperation with the Federal Highway Administration, and was conducted
EXTENSION OF THE YONAPAVE METHOD FOR DETERMINING FLEXIBLE PAVEMENTS OVERLAY THICKNESS FROM FALLING- WEIGHT DEFLECTOMETER DEFLECTIONS
 EXTENSION OF THE YONAPAVE METHOD FOR DETERMINING FLEXIBLE PAVEMENTS OVERLAY THICKNESS FROM FALLING- WEIGHT DEFLECTOMETER DEFLECTIONS MARIO S. HOFFMAN, PHD. Technical director, YONA, Engineering Consulting
Comparison of Ontario Pavement Designs Using the AASHTO 1993 Empirical Method and the Mechanistic-Empirical Pavement Design Guide Method
 Comparison of Ontario Pavement Designs Using the AASHTO 1993 Empirical Method and the Mechanistic-Empirical Pavement Design Guide Method by Jonathan Nathan Boone A thesis presented to the University of
ALACPA-ICAO Seminar on PMS. Lima Peru, November 2003
 ALACPA-ICAO Seminar on PMS Lima Peru, 19-22 November 2003 Airport Pavements FWD/HWD Testing and Evaluation By: Frank B. Holt Vice President Dynatest International A/S Dynamic Testing The method of FWD/HWD
Mechanistic Investigation of Granular Base and Subbase Materials A Saskatchewan Case Study
 Mechanistic Investigation of Granular Base and Subbase Materials A Saskatchewan Case Study Curtis Berthelot, P. Eng. Department of Civil and Geological Engineering University of Saskatchewan 57 Campus
Unbound Pavement Applications of Excess Foundry System Sands: Subbase/Base Material
 Unbound Pavement Applications of Excess Foundry System Sands: Subbase/Base Material Tuncer B. Edil University of Wisconsin-Madison Recycled Materials Resource Center RMRC Participant Job Description Which
Evaluating Structural Performance of Base/Subbase Materials at the Louisiana Accelerated Pavement Research Facility
 Evaluating Structural Performance of Base/Subbase Materials at the Louisiana Accelerated Pavement Research Facility Zhong Wu, Ph.D., P.E. Zhongjie Zhang, Bill King Louay Mohammad Outline Background Objectives
2015 North Dakota Asphalt Conference
 2015 North Dakota Asphalt Conference NDDOT Implementation of AASHTO Flexible Pavement Design Part I ADT & ESALs Nickie Reis, P&AM Part II Structural Numbers Tom Bold, M&R March 31 - April 1, 2015 Part
Analysis of Non-Linear Dynamic Behaviours in Asphalt Concrete Pavements Under Temperature Variations
 ENOC 2017, June 25 30, 2017, Budapest, Hungary Analysis of Non-Linear Dynamic Behaviours in Asphalt Concrete Pavements Under Temperature Variations Amal Abdelaziz *, Chun-Hsing Ho *, and Junyi Shan * *
Pavement Discontinuities and Dynamic Load Response
 1 TRANSPORTATON RESEARCH RECORD 1448 Finite Element Simulation of Pavement Discontinuities and Dynamic Load Response W AHEED UDDN, DNGMNG ZHANG, AND FRANCSCO FERNANDEZ Assumption of a linear elastic system
Impact of Existing Pavement on Jointed Plain Concrete Overlay Design and Performance
 Impact of Existing Pavement on Jointed Plain Concrete Overlay Design and Performance Michael I. Darter, Jag Mallela, and Leslie Titus-Glover 1 ABSTRACT Concrete overlays are increasingly being constructed
Evaluation of Rutting Depth in Flexible Pavements by Using Finite Element Analysis and Local Empirical Model
 American Journal of Engineering and Applied Sciences, 2012, 5 (2), 163-169 ISSN: 1941-7020 2014 Abed and Al-Azzawi, This open access article is distributed under a Creative Commons Attribution (CC-BY)
Accelerated Loading Evaluation of Base & Sub-base Layers
 Accelerated Loading Evaluation of Base & Sub-base Layers Zhong Wu, Ph.D., P.E. Louisiana Transportation Research Center (LTRC) April 2006 What is Accelerated Loading? Accelerated loading refers to Accelerated
Calibration of Mechanistic-Empirical Fatigue Models Using the PaveLab Heavy Vehicle Simulator
 1 1 1 1 1 1 1 0 1 0 1 0 1 Calibration of Mechanistic-Empirical Fatigue Models Using the PaveLab Heavy Vehicle Simulator Eliecer Arias-Barrantes 1, José Pablo Aguiar-Moya, Luis Guillermo Loría-Salazar,
Determination of Resilient Modulus Model for Road-Base Material
 JOURNAL OF APPLIED SCIENCES RESEARCH ISSN: 1819-544X Published BY AENSI Publication EISSN: 1816-157X http://www.aensiweb.com/jasr 2017 January; 13(1): pages 10-16 Open Access Journal Determination of Resilient
Developing an Economical and Reliable Test for Measuring the Resilient Modulus and Poisson s Ratio of Subgrade
 Ohio Transportation Consortium Project Report Developing an Economical and Reliable Test for Measuring the Resilient Modulus and Poisson s Ratio of Subgrade Rulan Hu, Graduate Student, and David Zeng,
Effect of tire type on strains occurring in asphalt concrete layers
 Effect of tire type on strains occurring in asphalt concrete layers Grellet D., Doré G., & Bilodeau J.-P. Department of Civil Engineering, Laval University, Québec, Canada ABSTRACT: The three main causes
Evaluating Structural Performance of Base/Subbase Materials at the Louisiana Accelerated Pavement Research Facility
 Evaluating Structural Performance of Base/Subbase Materials at the Louisiana Accelerated Pavement Research Facility Zhong Wu, Ph.D., P.E. Louisiana Transportation Research Center 2007 Transportation Engineering
ACET 406 Mid-Term Exam B
 ACET 406 Mid-Term Exam B SUBJECT: ACET 406, INSTRUCTOR: Dr Antonis Michael, DATE: 24/11/09 INSTRUCTIONS You are required to answer all of the following questions within the specified time (90 minutes).you
Field Rutting Performance of Various Base/Subbase Materials under Two Types of Loading
 Field Rutting Performance of Various Base/Subbase Materials under Two Types of Loading Qiming Chen, Ph.D., P.E. (presenter) Murad Abu-Farsakh, Ph.D., P.E. Louisiana Transportation Research Center Apr.
2002 Design Guide Preparing for Implementation
 2002 Preparing for Implementation By Monte Symons 2003 NCUAPG Annual Meeting Excerpts from the 2002 Guide Implementation Package 2002 Presentation Overview Need for NCHRP 1-37A - Status Guide Basics Asphalt
Sensitivity Analysis Of Aashto's 2002 Flexible And Rigid Pavement Design Methods
 University of Central Florida Electronic Theses and Dissertations Masters Thesis (Open Access) Sensitivity Analysis Of Aashto's 2002 Flexible And Rigid Pavement Design Methods 2006 Sanjay Shahji University
Development and Validation of Mechanistic-Empirical Design Method for Permeable Interlocking Concrete Pavement
 Development and Validation of Mechanistic-Empirical Design Method for Permeable Interlocking Concrete Pavement Hui Li, David Jones, Rongzong Wu, and John Harvey University of California Pavement Research
Lecture 3: Stresses in Rigid Pavements
 Lecture 3: Stresses in Rigid Pavements Nature of Responses under Flexible and Rigid Plates Flexible plate: Uniform Contact Pressure Variable Deflection Profile Flexible Plate Rigid Plate plate: Non-Uniform
Falling Weight Deflectometer vs Laboratory Determined Resilient Modulus (Slab Curling Study)
") FWD-RU6701 Falling Weight Deflectometer vs Laboratory Determined Resilient Modulus (Slab Curling Study) FINAL REPORT December 2005 Submitted by Dr. Sameh Zaghloul, P.E., P.Eng.* Managing Senior Principal
FWD-RU6701 Falling Weight Deflectometer vs Laboratory Determined Resilient Modulus (Slab Curling Study) FINAL REPORT December 2005 Submitted by Dr. Sameh Zaghloul, P.E., P.Eng.* Managing Senior Principal
2012 Road School Light Weight Deflectometer (LWD)
") 2012 Road School Light Weight Deflectometer (LWD) Nayyar Siddiki, M.S., P.E. Office of Geotechnical Services Outline Testing for Compaction NO 53 and chemically modified soils (Special Prov.) Changing
2012 Road School Light Weight Deflectometer (LWD) Nayyar Siddiki, M.S., P.E. Office of Geotechnical Services Outline Testing for Compaction NO 53 and chemically modified soils (Special Prov.) Changing
Flexural Life of Unbound Granular Pavements with Chip Seal Surfacings
 Flexural Life of Unbound Granular Pavements with Chip Seal Surfacings Austroads Design Checks vertical strains at top of subgrade, ie primary function is to limit rutting BUT - trigger for rehabilitation
STRUCTURAL ADEQUACY OF RUBBLIZED PCC PAVEMENT
 STRUCTURAL ADEQUACY OF RUBBLIZED PCC PAVEMENT By Khaled A. Galal 1, MSCE Materials Research Engineer Indiana Department of Transportation - Division of Research 1205 Montgomery Street, P. O. Box 2279 West
Developing Subgrade Inputs for Mechanistic- Empirical Pavement Design
 University of Arkansas, Fayetteville ScholarWorks@UARK Computer Science and Computer Engineering Undergraduate Honors Theses Computer Science and Computer Engineering 5-2008 Developing Subgrade Inputs
SUITABILITY OF USING CALIFORNIA BEARING RATIO TEST TO PREDICT RESILIENT MODULUS
 SUITABILITY OF USING CALIFORNIA BEARING RATIO TEST TO PREDICT RESILIENT MODULUS By: Beena Sukumaran, Associate Professor, Civil & Environmental Engineering Rowan University 201 Mullica Hill Road, Glassboro,
MECHANISTIC CHARACTERIZATION OF RESILIENT MODULI FOR UNBOUND PAVEMENT LAYER MATERIALS
 MECHANISTIC CHARACTERIZATION OF RESILIENT MODULI FOR UNBOUND PAVEMENT LAYER MATERIALS Except where reference is made to the work of others, the work described in this thesis is my own or was done in collaboration
Design of Overlay for Flexible Pavement
 Design of Overlay for Flexible Pavement Types of Overlays Asphalt overlay over asphalt pavements Asphalt overlays on CC pavements CC overlays on asphalt pavements CC overlays on CC pavements Steps in Design
NJDOT RESEARCH PROJECT MANAGER: Mr. Anthony Chmiel
 Project Title: RFP NUMBER: CAIT NJDOT Bureau of Research QUARTERLY PROGRESS REPORT Evaluation of Poisson s Ratio NJDOT RESEARCH PROJECT MANAGER: Mr. Anthony Chmiel TASK ORDER NUMBER/Study Number: Task
Lecture 2: Stresses in Pavements
 Lecture 2: Stresses in Pavements Stresses in Layered Systems At any point, 9 stresses exist. They are 3 normal stresses (s z, s r, s t ) and 6 shearing stresses ( t rz = t zr, t rt = t tr, and t tz = t
Comparison of Backcalculated Moduli from Falling Weight Deflectometer and Truck Loading
 88 TRANSPORTATION RESEARCH RECORD 1377 Comparin of Backcalculated Moduli from Falling Weight Deflectometer and Truck Loading PETER E. SEBAALY, NADER TABATABAEE, AND TOM SCULLION Historically, the in situ
LRRB INV 828 Local Road Material Properties and Calibration for MnPAVE
 LRRB INV 828 Local Road Material Properties and Calibration for MnPAVE Task 4 Report Calibration Bruce Tanquist, Assistant Pavement Design Engineer Minnesota Department of Transportation May 23, 2008 Introduction
Nevels, et al 1 KAY COUNTY SHALE SUBGRADE STABILIZATION REVISITED
 Nevels, et al 1 Title: KAY COUNTY SHALE SUBGRADE STABILIZATION REVISITED Submitted: 15 November 2012 (revised) Word Count: 3581 + 7 figures = 5331 Name: Affiliation: Email: Joakim G. Laguros, Ph.D., P.E.
2008 SEAUPG CONFERENCE-BIRMINGHAM, ALABAMA
 Introduction Overview M E E Design Inputs MEPDG Where are we now MEPDG Inputs, Outputs, and Sensitivity Southeast Asphalt User Producer Group Bill Vavrik 19 November 2008 2 Implementation Timeframe DARWin
Dynamic Resilient Modulus and the Fatigue Properties of Superpave HMA Mixes used in the Base Layer of Kansas Flexible Pavements
 06-1012 Dynamic Resilient Modulus and the Fatigue Properties of Superpave HMA Mixes used in the Base Layer of Kansas Flexible Pavements by Stefan A. Romanoschi, Nicoleta Dumitru, Octavian Dumitru and Glenn
EXAMINATION OF MECHANICAL PROPERTIES IN UNBOUND ROAD BASES
 PERIODICA POLYTECHNICA SER. CIV. ENG. VOL. 46, NO. 1, PP. 53 69 (2002) EXAMINATION OF MECHANICAL PROPERTIES IN UNBOUND ROAD BASES Kornél ALMÁSSY Department of Highway and Railway Engineering Budapest University
Estimation of Standard Deviation of Predicted Performance of Flexible Pavements Using AASHTO Model
 46 TRANSPORT~TION RESEARCH RECORD 1449 Estimation of Standard Deviation of Predicted Performance of Flexible Pavements Using AASHTO Model A. SAMY NOURELDIN, ESSAM SHARAF, ABDULRAHIM ARAFAH, AND FAISAL
2002 Pavement Design
 2002 Pavement Design Federal Highway Administration June 2001 Thomas P. Harman Asphalt Team Leader Predicting Pavement Performance Pavements are designed to fail But how do they perform? Defining Performance
Guide for Mechanistic-Empirical Design
 Copy No. Guide for Mechanistic-Empirical Design OF NEW AND REHABILITATED PAVEMENT STRUCTURES FINAL DOCUMENT APPENDIX BB: DESIGN RELIABILITY NCHRP Prepared for National Cooperative Highway Research Program
Analysis of Damage of Asphalt Pavement due to Dynamic Load of Heavy Vehicles Caused by Surface Roughness
 Analysis of Damage of Asphalt Pavement due to Dynamic Load of Heavy Vehicles Caused by Surface Roughness T. Kanai, K. Tomisawa and T. Endoh Technical Research Institute, Kajima road Co., Ltd., Chofu, Tokyo,
GeoShanghai 2010 International Conference Paving Materials and Pavement Analysis
 Particle Shape, Type and Amount of Fines, and Moisture Affecting Resilient Modulus Behavior of Unbound Aggregates Debakanta Mishra 1, Erol Tutumluer 2, M. ASCE, Yuanjie Xiao 3 1 Graduate Research Assistant,
Pavement Design Where are We? By Dr. Mofreh F. Saleh
 Pavement Design Where are We? By Dr. Mofreh F. Saleh Pavement Design Where are We?? State-of-Practice State-of-the-Art Empirical Mechanistic- Empirical Mechanistic Actual Current Practice?? Inputs Structure
ANNEX 1. PAVEMENT DESIGN METHODS
 Pavement design methods 89 ANNEX 1. PAVEMENT DESIGN METHODS 1. ANALYTICAL METHODS 1.1. Hypothesis of Westergaard In order to understand the hypothesis of Westergaard (Westergaard, H. M. 1927) its principles
Flexible Pavement Stress Analysis
 Flexible Pavement Stress Analysis Dr. Antonis Michael Frederick University Notes Courtesy of Dr. Christos Drakos, University of Florida Need to predict & understand stress/strain distribution within the
Non-Destructive Pavement Evaluation to Assess Flood Damage in The City of Calgary
 Non-Destructive Pavement Evaluation to Assess Flood Damage in The City of Calgary Venkat Lakkavalli P. Eng., M. Sc. The City of Calgary Alberta, Canada Presented at TAC 2014, Montreal (Karim, M et al.
NOTTINGHAM DESIGN METHOD
 NOTTINGHAM DESIGN METHOD Dr Andrew Collop Reader in Civil Engineering University of Nottingham CONTENTS Introduction Traffic Design temperatures Material properties Allowable strains Asphalt thickness
Mechanistic-Empirical Pavement Design Guide Distress Models
 Mechanistic-Empirical Pavement Design Guide Distress Models By: Mohamed El-Basyouny Arizona State University Pavement Performance Models Symposium Laramie - Wyoming June 23, 2006 Outline Analysis Methodology
Field & Laboratory Evaluation of the Portable Falling Weight Deflectometer (PFWD) NETC Project No. 00-4
 NETC Project No. 00-4") Field & Laboratory Evaluation of the Portable Falling Weight Deflectometer (PFWD) NETC Project No. 00-4 Principal Investigators: Dana N. Humphrey, Ph.D., P.E. Professor & Chairperson, Department of Civil
Field & Laboratory Evaluation of the Portable Falling Weight Deflectometer (PFWD) NETC Project No. 00-4 Principal Investigators: Dana N. Humphrey, Ph.D., P.E. Professor & Chairperson, Department of Civil
research report Virginia Transportation Research Council Final Report VTRC 09-R4 M. SHABBIR HOSSAIN, Ph.D., P.E. Research Scientist
 Final Report VTRC 09-R4 Virginia Transportation Research Council research report Characterization of Subgrade Resilient Modulus for Virginia Soils and Its Correlation with the Results of Other Soil Tests
AASHTO Rigid Pavement Design
 AASHTO Rigid Pavement Design Dr. Antonis Michael Frederick University Notes Courtesy of Dr. Christos Drakos University of Florida 1. Introduction Empirical design based on the AASHO road test: Over 200
THE BEHAVIOUR OF FLEXIBLE PAVEMENT BY NONLINEAR FINITE ELEMENT METHOD
 International Journal of Latest Research in Science and Technology Volume 3, Issue 1: Page No.537,January-February 214 http://www.mnkjournals.com/ijlrst.htm ISSN (Online):2278299 THE BEHAVIOUR OF FLEXIBLE
MPC T. Kasperick and K. Ksaibati
 MPC 15-294 T. Kasperick and K. Ksaibati Calibration of the Mechanistic-Empirical Pavement Design Guide for Local Paved Roads in Wyoming A University Transportation Center sponsored by the U.S. Department
Evaluation of FWD software and deflection basin for airport pavements
 University of New Mexico UNM Digital Repository Civil Engineering ETDs Engineering ETDs 9-3-21 Evaluation of FWD software and deflection basin for airport pavements Mesbah Uddin Ahmed Follow this and additional
Microcomputer Application To Determine the Load Zoning for Low-Volume Roads
 226 TRANSPORTATION RESEARCH RECORD 1260 Microcomputer Application To Determine the Load Zoning for Low-Volume Roads B. LANKA SANTHA, W. YANG, AND ROBERT L. LYTTON A computerized procedure, LOAD RATE, Version
Study on How to Determine Repair Thickness of Damaged Layers for Porous Asphalt
 Study on How to Determine Repair Thickness of Damaged Layers for Porous Asphalt K. Kamiya & T. Kazato Nippon Expressway Research Institute Company Limited, Tokyo, Japan ABSTRACT: Porous asphalt has been
Modulus of Rubblized Concrete from Surface Wave Testing
 from Surface Wave Testing Nenad Gucunski Center for Advanced Infrastructure and Transportation (CAIT) Infrastructure Condition Monitoring Program (ICMP) 84 th Annual NESMEA Conference October 8, 2008 Route
SURFACE MODULI DETERMINED WITH THE FALLING WEIGHT DEFLECTOMETER USED AS BENCHMARKING TOOL
 SURFACE MODULI DETERMINED WITH THE FALLING WEIGHT DEFLECTOMETER USED AS BENCHMARKING TOOL E Horak* Professor and Head of Department of Civil and Biosystems Engineering, University of Pretoria, e-mail:
Revised Test Plan for Seasonal Monitoring Program using HWD Testing
 April 2005 Revised Test Plan for Seasonal Monitoring Program using HWD Testing Partnered Pavement Research Prepared for: California Department of Transportation Prepared by: University of California Berkeley
MATERIAL MODELS FOR CRUMB RUBBER AND TDA. California State University, Chico
 MATERIAL MODELS FOR CRUMB RUBBER AND TDA California State University, Chico Waste Tire Products for CE Applications Whole Tires Tire Shreds (TDA) Crumb Rubber/Tire Buffings Whole Tires TIRE DERIVED AGGREGATE
Chapter (12) Instructor : Dr. Jehad Hamad
 Instructor : Dr. Jehad Hamad") Chapter (12) Instructor : Dr. Jehad Hamad 2017-2016 Chapter Outlines Shear strength in soils Direct shear test Unconfined Compression Test Tri-axial Test Shear Strength The strength of a material is the
Chapter (12) Instructor : Dr. Jehad Hamad 2017-2016 Chapter Outlines Shear strength in soils Direct shear test Unconfined Compression Test Tri-axial Test Shear Strength The strength of a material is the
Design of Flexible Pavements
 PDH-Pro.com Course Number: CE-02-110 PDH: 14 Design of Flexible Pavements Approved for: AK, AL, AR, GA, IA, IL, IN, KS, KY, MD, ME, MI, MN, MO, MS, MT, NC, ND, NE, NH, NJ, NM, NV, OH, OK, OR, PA, SC, SD,
Monitoring the structural behaviour variation of a flexible pavement. structure during freeze and thaw
 Monitoring the structural behaviour variation of a flexible pavement structure during freeze and thaw Junyan Yi, Ph.D. Post-doc researcher, Department of civil engineering, Laval University Guy Doré, ing.
Development of Laboratory to Field Shift Factors for Hot-Mix Asphalt Resilient Modulus. Samer W. Katicha. Masters Of Science.
 Development of Laboratory to Field Shift Factors for Hot-Mix Asphalt Resilient Modulus by Samer W. Katicha Thesis submitted to the Faculty of the Virginia Polytechnic Institute and State University In
Characterizing Horizontal Response Pulse at the Bottom of Asphalt Layer Based on Viscoelastic Analysis
 Technical Paper ISSN 1996-6814 Int. J. Pavement Res. Technol. 6(4):379-385 Copyright @ Chinese Society of Pavement Engineering Characterizing Horizontal Response Pulse at the Bottom of Asphalt Layer Based
Development of a Quick Reliability Method for Mechanistic-Empirical Asphalt Pavement Design
 Tanquist 1 Development of a Quick Reliability Method for Mechanistic-Empirical Asphalt Pavement Design Submission date: August 1, 2001 Word Count: 4654 Bruce A. Tanquist Research Project Engineer Minnesota
Mn/DOT Flexible Pavement Design Mechanistic-Empirical Method
 Mn/DOT Flexible Pavement Design Mechanistic-Empirical Method Pavement Design Systems and Pavement Performance Models March 22-23, 2007 - Reykjavik, Iceland Bruce Chadbourn Assistant Pavement Design Engineer
Comparison of Rigid Pavement Thickness Design Systems
 Transportation Kentucky Transportation Center Research Report University of Kentucky Year 1988 Comparison of Rigid Pavement Thickness Design Systems Herbert F. Southgate University of Kentucky This paper
1.8 Unconfined Compression Test
 1-49 1.8 Unconfined Compression Test - It gives a quick and simple measurement of the undrained strength of cohesive, undisturbed soil specimens. 1) Testing method i) Trimming a sample. Length-diameter
Flexible Pavement Analysis Considering Temperature Profile and Anisotropy Behavior in Hot Mix Ashalt Layer
 Open Journal of Civil ngineering, 2011, 1, 7-12 doi:10.4236/ojce.2011.12002 Published Online December 2011 (http://www.scirp.org/journal/ojce) Flexible Pavement Analysis Considering Temperature Profile
Base Design Considerations for Jointed Concrete. Dan G. Zollinger, Ph.D., P.E. Texas A&M University, College Station, TX, USA
 Base Design Considerations for Jointed Concrete Dan G. Zollinger, Ph.D., P.E. Texas A&M University, College Station, TX, USA Discussion What is Erosion Effects on Performance Erosion Testing Use of Erosion
The Development of a Performance Specification for Granular Base and Subbase Material
 FHWA-NJ-2005-003 The Development of a Performance Specification for Granular Base and Subbase Material FINAL REPORT Mr. Thomas Bennert* Research Engineer Submitted by Dr. Ali Maher* Professor and Chairman
COMPARISON BETWEEN LABORATORY AND FIELD MEASURED RESILIENT MODULUS FOR FLEXIBLE PAVEMENT
 International Journal of Civil Engineering and Technology (IJCIET) Volume 9, Issue 10, October 2018, pp. 558 568, Article ID: IJCIET_09_10_057 Available online at http://www.iaeme.com/ijciet/issues.asp?jtype=ijciet&vtype=9&itype=10
Resilient modulus and segregation potential estimation from simplified laboratory procedure
 Resilient modulus and segregation potential estimation from simplified laboratory procedure Jean-Pascal Bilodeau, ing., Ph.D. Research engineer, department of civil engineering, Laval University Guy Doré,
TRB Webinar: Estimating Stiffness of Subgrade and Unbound Materials for Pavement Design
 TRB Webinar: Estimating Stiffness of Subgrade and Unbound Materials for Pavement Design Today s Presenters and Moderator Nancy Whiting, Purdue University, whiting@purdue.edu Richard Boudreau, Boudreau
ABSTRACT. PARK, HEE MUN. Use of Falling Weight Deflectometer Multi-Load Level Data for
 ABSTRACT PARK, HEE MUN. Use of Falling Weight Deflectometer Multi-Load Level Data for Pavement Strength Estimation. (Under the direction of Y. Richard, Kim). The objective of this study is to describe
Analysis of in-service PCC pavement responses from Denver International Airport
 Analysis of in-service PCC pavement responses from Denver International Airport Dulce Rufino ERES Consultants, A Division of ARA, Inc. Presented at ISU Spring Transportation Seminar February 2, 24 Overview
Effect of Transient Dynamic Loading on Flexible Pavement Response
 Effect of Transient Dynamic Loading on Flexible Pavement Response Imad L. Al-Qadi Founder Professor of Engineering Pyeong Jun Yoo Graduate Research Assistant Illinois Center for Transportation University
NEW DOWN-HOLE PENETROMETER (DHP-CIGMAT) FOR CONSTRUCTION APPLICATIONS
 FOR CONSTRUCTION APPLICATIONS") NEW DOWN-HOLE PENETROMETER (DHP-CIGMAT) FOR CONSTRUCTION APPLICATIONS 1 2 C. Vipulanandan 1, Ph.D., M. ASCE and Omer F. Usluogullari 2 Chairman, Professor, Director of Center for Innovative Grouting Materials
NEW DOWN-HOLE PENETROMETER (DHP-CIGMAT) FOR CONSTRUCTION APPLICATIONS 1 2 C. Vipulanandan 1, Ph.D., M. ASCE and Omer F. Usluogullari 2 Chairman, Professor, Director of Center for Innovative Grouting Materials
Structural Design of Pavements
 CAIRO UNIVERSITY FACULTY OF ENGINEERING PUBLIC WORKS DEPARTMENT 4 th Year Civil Engineering Highway Engineering Course 2008-2009 Structural Design of Pavements Lecturer Dr. Eng. Omar Osman Asst. Professor
LECTURE NO. 4-5 INTRODUCTION ULTRASONIC * PULSE VELOCITY METHODS
 LECTURE NO. 4-5 ULTRASONIC * PULSE VELOCITY METHODS Objectives: To introduce the UPV methods To briefly explain the theory of pulse propagation through concrete To explain equipments, procedures, calibrations,
research report Characterization of Unbound Pavement Materials From New Mechanistic-Empirical Pavement Design Procedure
 Final Report VTRC 11-R6 Virginia Transportation Research Council research report Characterization of Unbound Pavement Materials From Virginia Sources for Use in the New Mechanistic-Empirical Pavement Design
Unified Constitutive Model for Engineering- Pavement Materials and Computer Applications. University of Illinois 12 February 2009
 Unified Constitutive Model for Engineering- Pavement Materials and Computer Applications Chandrakant S. Desai Kent Distinguished i Lecture University of Illinois 12 February 2009 Participation in Pavements.
NCHRP. Project No. NCHRP 9-44 A. Validating an Endurance Limit for Hot-Mix Asphalt (HMA) Pavements: Laboratory Experiment and Algorithm Development
 Pavements: Laboratory Experiment and Algorithm Development") NCHRP Project No. NCHRP 9-44 A Validating an Endurance Limit for Hot-Mix Asphalt (HMA) Pavements: Laboratory Experiment and Algorithm Development Appendix 1 Integrated Predictive Model for Healing and
NCHRP Project No. NCHRP 9-44 A Validating an Endurance Limit for Hot-Mix Asphalt (HMA) Pavements: Laboratory Experiment and Algorithm Development Appendix 1 Integrated Predictive Model for Healing and
Improvement of Cracking Resistance for the Semi-Rigid Base Layer Reinforced by Geogrid
 Improvement of Cracking Resistance for the Semi-Rigid Base Layer Reinforced by Geogrid Zhu Yun Sheng * Chimi Tegachouang Nathan School of Transportation, Wuhan University of Technology, # 25 Luoshi Road,
EKWULO, EMMANUEL OSILEMME PG/Ph.D/10/57787
 i EKWULO, EMMANUEL OSILEMME PG/Ph.D/10/57787 DEVELOPMENT OF LAYERED ELASTIC ANALYSIS PROCEDURE FOR PREDICTION OF FATIGUE AND RUTTING STRAINS IN CEMENT - STABILIZED LATERITIC BASE OF LOW VOLUME ROADS CIVIL