No. 58 Nitrogen Determination with Kjeldahl
|
|
|
- Merilyn Booker
- 5 years ago
- Views:
Transcription


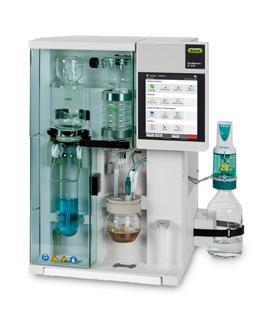
1 No. 58 Nitrogen Determination with Kjeldahl
2 How to Achieve Low Detection and Quantification Limits for the Nitrogen Determination with Kjeldahl Authors: Dr. Claudia Blum-Fretz, Stephan Buschor, Jürgen Müller Abstract Kjeldahl is one of the most commonly used techniques to determine the protein content in food and feed samples. The detection and quantification limits are important characteristics of analytical methods. The impact of the concentration of, the addition of potassium chloride, and the concentration of the titration solution on the detection and quantification limits were investigated. The best results were obtained by using 2 % with 3 g potassium chloride per liter. A titration solution of M HCl worked best. With these parameters, detection limits for distillation of standard solutions as low as mg nitrogen and quantification limits of 0.02 mg nitrogen can be achieved. Introduction Kjeldahl For almost 130 years, the determination of nitrogen using the method developed by the Danish chemist Johan Kjeldahl ( ) has been an internationally accepted standard. The method, which is named after its inventor, has since found widespread application in life science and chemistry and has extended its scope to the determination of nitrogen and proteins in dairy products, meat products, beer, cereals, and other food materials [1]. The Kjeldahl procedure involves three major steps: In the digestion step, the organically bonded nitrogen is converted into ammonium ions by oxidation with concentrated sulfuric acid. In the distillation step, the sample is alkalinized to convert the ammonium ions to ammonia. The latter is then distilled into a solution (via steam distillation). In the final titration step, the ammonia is titrated and the nitrogen content can be calculated. Theoretical background of ph measurements and titration The ph value is the negative logarithm of the hydronium ion activity and is measured with an electro-chemical sensor. In practice this is a measurement of a potential difference between a reference electrode E ref and the measuring electrode E. The measured voltage U is the potential difference of E and Eref. The calculation of ph is performed according to the following equations (1-2), which are derived from the Nernst equation [2-4]. E Eref ph = ph (1) 0 slope The quotient in equation (2) represents the slope of the ph function and shows that the slope is a function of the temperature. slope = f R T (2) z F ln log * ph negative logarithm of the hydronium ion activity ph 0 ph at zero point of ph sensor (the ph when the sensor signal is 0 mv) E potential at measuring electrode E ref potential of the reference electrode (should be constant) f ln-log conversion factor for the change of the natural (ln) to the common logarithm (2.303) R universal gas constant ( J/(K mol)) T absolute temperature [K] z number of electrons transferred (for ph: 1) F Faraday constant ( C/mol) Often the potential of the reference electrode Eref, which should be constant, shows a small variability which can lead to measurement variations. The variability of the potential is largest when the solution is stirred. To demonstrate the stirring effect, a detailed view of the ph sensor is shown in Fig. 1. Figure 1: Schematic representation of the ph electrode 1 measuring electrode (e.g., Ag/AgCl) 2 internal reference solution 3 ph sensitive glass membrane 4 sample solution (e.g., as receiving solution) 5 liquid junction (e.g., ceramic diaphragm) 6 reference electrolyte (e.g., 3 M KCl) 7 reference electrode (e.g., Ag/AgCl) U voltage measurement The variability of the potential is produced at the liquid junction (zeta potential, different mobility of borate and hydronium ion, etc.). In diluted solutions, the variability is higher than in concentrated solutions. If the solution is not stirred, a cloud of potassium and chloride ions (black dots in Figures 2 and 3) is created at the exterior of the liquid junction and reduces the surface potential. If the solution is stirred, the cloud of potassium and chloride ions is removed from the surface so that the potential increases and the measured ph value decreases. 2

3 without stirring 1. The ph increase due to dilution of the receiving solution by distillate is less important in low concentrated. The variability of the amount of distilled water has less impact on the ph value and will therefore lead to less variability of the blank values. The ph change related to dilution is shown in Figure 4. 58/ 2010 en Figure 2: Liquid junction without stirring with stirring ph ph change by dilution of Added H 2 O [ml] Figure 4: ph change when diluting 60 ml receiving solution at different concentrations of 4 % 2 % 1 % 2. The blank values in less concentrated are smaller for the same reason as above. This is particularly important because usually low concentrated titration solutions are used for the determination of low nitrogen amounts. For the determination of low nitrogen contents it is advantageous to have smaller blank values, because the difference in titration volumes between the blanks and the samples gets larger. 3. The ph change caused by the distilled nitrogen is more important the lower the concentration of the receiving solution is. Small amounts of nitrogen cause a considerable increase in ph, thus making the titration more accurate. Figure 3: Liquid junction with stirring The stirring effect can be minimized by adding potassium chloride to low concentrated (< 4%) to ensure that a sufficient amount of potassium chloride is always at the surface of the liquid junction. The use of diluted is beneficial for the determination of low nitrogen amounts for the following three main reasons: Detection limit and quantification limit The so-called detection limit (limit of detection LOD) and quantification limit (limit of quantification LOQ) are important characteristics of analytical methods. They have to be determined for each method, analyte, and matrix. The DIN standard defines the two terms and describes the procedure used to calculate these values based on analytical results [5]. In this best@buchi, the definitions of the aforementioned standard are used (the terminology used in other standards may be slightly different). Definitions Detection limit: The smallest content of the analyte that is significantly different from the blank value. Quantification limit: The smallest content of the analyte that can be determined quantitatively. In general, the quantification limit is three times higher than the detection limit [5]. There are two ways to calculate these limits. The results achieved from these two methods are not equal but are equivalent: 3
4 Direct method ( Blank method ) With the determination of a large number of blanks (n 10), the detection and quantification limit can be calculated based on the standard deviations of the blank measurements and the slope of the calibration line. For Kjeldahl the slope would be the linearity between the nitrogen content and the consumption of the titration solution. The calibration line of the entire working range is used. This method can only be used if a suitable blank is available. A blank should have identical properties to those of the actual sample, but without any analyte. This is rarely the case, as most analyses are done in complex matrices such as food or environmental samples, which cannot be imitated easily. The calculations of the detection and quantification limits are performed according to equations (3-5). x ( LOD) = Φ n; α Φ sl b 1 m 1 n ; α = t f ; α + n x ( LOQ ) = x ( LOD ) * k (3) (4) (5) k factor used to calculate the x (LOQ) based on x (LOD); the factor is usually k=3 [5]. Indirect method ( Calibration line method ) A calibration line (in the range of the limit of quantification) is established (range 0 to 10 times x LOD). Based on the slope of this line, the detection and quantification limit can be calculated. In this case, the uncertainty of the blank is estimated by extrapolation of the calibration data. This method is more laborious and needs more statistical know-how than the direct method, but is often necessary due to the reasons mentioned above. The calculations are explained in detail in the DIN standard. Several statistical programs can be used to calculate the detection and quantification limit using the indirect method according to DIN In this study, the LOD and LOQ were always calculated according to the direct and the indirect method to be able to compare the findings. For Kjeldahl, the direct method is well suited, because the matrix is completely destroyed by the digestion with sulfuric acid. Experimental Equipment AutoKjeldahl Unit K-370 with Kjeldahl Sampler K-371; Schott Titronic Universal, dosage instrument (Buchi P/N ); Analytical balance, reading precision +/- 0.1 mg; Statist24cp, Version 2.0., statistical program for method validation for analytical laboratories, , Georg Schmitt, Michael Herbold, Arvecon GmbH, Walldorf, Germany. Chemicals Ammonium dihydrogen phosphate % (Merck, ), dried; boric acid (Brenntag, ); potassium chloride (Merck, ); 0.05 M hydrochloric acid (Riedel de Haën, 35320), the titration solutions were prepared by diluting this standard solution. Samples Solutions of ammonium dihydrogen phosphate were diluted to obtain an absolute nitrogen amount per sample between mg and 0.5 mg. Each sample was determined in triplicate. The solution was dosed into the Kjeldahl flasks using the Titronic Universal dosage instrument. x (LOD) x (LOQ) Φ n,α s L b t f;α n m detection limit quantification limit factor, depending on number of blank measurements (n), sample replicates (m), and significance level (α) standard deviation of blank measurements slope of the calibration line; for Kjeldahl the relation between titration solution consumption and the nitrogen content (example: ml of M HCl corresponds to 1 mg nitrogen, b= 14.28). quantile of the Student t-distribution, depending on degree of freedom f (f = n-1) and significance level α number of blank measurements number of sample replicates The determination was carried out with the AutoKjeldahl unit K-370 with Kjeldahl Sampler K-371 using the parameters given in Table 1. Table 1: Parameters for the Kjeldahl sampler system K-370/K-371 Distillation Titration Water 50 ml Type Boric acid NaOH 90 ml Titration solution HCl M Reaction time 5 s Volume receiving sol. 60 ml Distillation time 240 s Titration mode Standard Steam power 100 % End-point ph 4.65 Algorithm 1 4
5 The experiment was set up in the following way: 1) optimization of the concentration 2) optimization of the KCl addition and finally 3) optimization of the titrant concentration. Impact of concentration Boric acid solutions of 4 %, 2 %, and 1 % and pure water (0 % ) were compared. The ph of the was adjusted to To compare the impact of the concentration of boric acid, 10 blanks and a sample series of 5 samples with different nitrogen contents were analyzed. Impact of KCl addition Different amounts of potassium chloride were added to 2 %. The final concentrations of KCl in the boric acid were 0.01 M, 0.02 M, 0.04 M, 0.06 M, and 0.1 M. A concentration of 0.01 M corresponds to the addition of 0.75 g / liter. The ph of the was adjusted to Impact of the titration solution The following concentrations were used to investigate the impact of the titration solution on the detection and quantification limits: M HCl, M HCl, 0.01 M HCl, and 0.05 M HCl. The analyses were carried out using 2 % with 0.04 M KCl. Calculations All calculations of the detection and quantification limits according to the direct method (blank method) were performed using the equations (3-5). The calculations according to the indirect method (calibration method) were carried out using the statistical program Statist24cp. For both cases, a significance level of 99 % was used. Results and Discussion Impact of concentration of In Table 2, the mean values of the blanks and their relative standard deviation (rsd) are given using different concentrations of. The results in Table 2 show that the higher the concentration, the higher the blank value. As shown in Figure 4, the ph increase due to the dilution of the by the distillate becomes more important the higher the concentration. Therefore, more titration solvent is needed to get back to the endpoint ph of The relative standard deviations are higher the lower the concentration. Table 2: Mean values of blank analyses with different concentrations (titration solution M HCl, n=10) 4 % 2 % 1 % 0 % mean value [ml] sd rsd [%] In Figure 5, the mean values of the recoveries of the sample series with different concentrations are shown. 130 Mean values of nitrogen recovery Recovery [%] % 2 % 1 % 0 % 0.01 mg N 0.05 mg N 0.1 mg N 0.2 mg N 0.5 mg N Figure 5: Mean values (n=3, except for 0.2 mg in 4 %, n=1) of nitrogen recovery in samples with their standard deviation when using 0 % - 4 % as receiving solution 5
6 In Table 3 and Figure 6, the detection and quantification limits calculated based on the data of the blank analyses and the sample series according to both methods proposed by DIN are shown. Table 3: Detection limit and quantification limit calculated using the direct and indirect method. Direct method (blank method) 1 4 % 2 % 1 % 0 % Detection limit [mg N] Quantification limit [mg N] Indirect method (calibration method) 4 % 2 % 1 % Detection limit and quantification limit 0 % Detection limit [mg N] Quantification limit [mg N] A factor Φ n,α of 3.5 was used, which is valid for 4 blanks and a triplicate determination of the samples, which are typical conditions of Kjeldahl determination; for duplicate determination of the samples, the factor Φ n,α would be Nitrogen [mg] xlod (direct) xloq (direct) xlod (indirect) xloq (indirect) % 2 % 1 % 0 % Figure 6: Calculated detection and quantification limits according to the direct and indirect method based on the data of the sample series using 0 % - 4 % as receiving solution Taking into account the blank values presented in Table 2, the mean values of the recovery rates (Figure 5), and the calculated detection and quantification limits (Table 3 and Figure 6), it is evident that the best results are obtained by using 2 %. The blank value around 1 ml is in a good range, as well as its relative standard deviation of approx. 3 %. The recovery rates and their standard deviations are better than those obtained with the other concentrations of. The calculated detection and quantification limits are lowest, but comparable to the ones with 1 %. The subsequent analyses were therefore carried out using 2 %. 6
7 Impact of KCl addition The measured ph shift caused by the stirring effect (using different concentrations of KCl in 2 % ) is presented in Table 4. Table. 4: ph shift caused by stirring using different KCl concentrations in 2 %, with and without dilution by distillate not stirred stirred Δ ph No KCl M KCl M KCl M KCl M KCl M KCl M KCl No KCl ml H 2O M KCl ml H 2O M KCl ml H 2O M KCl ml H 2O As predicted by theory (see chapter Theoretical background of ph measurements and titration ), the addition of potassium chloride (KCl) minimizes the stirring effect. In 2 %, a concentration of 0.03 M KCl is sufficient to decrease the ph shift to If the is diluted with 150 ml water, which corresponds to the approx. amount of distillate after 4 min distillation time, 0.06 M KCl is needed to minimize the stirring effect. The amount of added KCl also influences the titration speed and the blank values (see Tables 5 and 6). Table 5: Titration time of a blank value, 2 % with different concentrations of KCl Titration time No KCl 105 s 0.02 M 52 s 0.06 M 62 s 0.1 M 59 s Table 6: Mean values of blanks (n=10) in 2 % with different concentrations of KCl. No KCl 0.01 M 0.02 M 0.04 M 0.06 M 0.1 M mean value s rsd The more KCl is added to the, the higher the blank values. This phenomenon is related solely to the stirring effect. If no KCl is added, the measured ph of the at the end of the distillation and start of titration is approx instead of 5.34 (0.04 M KCl, see Table 4). In this case, less titration solution is needed to reach the endpoint of Although the blank values are higher with larger amounts of added KCl, the titration is faster due to a more stable ph measurement (see Table 5). For the determination of low nitrogen contents it is advantageous to have smaller blank values, because the difference in titration volumes between the blanks and the samples becomes more important. The ideal concentration of KCl in the is a compromise between the desirable (stable ph measurement) and the undesirable (increase of blank value). 7
8 Figure 7 shows the mean values of the recoveries of nitrogen in the sample series. 160 Mean values of nitrogen recovery Recovery [%] mg N 0.05 mg N 0.1 mg N 0.2 mg N 0.5 mg N 20 0 no KCl 0.01 M KCl 0.02 M KCl 0.04 M KCl 0.06 M KCl 0.1 M KCl Figure 7: Mean values of samples (n=3) with their standard deviation when using M KCl in 2 % as receiving solution The best results are obtained using M KCl in 2 %. Based on the data of the blank analyses and sample series, the detection limit and the quantification limit were calculated (see Table 7 and Figure 8). Table 7: Detection limit and quantification limit calculated according to the direct and indirect method using with different KCl concentrations Direct method (blank method) No KCl 0.01 M 0.02 M 0.04 M 0.06 M 0.1 M Detection limit [mg N] Quantification limit [mg N] Indirect method (calibration method) No KCl 0.01 M 0.02 M 0.04 M 0.06 M 0.1 M Detection limit [mg N] Quantification limit [mg N]
9 0.100 Detection limit and quantification limit Nitrogen [mg] xlod (direct) xloq (direct) xlod (indirect) xloq (indirect) no KCl 0.01 M KCl 0.02 M KCl 0.04 M KCl 0.06 M KCl 0.1 M KCl Figure 8: Calculated detection and quantification limits according to the direct and indirect method using 0 M M KCl in 2 % as receiving solution Taking into account the blank values presented in Table 6, the mean values of the recovery rates (Figure 7), the minimized ph shift (Table 4), the titration time (Table 5), and the calculated detection and quantification limits (Table 7 and Figure 8), it is clear that the best results are obtained by using 0.04 M KCl in 2 %. Although the detection and quantification limits are slightly lower with 0.02 M KCl and the blank values are comparable, the mean values of the recoveries as well as the ph shift are more promising with 0.04 M KCl. The subsequent analyses were therefore carried out with 2 %, with a concentration of 0.04 M KCl. To determine the exact detection and quantification limits according to the indirect method, the highest value in the calibration line shall not exceed ten times the detection limit. If the value turns out to exceed this limit afterwards, a new calibration line needs to be established [5]. In the data shown in Table 7, the limit of detection is mg and mg, respectively. Therefore, the highest value in the calibration line should not exceed 0.06 mg. Consequently, new calibration lines needed to be established with lower nitrogen concentrations. The final calibration line is presented in Figure 9, the corresponding detection and quantification limits in Table 8. 9
10 Calibration line 0.03 Determined nitrogen content [mg] Nitrogen content [mg] Figure 9: Calibration line with concentrations between and mg nitrogen. The mean values of triplicate determinations and their standard deviations are shown. Table 8: Detection limit and quantification limit calculated according to the direct and indirect method using the data of the final calibration line. Direct method (blank method) Indirect method (calibration method) Detection limit [mg N] Quantification limit [mg N] Based on the calibration line data (calibration method), the detection and quantification limits are approx. half of the values obtained by the blank method. Considering the recoveries and the standard deviations of the measured concentrations of the calibration line, it is obvious that accurate quantifications cannot be performed for concentrations below 0.02 mg. Only at concentrations > mg, the recoveries are around 100 % with rsds lower than 5 %. In this case, the direct method gave more realistic detection and quantification limits. Impact of the titration solution In Table 9, the mean values of the blanks and their relative standard deviation (rsd) are given. Figure 10 shows the recovery rates of the sample series using different concentrations of titration solution. Table 9: Mean values of blank analyses with different titration solutions (n=10) 0.05 M HCl 0.01 M HCl M HCl M HCl mean value [ml] sd rsd [%]
11 Mean value of nitrogen recovery Recovery [%] mg N 0.01 mg N 0.15 mg N 0.02 mg N mg N 0.03 mg N M HCl 0.01 M HCl M HCl M HCl Figure 10: Mean values of samples (n=3) with their standard deviation when using M 0.05 M HCl as titration solution The standard deviations are larger when using a higher concentrated titration solution, due the fact that very small differences in titration volume cause large differences in the calculated nitrogen content. The accuracy of the titration consumption using the integrated titrator with a 20 ml burette in the AutoKjeldahl Unit K-370 is limited to three digits (e.g., ml). For concentrations higher than 0.01 M HCl, a higher accuracy would be necessary to obtain satisfying results. The disadvantage of highly diluted titration solutions ( M HCl) is that large volumes are titrated (higher costs per sample) and that the titration volumes of samples with low nitrogen content (0.005 mg N and 0.01 mg N) are within the statistical spread of the high blank values. The most promising titration solutions were 0.01 M and M HCl. With these solutions, more sample series needed to be analyzed to establish a calibration line to calculate the limit of detection and quantification (data not shown). The calculated detection and quantification limits are presented in Table 10. Table 10: Detection limit and quantification limit calculated according to the direct and indirect method using different titration solutions Direct method (blank method) 0.01 M HCl M HCl Detection limit [mg N] Quantification limit [mg N] Indirect method (calibration method) 0.01 M HCl M HCl Detection limit [mg N] Quantification limit [mg N] The detection and quantification limits are in the same order of magnitude as previous values (see Table 7 and Table 8). There is also no significant difference between the 0.01 M HCl and M HCl titration solutions. 11
12 Conclusions The detection limit and the quantification limit are as low as approx mg nitrogen and 0.02 mg nitrogen when 2 % with 3 g of KCl (0.04 M) is used as receiving solution. Titration solutions of M HCl provide good results; however, the detection and quantification limits are not significantly influenced by the choice of the titration solution. The above-mentioned parameters are suitable for low nitrogen concentrations. For nitrogen concentrations usually found in food samples, the standard application using 4 %, without addition of KCl, is recommended. References [1] Kjeldahl Guide, Buchi Labortechnik AG, 2008 [2] ph-messung in der Praxis, Hamilton Bonaduz AG, 2007 [3] Galster, Helmuth. ph-messung Grundlagen, Methoden, Anwendungen, Geräte. VCH Verlagsgesellschaft GmbH, Weinheim, 1990 [4] Handbook of Electrode Technology, Orion Research Incorporated, 1982 [5] DIN 32645: Chemical analysis-decision limit, detection limit and determination limit under repeatability conditions- Terms, methods, evaluation BÜCHI Labortechnik AG CH 9230 Flawil 1 T F buchi@buchi.com BÜCHI Labortechnik GmbH D Essen Freecall T F deutschland@buchi.com BUCHI Sarl F Rungis Cedex T F france@buchi.com BUCHI UK Ltd. GB Oldham OL9 9QL T F uk@buchi.com BÜCHI Labortechnik GmbH NL 3342 GT Hendrik-Ido-Ambacht T F netherlands@buchi.com BÜCHI Italia s.r.l. I Assago (MI) T F italia@buchi.com BUCHI Hong Kong Ltd. HK Central T F china@buchi.com BUCHI Shanghai RC Shanghai T F china@buchi.com BUCHI (Thailand) Ltd. T Bangkok T F bacc@buchi.com Nihon BUCHI K.K. J Tokyo T F nihon@buchi.com BUCHI India Private Ltd. IND Mumbai T / 84 / 85 F india@buchi.com BUCHI Canada Ltd. CDN Thornhill, Ontario L4J 6Z 2 T F canada@buchi.com BUCHI Corporation USA New Castle, Delaware Toll Free: T F us-sales@buchi.com en 1008 / Technical data are subject to change without notice/ Quality Systems ISO 9001 The English version is the original language version and serves as basis for all translations into other languages. We are represented by more than 100 distribution partners worldwide. Find your local representative at 12
@buchi Information Bulletin Number
 best @buchi www.buchi.com Information Bulletin Number 51 2008 Trace Analysis of PAHs using EPA methods 351, 355 and 80 en best@buchi 51/ 2008 en Trace Analysis of PAHs: Evaluation of two Extraction Methods
1. Introduction. 2. Equipment. 3. Chemicals and Materials
 1. Introduction Nitrogen and protein determination in food and feed are described in numerous standard procedures [1-3]. Therein, the titration specifications vary between boric acid and back titration.
Applications of NIR Spectroscopy for Fast Quantitative Analysis in the Explosives Industry. : Nitrochemie Wimmis AG, 3752 Wimmis, Switzerland
 best@buchi No. 66 Applications of NIR Spectroscopy for Fast Quantitative Analysis in the Explosives Industry Authors: Beat Vogelsanger 1, Marc Müller 1 and Eszter Trenka 2 1 : Nitrochemie Wimmis AG, 3752
SpeedDigester K-436, K-439 / KjelFlex K-360 Nitrogen Determination in Pharmaceuticals according to the Kjeldahl Method (semi-micro)
") 045/2010 SpeedDigester K-436, K-439 / KjelFlex K-360 Nitrogen Determination in Pharmaceuticals according to the Kjeldahl Method (semi-micro) 045/2010 SpeedDigester K-436 / K-439 KjelFlex K-360 SHORT NOTE
045/2010 SpeedDigester K-436, K-439 / KjelFlex K-360 Nitrogen Determination in Pharmaceuticals according to the Kjeldahl Method (semi-micro) 045/2010 SpeedDigester K-436 / K-439 KjelFlex K-360 SHORT NOTE
SpeedDigester K-436, K-439 / KjelFlex K-360 Nitrogen Determination in Nitrate-Free Fertilizer according to the micro-kjeldahl Method 074/2011
 SpeedDigester K-436, K-439 / KjelFlex K-360 Nitrogen Determination in Nitrate-Free Fertilizer according to the micro-kjeldahl Method 074/2011 074/2011 SpeedDigester K-436 / K-439 KjelFlex K-360 SHORT NOTE
Application Note No. 116 / 2013 Nitrogen determination in sodium nitrate
 Application Note No. 116 / 2013 Nitrogen determination in sodium nitrate KjelMaster K-375: Determination of nitrogen in sodium nitrate according the the Devarda method 1. Introduction An easy, quick and
Application Note No. 191/2015 TKN determination in water and waste water
 Application Note No. 191/2015 TKN determination in water and waste water KjelDigester K-449, KjelMaster K-375 with KjelSampler K-376: Colorimetric determination of TKN (Total Kjeldahl Nitrogen) in water
Application Note No. 310/2018
 Application Note No. 310/2018 Nitrogen determination in compound fertilizer according to Devarda KjelFlex K-360 with Devarda Splash Protector, Metrohm Titrino 877 www.buchi.com Quality in your hands 1.
Application Note No. 117 / 2013 Ammonia determination in hair dye
 Application Note No. 117 / 2013 Ammonia determination in hair dye KjelMaster K-375 with KjelSampler K-376: Ammonia determination in hair dye with direct distillation 1. Introduction An easy and reliable
Application Note No. 230/2016
 Application Note No. 230/2016 Nitrogen determination in bovine serum albumin KjelDigester K-436, KjelFlex K-360: Comparison of standard-kjeldahl and micro-kjeldahl for nitrogen determination in pharmaceutical
Kjeldahl Method. Quantiative analysis
 e-learning for Quantiative analysis Kjeldahl Method Introduction Nitrogen is one of the five major elements found in organic materials such as protein. This fact was recognized by a Danish chemist, Johan
Analysis of cations and anions by Ion- Selective Electrodes (ISEs)
") Analysis of cations and anions by Ion- Selective Electrodes (ISEs) Purpose: The purpose of this assignment is to introduce potentiometric measurements of ionic species by ion selective electrodes (ISEs)
Analysis of cations and anions by Ion- Selective Electrodes (ISEs) Purpose: The purpose of this assignment is to introduce potentiometric measurements of ionic species by ion selective electrodes (ISEs)
Applications of Ion-Selective Electrodes
 Applications of Ion-Selective Electrodes Analyte Ammonia Carbon dioxide Chloride Chlorine residual Cyanide Fluoride Nitrate Nitrogen oxide/nitrite Oxygen, dissloved Sulfide Electrode type Gas sensing Gas
Application Note No. 197/2015 Nitrogen and protein determination in dairy products Nitrogen determination in sodium nitrate
 Application Note No. 197/2015 Nitrogen and protein determination in dairy products Nitrogen determination in sodium nitrate KjelDigester K-449, KjelMaster K-375 with KjelSampler K-376: Accelerated Nitrogen
Chemistry 301 Test #1
 Name: KEY Pledge: I have neither given nor received aid on this test Chemistry 301 Test #1 Point Total: 100 pts possible 8 pts 1. In 2-4 sentences, explain the fundamental basis of quantitative analysis
Electro Analytical Methods
 CH 2252 Instrumental Methods of Analysis Unit II Electro Analytical Methods Dr. M. Subramanian Associate Professor Department of Chemical Engineering Sri Sivasubramaniya Nadar College of Engineering Kalavakkam
Electrochemistry LEC Potentiometric ph titration (phosphoric acid in a soft drink) What you need: What you can learn about
 What you need: What you can learn about") Electrochemistry LEC 06 What you can learn about Galvanic cell Types of electrodes Nernst equation Potentiometry Principle and tasks The cell voltage and the Galvani voltage of the electrodes of an galvanic
Electrochemistry LEC 06 What you can learn about Galvanic cell Types of electrodes Nernst equation Potentiometry Principle and tasks The cell voltage and the Galvani voltage of the electrodes of an galvanic
Automatic determination of the bromine number and the bromine index in petroleum products
 Application Bulletin 177/5 e Automatic determination of the bromine number and the bromine Branch General analytical chemistry; organic chemistry; petrochemistry, biofuels; trace analysis; paints, lacquers,
Method for analysis of hygienic standard of
 GB/T 5009.39-2003 Translated English of Chinese Standard: GB/T5009.39-2003 Translated by: www.chinesestandard.net Wayne Zheng et al. Email: Sales@ChineseStandard.net ICS 67.040 C 53 NATIONAL STANDARD OF
Measurement uncertainty: Top down or Bottom up?
 A White Paper from FOSS Measurement uncertainty: Top down or Bottom up? By Dr. Jürgen Möller P/N 1026582, Issue 1, October 2011 Dedicated Analytical Solutions Measurement uncertainty: Top down or Bottom
METHOD 9210 POTENTIOMETRIC DETERMINATION OF NITRATE IN AQUEOUS SAMPLES WITH ION-SELECTIVE ELECTRODE
 METHOD 9210 POTENTIOMETRIC DETERMINATION OF NITRATE IN AQUEOUS SAMPLES WITH ION-SELECTIVE ELECTRODE 1.0 SCOPE AND APPLICATION 1.1 This method can be used for measuring total solubilized nitrate in drinking
Impact factor: 3.958/ICV: 4.10 ISSN:
 Impact factor: 3.958/ICV: 4.10 ISSN: 0976-7908 99 Pharma Science Monitor 9(4), Oct-Dec 2018 PHARMA SCIENCE MONITOR AN INTERNATIONAL JOURNAL OF PHARMACEUTICAL SCIENCES Journal home page: http://www.pharmasm.com
-However, this definition can be expanded to include: biology (biometrics), environmental science (environmetrics), economics (econometrics).
, environmental science (environmetrics), economics (econometrics).") Chemometrics Application of mathematical, statistical, graphical or symbolic methods to maximize chemical information. -However, this definition can be expanded to include: biology (biometrics), environmental
Chemometrics Application of mathematical, statistical, graphical or symbolic methods to maximize chemical information. -However, this definition can be expanded to include: biology (biometrics), environmental
Annex 2 Formaldehyde
 Annex 2 Formaldehyde The 2 methods are analytical procedures for the determination of formaldehyde CH2O, PM/Ref. No 17260, and hexamethylenetetramine (HMTA) C6H12N4, PM/Ref. No 18670, in food simulants
Partner: Alisa 1 March Preparation and Properties of Buffer Solutions
 Partner: Alisa 1 March 2012 Preparation and Properties of Buffer Solutions Purpose: The purpose of this experiment is to compare the ph effect on buffered and non-buffered solutions as well as making a
SpeedDigester K-436, K-439 Determination of Hydroxyproline in Meat after Acid Hydrolyzation (Photometric method)
") 053/2010 SpeedDigester K-436, K-439 Determination of Hydroxyproline in Meat after Acid Hydrolyzation (Photometric method) 053/2010 SpeedDigester K-436 / K-439 SHORT NOTE Determination of Hydroxyproline
053/2010 SpeedDigester K-436, K-439 Determination of Hydroxyproline in Meat after Acid Hydrolyzation (Photometric method) 053/2010 SpeedDigester K-436 / K-439 SHORT NOTE Determination of Hydroxyproline
Application Note No. 072/2012
 Application Note No. 07/01 Total SO in Wine Distillation Unit K-355: Interlaboratory Test for the Determination of Total SO in Wine 1. Introduction An interlaboratory test was carried out involving four
PRACTICAL 3 ph AND BUFFERS
 PRACTICAL 3 ph AND BUFFERS ph and Buffers Structure 3.1 Introduction 3.2 ph and Buffers: Basic Concept 3.2.1 ph 3.2.2 Buffers and Buffer Solutions 3.3 Methods for Determining ph Experiment 1: Measurement
Titration of a strong acid with a strong base with Cobra4
 Titration of a strong acid with a strong base with Cobra4 TEC Related topics Strong and weak acids and bases, ph value, titration curves, equivalence point, potentiometry. Principle Hydrochloric acid is
Kjeltec 2300 Analyzer Unit
 Kjeltec 2300 Analyzer Unit Automatic distillation and approved colorimetric titration for analysis of Kjeldahl nitrogen/protein, ammonium- nitrogen, TKN, Direct distillation (DD), volatile acids/ bases
HOW TO MEASURE ALKALINITY IN WATER SAMPLES SOME PRACTICAL INFORMATION
 HOW TO MEASURE ALKALINITY IN WATER SAMPLES SOME PRACTICAL INFORMATION Analysis of Total Alkalinity with Mettler Toledo T50 Excellence titrator - measurement settings and procedure Zuzanna Cieśla Anna Kowalska
General Chemistry 1 CHM201 Unit 2 Practice Test
 General Chemistry 1 CHM201 Unit 2 Practice Test 1. Which statement about the combustion of propane (C 3H 8) is not correct? C 3H 8 5O 2 3CO 2 4H 2O a. For every propane molecule consumed, three molecules
Unit 15 Solutions and Molarity
 Unit 15 s and Molarity INTRODUCTION In addition to chemical equations chemists and chemistry students encounter homogeneous mixtures or solutions quite frequently. s are the practical means to deliver
Rapid Screening and Confirmation of Melamine Residues in Milk and Its Products by Liquid Chromatography Tandem Mass Spectrometry
 Rapid Screening and Confirmation of Melamine Residues in Milk and Its Products by Liquid Chromatography Tandem Mass Spectrometry Application Note Food Authors Jianqiu Mi, Zhengxiang Zhang, Zhixu Zhang,
Chapter 4: Verification of compendial methods
 Chapter 4: Verification of compendial methods Introduction In order to ensure accurate and reliable test results, the quality control laboratory (QCL) needs to use analytical methods (and accompanying
Application Determination of isocyanate (NCO-) content
 content") Determination of isocyanate (NCO-) content date: 20.06.2013 page 1 from 10 Use This method is applicable for material containing reactive isocyanate groups.the isocyanate is reacted with di-n-butyl amine
Determination of isocyanate (NCO-) content date: 20.06.2013 page 1 from 10 Use This method is applicable for material containing reactive isocyanate groups.the isocyanate is reacted with di-n-butyl amine
CH2MHILL GILROY/MORGAN HILL LABORATORY LABORATORY STANDARD OPERATING PROCEDURE NO TOTAL KJELDAHL NITROGEN - TKN SM 4500-N org.
 CH2MHILL GILROY/MORGAN HILL LABORATORY LABORATORY STANDARD OPERATING PROCEDURE NO. 709 TOTAL KJELDAHL NITROGEN - TKN SM 4500-N org. B I. SCOPE AND APPLICATIONS A. The kjeldahl method determines nitrogen
Ions in Solution. Solvent and Solute
 Adapted from Peer-led Team Learning Begin at the beginning and go on till you come to the end: then stop." Early ideas of atoms and compounds, developed primarily through the reactions of solids and gases,
NH 3 -selective electrodes
 NH 3 -selective electrodes Manual 8.109.8031EN Metrohm AG CH-9100 Herisau Switzerland Phone +41 71 353 85 85 Fax +41 71 353 89 01 info@metrohm.com www.metrohm.com NH 3 -selective electrodes Manual 8.109.8031EN
Calculation of uncertainty in titrimetry Ivan Špánik
 Calculation of uncertainty in titrimetry Ivan Špánik Problem A solution of hydrochloric acid (HCl) is standardised against a solution of sodium hydroxide (NaOH). The NaOH is titrated against the titrimetric
National Research Council Institute for Ecosystem Study Verbania Pallanza - Italy
 Tot-N UV220 pag. 1 National Research Council Institute for Ecosystem Study Verbania Pallanza - Italy Water Chemistry Laboratory Analytical Methods for internal use - http://www.idrolab.ise.cnr.it Gabriele
CHAPTER V ANALYTICAL METHODS ESTIMATION OF DICLOFENAC. Diclofenac (gift sample from M/s Micro Labs Ltd., Pondicherry)
") CHAPTER V ANALYTICAL METHODS ESTIMATION OF DICLOFENAC A UV spectrophotometric method based on the measurement of absorbance at 276nm in phosphate buffer of p H 7.4 was used in the present study of the
CHAPTER V ANALYTICAL METHODS ESTIMATION OF DICLOFENAC A UV spectrophotometric method based on the measurement of absorbance at 276nm in phosphate buffer of p H 7.4 was used in the present study of the
National standard of People s Republic of China
 National standard of People s Republic of China GB 5413.22 2010 National food safety standard Determination of phosphorus in foods for infants and young children, milk and milk products Issued on 2010-03-26
Unit 3 Chemistry - Volumetric Analysis
 Unit 3 Chemistry Volumetric Analysis Volumetric analysis is a quantitative chemical analysis used to determine the unknown concentration of one reactant [the analyte] by measuring the volume of another
READING A. INTRODUCTION CHE425L POTENTIOMETRY WITH K + ION-SELECTIVE ELECTRODE. Skoog, Holler and Crouch: Chapter 23 and Appendix 3.
 CHE425L POTENTIOMETRY WITH K + ION-SELECTIVE ELECTRODE READING Skoog, Holler and Crouch: Chapter 23 and Appendix 3. A. INTRODUCTION Potentiometry is a static electroanalytical method in which the potential
c. K 2 CO 3 d. (NH 4 ) 2 SO 4 Answer c
 2 SO 4 Answer c") Chem 130 Name Exam 2, Ch 4-6 July 7, 2016 100 Points Please follow the instructions for each section of the exam. Show your work on all mathematical problems. Provide answers with the correct units and
Chem 130 Name Exam 2, Ch 4-6 July 7, 2016 100 Points Please follow the instructions for each section of the exam. Show your work on all mathematical problems. Provide answers with the correct units and
Nitrogen Determination by Kjeldahl (Block Digestion(
 National Forage Testing Association -Forage Analysis Procedures Nitrogen Determination by Kjeldahl (Block Digestion( Scope : This method is applicable for the determination of nitrogen (N) in all types
7. Stability indicating analytical method development and validation of Ramipril and Amlodipine in capsule dosage form by HPLC.
 7. Stability indicating analytical method development and validation of and in capsule dosage form by HPLC. 7.1 INSTRUMENTS AND MATERIALS USED 7.1.1 INSTRUMENTS 1. Shimadzu LC-2010 CHT with liquid chromatograph
2. Which of these solutions is the least acidic? a) [H 3 O + ] = 4x10⁻⁴ M b) [H 3 O + ] = 0.04 M c) ph = 0.04 d) ph = 0.40 e) ph = 4.
![2. Which of these solutions is the least acidic? a) [H 3 O + ] = 4x10⁻⁴ M b) [H 3 O + ] = 0.04 M c) ph = 0.04 d) ph = 0.40 e) ph = 4.](/thumbs/88/116172237.jpg "2. Which of these solutions is the least acidic? a) [H 3 O + ] = 4x10⁻⁴ M b) [H 3 O + ] = 0.04 M c) ph = 0.04 d) ph = 0.40 e) ph = 4.") Chem 112, Test 2 -- February 13, 2004 -- page 1 START TIME END TIME Name You are allowed 2 consecutive hours (no cutting classes) for this test. You may use your calculator but NO extra scratch paper.
Chem 112, Test 2 -- February 13, 2004 -- page 1 START TIME END TIME Name You are allowed 2 consecutive hours (no cutting classes) for this test. You may use your calculator but NO extra scratch paper.
Thermo Scientific Orion Fluoride Ion Selective Electrodes The standard in fluoride ion analysis EPA compliant
 Thermo Scientific Orion Fluoride Ion Selective Electrodes The standard in fluoride ion analysis EPA compliant Approved ASTM Method for Fluoride in Drinking Water and Wastewater Analyze free fluoride ions
Chapter 2. Materials and Methods
 Chapter 2 Materials and Methods 2. Materials and Methods This chapter describes the chemicals, reagents and instruments used for carrying out this study. A brief discussion of the methods used for the
Coal - Determination of nitrogen - Semi-micro Kjeldahl method. Kol - Bestämning av kvävehalt - Semimicrometod enligt Kjeldahl
 Coal - Determination of nitrogen - Semi-micro Kjeldahl method Kol - Bestämning av kvävehalt - Semimicrometod enligt Kjeldahl The International Standard ISO 333:1996 has the status of a Swedish Standard.
National standard of People s Republic of China
 National standard of People s Republic of China GB5413.24-2010 Determination of chlorine in foods for infants and young children, raw milk and dairy products Issued at 2010-03-2 Implemented at:2010-06-01
Chem 321 Lecture 17 - Potentiometry 10/24/13
 Student Learning Objectives Chem 321 Lecture 17 - Potentiometry 10/24/13 Electrodes The cell described in the potentiometric chloride titration (see 10/22/13 posting) consists of a Ag/AgCl reference electrode
VALIDATION OF AN ALTERNATIVE METHOD FOR TOTAL NITROGEN ANALYSIS IN WATER SAMPLES
 STUDIA UBB CHEMIA, LXII, 1, 2017 (p. 101-110) (RECOMMENDED CITATION) DOI:10.24193/subbchem.2017.1.08 VALIDATION OF AN ALTERNATIVE METHOD FOR TOTAL NITROGEN ANALYSIS IN WATER SAMPLES ADRIANA MUNTEAN a,
UDK. Distillation Units Series. A Full Range of Solutions for Kjeldahl Distillation LABSOLUTIONS
 LABSOLUTIONS UDK Distillation Units Series A Full Range of Solutions for Kjeldahl Distillation ABCD The distillation unit is used to perform nitrogen and protein content analysis according to the Kjeldahl
#13 Electrochemical Cells
 #13 Electrochemical Cells If a copper strip is placed in a solution of copper ions, one of the following reactions may occur: Cu 2+ + 2e - Cu Cu Cu 2+ + 2e - The electrical potential that would be developed
Unit 4a: Solution Stoichiometry Last revised: October 19, 2011 If you are not part of the solution you are the precipitate.
 1 Unit 4a: Solution Stoichiometry Last revised: October 19, 2011 If you are not part of the solution you are the precipitate. You should be able to: Vocabulary of water solubility Differentiate between
Chem II - Wed, 9/14/16
 Chem II - Wed, 9/14/16 Do Now Drop off any study guides you want color coded Pull out stoich HW Homework See board Agenda Stoich Ch 4 Labish thing Chapter 4 Chemical Reactions & Solution Stoich Water Possesses
Development and Validation of Stability Indicating Assay Method of Etodolac by using UV-Visible Spectrophotometer
 Research Article Development and Validation of Stability Indicating Assay Method of Etodolac by using UV-Visible Spectrophotometer Aniruddha J Palande, Shailaja B Jadhav *, Amit S Tapkir, Pravin D Chaudhari,
INTERNATIONAL OLIVE COUNCIL
 INTERNATIONAL OLIVE COUNCIL COI/T.20/Doc. No 35/Rev.1 2017 ENGLISH Original: ENGLISH Príncipe de Vergara, 154 28002 Madrid España Telef.: +34 915 903 638 Fax: +34 915 631 263 - e-mail: iooc@internationaloliveoil.org
Acid-Base ph Titration Introduction
 Electronic Supplementary Material (ESI) for Chemistry Education Research and Practice. This journal is The Royal Society of Chemistry 2016 Appendix B: Example of Traditional Investigation Acid-Base ph
Combination ph, ORP, T Electrode with Transmitter
 Combination ph, ORP, T Electrode with Transmitter Technical Information and Manual 2014 Osorno Enterprises Inc. The content of this manual is protected by copyright. All rights reserved. OCS/1406 Combination
STUDYING CHEMICAL REACTIONS BY TITRATION ANALYSIS
 STUDYING CHEMICAL REACTIONS BY TITRATION ANALYSIS OBJECTIVES: Study the relationship of reactants & products in solution phase chemical reactions, Learn how to prepare solutions from solid and liquid stock,
Chemistry Calibration of a Pipet and Acid Titration
 Chemistry 3200 Today you are given a chance to brush up on some of the techniques that you will be using during the remainder of the semester. Lab grades will be based on obtaining the correct answer in
A Simple, Sensitive Spectrophotometric Determination of Mosapride in Pharmaceutical Preparations Using Novel Reagent
 ISS: 0973-4945; CODE ECJHAO E- Chemistry http://www.e-journal.net Vol. 1, o. 5, pp 267-271, October 2004 A Simple, Sensitive Spectrophotometric Determination of Mosapride in Pharmaceutical Preparations
CALCULATIONS INVOLVING STRONG ACIDS & BASES. Write the ionization equation (strong acid) or dissociation equation (strong base)
 or dissociation equation (strong base)") 1 CALCULATIONS INVOLVING STRONG ACIDS & BASES 1. Finding H 3 O + (aq) ) from strong acid concentrations and OH - (aq) from strong base concentrations 2. Finding H 3 O + (aq) and OH - (aq) using K w. 3.
1 CALCULATIONS INVOLVING STRONG ACIDS & BASES 1. Finding H 3 O + (aq) ) from strong acid concentrations and OH - (aq) from strong base concentrations 2. Finding H 3 O + (aq) and OH - (aq) using K w. 3.
EXPERIMENT 8 POTENTIOMETRY: DIRECT-MEASUREMENT OPTION
 EXPERIMENT 8 POTENTIOMETRY: DIRECT-MEASUREMENT OPTION I. INTRODUCTION This experiment introduces the direct-measurement approach to potentiometry. Principal purposes of the study are a) to understand quantitative
Simultaneous analysis of the major metal cations and ammonium by CZE
 Simultaneous analysis of the major metal cations and ammonium by CZE This method has been published. You can download a copy of the PDF. Cite this method as: Warren CR, Adams MA (2004) Capillary electrophoresis
Write the ionic equation for this neutralisation reaction. Include state symbols.
 Q1.Sodium hydroxide neutralises sulfuric acid. The equation for the reaction is: 2NaOH + H 2 SO 4 Na 2 SO 4 + 2H 2 O (a) Sulfuric acid is a strong acid. What is meant by a strong acid? (b) Write the ionic
STABILITY INDICATING METHOD OF RELATED IMPURITIES IN VENLAFAXINE HYDROCHLORIDE SUSTAINED RELEASE TABLETS
 Issn No: 976-39 RESEARCH ARTICLE STABILITY INDICATING METHOD OF RELATED IMPURITIES IN VENLAFAXINE HYDROCHLORIDE SUSTAINED RELEASE TABLETS CHETLAPALLI SATYA SRINIVAS 1, P.RENUKA DEVI 2 and GAMPA VIJAYAKUMAR*
TIME 1 hour 30 minutes, plus your additional time allowance.
 Centre Number 71 Candidate Number ADVANCED SUBSIDIARY (AS) General Certificate of Education 2012 Chemistry Assessment Unit AS 1 assessing Basic Concepts in Physical and Inorganic Chemistry [AC112] WEDNESDAY
Chapter 3 Electrochemical methods of Analysis-Potentiometry
 Chapter 3 Electrochemical methods of Analysis-Potentiometry Electroanalytical chemistry Contents Introduction Galvanic and electrolytic cells Salt bridge Electrode potential and cell potential Indicator
SHOW YOUR WORK. NO WORK, NO CREDIT
 Chemistry 242 Exam 1 Name March 3, 2010! USE PAPER PROVIDED -- ONE SIDE OF PAGE 1. (10 pts) In a Kjeldahl analysis all the nitrogen in a protein sample is converted to NH 3 which is trapped in a standard
Name Date. 9. Which substance shows the least change in solubility (grams of solute) from 0 C to 100 C?
 from 0 C to 100 C?") Solubility Curve Practice Problems Directions: Use the graph to answer the questions below. Assume you will be using 100g of water unless otherwise stated. 1. How many grams of potassium chloride (KCl)
Solubility Curve Practice Problems Directions: Use the graph to answer the questions below. Assume you will be using 100g of water unless otherwise stated. 1. How many grams of potassium chloride (KCl)
LABORATORIUM Z CHEMII FIZYCZNEJ POTENTIOMETRIC MEASUREMENTS OF PH POLITECHNIKA ŚLĄSKA WYDZIAŁ CHEMICZNY. Agata Blacha-Grzechnik.
 POLITCHNIKA ŚLĄSKA WYDZIAŁ CHMICZNY KATDRA IZYKOCHMII I TCHNOLOGII POLIMRÓW POTNTIOMTRIC MASURMNTS O PH Prowadzący: Miejsce ćwiczenia: Agata BlachaGrzechnik Katedra izykochemii i Technologii Polimerów,
Methods for the Determination of Nitrogen Content in Nitrocellulose. Beat Vogelsanger, Marc Müller, Beate Pausch, and Michael Ramin
 Methods for the Determination of Nitrogen Content in Nitrocellulose Beat Vogelsanger, Marc Müller, Beate Pausch, and Michael Ramin Contents Introduction Direct Methods: Ferrous Ion Titration Methods (FS/FAS)
Candidate Name Centre Number Candidate Number. The Language of Chemistry, Structure of Matter and Simple Reactions
 AS CHEMISTRY Specimen Assessment Materials 5 Candidate Name Centre Number Candidate Number AS CHEMISTRY COMPONENT 1 The Language of Chemistry, Structure of Matter and Simple Reactions SPECIMEN PAPER 1
--> Buy True-PDF --> Auto-delivered in 0~10 minutes. GB Translated English of Chinese Standard: GB5009.
 Translated English of Chinese Standard: GB5009.17-2014 www.chinesestandard.net Sales@ChineseStandard.net NATIONAL STANDARD OF GB THE PEOPLE S REPUBLIC OF CHINA National Food Safety Standard-Determination
# 12 ph-titration of Strong Acids with Strong Bases
 # 12 ph-titration of Strong Acids with Strong Bases Purpose: A strong acid solution is titrated with a strong base solution. A titration curve is then used to determine the endpoint and find the concentration
Determination of total hardness of water by complexonometric titration (EDTA)
") Determination of total hardness of water by complexonometric titration (EDTA) SCOPE AND FIELD OF APPLICATION: The present method is used for the determination of total hardness of water in drinking water,
Determination of total hardness of water by complexonometric titration (EDTA) SCOPE AND FIELD OF APPLICATION: The present method is used for the determination of total hardness of water in drinking water,
F- Cl- Br- I- CN- S2- NO3-
 Middle of the 60 s First ISE for fluoride Na+ K+ Ag+ Ca2+ NH + 4 Cu2+ Pb2+ F- Cl- Br- I- CN- S2- NO3- Environment Food industry and agriculture Medecine, pharmaceutical, cosmetics Power plants Fluoride
CHEMFILE MINI-GUIDE TO PROBLEM SOLVING CHAPTER 17. Name Date Class. 1 of 12
 CHAPTER 17 In 1909, Danish biochemist S. P. L Sørensen introduced a system in which acidity was expressed as the negative logarithm of the H concentration. In this way, the acidity of a solution having
A Simple, Novel Validated Stability Indicating RP-HPLC method for estimation of Duloxetine HCl in Capsule Pharmaceutical Formulation
 Pharmaceutical Research A Simple, Novel Validated Stability Indicating RP-HPLC method for estimation of Duloxetine HCl in Capsule Pharmaceutical Formulation Manisha Puranik* a, Sailesh Wadher b and Kritika
Topic 9: Acids & Bases
 Topic 9: Acids & Bases Regents Chemistry Mr. Mancuso Electrolytes Substances that conduct electricity when Include Ability to conduct electricity is due to the presence of Dissociation: ~ 1 ~ Acids and
CHAPTER INTRODUCTION OF DOSAGE FORM AND LITERATURE REVIEW
 75 CHAPTER 3 DEVELOPMENT AND APPLICATION OF STABILITY-INDICATING HPLC METHOD FOR THE DETERMINATION OF NEVIRAPINE AND ITS IMPURITIES IN COMBINATION DRUG PRODUCT 3.1 INTRODUCTION OF DOSAGE FORM AND LITERATURE
Semester 1 Review Chemistry
 Name Period Date Semester 1 Review Chemistry Units & Unit Conversions Ch. 3 (p. 73-94) PART A SI UNITS What type of measurement is indicated by each of the following units? Choices are in the last column.
Ion Selective Electrode Probe
 Rev. 1 Ion Selective Electrode Probe KDS-1064 Calcium KDS-1065 Ammonium KDS-1066 Nitrate KDS-1067 Chloride Type : Ion selective electrode Range : 1 M to 5x10⁻⁷ M(40,000 ~ 0.01 ppm) Sensor description The
Neutral Solutions. Will not change the color of litmus. Colorless in phenolphthalein. - Electron pair donor [OH - ] = 10-7 M MEDIUM
![Neutral Solutions. Will not change the color of litmus. Colorless in phenolphthalein. - Electron pair donor [OH - ] = 10-7 M MEDIUM](/thumbs/83/87097158.jpg "Neutral Solutions. Will not change the color of litmus. Colorless in phenolphthalein. - Electron pair donor [OH - ] = 10-7 M MEDIUM") Lecture Notes for Chapter 16: Acids and Bases I. Acids and Bases a. There are several ways to define acids and bases. Perhaps the easiest way to start is to list some of the properties of acids and bases.
Lecture Notes for Chapter 16: Acids and Bases I. Acids and Bases a. There are several ways to define acids and bases. Perhaps the easiest way to start is to list some of the properties of acids and bases.
Simultaneous Estimation of Residual Solvents (Isopropyl Alcohol and Dichloromethane) in Dosage Form by GC-HS-FID
 in Dosage Form by GC-HS-FID") Asian Journal of Chemistry Vol. 21, No. 3 (2009), 1739-1746 Simultaneous Estimation of Residual Solvents (Isopropyl Alcohol and Dichloromethane) in Dosage Form by GC-HS-FID PRAVEEN KUMAR BALIYAN*, R.P.
Asian Journal of Chemistry Vol. 21, No. 3 (2009), 1739-1746 Simultaneous Estimation of Residual Solvents (Isopropyl Alcohol and Dichloromethane) in Dosage Form by GC-HS-FID PRAVEEN KUMAR BALIYAN*, R.P.
LEAD (Colorimetric) 2. Muffle Furnace: Equipped with pyrometer and capable of operating at controlled temperatures up to 500 C
 2. Muffle Furnace: Equipped with pyrometer and capable of operating at controlled temperatures up to 500 C") LEADX.01-1 LEAD (Colorimetric) PRINCIPLE SCOPE Organic matter in the sample is destroyed by ignition in the presence of sulfuric acid. The residue is dissolved in dilute acid, and the lead is complexed
LEADX.01-1 LEAD (Colorimetric) PRINCIPLE SCOPE Organic matter in the sample is destroyed by ignition in the presence of sulfuric acid. The residue is dissolved in dilute acid, and the lead is complexed
Appendix 1. Analytical Methods
 189 Appendix 1 Analytical s 1. Total nitrogen (AOAC, 2000) Sample preparation Samples (20 ml) were diluted with 180 ml of distilled water Reagents 1. Kjedahl catalyst: Mix 10 part of potassium sulphate
First week Experiment No.1 / /2013. Spectrophotometry. 1. Determination of copper via ammine complex formation using standard series method
 First week Experiment No.1 / /2013 Spectrophotometry 1. Determination of copper via ammine complex formation using standard series method Principal In the standard series method the teat and standard solution
Chapter 4 Chemical Quantities and Aqueous Reactions
 Chapter 4 Chemical Quantities and Aqueous Reactions Reaction Stoichiometry the numerical relationships between chemical amounts in a reaction is called stoichiometry the coefficients in a balanced chemical
Chem 321 Name Answer Key D. Miller
 1. For a reversed-phase chromatography experiment, it is noted that the retention time of an analyte decreases as the percent of acetonitrile (CH 3 CN) increases in a CH 3 CN/H 2 O mobile phase. Explain
Related concepts Electrolyte, electrical conductance, specific conductance, ion mobility, ion conductivity, conductometry, volumetry.
 Conductometric titration with Cobra4 TEC Related concepts Electrolyte, electrical conductance, specific conductance, ion mobility, ion conductivity, conductometry, volumetry. Principle The electric conductivity
1.00 Measurements. Chemistry 251. Dr. Fred Omega Garces
 1.00 SI -Units Mass and Weights The Mole Millimole Solutions and Concentration Analytical Molarity Equilibrium Molarity Composition by Parts % Composition ppm, ppb Density and specific gravity Titration
--> Buy True-PDF --> Auto-delivered in 0~10 minutes. GB Translated English of Chinese Standard: GB5009.
 Translated English of Chinese Standard: www.chinesestandard.net Sales@ChineseStandard.net NATIONAL STANDARD OF THE GB PEOPLE S REPUBLIC OF CHINA GB 5009.15-2014 National Food Safety Standard Determination
Problem Solving. ] Substitute this value into the equation for poh.
![Problem Solving. ] Substitute this value into the equation for poh.](/thumbs/71/65824959.jpg "Problem Solving. ] Substitute this value into the equation for poh.") Skills Worksheet Problem Solving In 1909, Danish biochemist S. P. L Sørensen introduced a system in which acidity was expressed as the negative logarithm of the H concentration. In this way, the acidity
Skills Worksheet Problem Solving In 1909, Danish biochemist S. P. L Sørensen introduced a system in which acidity was expressed as the negative logarithm of the H concentration. In this way, the acidity
Chapter 9. Volumetric Analysis
 Chapter 9 Volumetric Analysis The terms volumetric analysis, titrimetry and titration are used interchangeably to describe a procedure which analyses chemicals in solution by accurate volume measurement.