Chapters 3 & 4 in Tietz Fundamentals of Clinical Chemistry or Tietz Textbook of Clinical Chemistry.
|
|
|
- Allyson Atkins
- 5 years ago
- Views:
Transcription
1 Chapters 3 & 4 in Tietz Fundamentals of Clinical Chemistry or Tietz Textbook of Clinical Chemistry.
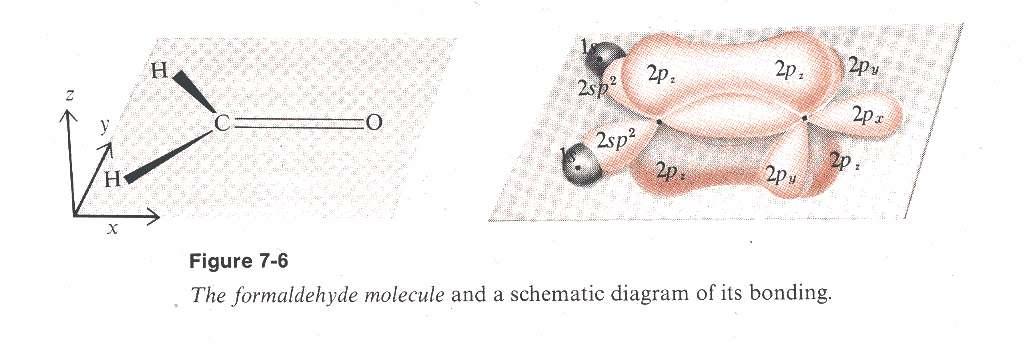
2 Ultraviolet/Visible (UV/Vis) Absorption Fluorescence and Phosphorescence Fluorescence Polarization Flame Emission and Atomic Absorption Turbidometry and Nephelometry
 and frequency ( ); where = c, c 3 x 10 8 m/s (speed of")
3 Light can be described as a wave characterized by a wavelength ( ) and frequency ( ); where = c, c 3 x 10 8 m/s (speed of light)
4 Photon energy is quantized and proportional to the frequency: E = ħ (or E = ħc/ ħ is Planck s constant (divided by 2 ).
5
6
7
8
9 1) Light is generated with the desired intensity, frequency and polarity. 2) The light is directed onto an experimental sample, which affects it in some way. 3) Light emanating from the sample is measured (angle of detection may vary).
 absorption generally corresponding to electronic transitions absorption spectrum dependent on chemical")
10 aka UV-Vis spectroscopy based on absorption of light with frequencies in the ultraviolet-to-visible range ( ~ nm) absorption generally corresponding to electronic transitions absorption spectrum dependent on chemical structure
11
12


13 Each vertical arrow represents a single excitation to a higher energy site due to absorption of a photon with E=h. A distribution of transitions from different vibrational and rotational energy states results in a large number of transitions with slightly different energies.
14 The consequence of a large number of vibrational and rotational energy states is a blurring of the individual lines into a broader and more featureless absorption spectrum, as seen from the top to the bottom on the right.
15
16
17
18 Absorption of light is directly proportional to concentration of the absorbing molecule. Absorbance (A) = -log(i/i 0 ), where I and I 0 are the intensity of the transmitted and incident light, respectively. A = lc, where is absorptivity (extinction coefficient), l is the path-length and c is the concentration of the absorbing molecule. Absorbance is linear with concentration from approximately (safest) or (under ideal conditions).
19 Instrumental/Technical (common) 1. At a very low absorbance, the intensity of the transmitted light is very similar to the incident light (i.e. I ~ I 0 ). For example, if A = 0.01 then I/I 0 ~ At these low absorbances, contributions due to stray light, scattering due to dust, contamination of other absorbing compounds, etc. are significant and the value is less accurate. 2. At a very high absorbance, the absolute intensity of the transmitted light is very small. For example, if A = 2, then I/I 0 = Chemical (rare) At these very high concentrations, accuracy is dependent on the dynamic range (or the noise threshold) of the instrument, i.e. when it is calibrated to properly measure I 0, then can it still distinguish a very weak I from instrumental noise or stray light? Photochemistry: light absorption may change the molecule in some way. Deviations in absorptivity coefficients at high concentrations (>0.01M) due to electrostatic interactions between molecules in close proximity. Fluorescence of phosphorescence of the molecule. Change in refractive index of the solution due to increased concentrations of the molecule.
20 Advantages simple and inexpensive instrumentation (portable) most organic molecules absorb UV/Vis light quantitative (Beer s law) Disadvantages mixtures of molecules can be a problem due to overlap (hence, routinely requires significant sample preparation) spectra are not highly specific for particular molecules absorption can be dependent on solution conditions; hence, often optimal to combine with a HPLC in order to standardize solution conditions
21 1) A Majority of Routine Automated Analyzers. 2) Detector for HPLC instruments (e.g. TCA by HPLC). 3) Hemoglobin oximetry (OxyHgb, DeoxyHgb, MetHgb, COHgb, CNHgb, etc.). 4) Many manual methods such as the total barbiturate assay, cholinesterase, delta OD 450, etc.
22 After an organic extraction of serum (and back-extraction into aqueous phase), drugs are separated using HPLC and detected using a UV/Vis diode array detector. A diode array can simultaneous detect a wide range of wavelengths, allowing essentially real-time acquisition of UV/Vis absorption spectra of individual HPLC peaks (as opposed to continuous monitoring of absorption at a single wavelength). Based on characteristic relative retention times and UV/Vis absorption spectra, a wide range of drugs can be identified. Only routine and official use at YNHH is for TCA quantitation, but the method can also be borrowed as consult-based screen for other drugs. We do this frequently for the CAP toxicology surveys.
23
24
25
26
27
28
 are extracted from serum (barbs are neutral in charge at ph < 7) into an organic phase and then back-extracted into a weak base (they are positively charged at ph > 8.5).")
29 All barbiturates (mild acids with pka s ~ ) are extracted from serum (barbs are neutral in charge at ph < 7) into an organic phase and then back-extracted into a weak base (they are positively charged at ph > 8.5). UV/Vis absorption spectra are collected at two different ph values and the difference is plotted. The absorption peak for barbiturates shifts from 240 nm to 260 nm with the change in ph, but the co-extracting contaminants do not, and will be blanked by the difference. Absorbance at 240 nm and 260 nm (the 240 nm band appears negative) is added and then multiplied by a factor of 65 to get the final total concentration of barbiturates in ng/ml.
 is a common problem.")
30 Because the extraction is not 100% specific for barbiturates (but pretty good because of the unusual pka s of barbiturates), sometimes other drugs contaminate the final solution. If these contaminating drugs also absorb near 240 or 260 nm in a ph-dependent fashion, then they will interfere with the assay. Thiopental (shown on the left) is a common problem. Thiopental is rapidly metabolized to pentobarbital; it is usually sufficient to request a subsequent sample, in which all the thiopental will be gone and pentobarbital can be measured. Acetaminophen in overdose levels can also interfere in this same way.
31 When some molecules absorb UV light, they convert some of the stored energy into heat and then emit light (in all directions) at a lower frequency (corresponding to the lower energy). The emitted light is best detected at a right angle to the incident light. Must be careful about stray light. Fluorescence and phosphorescence differ in their quantum mechanical mechanism for the dissipation of the stored energy. Generally, fluorescence emits UV light and phosphorescence emits visible light. However, most importantly, in both cases the emitted light is generally linearly proportional to the analyte concentration. Luminescence is generally more sensitive than absorption because it is easier to accurately measure a small amount of absolute light than to accurately detect a small decrease in relative light.
32


33

34 (Luminescence is a generic word for fluorescence and phosphorescence)
35 Generic method for detecting binding of a small molecule (e.g. a drug or hormone) to a large protein or particle. Concept is that if polarized light is used to excite a fluorescent molecule, then the emitted light is also polarized. However, if the molecule rotates during the fluorescent lifetime then the plane of polarization will change and this can be quantified.
36 Both polarization and anisotropy vary between 0 and 1. Small, rapidly rotating molecule: P = A = 0 Large, slowly rotating molecule: P = A = 1
37 I ~ I = and P ~ 0 I >> I = and P close to 1
38 Among the first commercial instruments designed to use FPIA for clinical diagnostic purposes was the Abbott TDx introduced in Currently, many of our assays on the Abbott AxSym use FPIA. The basic principle of FPIA is to: (1) Add a fluorescent analog of a target molecule, e.g. a drug, to a solution containing an antibody to the target molecule. (2) Measure the fluorescence polarization, which is high when the fluorophore is bound to the antibody and low when it is free in solution. (3) Add the appropriate biological fluid (blood, plasma, urine, etc.) and measure the decrease in polarization as the target molecules in the sample fluid bind to the antibodies and displace the fluoroescent analogs.
39 Advantages More sensitive than UV/Vis absorption (can detect low levels of a compound). More specific than UV/Vis absorption (only fluorescent molecules detected). Disadvantages Very few molecules are naturally luminescent. More complicated equipment required compared to UV/Vis absorption. Similar to absorption, luminescence can be dependent on solution conditions; hence, often optimal to combine with HPLC in order to standardize solution conditions.
40 Fluorescence and Phosphorescence Fluorescence Polarization Immunoassay (FPIA) on the AxSym. Flow cytometry and immunofluorescence (using standard tag molecules, i.e. FITC, PE,...) A few rarely found manual assays (e.g. platelet serotonin). Chemiluminescence has great potential. based on the conversion of chemical energy into light (like a firefly); takes away the need for incident light hence, very sensitive and specific Immulite analyzer in Chemistry uses chemiluminescence.
41 UV/Vis absorption spectra of organic molecules in solution are not highly specific due to broad, overlapping absorption bands. This is generally a feature of chemical bonds, which have more complex electronic transitions (complicated by bond vibrations and rotations). Isolated elements (Pb, Cu, etc.) in a gaseous state are NOT complicated by chemical bonding or solvent interactions. Therefore, their atomic spectra are highly specific.
42
43 Thermal energy from the flame excites some elements (alkali metals) into a higher energy electronic state. When the excited electrons relax to their ground state, they emit light with very specific frequencies, which is quantitated by a detector. Originally used for Sodium, Potassium, Lithium and other alkali metals but has been replaced by ion selective electrodes (ISE). Homework: try dumping table salt onto a gas burner and see the pretty yellow color; whereas salt substitutes containing KCl are violet...
44
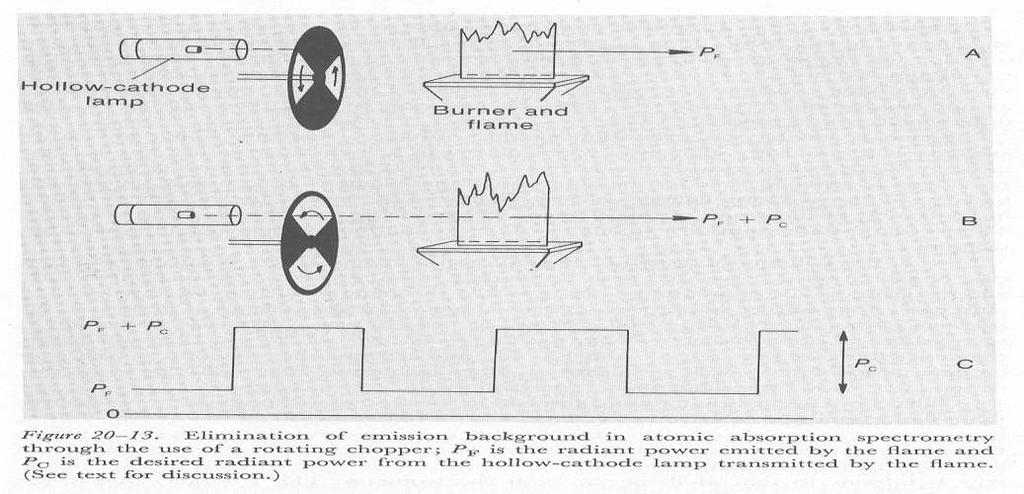
45 Most elements are not easily excited to higher electronic states by thermal energy. However, their narrow-energy and highly specific electronic transitions can still be detected by standard absorption of light (just like UV/Vis spectroscopy). A (reducing) flame is still part of the apparatus in order to separate the element from chemical bonds and solute interactions. A hollow cathode lamp specific for individual elements is used as the light source. These lamps contain the element (typically a metal) to be analyzed and emit only the specific frequencies which can be absorbed by the element in the flame (ingenious, no?).

46

47
48


49 Nebulization (spraying), desolvation and vaporization (including chemical separation and reduction) of solutes during flaming is desired. Ionization of solutes is avoided.
50 Despite the high specificity of atomic absorption spectroscopy, interferences from other molecules in the nebulized sample are possible. They can be classified as vaporization interferences, spectral interferences and ionization interferences. Vaporization interference results when some component of the sample interferes with the vaporization process, often by chemically interacting with the analyte. An example is Caphosphate precipitation during desolvation. One solution is to add an excess of phosphate to standardize the effect. Another solution is to add a releasing agent such as EDTA which tightly binds to the Ca in solution but is also destroyed upon vaporization within the flame.

51 Spectral interferences result when two elements absorb or emit light at similar frequencies. This problem is more common in flame emission spectroscopy where the emitted light cannot be controlled. However, in either case this problem is easily handled by selecting different frequencies for quantitation. Ionization interferences result when a component of the sample affects the degree of ionization of the measured analyte. A common example is due to the easy ionization of potassium in a flame, which dumps free electrons (increased reductive potential) into the flame and reduces the ionization of the measured analyte. Therefore, variations in potassium levels in samples will vary the signal from the analyte causing an interference. The solution is to add an excess of an element which also ionizes easily (potassium or lithium), thereby maximally reducing the ionization of the measured analyte.
52 Flame Emission simpler instrumentation as hollow cathode lamps and choppers are not required few elements are easily excited thermally historical use for Na, K, Li but has been replaced by ISE Atomic Absorption very high sensitivity (especially graphite furnace/zeeman) very high specificity (partially due to hollow cathode lamps) complex instrumentation for only a few biomedically relevant analytes (only Pb & Ca at YNHH, but also Zn & Cu elsewhere) usually reserved as a gold standard reference method also has use for complex samples such as tissue biopsies (Fe, Cu and Zn in liver biopsies)
53 Some samples are too complex to adequately account for all possible vaporization or ionization interferences. An example is tissue biopsy specimens submitted for heavy metal analysis (liver is common). These samples are homogenized and dissolved into harsh solutions (strong base and heavy oxidizer) and analyzed with flameless atomic absorption spectroscopy. The sample is placed in a well on a carbon rod within an enclosed chamber (a graphite furnace) and heated in successive steps to dry, char and atomize the sample into the chamber, where the atomic absorption is measured in typical fashion. Matrix effects are effectively eliminated by a proper heating sequence which destroys organic components and separates other inorganic elements from the measured analyte. The reduction in background or interference signal greatly increases the overall sensitivity of the method.
54 The atomized sample from a graphite furnace is contained between two electromagnets, which are cycled on and off at regular intervals. The desired atomic absorption signal is modulated in a predictable way by this effect, but the undesired background signal is not. By proper comparison of the signal in the presence and absence of the magnet field, background interferences can be reduced even further giving rise to extremely high sensitivities. We use this method for Pb allowing a very low limit of detection and quantification. Good for monitoring low level lead exposure compared to standard electrochemical method.
55
56
 some of the energy in other directions. However, there are many important factors.")
57 Particles scatter light. Scattering is essentially the induction of an oscillating dipole in a molecule due to the varying electromagnetic field of the light. This oscillating dipole acts like an antenna and disperses (i.e. scatters) some of the energy in other directions. However, there are many important factors. Scattering varies with the size of the particle Scattering varies with the wavelength of light Scattering varies with the angle of observation

58 Note that the angle is located in the XY plane and the angle is located in the YZ plane.
59 Rayleigh Scattering (small particle size relative to wavelength) for polarized incident light: i sin I 2 r 4 0 Rayleigh Scattering (small particle size relative to wavelength) for non-polarized incident light: i I (1 2 r 4 cos 2 ) Debye-Rayleigh Scattering (large particle size relative to wavelength) for nonpolarized incident light. - No simple equation. Has to do with summing up scattering from separate bits of the particle.
60 i I r 2 2 sin 4 2 As sunlight passes through the atmosphere at indirect angles (i.e. not aiming directly at the earth), it is scattered by the molecules present in the air. Because of the powerful 4 th power dependence of scattering on wavelength ( ), blue light, which has a higher frequency/energy and lower wavelength, is scattered much more than red and we see a blue sky. On the other hand, when the sun sets in the west light aimed directly at your vision has passed through a LOT of atmosphere (and a lot of smog). The blue light has all been scattered, primarily leaving behind red light. As well, because smog contains large particles and because the Debye effect is more effective for longer wavelengths, the red light is scattered directly ahead, contributing to the effect. Neat, eh?
61 (A) (B) Small particles scatter light approximately equally to the side (90 degrees) as forward (0 degrees). Larger particles scatter proportionally more light forward (and at longer wavelengths) than small particles.
62
63 Outside of flow cytometry, primary use of both is to quantitate the presence of large immune complexes in serum or urine. Basically, when an antibody to a multivalent antigen is added to plasma, large oligomeric/polymeric immune complexes form in proportion to the degree of antigen. The large immune complexes scatter light, which can be quantified by either turbidometry or nephelometry. Calibration curves can be generated from standard solutions of the antigen similar to any other antibody-based method. Note that these techniques are subject to the same classical hook-effect as any other antibody-based assay. Generally, nephelometry is advantageous when measuring low-level antibody-antigen reactions. However, this advantage has diminished with improvement in turbidometry optics. The advantage of turbidometry is simpler instrumentation.

64 Basically, turbidometry is entirely analogous to absorption spectroscopy, where an attenuation of transmitted light through a sample is measured. However, with turbidometry the attenuation is due to light scattering instead of electronic absorption. Equations are straightforward: I/I 0 = exp(-bt), where I/I 0 is the ratio of transmitted light in a sample relative to a blank or control, b is the pathlength (typically 1 cm) and t is the turbidity. Rearranging, tb = ln(i/i 0 ). Note that Beer s Law can be rearranged to abc = ln(i/i 0 ), where a is the absorptivity and c is the analyte concentration. When turbidity is related to analyte concentration, the analogy of turbidometry with absorption spectroscopy is complete.
65 Nephelometry attempts to directly quantify the scattered light. To do this it must measure light at an angle to the incident light. Both side scatter (at 90) and forward scatter (at 30) instruments are available. In theory, nephelometry is more sensitive than turbidometry, because it is easier to detect a small amount of scattered light than to accurately detect a small (< 5%) attenuation of transmitted light. However, for sensitive detection of low-level antigen-antibody complexes, it is critical to avoid stray light directed at the detector (e.g. reflected light of the cuvette). For this reason, forward scatter instruments are often preferred to take advantage of the increased forward-scatter intensity from larger particles (i.e. immune complexes).
Atomization. In Flame Emission
 FLAME SPECTROSCOPY The concentration of an element in a solution is determined by measuring the absorption, emission or fluorescence of electromagnetic by its monatomic particles in gaseous state in the
Because light behaves like a wave, we can describe it in one of two ways by its wavelength or by its frequency.
 Light We can use different terms to describe light: Color Wavelength Frequency Light is composed of electromagnetic waves that travel through some medium. The properties of the medium determine how light
10/2/2008. hc λ. νλ =c. proportional to frequency. Energy is inversely proportional to wavelength And is directly proportional to wavenumber
 CH217 Fundamentals of Analytical Chemistry Module Leader: Dr. Alison Willows Electromagnetic spectrum Properties of electromagnetic radiation Many properties of electromagnetic radiation can be described
high temp ( K) Chapter 20: Atomic Spectroscopy
 Chapter 20: Atomic Spectroscopy") high temp (2000-6000K) Chapter 20: Atomic Spectroscopy 20-1. An Overview Most compounds Atoms in gas phase high temp (2000-6000K) (AES) (AAS) (AFS) sample Mass-to-charge (ICP-MS) Atomic Absorption experiment
high temp (2000-6000K) Chapter 20: Atomic Spectroscopy 20-1. An Overview Most compounds Atoms in gas phase high temp (2000-6000K) (AES) (AAS) (AFS) sample Mass-to-charge (ICP-MS) Atomic Absorption experiment
Skoog Chapter 6 Introduction to Spectrometric Methods
 Skoog Chapter 6 Introduction to Spectrometric Methods General Properties of Electromagnetic Radiation (EM) Wave Properties of EM Quantum Mechanical Properties of EM Quantitative Aspects of Spectrochemical
2101 Atomic Spectroscopy
 2101 Atomic Spectroscopy Atomic identification Atomic spectroscopy refers to the absorption and emission of ultraviolet to visible light by atoms and monoatomic ions. It is best used to analyze metals.
Atomic Absorption Spectroscopy (AAS)
") Atomic Absorption Spectroscopy (AAS) Alex Miller ABC s of Electrochemistry 3/8/2012 Contents What is Atomic Absorption Spectroscopy? Basic Anatomy of an AAS system Theory of Operation Practical Operation
Atomic Absorption Spectroscopy (AAS) Alex Miller ABC s of Electrochemistry 3/8/2012 Contents What is Atomic Absorption Spectroscopy? Basic Anatomy of an AAS system Theory of Operation Practical Operation
Ultraviolet-Visible and Infrared Spectrophotometry
 Ultraviolet-Visible and Infrared Spectrophotometry Ahmad Aqel Ifseisi Assistant Professor of Analytical Chemistry College of Science, Department of Chemistry King Saud University P.O. Box 2455 Riyadh 11451
Emission spectrum of H
 Atomic Spectroscopy Atomic spectroscopy measures the spectra of elements in their atomic/ionized states. Atomic spectrometry, exploits quantized electronic transitions characteristic of each individual
very high temperature for excitation not necessary generally no plasma/arc/spark AAS
 Atomic Absorption Spectrometry (Chapter 9) AAS intrinsically more sensitive than AES similar atomization techniques to AES addition of radiation source high temperature for atomization necessary flame
R O Y G B V. Spin States. Outer Shell Electrons. Molecular Rotations. Inner Shell Electrons. Molecular Vibrations. Nuclear Transitions
 Spin States Molecular Rotations Molecular Vibrations Outer Shell Electrons Inner Shell Electrons Nuclear Transitions NMR EPR Microwave Absorption Spectroscopy Infrared Absorption Spectroscopy UV-vis Absorption,
AN INTRODUCTION TO ATOMIC SPECTROSCOPY
 AN INTRODUCTION TO ATOMIC SPECTROSCOPY Atomic spectroscopy deals with the absorption, emission, or fluorescence by atom or elementary ions. Two regions of the spectrum yield atomic information- the UV-visible
Chemistry Instrumental Analysis Lecture 18. Chem 4631
 Chemistry 4631 Instrumental Analysis Lecture 18 Instrumentation Radiation sources Hollow cathode lamp Most common source Consist of W anode and a cathode sealed in a glass tube filled with Ne or Ar. Hollow
Chapter 13 An Introduction to Ultraviolet/Visible Molecular Absorption Spectrometry
 Chapter 13 An Introduction to Ultraviolet/Visible Molecular Absorption Spectrometry 13A Measurement Of Transmittance and Absorbance Absorption measurements based upon ultraviolet and visible radiation
Lecture 7: Atomic Spectroscopy
 Lecture 7: Atomic Spectroscopy 1 Atomic spectroscopy The wavelengths of absorbance and emission from atoms in the gas phase are characteristic of atomic orbitals. 2 In the lowest energy transition, the
3 - Atomic Absorption Spectroscopy
 3 - Atomic Absorption Spectroscopy Introduction Atomic-absorption (AA) spectroscopy uses the absorption of light to measure the concentration of gas-phase atoms. Since samples are usually liquids or solids,
Partial Energy Level Diagrams
 Partial Energy Level Diagrams 460 nm 323 nm 610 nm 330 nm 819 nm 404 nm 694 nm 671 nm 589 / 590 nm 767 / 769 nm Lithium Sodium Potassium Gas Mixtures Maximum Temperatures, C Air-Coal Gas 1825 Air-Propane
Atomic Absorption Spectrophotometry. Presentation by, Mrs. Sangita J. Chandratre Department of Microbiology M. J. college, Jalgaon
 Atomic Absorption Spectrophotometry Presentation by, Mrs. Sangita J. Chandratre Department of Microbiology M. J. college, Jalgaon Defination In analytical chemistry, Atomic absorption spectroscopy is a
Chapter 4 Ultraviolet and visible spectroscopy Molecular Spectrophotometry
 Chapter 4 Ultraviolet and visible spectroscopy Molecular Spectrophotometry Properties of light Electromagnetic radiation and electromagnetic spectrum Absorption of light Beer s law Limitation of Beer s
Optical Atomic Spectroscopy
 Optical Atomic Spectroscopy Methods to measure conentrations of primarily metallic elements at < ppm levels with high selectivity! Two main optical methodologies- -Atomic Absorption--need ground state
Ch. 9 Atomic Absorption & Atomic Fluorescence Spectrometry
 Ch. 9 Atomic Absorption & Atomic Fluorescence Spectrometry 9.1 9A. Atomization Most fundamental for both techniques. Typical types 1. flame - burner type 2. Electrothermal graphite furnace 3. Specialized
Chapter 17: Fundamentals of Spectrophotometry
 Chapter 17: Fundamentals of Spectrophotometry Spectroscopy: the science that deals with interactions of matter with electromagnetic radiation or other forms energy acoustic waves, beams of particles such
Introduction to Pharmaceutical Chemical Analysis
 Introduction to Pharmaceutical Chemical Analysis Hansen, Steen ISBN-13: 9780470661222 Table of Contents Preface xv 1 Introduction to Pharmaceutical Analysis 1 1.1 Applications and Definitions 1 1.2 The
Chemistry 311: Instrumentation Analysis Topic 2: Atomic Spectroscopy. Chemistry 311: Instrumentation Analysis Topic 2: Atomic Spectroscopy
 Topic 1: Atomic Spectroscopy Text: Chapter 12,13 & 14 Rouessac (~2 weeks) 1.0 Review basic concepts in Spectroscopy 2.0 Atomic Absorption and Graphite Furnace Instruments 3.0 Inductively Coupled Plasmas
Spectroscopy. Page 1 of 8 L.Pillay (2012)
") Spectroscopy Electromagnetic radiation is widely used in analytical chemistry. The identification and quantification of samples using electromagnetic radiation (light) is called spectroscopy. Light has
Spectroscopy Electromagnetic radiation is widely used in analytical chemistry. The identification and quantification of samples using electromagnetic radiation (light) is called spectroscopy. Light has
II. Spectrophotometry (Chapters 17, 19, 20)
") II. Spectrophotometry (Chapters 17, 19, 20) FUNDAMENTALS (Chapter 17) Spectrophotometry: any technique that uses light to measure concentrations (here: U and visible - ~190 800 nm) c = 2.99792 x 10 8 m/s
II. Spectrophotometry (Chapters 17, 19, 20) FUNDAMENTALS (Chapter 17) Spectrophotometry: any technique that uses light to measure concentrations (here: U and visible - ~190 800 nm) c = 2.99792 x 10 8 m/s
Emission Spectroscopy
 Objectives Emission Spectroscopy Observe spectral lines from a hydrogen gas discharge tube Determine the initial and final energy levels for the electronic transitions associated with the visible portion
ATOMIC ABSORPTION SPECTROSCOPY (AAS) is an analytical technique that measures the concentrations of elements. It makes use of the absorption of light
 is an analytical technique that measures the concentrations of elements. It makes use of the absorption of light") ATOMIC ABSORPTION SPECTROSCOPY (AAS) is an analytical technique that measures the concentrations of elements. It makes use of the absorption of light by these elements in order to measure their concentration.
ATOMIC ABSORPTION SPECTROSCOPY (AAS) is an analytical technique that measures the concentrations of elements. It makes use of the absorption of light by these elements in order to measure their concentration.
Ultraviolet-Visible and Infrared Spectrophotometry
 Ultraviolet-Visible and Infrared Spectrophotometry Ahmad Aqel Ifseisi Assistant Professor of Analytical Chemistry College of Science, Department of Chemistry King Saud University P.O. Box 2455 Riyadh 11451
INTRODUCTION Atomic fluorescence spectroscopy ( AFS ) depends on the measurement of the emission ( fluorescence ) emitted from gasphase analyte atoms
 depends on the measurement of the emission ( fluorescence ) emitted from gasphase analyte atoms") INTRODUCTION Atomic fluorescence spectroscopy ( AFS ) depends on the measurement of the emission ( fluorescence ) emitted from gasphase analyte atoms that have been excited to higher energy levels by absorption
INTRODUCTION Atomic fluorescence spectroscopy ( AFS ) depends on the measurement of the emission ( fluorescence ) emitted from gasphase analyte atoms that have been excited to higher energy levels by absorption
An Introduction to Ultraviolet-Visible Molecular Spectrometry (Chapter 13)
") An Introduction to Ultraviolet-Visible Molecular Spectrometry (Chapter 13) Beer s Law: A = -log T = -logp 0 / P = e x b x C See Table 13-1 for terms. In measuring absorbance or transmittance, one should
An Introduction to Ultraviolet-Visible Molecular Spectrometry (Chapter 13) Beer s Law: A = -log T = -logp 0 / P = e x b x C See Table 13-1 for terms. In measuring absorbance or transmittance, one should
Complete the following. Clearly mark your answers. YOU MUST SHOW YOUR WORK TO RECEIVE CREDIT.
 CHEM 322 Name Exam 3 Spring 2013 Complete the following. Clearly mark your answers. YOU MUST SHOW YOUR WORK TO RECEIVE CREDIT. Warm-up (3 points each). 1. In Raman Spectroscopy, molecules are promoted
Wavelength λ Velocity v. Electric Field Strength Amplitude A. Time t or Distance x time for 1 λ to pass fixed point. # of λ passing per s ν= 1 p
 Introduction to Spectroscopy (Chapter 6) Electromagnetic radiation (wave) description: Wavelength λ Velocity v Electric Field Strength 0 Amplitude A Time t or Distance x Period p Frequency ν time for 1
9/13/10. Each spectral line is characteristic of an individual energy transition
 Sensitive and selective determination of (primarily) metals at low concentrations Each spectral line is characteristic of an individual energy transition 1 Atomic Line Widths Why do atomic spectra have
Analytical Chemistry II
 Analytical Chemistry II L4: Signal processing (selected slides) Computers in analytical chemistry Data acquisition Printing final results Data processing Data storage Graphical display https://www.creativecontrast.com/formal-revolution-of-computer.html
Chapter 17: Fundamentals of Spectrophotometry
 Chapter 17: Fundamentals of Spectrophotometry Spectroscopy: the science that deals with interactions of matter with electromagnetic radiation or other forms energy acoustic waves, beams of particles such
Ch 313 FINAL EXAM OUTLINE Spring 2010
 Ch 313 FINAL EXAM OUTLINE Spring 2010 NOTE: Use this outline at your own risk sometimes a topic is omitted that you are still responsible for. It is meant to be a study aid and is not meant to be a replacement
Classification of spectroscopic methods
 Introduction Spectroscopy is the study of the interaction between the electromagnetic radiation and the matter. Spectrophotometry is the measurement of these interactions i.e. the measurement of the intensity
Singlet. Fluorescence Spectroscopy * LUMO
 Fluorescence Spectroscopy Light can be absorbed and re-emitted by matter luminescence (photo-luminescence). There are two types of luminescence, in this discussion: fluorescence and phosphorescence. A
Prof. Dr. Biljana Škrbić, Jelena Živančev
 5 th CEFSER Training Course Analysis of chemical contaminants in food and the environment Faculty of Technology, University of Novi Sad, Novi Sad, Republic of Serbia 7-11 May 2012 Analysis of heavy elements
CHEM*3440. Photon Energy Units. Spectrum of Electromagnetic Radiation. Chemical Instrumentation. Spectroscopic Experimental Concept.
 Spectrum of Electromagnetic Radiation Electromagnetic radiation is light. Different energy light interacts with different motions in molecules. CHEM*344 Chemical Instrumentation Topic 7 Spectrometry Radiofrequency
atomic absorption spectroscopy general can be portable and used in-situ preserves sample simpler and less expensive
 Chapter 9: End-of-Chapter Solutions 1. The following comparison provides general trends, but both atomic absorption spectroscopy (AAS) and atomic absorption spectroscopy (AES) will have analyte-specific
The Fundamentals of Spectroscopy: Theory BUILDING BETTER SCIENCE AGILENT AND YOU
 The Fundamentals of Spectroscopy: Theory BUILDING BETTER SCIENCE AGILENT AND YOU 1 Agilent is committed to the educational community and is willing to provide access to company-owned material. This slide
Chemistry 524--Final Exam--Keiderling May 4, :30 -?? pm SES
 Chemistry 524--Final Exam--Keiderling May 4, 2011 3:30 -?? pm -- 4286 SES Please answer all questions in the answer book provided. Calculators, rulers, pens and pencils are permitted. No open books or
CH. 21 Atomic Spectroscopy
 CH. 21 Atomic Spectroscopy 21.1 Anthropology Puzzle? What did ancient people eat for a living? Laser Ablation-plasma ionization-mass spectrometry CH. 21 Atomic Spectroscopy 21.2 plasma In Atomic Spectroscopy
24 Introduction to Spectrochemical Methods
 24 Introduction to Spectrochemical Methods Spectroscopic method: based on measurement of the electromagnetic radiation produced or absorbed by analytes. electromagnetic radiation: include γ-ray, X-ray,
Application of IR Raman Spectroscopy
 Application of IR Raman Spectroscopy 3 IR regions Structure and Functional Group Absorption IR Reflection IR Photoacoustic IR IR Emission Micro 10-1 Mid-IR Mid-IR absorption Samples Placed in cell (salt)
ANALYSIS OF ZINC IN HAIR USING FLAME ATOMIC ABSORPTION SPECTROSCOPY
 ANALYSIS OF ZINC IN HAIR USING FLAME ATOMIC ABSORPTION SPECTROSCOPY Introduction The purpose of this experiment is to determine the concentration of zinc in a sample of hair. You will use both the calibration
ATOMIC SPECROSCOPY (AS)
") ATOMIC ABSORPTION ANALYTICAL CHEMISTRY ATOMIC SPECROSCOPY (AS) Atomic Absorption Spectroscopy 1- Flame Atomic Absorption Spectreoscopy (FAAS) 2- Electrothermal ( Flame-less ) Atomic Absorption Spectroscopy
ATOMIC ABSORPTION ANALYTICAL CHEMISTRY ATOMIC SPECROSCOPY (AS) Atomic Absorption Spectroscopy 1- Flame Atomic Absorption Spectreoscopy (FAAS) 2- Electrothermal ( Flame-less ) Atomic Absorption Spectroscopy
Absorption spectrometry summary
 Absorption spectrometry summary Rehearsal: Properties of light (electromagnetic radiation), dual nature light matter interactions (reflection, transmission, absorption, scattering) Absorption phenomena,
Atomic Absorption Spectroscopy
 CH 2252 Instrumental Methods of Analysis Unit IV Atomic Absorption Spectroscopy Dr. M. Subramanian Associate Professor Department of Chemical Engineering Sri Sivasubramaniya Nadar College of Engineering
Physisorption of Antibodies using BioReady Bare Nanoparticles
 TECHNICAL RESOURCE Lateral Flow Immunoassays Physisorption of Antibodies using BioReady Bare Nanoparticles Introduction For more than 20 years, lateral flow immunoassay diagnostic tests have provided a
Chapter 3. Electromagnetic Theory, Photons. and Light. Lecture 7
 Lecture 7 Chapter 3 Electromagnetic Theory, Photons. and Light Sources of light Emission of light by atoms The electromagnetic spectrum see supplementary material posted on the course website Electric
Chapter 18. Fundamentals of Spectrophotometry. Properties of Light
 Chapter 18 Fundamentals of Spectrophotometry Properties of Light Electromagnetic Radiation energy radiated in the form of a WAVE caused by an electric field interacting with a magnetic field result of
Atomic Absorption Spectroscopy and Atomic Emission Spectroscopy
 Atomic Absorption Spectroscopy and Atomic Emission Spectroscopy A. Evaluation of Analytical Parameters in Atomic Absorption Spectroscopy Objective The single feature that contributes most to making atomic
Chem 321 Lecture 18 - Spectrophotometry 10/31/13
 Student Learning Objectives Chem 321 Lecture 18 - Spectrophotometry 10/31/13 In the lab you will use spectrophotometric techniques to determine the amount of iron, calcium and magnesium in unknowns. Although
MOLECULAR AND ATOMIC SPECTROSCOPY
 MOLECULAR AND ATOMIC SPECTROSCOPY 1. General Background on Molecular Spectroscopy 3 1.1. Introduction 3 1.2. Beer s Law 5 1.3. Instrumental Setup of a Spectrophotometer 12 1.3.1. Radiation Sources 13 1.3.2.
This watermark does not appear in the registered version - Laser- Tissue Interaction
 S S d Laser- Tissue Interaction Types of radiation ionizing radiation Non - ionizing radiation You may click on any of the types of radiation for more detail about its particular type of interaction
Lecture 0. NC State University
 Chemistry 736 Lecture 0 Overview NC State University Overview of Spectroscopy Electronic states and energies Transitions between states Absorption and emission Electronic spectroscopy Instrumentation Concepts
Chem 310 rd. 3 Homework Set Answers
 -1- Chem 310 rd 3 Homework Set Answers 1. A double line labeled S 0 represents the _ground electronic_ state and the _ground vibrational_ state of a molecule in an excitation state diagram. Light absorption
1. The most important aspects of the quantum theory.
 Lecture 5. Radiation and energy. Objectives: 1. The most important aspects of the quantum theory: atom, subatomic particles, atomic number, mass number, atomic mass, isotopes, simplified atomic diagrams,
Chapter 4. Spectroscopy. Dr. Tariq Al-Abdullah
 Chapter 4 Spectroscopy Dr. Tariq Al-Abdullah Learning Goals: 4.1 Spectral Lines 4.2 Atoms and Radiation 4.3 Formation of the Spectral Lines 4.4 Molecules 4.5 Spectral Line Analysis 2 DR. T. AL-ABDULLAH
TURBIDIMETRY & NEPHELOMETRY. Mohsin Al-Saleh, Senior Biomedical Scientist (BSc. MLS-2004/MSc Clini. Chem. 2013) ID#6837
 ID#6837") TURBIDIMETRY & NEPHELOMETRY Mohsin Al-Saleh, Senior Biomedical Scientist (BSc. MLS-2004/MSc Clini. Chem. 2013) ID#6837 Lecture Objectives: Introduction (An Overview about laboratory techniques) Definition
TURBIDIMETRY & NEPHELOMETRY Mohsin Al-Saleh, Senior Biomedical Scientist (BSc. MLS-2004/MSc Clini. Chem. 2013) ID#6837 Lecture Objectives: Introduction (An Overview about laboratory techniques) Definition
Questions on Instrumental Methods of Analysis
 Questions on Instrumental Methods of Analysis 1. Which one of the following techniques can be used for the detection in a liquid chromatograph? a. Ultraviolet absorbance or refractive index measurement.
C101-E145 TALK LETTER. Vol. 17
 C101-E145 TALK LETTER Vol. 17 UV-VIS Spectroscopy and Fluorescence Spectroscopy (Part 1 of 2) ------- 02 Applications: Spectrofluorophotometers Used in a Variety of Fields ------- 06 Q&A: Is there a way
Chapter 15 Molecular Luminescence Spectrometry
 Chapter 15 Molecular Luminescence Spectrometry Two types of Luminescence methods are: 1) Photoluminescence, Light is directed onto a sample, where it is absorbed and imparts excess energy into the material
A Spectrophotometric Analysis of Calcium in Cereal
 CHEM 311L Quantitative Analysis Laboratory Revision 1.2 A Spectrophotometric Analysis of Calcium in Cereal In this laboratory exercise, we will determine the amount of Calium in a serving of cereal. We
FLAME PHOTOMETRY AIM INTRODUCTION
 FLAME PHOTOMETRY AIM INTRODUCTION Atomic spectroscopy is based on the absorption, emission or fluorescence process of light by atoms or elementary ions. Information for atomic scale is obtained in two
Reference literature. (See: CHEM 2470 notes, Module 8 Textbook 6th ed., Chapters )
") September 17, 2018 Reference literature (See: CHEM 2470 notes, Module 8 Textbook 6th ed., Chapters 13-14 ) Reference.: https://slideplayer.com/slide/8354408/ Spectroscopy Usual Wavelength Type of Quantum
September 17, 2018 Reference literature (See: CHEM 2470 notes, Module 8 Textbook 6th ed., Chapters 13-14 ) Reference.: https://slideplayer.com/slide/8354408/ Spectroscopy Usual Wavelength Type of Quantum
Design and Development of a Smartphone Based Visible Spectrophotometer for Analytical Applications
 Design and Development of a Smartphone Based Visible Spectrophotometer for Analytical Applications Bedanta Kr. Deka, D. Thakuria, H. Bora and S. Banerjee # Department of Physicis, B. Borooah College, Ulubari,
Introduction to Spectroscopic methods
 Introduction to Spectroscopic methods Spectroscopy: Study of interaction between light* and matter. Spectrometry: Implies a quantitative measurement of intensity. * More generally speaking electromagnetic
UNIVERSITI SAINS MALAYSIA. Second Semester Examination Academic Session 2004/2005. March KAA 502 Atomic Spectroscopy.
 UNIVERSITI SAINS MALAYSIA Second Semester Examination Academic Session 2004/2005 March 2005 KAA 502 Atomic Spectroscopy Time: 3 hours Please make sure this paper consists of FIVE typed pages before answering
Atomic Absorption & Atomic Fluorescence Spectrometry
 Atomic Absorption & Atomic Fluorescence Spectrometry Sample Atomization Atomic Absorption (AA) Atomic Fluorescence (AF) - Both AA and AF require a light source - Like Molecular Absorption & Fluorescence,
Chem Homework Set Answers
 Chem 310 th 4 Homework Set Answers 1. Cyclohexanone has a strong infrared absorption peak at a wavelength of 5.86 µm. (a) Convert the wavelength to wavenumber.!6!1 8* = 1/8 = (1/5.86 µm)(1 µm/10 m)(1 m/100
EMISSION SPECTROSCOPY
 IFM The Department of Physics, Chemistry and Biology LAB 57 EMISSION SPECTROSCOPY NAME PERSONAL NUMBER DATE APPROVED I. OBJECTIVES - Understand the principle of atomic emission spectra. - Know how to acquire
1 WHAT IS SPECTROSCOPY?
 1 WHAT IS SPECTROSCOPY? 1.1 The Nature Of Electromagnetic Radiation Anyone who has been sunburnt will know that light packs a punch: in scientific terms, it contains considerable amounts of energy. All
Answers to questions on exam in laser-based combustion diagnostics on March 10, 2006
 Answers to questions on exam in laser-based combustion diagnostics on March 10, 2006 1. Examples of advantages and disadvantages with laser-based combustion diagnostic techniques: + Nonintrusive + High
Absorption photometry
 The light Absorption photometry Szilvia Barkó University of Pécs, Faculty of Medicines, Dept. Biophysics February 2011 Transversal wave E Electromagnetic wave electric gradient vector wavelength The dual
An Introduction to Diffraction and Scattering. School of Chemistry The University of Sydney
 An Introduction to Diffraction and Scattering Brendan J. Kennedy School of Chemistry The University of Sydney 1) Strong forces 2) Weak forces Types of Forces 3) Electromagnetic forces 4) Gravity Types
Clinical Chemistry (CHE221) Professor Hicks Week 7. Endpoint vs Kinetic Techniques. Instrumentation and Assay techniques
 Professor Hicks Week 7. Endpoint vs Kinetic Techniques. Instrumentation and Assay techniques") Clinical Chemistry (CHE221) Professor Hicks Week 7 Instrumentation and Assay techniques Endpoint vs Kinetic Techniques two different approaches to analyzing for a substance Endpoint methods use all the
Clinical Chemistry (CHE221) Professor Hicks Week 7 Instrumentation and Assay techniques Endpoint vs Kinetic Techniques two different approaches to analyzing for a substance Endpoint methods use all the
Molecular Luminescence Spectroscopy
 Molecular Luminescence Spectroscopy In Molecular Luminescence Spectrometry ( MLS ), molecules of the analyte in solution are excited to give a species whose emission spectrum provides information for qualitative
Spectroscopy Problem Set February 22, 2018
 Spectroscopy Problem Set February, 018 4 3 5 1 6 7 8 1. In the diagram above which of the following represent vibrational relaxations? 1. Which of the following represent an absorbance? 3. Which of following
Chemistry Instrumental Analysis Lecture 3. Chem 4631
 Chemistry 4631 Instrumental Analysis Lecture 3 Quantum Transitions The energy of a photon can also be transferred to an elementary particle by adsorption if the energy of the photon exactly matches the
Advanced Spectroscopy Laboratory
 Advanced Spectroscopy Laboratory - Raman Spectroscopy - Emission Spectroscopy - Absorption Spectroscopy - Raman Microscopy - Hyperspectral Imaging Spectroscopy FERGIELAB TM Raman Spectroscopy Absorption
a. An emission line as close as possible to the analyte resonance line
 Practice Problem Set 5 Atomic Emission Spectroscopy 10-1 What is an internal standard and why is it used? An internal standard is a substance added to samples, blank, and standards. The ratio of the signal
Reflection = EM strikes a boundary between two media differing in η and bounces back
 Reflection = EM strikes a boundary between two media differing in η and bounces back Incident ray θ 1 θ 2 Reflected ray Medium 1 (air) η = 1.00 Medium 2 (glass) η = 1.50 Specular reflection = situation
A very brief history of the study of light
 1. Sir Isaac Newton 1672: A very brief history of the study of light Showed that the component colors of the visible portion of white light can be separated through a prism, which acts to bend the light
Reflection = EM strikes a boundary between two media differing in η and bounces back
 Reflection = EM strikes a boundary between two media differing in η and bounces back Incident ray θ 1 θ 2 Reflected ray Medium 1 (air) η = 1.00 Medium 2 (glass) η = 1.50 Specular reflection = situation
Luminescence transitions. Fluorescence spectroscopy
 Luminescence transitions Fluorescence spectroscopy Advantages: High sensitivity (single molecule detection!) Measuring increment in signal against a dark (zero) background Emission is proportional to excitation
University of Cyprus. Reflectance and Diffuse Spectroscopy
 University of Cyprus Biomedical Imaging and Applied Optics Reflectance and Diffuse Spectroscopy Spectroscopy What is it? from the Greek: spectro = color + scope = look at or observe = measuring/recording
VALLIAMMAI ENGINEERING COLLEGE SRM Nagar, Kattankulathur
 VALLIAMMAI ENGINEERING COLLEGE SRM Nagar, Kattankulathur 603 203 DEPARTMENT OF ELECTRONICS AND INSTRUMENTATION ENGINEERING QUESTION BANK V SEMESTER EI6501 Analytical Instruments Regulation 2013 Academic
General Considerations 1
 General Considerations 1 Absorption or emission of electromagnetic radiation results in a permanent energy transfer from the emitting object or to the absorbing medium. This permanent energy transfer can
A Determination of DNA-DAPI Binding using Fluorescence Spectroscopy
 CHEM 311L Revision 1.2 A Determination of DNA-DAPI Binding using Fluorescence Spectroscopy In this Laboratory Exercise, we will determine the binding constant K f for complex formation between 4'-6-diamidino-2-phenylindole
Chemistry 311: Instrumentation Analysis Topic 2: Atomic Spectroscopy. Chemistry 311: Instrumentation Analysis Topic 2: Atomic Spectroscopy
 Atomic line widths: Narrow line widths reduce the possibility of spectral overlap and thus interferences. The band width at half height is used to indicate width. This is also sometimes called the effective
Lecture 5. More on UV-visible Spectrophotometry: Beer s Law and Measuring Protein Concentration
 Biological Chemistry Laboratory Biology 3515/Chemistry 3515 Spring 2018 Lecture 5 More on UV-visible Spectrophotometry: Beer s Law and Measuring Protein Concentration 23 January 2018 c David P. Goldenberg
Analytical Technologies in Biotechnology Prof. Dr. Ashwani K. Sharma Department of Biotechnology Indian Institute of Technology, Roorkee
 Analytical Technologies in Biotechnology Prof. Dr. Ashwani K. Sharma Department of Biotechnology Indian Institute of Technology, Roorkee Module - 6 Spectroscopic Techniques Lecture - 6 Atomic Spectroscopy
Spectroscopy: Introduction. Required reading Chapter 18 (pages ) Chapter 20 (pages )
 Chapter 20 (pages )") Spectroscopy: Introduction Required reading Chapter 18 (pages 378-397) Chapter 20 (pages 424-449) Spectrophotometry is any procedure that uses light to measure chemical concentrations Properties of Light
Spectroscopy: Introduction Required reading Chapter 18 (pages 378-397) Chapter 20 (pages 424-449) Spectrophotometry is any procedure that uses light to measure chemical concentrations Properties of Light
9/28/10. Visible and Ultraviolet Molecular Spectroscopy - (S-H-C Chapters 13-14) Valence Electronic Structure. n σ* transitions
 Valence Electronic Structure. n σ* transitions") Visible and Ultraviolet Molecular Spectroscopy - (S-H-C Chapters 13-14) Electromagnetic Spectrum - Molecular transitions Widely used in chemistry. Perhaps the most widely used in Biological Chemistry.
Visible and Ultraviolet Molecular Spectroscopy - (S-H-C Chapters 13-14) Electromagnetic Spectrum - Molecular transitions Widely used in chemistry. Perhaps the most widely used in Biological Chemistry.
Emission of Light: Discharge Lamps & Flame Tests 1
 Emission of Light: Discharge Lamps & Flame Tests 1 Objectives At the end of this activity you should be able to: o Describe how discharge lamps emit photons following electrical excitation of gaseous atoms.
Electromagnetic Waves
 4/15/12 Chapter 26: Properties of Light Field Induction Ok, so a changing magnetic field causes a current (Faraday s law) Why do we have currents in the first place? electric fields of the charges Changing