Adsorptive Capacity of Orange Peels and Zero Valent Iron Filings for Removal of Uranium and Arsenic Final Design Report
|
|
|
- Loraine Lucas
- 5 years ago
- Views:
Transcription
1 May 5 th, 2015 Adsorptive Capacity of Orange Peels and Zero Valent Iron Filings for Removal of Uranium and Arsenic Final Design Report PROJECT ENGINEERS: HUSSAIN ALKANDARI ABDULAZIZ ALSARAF MAKENZI BELTRAN JIAHAO ZHANG
2 TABLE OF CONTENTS List of Figures... 2 List of Tables... 2 Abbreviations... 3 Acknowledgements Project Description Project Purpose Existing Conditions Exclusions Background Information Adsorption Theory Experimental Design Experimental Matrix Safety, Sample Labeling, Shipping Protocols Experimental Methods Experimentation Material Preparation Orange Peels Filings Particle Size Distribution Analysis Sample Water Creation & Analysis Data Collection Data Analysis Batch Testing Results Isotherm Models Conclusions & Recommendations Project Impacts Summary of Project Costs References Appendices
3 LIST OF FIGURES Figure 1.0: Uranium and Arsenic Removal Data... 5 Figure 2.0: Adsorption System... 6 Figure 2.1: Freundlich Isotherm Model... 7 Figure 2.2: Example Langmuir Isotherm Plot [4]... 8 Figure 2.3: Example Langmuir Isotherm Plot [4]... 9 Figure 4.0: Orange Peels Distributed on Foil Trays Figure 4.1: Foil Trays in Drying Oven Figure 4.2: Filings Particle Size Distribution Graph Figure 4.3: Orange Peels Particle Size Distribution Graph Figure 5.0: Batch 1 Uranium Removal Figure 5.1: Batch 1 Arsenic-1 Removal Figure 5.2: Batch 1 Arsenic-2 Removal Figure 5.3: Batch 2 Uranium Removal Figure 5.4: Batch 2 Arsenic Removal Figure 5.5: Orange Peel Freundlich Isotherm Model Figure 5.6: Orange Peel Langmuir Isotherm Model Figure 5.7: Filings Freundlich Isotherm Model Figure 5.8: Filings Langmuir Isotherm Model Figure 8.0: Original Gantt Chart Figure 8.1: Final Gantt Chart LIST OF TABLES Table 3.0: Batch 1 Experimental Matrix Table 4.0: Water Quality Analysis Table 5.0: Batch 2 Experimental Matrix Table 5.1: Langmuir Isotherm Parameters Table 6.0: Example Scenarios
4 Table 8.0: Estimated Project Costs Table 8.1: Actual Project Costs ABBREVIATIONS As: Arsenic DI Water: Deionized Water EPA: Environmental Protection Agency MCL: Maximum Contaminant Level PPE: Personal Protective Equipment U: Uranium : Zero Valent Iron ACKNOWLEDGEMENTS Katharos Engineering would like to thank Dr. Paul Gremillion for his continuous technical guidance throughout the project, as well as for providing the team water from his home that is supplied by a well. We would also like to thank Dr. Michael Ketterer for running all of our samples for the uranium and arsenic concentrations. We would like to thank Gerjen Slim for allowing us to work in the NAU Water Quality Lab and providing any chemicals or lab materials the team required. We also want to thank Adam Bringhurst for his assistance on the water quality testing the team completed and Dr. Bridget Bero for her project guidance. 3
5 1.0 Project Description 1.1 Project Purpose The purpose of the Adsorptive Capacity of Orange Peels and Zero Valent Iron for Water Treatment project is to find the removal efficiency and rate of removal of orange peels for uranium and zero valent iron for arsenic from water. The goal is to conduct research in order to determine the maximum water volume and chemical concentrations the orange peels and zero valent iron can treat prior to exhaustion. Overall, this project will provide further data that supports this inexpensive and unique method for arsenic and uranium removal from drinking water. 1.2 Existing Conditions The testing conducted by the previous Low-Cost Water Filtration capstone team included preparing a water sample contaminated with various concentrations of arsenic and uranium and running the water through the selected treatment options. The synthetic water had an average uranium concentration of µg/l and an average arsenic concentration of µg/l in order to model the average chemical concentrations found at the Navajo Nation site the team was working with. The volumes of water tested included a 1 L, 3 L, 5 L, and 7 L samples of contaminated water. The orange peels removed uranium with a removal efficiency ranging from 99.03% to 99.39%, increasing with increased volume. The orange peels were not as effective at removing arsenic, with a removal efficiency ranging from 27.43% to 62.02%, decreasing with increased volume. The zero valent iron filings had a uranium removal efficiency ranging from 99.82% to 99.87%, and an arsenic removal efficiency ranging from 88.46% to 98.85% [1]. This data supports the uranium and arsenic removal capability of orange peels and zero valent iron filings. Figure 1.0 shows removal data of the original project. The red figures represent final concentrations above the maximum contaminant level (MCL) for the specific contaminant. The green figures represent final concentrations below the MCL. 4
![Figure 1.0: Uranium and Arsenic Removal Data [1] 1.](/docs-images/86/94419830/images/6-0.jpg "3 Exclusions Due to time constraints, this project did not include any testing for kinetics, or the rates of reaction, which is needed for final design of a filter.")
6 Figure 1.0: Uranium and Arsenic Removal Data [1] 1.3 Exclusions Due to time constraints, this project did not include any testing for kinetics, or the rates of reaction, which is needed for final design of a filter. Therefore, the design of a filter is also excluded from the project. 2.0 Background Information This project is a continuation of the Low-Cost Water Filtration capstone project completed from the previous capstone year [1]. The goal for the original capstone team was to design a water filter for the removal of uranium, arsenic, and bacteria. The water filter needed to be low-cost, electricity free, and needed to have the capability of removing the contaminants below their maximum contaminant limits (MCLs). The team explored several removal methods that included the use of orange peels and zero valent iron. However, the lack of adsorption capacity data of the orange peels and zero valent iron made the team unable to incorporate the materials into a water filter design. At the conclusion of the original capstone project, it was determined that orange peels were capable of removing uranium while zero valent iron was capable of removing both uranium and arsenic (see section 1.2 for removal efficiency data). Therefore, it was necessary to determine the actual capacity of the orange peels and zero valent iron in order to further the science in order to ultimately design a water filter utilizing the materials. 2.1 Adsorption Theory Adsorption is the process in which molecules of a given substance accumulate on the surface of a separate substance due to Van der Waals interactions. Unlike absorption, which is a chemical process where the molecules enter the bulk phase of the second substance, adsorption is a 5
-gas (G), L-L, solid (S)-L, and S-G, with S-G and S-L being the most common.")
7 physical process that occurs on the surface layer of the second substance. Since adsorption deals with the surface layer of a material, a higher surface area usually yields higher adsorption. The different adsorption processes include liquid (L)-gas (G), L-L, solid (S)-L, and S-G, with S-G and S-L being the most common. The adsorptive capacity of orange peels and filings for uranium and arsenic removal from water project is dealing with S-L adsorption. The term adsorptive refers to the molecule in bulk liquid phase being adsorbed onto the solid. The term adsorbate refers to the adsorptive molecules on the interfacial layer of the adsorbent, which is the substance causing adsorption. The terms sorptive, sorbent, sorbate, and sorption are used when both adsorption and absorption are taking place, or when the two cannot be distinguished. Figure 1 shows an image of the adsorption system [2]. Figure 2.0: Adsorption System With respect to the project, the adsorptive would be the water, the adsorbate would be either uranium or arsenic, and the adsorbent would be the orange peels or the filings. Adsorption is typically described through isotherms. Isotherms show the equilibrium relation between the amount of adsorbed material and the pressure or concentration in the bulk phase at a constant temperature [3]. An example of an isotherm model is the Freundlich isotherm, which is commonly used for drinking water and air treatment applications. The Freundlich isotherm equation is shown below. Equation 2.1: Freundlich Isotherm Equation 6
 The following figure shows a graph with various Freundlich isotherm intensity parameters plotted. Figure 2.")
8 Where, q = Mass of adsorbate per unit mass of adsorbent after equilibrium (mg/g) K = Freundlich isotherm capacity parameter ((mg/g)(l/mg)^(1/n)) C e = Equilibrium concentration of adsorbate (mg/l) 1/n = Freundlich isotherm intensity parameter (unitless) The following figure shows a graph with various Freundlich isotherm intensity parameters plotted. Figure 2.1: Freundlich Isotherm Model [3] In order to determine the K and 1/n values, a log plot must be created. The equation for the log plot is shown below. log q = log K + 1 log C n Equation 2.2: Freundlich Isotherm Log Equation Where, q = Mass of adsorbate per unit mass of adsorbent after equilibrium (mg/g) C = Equilibrium concentration of adsorbate (mg/l) The log values for q and C are then plotted, as shown in Figure
![Figure 2.2: Example Freundlich Isotherm Log Plot [3] A linear regression is used to determine the K and 1/n values, where K is 10 to the power of the y-intercept and 1/n is the slope. For Figure 2.](/docs-images/86/94419830/images/9-0.jpg "2, the K value would then be 10^0.761, or 5.77 (mg/g)(l/mg)^(1/n), and 1/n would be 0.6906.")
9 Figure 2.2: Example Freundlich Isotherm Log Plot [3] A linear regression is used to determine the K and 1/n values, where K is 10 to the power of the y-intercept and 1/n is the slope. For Figure 2.2, the K value would then be 10^0.761, or 5.77 (mg/g)(l/mg)^(1/n), and 1/n would be For Freundlich isotherm intensity parameters less than one, the isotherm is considered to be favorable for adsorption because lower concentrations of the adsorbate in the aqueous phase yield higher values of adsorption. Conversely, a Freundlich isotherm intensity parameter greater than one is considered to be unfavorable for adsorption. When the 1/n value is equal to one, the isotherm is considered a linear isotherm [3]. Another example of an isotherm model is the Langmuir isotherm model. The equation is shown below. q = Q 0K L C e 1+K L C e Equation 2.3: Langmuir Isotherm Model Where, q = Mass of adsorbate per unit mass of adsorbent after equilibrium (mg/g) Q 0 = maximum monolayer coverage capacity (mg/g) K L = Langmuir isotherm constant (L/mg) C e = Equilibrium concentration of adsorbate (mg/l) The linear form of the equation is shown below. 1 q = 1 Q Q 0 K L C e Equation 2.4: Linear Langmuir Isotherm Model By graphing 1/q vs 1/ C e, which are the variables of the experiment, Q o and K L are able to be determined by finding the slope and intercept of the graph. The following figure gives an example of a Langmuir isotherm graph. 8
10 Figure 2.3: Example Langmuir Isotherm Plot [4] The slope of these lines would be the 1/Q ok L value and the intercept of the lines would be the 1/Q o value. By solving for Q o by taking the inverse of the intercept, the K L term can then be solved for by using the value of the slope. The equilibrium parameter for the Langmuir isotherm, R L, can be found with the following equation. R L = Where, 1 1+(1+K L C o ) Equation 2.5: Langmuir Isotherm Equilibrium Parameter Equation C o = Initial concentration (mg/l) An R L value greater than 1 means the conditions are unfavorable for adsorption, linear if R L is equal to 1, favorable if R L is between 0 and 1, and irreversible if R L is equal to 0 [5]. An irreversible reaction is one that cannot be reversed, making it an absorbtion reaction instead of a reversible adsorption reaction. 3.0 Experimental Design 3.1 Experimental Matrix An experimental matrix was developed based upon pre-defined data quality needs. Specific parameters were varied throughout the experiment in order to obtain sufficient data for the isotherm models used for determining adsorption capacity. It was expected that significant parameters within each experiment include uranium and arsenic concentration, adsorbent material volume, and adsorbent particle size. Table 3.0 shows which parameters will be held constant and which parameters will be varied for each experiment. The sample identifiers are written in the cells under the replicates section. 9

11 Table 3.0: Batch 1 Experimental Matrix In order to determine how many variables and replicates would be required to obtain statistically significant data, Dr. Derek Sonderegger from Northern Arizona University s Statistical Consulting Lab was contacted. For adsorption testing, it is necessary to obtain data at removal efficiencies below 100% in order to determine a representative q value, as discussed in section 2.1. The goal for batch 1 is to determine a range of adsorbent masses that will yield data in the desired range. Dr. Sonderegger stated that in order to find this range, a minimum of three masses is required. Estimates of a mass that will yield below 100% removal and two separate masses that will yield 100% removal were the overall goal. Dr. Sonderegger also stated that in order to find the amount of replicates needed for statistically significant data, a variance must be known. Due to the lack of existing data on orange peels and filings as adsorbent materials, there was no expected variance. For the first batch 3 replicates were run in order to get a better understanding of the variance and then the number of replicates that will be necessary for the second batch of data will be determined. Furthermore, since the first batch was going to be exploratory and the second batch would include the refined values that would be used for the isotherm models, it was advised to dedicate 30% of the samples for the first batch and 70% of the samples for the second batch. 3.2 Safety, Sample Labeling, Shipping Protocols A lab safety plan was created prior to beginning lab work. This served as a contract that Katharos Engineering had completed the required training to work in the lab, that personal protective equipment (PPE) would be worn when necessary, and that all hazardous materials would be handled and disposed of properly. Furthermore, all of the samples would be labeled properly to avoid confusion and error within the lab. Outlining the 10
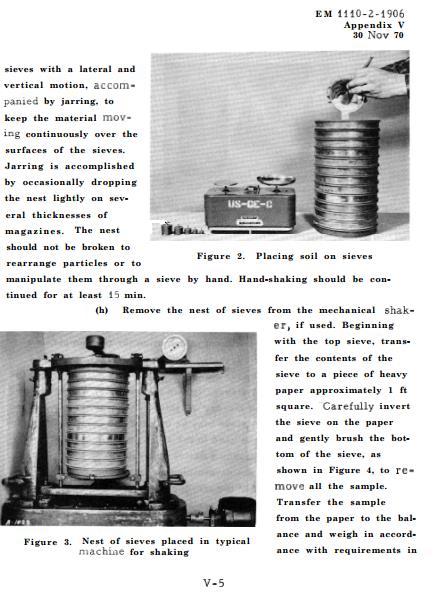
12 shipping protocols was also included in the lab safety plan to avoid complications throughout the sample shipment process and in turn create errors with the sample analysis. The lab safety plan and the signed contract can be found in Appendix A. 3.3 Experimental Methods Batch experiments were conducted in order to determine the adsorption capacity. The materials list for the batch experiments can be found below. Magnetic stir plate Magnetic capsules and stir bars 250 ml Erlenmeyer flasks 50 ml volumetric pipettes Pipette bulbs The predetermined orange peels and filings masses were weighed out using an electronic weighing station. The masses of the orange peels and filings were then placed inside the respective 250 ml Erlenmeyer flasks. Using the 50 ml volumetric pipettes and pipette bulbs, 100 ml of the solution was then poured into the respective 250 ml Erlenmeyer flask. The magnetic capsule was then slid into the 250 ml Erlenmeyer flask and then placed on top of the magnetic stir plate. The magnetic stir plate stayed on 350 rpm for 24 hours, at which point the samples were removed and prepared for shipment. 4.0 Experimentation 4.1 Material Preparation Orange Peels Approximately 20 medium navel oranges were purchased from a local grocery store that were to be prepared for the experiment. The orange peels were initially cut to an approximate size of 1 cm 1 cm and then rinsed in DI water. Three flat sheets of aluminum foil were then prepared and the orange peels were distributed evenly on each sheet and then placed in a drying oven set to 105, as shown in Figure 4.0 and Figure 4.1. After a 12 hour period, the orange peels were removed from the drying oven. The peels were then chopped using a blender for approximately 30 minutes, or until there was no longer any visible changes in the size of the peels. 11


13 Figure 4.0: Orange Peels Distributed on Foil Trays Figure 4.1: Foil Trays in Drying Oven 12
14 % Finer Filings The fillings were purchased through Amazon. The brand was Science Magnets, 12oz. Iron filings. The only material preparation associated with the filings was saturating the filing with DI water in order to remove any possible dust particles from the surface of the filings Particle Size Distribution Analysis A dry sieve analysis was conducted for both the orange peels and the filings in order to determine the particle sizes being used throughout the experiment. The USACE EM_ Appendix V method was used for the sieve analysis procedure, and can be found in Appendix B. Figure 4.2 shows the particle size distribution for the filings. However, all sizes of the filings were used in testing. The sieve analysis was conducted solely to determine how the particle sizes were distributed. Filings Particle Size Distribution Particle Size (um) Figure 4.2: Filings Particle Size Distribution Graph Figure 4.3 shows the particle size distribution for the orange peels. As shown, the majority of the orange peels were less than 600 um, or no. 30 US Standard Sieve size. Since the orange peels required preparation, the goal was to keep the size practical for an average household to create. As the majority of the orange peels were retained on the no. 30 sieve, this was the selected orange peel size used throughout the testing. This particle size falls under the range for a sand classification. All of the orange peels that were retained on the remaining sieves were not used for any portion of the testing. 13
15 % Finer Orange Peels Particle Size Distribution Particle Size (um) Figure 4.3: Orange Peels Particle Size Distribution Graph 4.2 Sample Water Creation & Analysis As preferred by the client, the team focused on obtaining a well water source for testing. Dr. Paul Gremillion provided tap water from his home which comes directly from a well water source. Dr. Gremillion also transported the water from his home to the NAU CECMEE Environmental Water Quality Lab. The sample water was created using the dilution equation shown below. C 1 V 1 = C 2 V 2 Where, C = Concentration of uranium or arsenic (mg/l) V = Volume (ml) The materials list used for creating the sample can be found below ml volumetric flasks 1000 ml Erlenmeyer flasks 1 ml, 10 ml, 50 ml volumetric pipettes Pipette bulbs Parafilm The uranium and arsenic standards used for the lab both have a concentration of 10,000 µg/ml (V 2). The volume of the solutions that were prepared are 1000 ml (V 1). The C 1 concentrations were the predetermined initial uranium and arsenic concentrations. The variable that was solved for, V 2, was the volume of the standard required to create the 14
16 solutions. Using 1000 ml volumetric flasks, the flask was filled with the calculated V 2 value of the standard solution and then filled to the 1000 ml mark with the well water sample. The solution was then transferred to a 1000 ml Erlenmeyer flask, covered in parafilm, and stored in the fume hood. For Batch 1, three stock solutions were created of uranium and arsenic all at 1000 ml. The concentrations were 100 mg U/L, 10 mg As/L, and 50 mg As/L. Basic water quality parameters were tested for the well water including hardness, alkalinity, and ph. Hardness testing was done using HACH Method 8226, alkalinity testing was done using HACH Method 8221, and ph was determined using a ph meter. The following table shows the average results found after three runs of each test. Table 4.0: Water Quality Analysis ph 7.52 Hardness Alkalinity mg CaCO3/L 26.6 mg CaCO3/L 4.3 Data Collection The data collected for the experiments include the initial and final concentrations of uranium and arsenic. The test samples were shipped to Dr. Michael Ketterer, Chemistry Department Professor and Chair at the Metropolitan State University of Denver. Dr. Ketterer tested the samples for uranium and arsenic using the ICP-MS (Inductively Coupled Plasma Mass Spectrometry) lab technique. Raw data was sent back to Northern Arizona University, where Dr. Gremillion helped in decoding the data into the desired uranium and arsenic concentration values. 5.0 Data Analysis 5.1 Batch Testing Results At the conclusion of first batch tests, graphs were created in order to determine the range of removal and the variance of the results. The following graphs show the results for the uranium and arsenic removal, as well as the initial concentrations of the chemical. 15
17 As Removed (%) U Removed (%) Uranium Removed (Initial Conc: mg/l) Mass OP (g) Figure 5.0: Batch 1 Uranium Removal The results for the uranium removal showed that there was no significant variance between replicates. With at least two of the replicates nearly identical and only one outlier, it was decided that for the second batch of uranium testing there would also be three replicates per sample. With regards to removal efficiencies, there was no removal above 80% and there was also not a large range of removal. It was decided the second batch of uranium tests would need to include a much broader range of masses. 120 Arsenic Removed (Initial Conc: 13.2 mg/l) Mass (g) Figure 5.1: Batch 1 Arsenic-1 Removal 16
18 As Removed (%) Arsenic Removed (Initial Conc: 70.2 mg/l) Mass (g) Figure 5.2: Batch 1 Arsenic-2 Removal On average, the results for the arsenic removal had an even smaller variance than uranium with the exception of the 0.65 g of filings for the 70.2 mg As/L initial concentration. This mass produced quite a large variance, and it is unsure if this was a lab or machine error. Due to the risk of a larger variance, it was decided that for arsenic there would also be three replicates per sample. The removal efficiencies for both initial concentrations of arsenic were also all near 100%. This indicated that much smaller masses would need to be used for the second batch of tests. Since smaller masses would be used for filings, it was decided that the smaller initial concentration of arsenic would be used for the second batch in order to keep the mass sizes practical. The following table shows the final experimental matrix for the second batch. 17

19 Table 5.0: Batch 2 Experimental Matrix The masses highlighted in yellow represent the minimum mass used for the first batch and the masses highlighted in orange show the maximum mass used in the first batch. For the orange peels, reaching a removal efficiency higher than 80% was attempted by increasing the mass amounts. However, the lack of range did result in using much smaller mass amounts as well. For the filings, the maximum mass that was used in the first batch was not considered in the second batch. Instead, the minimum mass for the first batch was taken to be the near maximum for the second batch and the remaining masses were decreased. The following graphs show the removal efficiencies for the second batch of tests. 18
20 Arsenic Removed (%) Uranium Removed (%) Uranium Removed (Initial Conc: 96.6 mg/l) Mass OP (g) Figure 5.3: Batch 2 Uranium Removal 120 Arsenic Removed (Initial Conc: 10.2 mg/l) Mass (g) Figure 5.4: Batch 2 Arsenic Removal The results for the second batch had the desired broad range of removal. At the conclusion of the second batch, the isotherm models were created. 5.2 Isotherm Models The orange peel data was fit into the Freundlich and Langmuir Isotherm Models using Equations 2.2 and 2.4, respectively. The following graphs show the final isotherm models for the orange peels. 19
21 1/q (g/mg) log (q) (mg/g) Orange Peel Freundlich Isotherm Model y = x R² = log (Ce) (mg/l) Figure 5.5: Orange Peel Freundlich Isotherm Model Orange Peel Langmuir Isotherm Model y = x R² = /Ce (L/mg) Figure 5.6: Orange Peel Langmuir Isotherm Model The regression coefficient, or R 2 value, was much closer to 1 for the Langmuir Isotherm model meaning this was the better fit isotherm. Similarly, the filings data was fit into the two different isotherm models. 20
22 1/q (g/mg) log (q) (mg/g) Filings Freundlich Isotherm Model y = x R² = log (Ce) (mg/l) Figure 5.7: Filings Freundlich Isotherm Model Filings Langmuir Isotherm Model y = x R² = /Ce (L/mg) Figure 5.8: Filings Langmuir Isotherm Model The filings data also had a regression coefficient closer to 1 for the Langmuir Isotherm model, indicating it was the better fit. The raw data used for the isotherm models can be found in Appendix C. The remaining analysis was conducted using the Langmuir Isotherm parameters, shown in the table below. 21
23 Table 5.1: Langmuir Isotherm Parameters Orange Peels Filings Q O (mg/g) K L (L/mg) E-3 R L (unitless) The maximum adsorption capacity, Q O, shows how much the material is capable of adsorbing. The Langmuir isotherm constant, K L, is used to calculate the Langmuir Isotherm Equilibrium Parameter, R L, which indicates the favorability of adsorption. An R L value in the range from 0 to 1 indicates the material is favorable for adsorption. The orange peels and the filings were both determined to be favorable for adsorption. 6.0 Conclusions & Recommendations At the conclusion of the data analysis, it was established that orange peels and filings are favorable for adsorption of uranium and arsenic, respectively. Two example scenarios were created in order to show the required mass of material to remove a specific amount of uranium or arsenic. The table below outlines the two separate scenarios. Table 6.0: Example Scenarios Scenario #1 Orange Peel Scenario #2 Filings Initial Chemical Concentration 90 µg Uranium/L 70 µg Arsenic/L Desired Final Chemical Concentration 30 µg Uranium/L 10 µg Arsenic/L Adsorption Capacity (q) mg U/g OP 0.38 mg As/g filings Required Mass of Material for 10L of Contaminated Water g OP 1.58 g filings The initial concentrations were based off of the average chemical concentrations found at the Navajo Nation site from the previous year s team. The desired final concentrations are the EPA MCL s for uranium and arsenic. The adsorption value, q, was calculated based off of the isotherm models. The required mass of material to treat 10L of contaminated water calculated in order to give a representation of the removal efficiency of the material. It is recommended that the materials are tested for kinetics before being incorporated into water filter design. 22
24 7.0 Project Impacts Uranium and arsenic are naturally occurring metals in the environment, and are often found at unhealthy levels on sites that have been impacted by activities such as mining. Levels of uranium and arsenic that exceed the EPA MCL s have negative human and ecological health effects. Conducting research on potential treatment materials for the chemicals can help eliminate these negative effects. Often times the public is not aware of the conditions at these contaminated sites, even if they live nearby. A project that is focusing on finding treatment methods for metal contamination can be a source of awareness to the public on these contaminated sites and the need for remediation. Similarly, this research has the potential to promote the findings of other sustainable water treatment methods. This is crucial for rural areas and developing countries that are also suffering from drinking water contamination, as it gives them a more accessible form of water treatment. 8.0 Summary of Project Costs The original Gantt chart can be found in Figure 8.0 below. Although there were no changes to the task list, the dates of some of the tasks changed considerably. The final Gantt chart can be found in Figure
25 Figure 8.0: Original Gantt Chart [6] 24

26 Figure 8.1: Final Gantt Chart 25
27 There were some issues in beginning the lab work, as coordinating the required meetings to begin working in the lab proved to be more difficult than anticipated. Further issues arose when the results for the second batch took much longer to arrive than the original two week time period that was given. Fortunately, all of the data arrived with time to complete all of the analysis for the project in order to still meet the project deadline as shown in the final Gantt chart. The following tables show the estimated project costs and the actual project costs. The classifications are as follows: senior engineer (SENG), engineer (ENG), lab technician (LAB), intern (INT), administrative assistant (AA). Table 8.0: Estimated Project Costs [6] Item Classification Hours Rate $/hr Cost 1.0 Personnel SENG $16,336 ENG $25,907 LAB $3,450 INT $3,371 AA $4,847 Total Personnel 752 $53, Subcontract Analytical 150 samples + 2 shipments $ Total $54,211 26
28 Table 8.1: Actual Project Costs Item Classification Hours Rate $/hr Cost 1.0 Personnel SENG $6,716 ENG $17,253 LAB $2,160 INT $264 AA $3,050 Total Personnel 377 $29, Subcontract Analytical 150 samples + 2 shipments $ Materials Orange Peels & Filings $60 Total Cost $29,803 The assigned hours were greatly overestimated, as the final total project hours was 377 instead of the anticipated 752. This was largely due to the overestimation of hours worked in the lab. The batch testing procedures performed did not require as much man-hours as originally anticipated. The cost of materials was also not calculated into the estimated project cost, although it was in the actual project costs. This left the actual project costs at a total of $29,803 versus the estimated $54,211.
29 8.0 References [1] D. Cummings, C. Dilks, Y. Sun, & T. Weir, Final Design Report: Water Filter for Uranium, Arsenic and Bacteria Removal, Northern Arizona University, Flagstaff, Arizona. May 1st, [2] A. Dabrowski, Adsorption from theory to practice, Faculty of Chemistry, M. Curie- Skodowska University., Lublin, Poland., [3] J.R. Mihelcic and J.B. Zimmerman, Chemistry, in Environmental Engineering: Fundamentals, Sustainability, Design, 1st ed. Hoboken, NJ: John Wiley & Sons, Inc., 2010, ch. 3, sec. 10, pp [4] S. K. Bajpai and A. Jain, Equilibrium and Thermodynamic Studies for Adsorption of Crystal Violet onto Spent Tea Leaves (STL), Water Journal., Nov Doi: /WATER [5] A.O. Dada, A.P. Olalekan, A.M. Olatunya, Langmuir, Freundlich, Temkin and Dubinin- Radushkevich Isotherms Studies of Equilibrium Sorption of Zn 2+ Unto Phosphoric Acid Modified Rice Husk, IOSR Journal of Applied Chemistry vol. 3 issue 1., Nov-Dec [6] H. Alkandari, A. Alsaraf, M. Beltran, & J. Zhang, Adsorptive Capacity of Orange Peels and Zero Valent Iron Filings for the Removal of Uranium and Arsenic, Northern Arizona University, Flagstaff, Arizona. December, Appendices
30 Appendix A: Lab Safety Plan
31 Northern Arizona University Adsorptive Capacity of Orange Peels and Zero Valent Iron Filings Project Lab Safety Plan February 3 rd, 2015
32 Table of Contents 1.0 Overview Laboratory Facilities Shower & Eye Wash Station Fume Hoods Chemical Hygiene Chemical Handling Personal Protective Equipment Labeling Accidents Laboratory Training Waste Disposal Material Safety Data Sheets Appendices Appendix A: Contract Appendix B: Lab Training Certifications... 12
 Environmental Engineering Lab (Building 69, Room 245).")
33 1.0 Overview The goal of the lab safety plan is to promote safety throughout the project. The lab work will be conducted in the Northern Arizona University (NAU) Environmental Engineering Lab (Building 69, Room 245). This lab safety plan will include the facilities the lab offers for safety purposes. The lab safety plan will also review chemical hygiene information. This includes proper chemical handling, the personal protective equipment that must be worn, proper sample labeling, accidents response, the necessary lab training that must be completed to work in the lab, and the proper waste disposal methods. Each individual team member will be required to review the lab safety plan and sign a contract stating they have read and agree with all of the lab work requirements. This contract can be found in Appendix A. 2.0 Laboratory Facilities 2.1 Shower & Eye Wash Station There are two shower and eye wash stations located in room 245, one on the north section and one in the south section of the lab. Instructions on how to use the shower and eye wash station are shown in the figures below. If eye contact occurs with the chemical, the eyes must be flushed with water at the eye wash station for at least 15 minutes. Figure 6: Shower & Eye Wash Station Room 245, North Side


34 Figure 7: Shower & Eye Wash Station Room 245, South Side Figure 8: Shower & Eye Wash Station, Shower Instructions


35 Figure 9: Shower & Eye Wash Station, Eye Wash Instructions As shown in Figure 3, in order to use the shower station the individual must stand underneath the shower head and pull on the triangular handle. As shown in Figure 4, in order to use the eye wash station the individual must stand over the station with eyes lined up with the respective water outlets and push on the paddle to the right of the station. 2.2 Fume Hoods There is one fume hood located in room 245, as shown in the figure below. The fume hood provides the ventilation required for the use of chemicals. All of the arsenic and uranium solutions will be stored in the fume hood for the duration of the tests. Figure 10: Fume Hood Room 245
36 3.0 Chemical Hygiene 3.1 Chemical Handling When handling uranium and arsenic chemicals, personal protective equipment must be worn at all times and any contact with skin, eyes, and clothing must be avoided. All arsenic and uranium solutions must be sealed and stored under a fume hood. Inhalation and ingestion must also be avoided. 3.2 Personal Protective Equipment The personal protective equipment that must be worn while conducting lab work includes lab coats and gloves for hand and body protection, and goggles for eye protection. If the student already wears eye glasses for vision correction, there are eye goggles meant to be worn over prescription glasses available in the lab. Additionally, closed toed shoes must be worn at all times and individuals with long hair must tie their hair back. 3.3 Labeling All solutions must be clearly labeled with the concentration of the chemical, the date the solution was created, and the name of the team. All of the samples that will be used throughout the adsorption testing must be clearly labeled with the concentrations of the chemical, the adsorbate, mass of adsorbate, particle size of adsorbate, and the name of the team. 3.4 Accidents Should a spill of any uranium or arsenic solution occur, it should be absorbed with a liquidbinding material. The material should then be disposed of by the methods set by the Northern Arizona University s Environmental Health and Safety program (see section 3.6). If eye contact with any uranium or arsenic occurs, rinse opened eyes at the eye wash station for at least 15 minutes. If skin contact with any uranium or arsenic occurs, wash skin with plenty of soap and water, rinsing thoroughly, for at least 15 minutes. If inhalation of any uranium or arsenic occurs, the individual should move to fresh air immediately. If there is difficulty breathing, do not conduct mouth-to-mouth resuscitation, instead seek immediate medical attention. If ingestion of any uranium or arsenic occurs, do not induce vomiting and seek immediate medical attention. 3.5 Laboratory Training There is required laboratory training that must be completed prior to working in the lab. In order to be able to work in the lab, each individual must have completed the Chemical Hygiene and Field Safety Training setup through Northern Arizona University s Environmental Health and Safety program. Certifications of training completion for each team member can be found in Appendix B.
37 3.6 Waste Disposal The waste disposal methods are dependent on the Northern Arizona University s Environmental Health and Safety program. Decisions on how to properly dispose of the wastewater will be based upon the concentrations and volumes of uranium and arsenic that will be used throughout the lab. 4.0 Material Safety Data Sheets The Material Safety Data Sheets (MSDS) for the arsenic and uranium standards can be found in the MSDS binders at the Right-To-Know station located in the north section of Room Appendices
38 5.1 Appendix A: Contract


39 5.2 Appendix B: Lab Training Certifications Hussain Alkandari: Abdulaziz Alsaraf:


40 Makenzi Beltran: Jiahao Zhang:
41 Appendix B: Dry Sieve Analysis Method

42

43

44

45
46

47
48

49
50 Appendix C: Isotherm Model Data
51 Material Mass Ce Co Co-Ce q 1/q 1/Ce log q log Ce g mg/l mg/l mg/l mg/g g/mg L/mg mg/g mg/l OP OP OP OP OP OP OP OP OP OP OP OP OP OP OP OP OP OP OP OP OP OP OP OP OP OP OP OP OP OP OP OP OP OP OP OP OP OP OP
52 OP OP OP OP OP OP Filings Filings Filings Filings Filings Filings Filings Filings Filings Filings Filings Filings Filings Filings Filings Filings Filings Filings Filings Filings
53 Filings Filings Filings Filings Filings Filings Filings Filings Filings Filings Filings Filings Filings Filings Filings Filings Filings Filings Filings Filings Filings Filings Filings
54 Filings Filings Filings Filings Filings Filings Filings
Nanoparticle Safety Program
 Environmental Health & Safety 1314 Kinnear Rd. Columbus, Ohio 43212 Phone (614) 292-1284 Fax (614) 292-6404 http://www.ehs.osu.edu/ Nanoparticle Safety Program Prepared by: The Ohio State University Environmental
Safety in the Chemistry Laboratory
 Safety in the Chemistry Laboratory CHAPTER1 Safety must be everyone s primary concern in the chemistry lab. Understanding and following all safety rules in the organic chemistry lab is critical to your
Objective: Science Classroom Laboratory Safety
 Science Classroom Laboratory Safety Objective: Learn safety rules for working with chemicals and participating in a safe manner when carrying out lab procedures. Complete the safety and equipment assignment
GUIDELINES FOR THE SAFE USE OF PYROPHORIC LIQUID REAGENTS
 Page 1 of 5 GUIDELINES FOR THE SAFE USE OF Pyrophoric liquid reagents are substances that spontaneously ignite when exposed to air and/or moisture. These reagents are commonly utilized in chemical synthesis
3. Chemical Hygiene Plan: Laboratory Standard Operating Procedures. A. Laboratory Specific Information and Signatures
 3. Chemical Hygiene Plan: Laboratory Standard Operating Procedures A. Laboratory Specific Information and Signatures The Chemical Hygiene Plan: Laboratory Standard Operating Procedures (section 3 only),
Hach Method Total Organic Carbon in Finished Drinking Water by Catalyzed Ozone Hydroxyl Radical Oxidation Infrared Analysis
 Hach Method 1061 Total Organic Carbon in Finished Drinking Water by Catalyzed Ozone Hydroxyl Radical Oxidation Infrared Analysis Hach Company Method 1061 Revision 1. December 015 Organic Carbon in Finished
Green Chemistry in the Undergraduate Organic Laboratory: Microwave-Assisted Synthesis of a Natural Insecticide on Basic Montmorillonite K10 Clay
 LAB PRCEDURE: Green Chemistry in the Undergraduate rganic Laboratory: Microwave-Assisted Synthesis of a Natural Insecticide on Basic Montmorillonite K10 Clay Matthew R. Dintzner*, Paul R. Wucka and Thomas
EOSMS Guidelines Date: 01/16/2014 Page 1 of 5
 EOSMS Guidelines Date: 01/16/2014 Page 1 of 5 Introduction The Department of Environmental Health, Safety has developed generic standard operating procedures relevant to safety and health considerations
Experiment#1 Beer s Law: Absorption Spectroscopy of Cobalt(II)
") : Absorption Spectroscopy of Cobalt(II) OBJECTIVES In successfully completing this lab you will: prepare a stock solution using a volumetric flask; use a UV/Visible spectrometer to measure an absorption
: Absorption Spectroscopy of Cobalt(II) OBJECTIVES In successfully completing this lab you will: prepare a stock solution using a volumetric flask; use a UV/Visible spectrometer to measure an absorption
Key points. Discuss why contact lenses are not allowed in the chemical laboratory. Short pants Skirt Scandals Open-toed shoes
 (a) Personal protective equipment When you are working in a chemical laboratory, explain the purposes of wearing different types of personal protective equipment Discuss why contact lenses are not allowed
Hach Method Spectrophotometric Measurement of Free Chlorine (Cl 2 ) in Finished Drinking Water
 in Finished Drinking Water") Hach Method 1041 Spectrophotometric Measurement of Free Chlorine (Cl ) in Finished Drinking Water Hach Company Method 1041 Revision 1. November 015 Spectrophotometric Measurement of Free Cl in Finished
Hach Method 1041 Spectrophotometric Measurement of Free Chlorine (Cl ) in Finished Drinking Water Hach Company Method 1041 Revision 1. November 015 Spectrophotometric Measurement of Free Cl in Finished
Facilities Management
 Policy Number: 700.20 Title: Chemical Fume Hood Policy Implementation Date: 2002 Last Audited: August, 2017 Last Revised: October 23rd, 2017 Facilities Management Introduction The laboratory chemical fume
Bisphenol A ELISA Kit
 Bisphenol A ELISA Kit Catalog Number KA1495 96 assays Version: 11 Intended for research use only www.abnova.com Table of Contents Introduction... 3 Intended Use... 3 Principle of the Assay... 3 General
Microcystin-LR ELISA Kit
 Microcystin-LR ELISA Kit Catalog Number KA1496 96 assays Version: 06 Intended for research use only www.abnova.com Table of Contents Introduction... 3 Intended Use... 3 Principle of the Assay... 3 General
Chemistry Lab Safety
 Slide 1 / 23 Slide 2 / 23 Chemistry Lab Safety 2015-10-27 www.njctl.org Slide 2 (Answer) / 23 Teacher Notes Click the link on the bottom of slide 3 to see a 10 minute lab safety video. Chemistry Identify
Approximate Volatile Acids by Titration
 SOP AMBL-101-A Page 1 of 5 Standard Operating Procedure AMBL-101-A Prepared: April 12, 2006 Revised: July 16, 2014 Prepared by: Terry E. Baxter Reviewed by: Approximate Volatile Acids by Titration METHOD
Microcystin-LR ELISA Kit
 Microcystin-LR ELISA Kit Catalog Number KA1496 96 assays Version: 10 Intended for research use only www.abnova.com Table of Contents Introduction... 3 Intended Use... 3 Principle of the Assay... 3 General
Schools Analyst Competition
 Royal Society of Chemistry Analytical Division North West Region Schools Analyst Competition March 2012 Experimental Handbook 1 SCHOOLS ANALYST COMPETITION 2012 In this year s challenge your task is to
aa + bb cc + dd Equation 1
 Experiment: The Determination of K eq for FeSCN 2+ Introduction For any reversible chemical reaction at equilibrium, the concentrations of all reactants and products are constant or stable. There is no
Revision: 11 (MBAS) ALLOWAY METHOD OUTLINE. Standard Laboratory Method:
 ALLOWAY METHOD OUTLINE. Standard Laboratory Method:") ALLOWAY METHOD OUTLINE Standard Laboratory Method: SM Parameter: Methylene Blue Method: Colorimetric Reporting Level: Reference: 0.05 mg/l Standard Methods for the Examination Of Water and Wastewater;
ALLOWAY METHOD OUTLINE Standard Laboratory Method: SM Parameter: Methylene Blue Method: Colorimetric Reporting Level: Reference: 0.05 mg/l Standard Methods for the Examination Of Water and Wastewater;
METHOD 7B - DETERMINATION OF NITROGEN OXIDE EMISSIONS FROM STATIONARY SOURCES (ULTRAVIOLET SPECTROPHOTOMETRIC METHOD)
") 683 METHOD 7B - DETERMINATION OF NITROGEN OXIDE EMISSIONS FROM STATIONARY SOURCES (ULTRAVIOLET SPECTROPHOTOMETRIC METHOD) NOTE: This method does not include all of the specifications (e.g., equipment and
683 METHOD 7B - DETERMINATION OF NITROGEN OXIDE EMISSIONS FROM STATIONARY SOURCES (ULTRAVIOLET SPECTROPHOTOMETRIC METHOD) NOTE: This method does not include all of the specifications (e.g., equipment and
Sorption of metals on biological waste material
 Research Centre Rez Sorption of metals on biological waste material Lucia Rozumová SWWS 2016, September 14-16, 2016, Athens, Greece Goals Low-cost biological material orange peel; Possible replacement
Chemical Hygiene Plan for Laboratories
 SAFETY POLICIES AND PROCEDURES MANUAL LABORATORY SAFETY 4.12.1 OVERVIEW Washington State University has developed the chemical hygiene plan to aid units in promoting a high standard of health and safety.
HHPS WHMIS. Rules MSDS Hazard Codes Systems. Biology based. Chemistry based. Safety Symbols. Safety in the Lab. Lab Equipment
 Safety Symbols HHPS WHMIS Safety in the Lab Rules MSDS Hazard Codes Systems Lab Equipment Chemistry based Biology based Safety Symbols We will be discussing two types of Information Systems Hazardous Household
REMOVAL OF HEAVY METALS USING COMBINATION OF ADSORBENTS - A CASE STUDY USING INDUSTRIAL WASTE WATER
 REMOVAL OF HEAVY METALS USING COMBINATION OF ADSORBENTS - A CASE STUDY USING INDUSTRIAL WASTE WATER PROJECT REFERENCE NO. : 37S1399 COLLEGE : DAYANANDA SAGAR COLLEGE OF ENGINEERING, BANGALORE BRANCH :
Separating the Mixture
 Separating the Mixture 40- to 1 50-minute session ACTIVITY OVERVIEW I N V E S T 5 I O N I G AT Students perform their procedures written in Activity 3, A Plan to Separate the Mixture, to physically separate
CHEMICAL SAFETY TRAINING LEADER GUIDE. Chemical Safety Training Leader Workbook 1
 CHEMICAL SAFETY TRAINING LEADER GUIDE Chemical Safety Training Leader Workbook 1 TABLE OF CONTENTS Part 1: Program Introduction... i Part 2: Modules... 1 CHEMICAL SAFETY TRAINING Chemical Safety Training
The Thermodynamics of the Solubility of Borax
 Experiment 10 Pre-Lab Assignment Before coming to lab: Read the lab thoroughly. Answer the pre-lab questions that appear at the end of this lab exercise. The questions should be answered on a separate
CHEMISTRY 130 General Chemistry I OXIDATION-REDUCTION CHEMISTRY
 CHEMISTRY 130 General Chemistry I OXIDATION-REDUCTION CHEMISTRY A solution of potassium permanganate is pink. [1] Color changes can often be used to monitor chemical reactions. DEPARTMENT OF CHEMISTRY
University of Tennessee Safety Procedure
 University of Tennessee Safety Procedure Program Subject: Chemicals Requiring Review Prior to Use Procedure Review/Revised: 12/15/08 Affected Area/Department: Laboratories at the University Date Effective:
Titration with an Acid and a Base
 Skills Practice Titration with an Acid and a Base Titration is a process in which you determine the concentration of a solution by measuring what volume of that solution is needed to react completely with
Exercise 4-3. Titration of Weak Acids EXERCISE OBJECTIVE DISCUSSION OUTLINE. The 5% rule DISCUSSION
 Exercise 4-3 Titration of Weak Acids EXERCISE OBJECTIVE Titrate both a weak acid solution and a weak polyprotic acid solution with a strong base solution. Plot a graph using the titration data, analyze
Density of Aqueous Sodium Chloride Solutions
 Experiment 3 Density of Aqueous Sodium Chloride Solutions Prepared by Ross S. Nord and Stephen E. Schullery, Eastern Michigan University PURPOSE Determine the concentration of an unknown sodium chloride
Lab 1: Safety Lab; Introduction to Volumetric and Weighing Techniques
 Lab 1: Safety Lab; Introduction to Volumetric and Weighing Techniques Objectives: 1. Be aware of safety practices, procedures outlined in the safety video. 2. Introduction to WHMIS and MSDS. 3. Locate
GPS Safety Summary Acetic Acid
 GPS Safety Summary Acetic Acid Chemical Identity Name: Acetic acid CAS number: 64 19 7 Molecular formula: C 2 H 4 O 2 IUPAC name: Acetic acid BASF brand names: Acetic acid Structure For synonyms see end
Chemical Reactions: The Copper Cycle
 1 Chemical Reactions: The Copper Cycle ORGANIZATION Mode: pairs assigned by instructor Grading: lab notes, lab performance and post-lab report Safety: Goggles, closed-toe shoes, lab coat, long pants/skirts
Plant Indicators for Acids and Bases
 SCIENCE EXPERIMENTS ON FILE Revised Edition 5.28-1 Plant Indicators for Acids and Bases Carole R. Goshorn Topic Acid/base indicators Time Preparation by teacher 50 minutes; Part B, 45 minutes! Safety Adult
STANDARD OPERATING PROCEDURES
 STANDARD OPERATING PROCEDURES for Spectrophotometric Measurement Chl a, Chl b, and Bulk Carotenoids using Methanol Solvent Prepared by EcoAnalysts, Inc. 1420 South Blaine Street, Suite 14 Moscow, ID 83843
DARKROOM HAZARDOUS WASTE MANAGEMENT GUIDE
 BINGHAMTON UNIVERSITY DARKROOM HAZARDOUS WASTE MANAGEMENT GUIDE Revised October 2005 IN CASE OF EMERGENCY: DIAL 911 This booklet will provide you with the information you need in order to run a safe and
Material Safety Data Sheet acc. to ISO/DIS 11014
 Page 1/5 1 Identification of substance: Catalog number: 248810 Manufacturer/Supplier: BD Diagnostic Systems 7 Loveton Circle Sparks, MD 21152 Tel: (410) 771-0100 or (800) 638-8663 Information department:
Material Safety Data Sheet acc. to ISO/DIS 11014
 Page 1/5 1 Identification of substance: Catalog number: 212185 Manufacturer/Supplier: BD Diagnostic Systems 7 Loveton Circle Sparks, MD 21152 Tel: (410) 771-0100 or (800) 638-8663 Information department:
Hach Company TNTplus 835/836 Nitrate Method Spectrophotometric Measurement of Nitrate in Water and Wastewater
 Hach Company TNTplus 835/836 Nitrate Method 10206 Spectrophotometric Measurement of Nitrate in Water and Wastewater Hach Company TNTplus 835/836 Method 10206 Revision 2.2 January 15, 2013 Spectrophotometric
CHEMISTRY 130 General Chemistry I OXIDATION-REDUCTION CHEMISTRY
 CHEMISTRY 130 General Chemistry I OXIDATION-REDUCTION CHEMISTRY A solution of potassium permanganate is pink. [1] Color changes can often be used to monitor chemical reactions. DEPARTMENT OF CHEMISTRY
Cadmium Reduction Method Method to 30.0 mg/l NO 3 N (HR) Powder Pillows or AccuVac Ampuls
 Powder Pillows or AccuVac Ampuls") Nitrate DOC316.53.01066 Cadmium Reduction Method Method 8039 0.3 to 30.0 mg/l NO 3 N (HR) Powder Pillows or AccuVac Ampuls Scope and application: For water, wastewater and seawater. Test preparation Instrument-specific
Nitrate DOC316.53.01066 Cadmium Reduction Method Method 8039 0.3 to 30.0 mg/l NO 3 N (HR) Powder Pillows or AccuVac Ampuls Scope and application: For water, wastewater and seawater. Test preparation Instrument-specific
Standard Operating Procedure
 Standard Operating Procedure A Standard Operating Procedure (SOP) is a written set of instructions that document how to safely perform work involving hazardous materials or hazardous operations. SOPs may
MOF-76: From Luminescent Probe to Highly Efficient U VI Sorption Material
 MOF-76: From Luminescent Probe to Highly Efficient U VI Sorption Material Weiting Yang, a Zhi-Qiang Bai, b Wei-Qun Shi*, b Li-Yong Yuan, b Tao Tian, a Zhi-Fang Chai*, c Hao Wang, a and Zhong-Ming Sun*
Standard Operating Procedure
 Standard Operating Procedure Procedure Radioimmunoassay with I Department Location SOP Prepared By: Section 1: Purpose Radioimmunoassays are used for detecting the concentration of a specific antigen or
Density of Aqueous Sodium Chloride Solutions
 Experiment 3 Density of Aqueous Sodium Chloride Solutions Prepared by Ross S. Nord and Stephen E. Schullery, Eastern Michigan University PURPOSE Determine the concentration of an unknown sodium chloride
Instrument Sample cell orientation Sample cell DR 6000 DR 3800 DR 2800 DR 2700 DR 1900 DR 5000 DR The fill line is to the right.
 Aluminum DOC316.53.01003 Eriochrome Cyanine R Method 1 Method 8326 0.006 to 0.250 mg/l Al 3+ Powder Pillows Scope and application: For water. 1 Adapted from Standard Methods for the Examination of Water
Chapter X: Radiation Safety Audit Program
 Chapter X: Radiation Safety Audit Program Policy All laboratories using radioactive material shall be reviewed as required by the Illinois Emergency Management Agency (IEMA), Division of Nuclear Safety
ALLOWAY METHOD OUTLINE
 ALLOWAY METHOD OUTLINE Standard Laboratory Method SM4500-Cl -G Parameter Residual Chlorine & Free Chlorine Method DPD Colorimetric Test Kit Date Issued Originator: Section Supervisor: QA Manager Date:
DRAIN TRACING DYE RED E123
 DRAIN TRACING DYE RED E123 1.1 Product Identifier Product Name CAS No. EC No. DRAIN TRACING DYE RED E123 915-67-3 213-022-2 1.2. Relevant identified uses of the substance or mixture and uses advised against
HAZARD COMMUNICATION SAFETY PROGRAM
 Hazard Communication Program HAZARD COMMUNICATION SAFETY PROGRAM 1. Purpose. To provide an effective, written hazard communication program in compliance with company, State and Federal regulatory requirements.
Effect of Process Parameters on Adsorption of Methylene Blue from Synthetic Effluent Using Jack Fruit Seed Powder
 Effect of Process Parameters on Adsorption of Methylene Blue from Synthetic Effluent Using Jack Fruit Seed Powder Anoop Raj J R Anil K Das Aishwarya B S Sruthi Suresh Abstract- Batch sorption experiments
STANDARD OPERATING PROCEDURE No. 52 STATIC ACID GENERATION (NAG) TEST
 TEST") Questa Rock Pile Stability Study SOP 52v6 Page 1 STANDARD OPERATING PROCEDURE No. 52 STATIC ACID GENERATION (NAG) TEST REVISION LOG Revision Number Description Date 52v0 Original SOP by STM 6/9/2004 52v1
Questa Rock Pile Stability Study SOP 52v6 Page 1 STANDARD OPERATING PROCEDURE No. 52 STATIC ACID GENERATION (NAG) TEST REVISION LOG Revision Number Description Date 52v0 Original SOP by STM 6/9/2004 52v1
Laboratory Safety and Fundamental Equipment Post-Assessment Exam Page 1 of 9
 Exam Page 1 of 9 1. Chemical Hygiene Plans are required by. a. Environmental Protection Agency (EPA) b. US Department of Transportation (DOT) c. Nuclear Regulatory Commission (NRC) d. Occupational Safety
FerroZine Method 1 Method to 100 µg/l Fe (10-cm cell) Reagent Solution. Instrument Adapter Sample cell DR 6000 LZV
 Reagent Solution. Instrument Adapter Sample cell DR 6000 LZV") Iron, Total DOC316.53.01338 FerroZine Method 1 Method 10264 1 to 100 µg/l Fe (10-cm cell) Reagent Solution Scope and application: For ultrapure water. 1 Adapted from Stookey, L.L., Anal. Chem., 42(7),
Iron, Total DOC316.53.01338 FerroZine Method 1 Method 10264 1 to 100 µg/l Fe (10-cm cell) Reagent Solution Scope and application: For ultrapure water. 1 Adapted from Stookey, L.L., Anal. Chem., 42(7),
Shown below is a sample titration curve for a diprotic acid. Note the two equivalence points.
 EXPERIMENT 9 Titration Curve for a Polyprotic Acid INTRODUCTION Other than by strength and concentration, another way of classifying acids involves the number of H + ions an acid can donate. A monoprotic
1. The Supervisor and/or the Section Safety Officer must be notified of all accidents and injuries which may occur within the section.
 SECTION 02 SAFE WORK PRACTICES The following safe work practices are adopted from the Chemical Hygiene Plan in effect within the laboratory. Analyst should be familiar with the procedures when mixing,
Cadmium Reduction Method Method to 0.50 mg/l NO 3 N (LR) Powder Pillows
 Powder Pillows") Nitrate DOC316.53.01067 Cadmium Reduction Method Method 8192 0.01 to 0.50 mg/l NO 3 N (LR) Powder Pillows Scope and application: For water, wastewater and seawater. Test preparation Instrument-specific
Nitrate DOC316.53.01067 Cadmium Reduction Method Method 8192 0.01 to 0.50 mg/l NO 3 N (LR) Powder Pillows Scope and application: For water, wastewater and seawater. Test preparation Instrument-specific
ASTM Designation: D Standard Test Method for Determination of Iodine Number of Activated Carbon
 ASTM Designation: D4607-94 Standard Test Method for Determination of Iodine Number of Activated Carbon 1. Scope 1.1 This test method covers the determination of the relative activation level of unused
CIVIL & ENVIRONMENTAL ENGINEERING 5610/6610 WATER CHEMISTRY AND LABORATORY ANALYSIS UNIVERSITY OF UTAH FALL SEMESTER 2005
 CIVIL & ENVIRONMENTAL ENGINEERING 5610/6610 WATER CHEMISTRY AND LABORATORY ANALYSIS UNIVERSITY OF UTAH FALL SEMESTER 2005 INSTRUCTOR: Dr. P.K. Andy Hong Office: 216 EMRO; 1-7232 Email: hong@civil.utah.edu
Experiment 7. Determining the Rate Law and Activation Energy for the Reaction of Crystal Violet with Hydroxide Ion
 Experiment 7. Determining the Rate Law and Activation Energy for the Reaction of Introduction In this experiment, you will observe the reaction between crystal violet and sodium hydroxide. Crystal violet
Method for estimation of iodine in urine
 Method for estimation of iodine in urine Described herewith is the standard operating procedure for estimation of iodine in urine by colorimetric method after chloric acid digestion A) Principle: Urine
Measuring Enthalpy Changes
 Measuring Enthalpy Changes PURPOSE To observe changes in enthalpy in chemical processes. GOALS To identify exothermic and endothermic processes. To relate enthalpy changes and entropy changes to changes
7-A. Inquiry INVESTIGATION. 322 MHR Unit 3 Quantities in Chemical Reactions. Skill Check. Safety Precautions
 Inquiry INVESTIGATION 7-A Skill Check Initiating and Planning Performing and Recording Analyzing and Interpreting Communicating Safety Precautions Wear safety eyewear throughout this investigation. Wear
Treatment of a Selected Refinery Wastewater Compound (Benzene) by Chitin and Chitosan by Dr Maryam Mohamed
 by Chitin and Chitosan by Dr Maryam Mohamed") Treatment of a Selected Refinery Wastewater Compound (Benzene) by Chitin and Chitosan by Dr Maryam Mohamed Outline Introduction - Benzene - Treatment Methods for VOCs - Treatment Techniques of Oil Refinery
Treatment of a Selected Refinery Wastewater Compound (Benzene) by Chitin and Chitosan by Dr Maryam Mohamed Outline Introduction - Benzene - Treatment Methods for VOCs - Treatment Techniques of Oil Refinery
ANALYSIS OF DISTILLATION FLASK EXPLOSION AT X LABORATORY, FACULTY OF ABC YZ UNIVERSITY ZULKIFLI DJUNAIDI
 ANALYSIS OF DISTILLATION FLASK EXPLOSION AT X LABORATORY, FACULTY OF ABC YZ UNIVERSITY ZULKIFLI DJUNAIDI Presented at The 2 nd Asian Conference on Safety and Education in Laboratory December 2 nd, 2015
Periodicity of Properties of Oxides
 Microscale Periodicity of Properties of Oxides Some oxides produce acidic solutions when they dissolve in water. These oxides are classified as acidic oxides (acid anhydrides), and they are the primary
Safety and Rules of the Lab
 Safety and Rules of the Lab 1 Lab Safety Rules Part of this PowerPoint has been taken from the power point of. Tim Baker, Adam Kueltzo, and Todd Katz.former NCHS students And from Lyndon B. Johnson High
Removal of Copper (II) from Aqueous Solutions using Chalk Powder
 from Aqueous Solutions using Chalk Powder") Est. 1984 ORIENTAL JOURNAL OF CHEMISTRY An International Open Free Access, Peer Reviewed Research Journal www.orientjchem.org ISSN: 0970-020 X CODEN: OJCHEG 2013, Vol. 29, No. (2): Pg. 713-717 Removal
Est. 1984 ORIENTAL JOURNAL OF CHEMISTRY An International Open Free Access, Peer Reviewed Research Journal www.orientjchem.org ISSN: 0970-020 X CODEN: OJCHEG 2013, Vol. 29, No. (2): Pg. 713-717 Removal
LABORATORY CHEMICAL HYGIENE PLAN
 Page 1 LABORATORY CHEMICAL HYGIENE PLAN What is not a poison? All things are poison and nothing is without poison. It is the dose only that makes a thing not a poison - Paracelsus (15 th Century) As part
Year 10 Science CHEMISTRY Experimental research report on reaction rates
 Year 10 Science CHEMISTRY Experimental research report on reaction rates The speed at which chemical reactions occur varies. Some reactions occur within a fraction of a second, while others may take days
Responsibilities: Effective Date: November Revision Date: February 8, VP, Facilities and Construction Management. Issuing Authority:
 Title: Chemical Hygiene Written Program Effective Date: November 2005 Revision Date: February 8, 2017 Issuing Authority: Responsible Officer: VP, Facilities and Construction Management Director Environmental
Oxygen Demand, Chemical
 Oxygen Demand, Chemical DOC316.53.01103 USEPA Reactor Digestion Method Method 10211 1 to 60 mg/l COD (ULR) TNTplus 820 Scope and application: For wastewater, process water, surface water, and cooling water.
Lab Safety Rules GENERAL GUIDELINES. 1. Conduct yourself in a responsible manner at all times in the laboratory.
 Lab Safety Rules GENERAL GUIDELINES 1. Conduct yourself in a responsible manner at all times in the laboratory. 2. Follow all written and verbal instructions carefully. If you do not understand a direction
Name Period Date. Lab 9: Analysis of Commercial Bleach
 Name Period Date Lab 9: Analysis of Commercial Bleach Introduction Many common products are effective because they contain oxidizing agents. Some products, which contain oxidizing agents, are bleaches,
GETTING THE END POINT TO APPROXIMATE. Two hours
 Chem 1312 Handout Experiment ONE Laboratory Time Required Special Equipment and Supplies Objective Safety First Aid GETTING THE END POINT TO APPROXIMATE THE EQUIVALENCE POINT Two hours Balance Potassium
ENTHALPY OF FORMATION OF MgO
 ENTHALPY OF FORMATION OF MgO ELECTRONIC LABORATORY NOTEBOOK (ELN) INSTRUCTIONS All work for this experiment must be recorded, attached, or answered in the ELN. Create a pre & inlab page in the Experiment
MSDS. ( Material Safety Data Sheet ) High Density Polyethylene (LUTENE-H ME9180)
 High Density Polyethylene (LUTENE-H ME9180)") MSDS LG Chemical Limited LG Twin Tower/ East Wing, 20, Yoido-dong, Youngdungpo-gu Seoul, 150-721 Korea Tel : 822-3773-3060 Fax : 822-784-9731 ( Material Safety Sheet ) (LUTENE-H ME9180) Issue Item Page
MSDS LG Chemical Limited LG Twin Tower/ East Wing, 20, Yoido-dong, Youngdungpo-gu Seoul, 150-721 Korea Tel : 822-3773-3060 Fax : 822-784-9731 ( Material Safety Sheet ) (LUTENE-H ME9180) Issue Item Page
APPLICATION FOR AUTHORIZATION
 INSTRUCTIONS: This form is intended to be a template for completion by the applicant, followed by subsequent review by the Radiation Safety Officer, and then the Radiation Safety Committee. Please fill
Ascorbic Acid Titration of Vitamin C Tablets
 Ascorbic Acid Titration of Vitamin C Tablets Introduction This experiment illustrates how titration, the process of slowly adding one solution to another until the reaction between the two is complete,
PRELIMINARY ACTIVITY FOR
 PRELIMINARY ACTIVITY FOR Beer s Law Investigations Guided Inquiry Version Experiment 11 The primary objective of this Preliminary Activity is to determine the concentration of an unknown copper (II) sulfate
ANALYSIS Safety Information for the University of California, Berkeley JOB WASTE RADIOACTIVE SAMPLING LIQUID EALTH & SAFETY R TASK HAZARDS CONTROLS
 This template is a Microsoft Word table use MS Word s online Help feature for instructions about how to add text and format tables. JOB SAFETY ANALYSIS Safety Information for the University of California,
Cadmium Reduction Method Method to 10.0 mg/l NO 3 N (MR, spectrophotometers) 0.2 to 5.0 mg/l NO 3 N (MR, colorimeters)
 0.2 to 5.0 mg/l NO 3 N (MR, colorimeters)") Nitrate, MR DOC316.53.01069 Cadmium Reduction Method Method 8171 0.1 to 10.0 mg/l NO 3 N (MR, spectrophotometers) 0.2 to 5.0 mg/l NO 3 N (MR, colorimeters) Scope and application: For water, wastewater
Nitrate, MR DOC316.53.01069 Cadmium Reduction Method Method 8171 0.1 to 10.0 mg/l NO 3 N (MR, spectrophotometers) 0.2 to 5.0 mg/l NO 3 N (MR, colorimeters) Scope and application: For water, wastewater
Scope and application: For water, wastewater and seawater. Distillation is required for wastewater and seawater.
 Nitrogen, Ammonia DOC316.53.01078 USEPA 1 Nessler Method 2 Method 8038 0.02 to 2.50 mg/l NH 3 N Reagent Solution Scope and application: For water, wastewater and seawater. Distillation is required for
Chemical Bonds. MATERIALS 24-well microplate calcium chloride candle citric acid conductivity tester ethanol gloves iron ring lab apron
 Microscale Chemical Bonds Chemical compounds are combinations of atoms held together by chemical bonds. These chemical bonds are of two basic types ionic and covalent. Ionic bonds result when one or more
Application of Fe 2 O 3 nanoparticles in Heavy Metal Removal
 Application of Fe 2 O 3 nanoparticles in Heavy Metal Removal 5.1 Introduction Different contaminants are released to water bodies due to the rapid industrialization of human society, including heavy metal
Kinetics of Crystal Violet Fading AP Chemistry Big Idea 4, Investigation 11 An Advanced Inquiry Lab (adapted by Flinn Scientific, Inc.
 Introduction Kinetics of Crystal Violet Fading AP Chemistry Big Idea 4, Investigation 11 An Advanced Inquiry Lab (adapted by Flinn Scientific, Inc.) Crystal violet is a common, beautiful purple dye. In
MATERIAL SAFETY DATA SHEET
 MATERIAL SAFETY DATA SHEET S E C T I O N 1 - I D E N T I F I C A T I O N O F P R O D U C T A N D C O M P A N Y Pfizer Inc Pfizer Animal Health 2 3 5 E a s t 4 2 n d S t r e e t N e w Y o r k, N Y 1 0 0
Determinations by Atomic Absorption Spectroscopy and Inductively Coupled Plasma-Atomic Emission
 0 chapter Sodium and Potassium Determinations by Atomic Absorption Spectroscopy and Inductively Coupled Plasma-Atomic Emission Spectroscopy 67 S. S. Nielsen (ed.), Food Analysis Laboratory Manual Springer
Oxygen Demand, Chemical
 Oxygen Demand, Chemical DOC316.53.01104 USEPA Reactor Digestion Method Method 10212 250 to 15,000 mg/l COD (UHR) TNTplus 823 Scope and application: For wastewater and process waters; digestion is required.
Laboratory Chemical Safety. Pathology Training
 Laboratory Chemical Safety Pathology Training Objectives Explain the OSHA standard for chemical safety as it relates to laboratory workers Explain Chemical labeling requirements Explain the NFPA diamond
Mercuric Thiocyanate Method Method to 25.0 mg/l Cl Reagent Solution
 Chloride DOC316.53.01017 Mercuric Thiocyanate Method Method 8113 0.1 to 25.0 mg/l Cl Reagent Solution Scope and application: For water and wastewater. Test preparation Instrument-specific information Table
Aspirin Lab By Maya Parks Partner: Ben Seufert 6/5/15, 6/8/15
 Aspirin Lab By Maya Parks Partner: Ben Seufert 6/5/15, 6/8/15 Abstract: This lab was performed to synthesize acetyl salicylic acid or aspirin from a carboxylic acid and an alcohol. We had learned in class
Adsorption of Humic acid on Powdered Activated Carbon (PAC)
") Adsorption of Humic acid on Powdered Activated Carbon (PAC) Department of Civil and Environmental Engineering, MSU, East Lansing, MI, 48824, USA Abstract Removal capacity and rate of Humic Acid (HA) onto
Adsorption of Humic acid on Powdered Activated Carbon (PAC) Department of Civil and Environmental Engineering, MSU, East Lansing, MI, 48824, USA Abstract Removal capacity and rate of Humic Acid (HA) onto
Tetraphenylborate Method Method to 7.0 mg/l K Powder Pillows
 Potassium DOC316.53.01127 Tetraphenylborate Method Method 8049 0.1 to 7.0 mg/l K Powder Pillows Scope and application: For water, wastewater and seawater. Test preparation Instrument-specific information
Skill Building Activity 2 Determining the Concentration of a Species using a Vernier Spectrometer
 Skill Building Activity 2 Determining the Concentration of a Species using a Vernier Spectrometer Purpose To use spectroscopy to prepare a Beer s Law plot of known dilutions of copper(ii) sulfate so that
Environment Department CoSHH Assessment Form
 Environment Department CoSHH Assessment Form This document should be completed electronically or in handwritten block capitals and by consulting current Safety Data Sheets (SDS). Completed forms should
17 th Chemistry Olympiad of the Baltic States
 17 th Chemistry Olympiad of the Baltic States Riga, Latvia, 2009 Practical examination Introduction General information Keep your safety or optical glasses on, while working in laboratory. Fill pipettes